Still Missing Dark Matter: KCWI High-Resolution Stellar Kinematics of NGC1052-DF2
Abstract
The velocity dispersion of the ultra diffuse galaxy NGC1052-DF2 was found to be km s-1, much lower than expected from the stellar mass – halo mass relation and nearly identical to the expected value from the stellar mass alone. This result was based on the radial velocities of ten luminous globular clusters that were assumed to be associated with the galaxy. A more precise measurement is possible from high resolution spectroscopy of the diffuse stellar light. Here we present an integrated spectrum of the diffuse light of NGC1052-DF2 obtained with the Keck Cosmic Web Imager, with an instrumental resolution of km s-1. The systemic velocity of the galaxy is km s-1, in very good agreement with the average velocity of the globular clusters ( km s-1). There is no evidence for rotation within the KCWI field of view. We find a stellar velocity dispersion of km s-1, consistent with the dispersion that was derived from the globular clusters. The implied dynamical mass within the half-light radius kpc is M⊙, similar to the stellar mass within that radius (). With this confirmation of the low velocity dispersion of NGC1052-DF2, the most urgent question is whether this “missing dark matter problem” is unique to this galaxy or applies more widely.
1 Introduction
A remarkable result of the past twenty years is the apparent regularity of galaxy formation as reflected in the existence of a well-defined relation between galaxy and halo mass with small scatter, the stellar mass – halo mass relation (Mandelbaum et al. 2006, Moster et al. 2010, Behroozi et al. 2010, Wechsler & Tinker 2018). The scatter in this relation constrains the possible evolutionary histories of galaxies, and has been measured fairly well at high masses (Vale & Ostriker 2004, Gu et al. 2016). However, this scatter is relatively unconstrained at low masses, in the regime where galaxy formation is thought to be less efficient. Measuring or constraining the halo masses of low mass galaxies therefore provides important information on the scatter in the stellar mass – halo mass relation and on the question whether galaxy formation is less regulated, or even stochastic, at low masses.
There is a rich literature on halo mass measurements of low mass galaxies ( or lower) in the Local Group (e.g., Aaronson 1983, Geha et al. 2009, Martin et al. 2016, Torrealba et al. 2018). These studies use the velocities of individual stars to infer the kinematics, the mass density profile, and the halo mass. Other studies focus on gas-rich dwarf galaxies within a few Mpc, inferring the halo mass from H and/or H i rotation curves (de Blok et al. 2001, van den Bosch & Swaters 2001, Oman et al. 2016). There seems to be considerable scatter in the halo mass in this stellar mass regime, although this may partly reflect uncertainties in inclination (see Oman et al. 2016) and variation in the inner density profiles of halos rather than in total halo masses.
Outside the Local Group, much less is known about the variation in the stellar mass – halo mass relation. The recently identified population of ultra diffuse galaxies (UDGs; van Dokkum et al. 2015) holds the promise of new constraints, as their large spatial extent and often significant globular cluster populations provide probes on spatial scales where dark matter should dominate the kinematics. Using the velocities of globular clusters (Beasley et al. 2016, Toloba et al. 2018) and stellar velocity dispersions (van Dokkum et al. 2016), UDGs are gradually adding to the sample of low mass galaxies with constraints on their dark matter content beyond the Local Group.
Recently, a relatively nearby UDG at , NGC1052-DF2, was inferred to have little or no dark matter, deviating by an unprecedented amount from the expected ratio. The constraints on the NGC1052-DF2 halo mass were derived by measuring the velocities of ten globular clusters that were assumed to be associated with the galaxy itself. The velocity dispersion of the 10 clusters is km s-1(van Dokkum et al. 2018a). Due to the small number of tracers, the results have a large random uncertainty (see also Martin et al. 2018), may suffer from small sample bias in the likelihood estimator (see Laporte et al. 2018), and are sensitive to systematic errors in individual measurements (as demonstrated by the cluster GC-98; see van Dokkum et al. 2018a).
A more precise way of constraining the kinematics is by measuring the stellar velocity dispersion of the galaxy. This is challenging because of the low surface brightness of NGC1052-DF2 and because a relatively high spectral resolution is required. The observed broadening of spectral features is ; because of this quadratic behavior a spectral resolution km s-1 is required. This is now possible with the Keck Cosmic Web Imager (KCWI), a new instrument on the Keck II telescope that is optimized for precision sky limited spectroscopy of low surface brightness phenomena at relatively high spectral resolution.
2 Observations and Data Reduction
2.1 KCWI Spectroscopy
We obtained IFU spectroscopy of NGC1052-DF2 on 2018 October 11 with the Keck Cosmic Web Imager (KCWI, Morrissey et al. 2012, Morrissey et al. 2018) on Keck II. The highest resolution KCWI configuration was chosen where the spectra are still (nearly) sky limited. The medium slicer was used with the BH3 grating, for a field of view of . The central wavelength was set to Å. The spectral resolution, as measured from arc lamps, ranges from km s-1at Å () to km s-1at Å ().
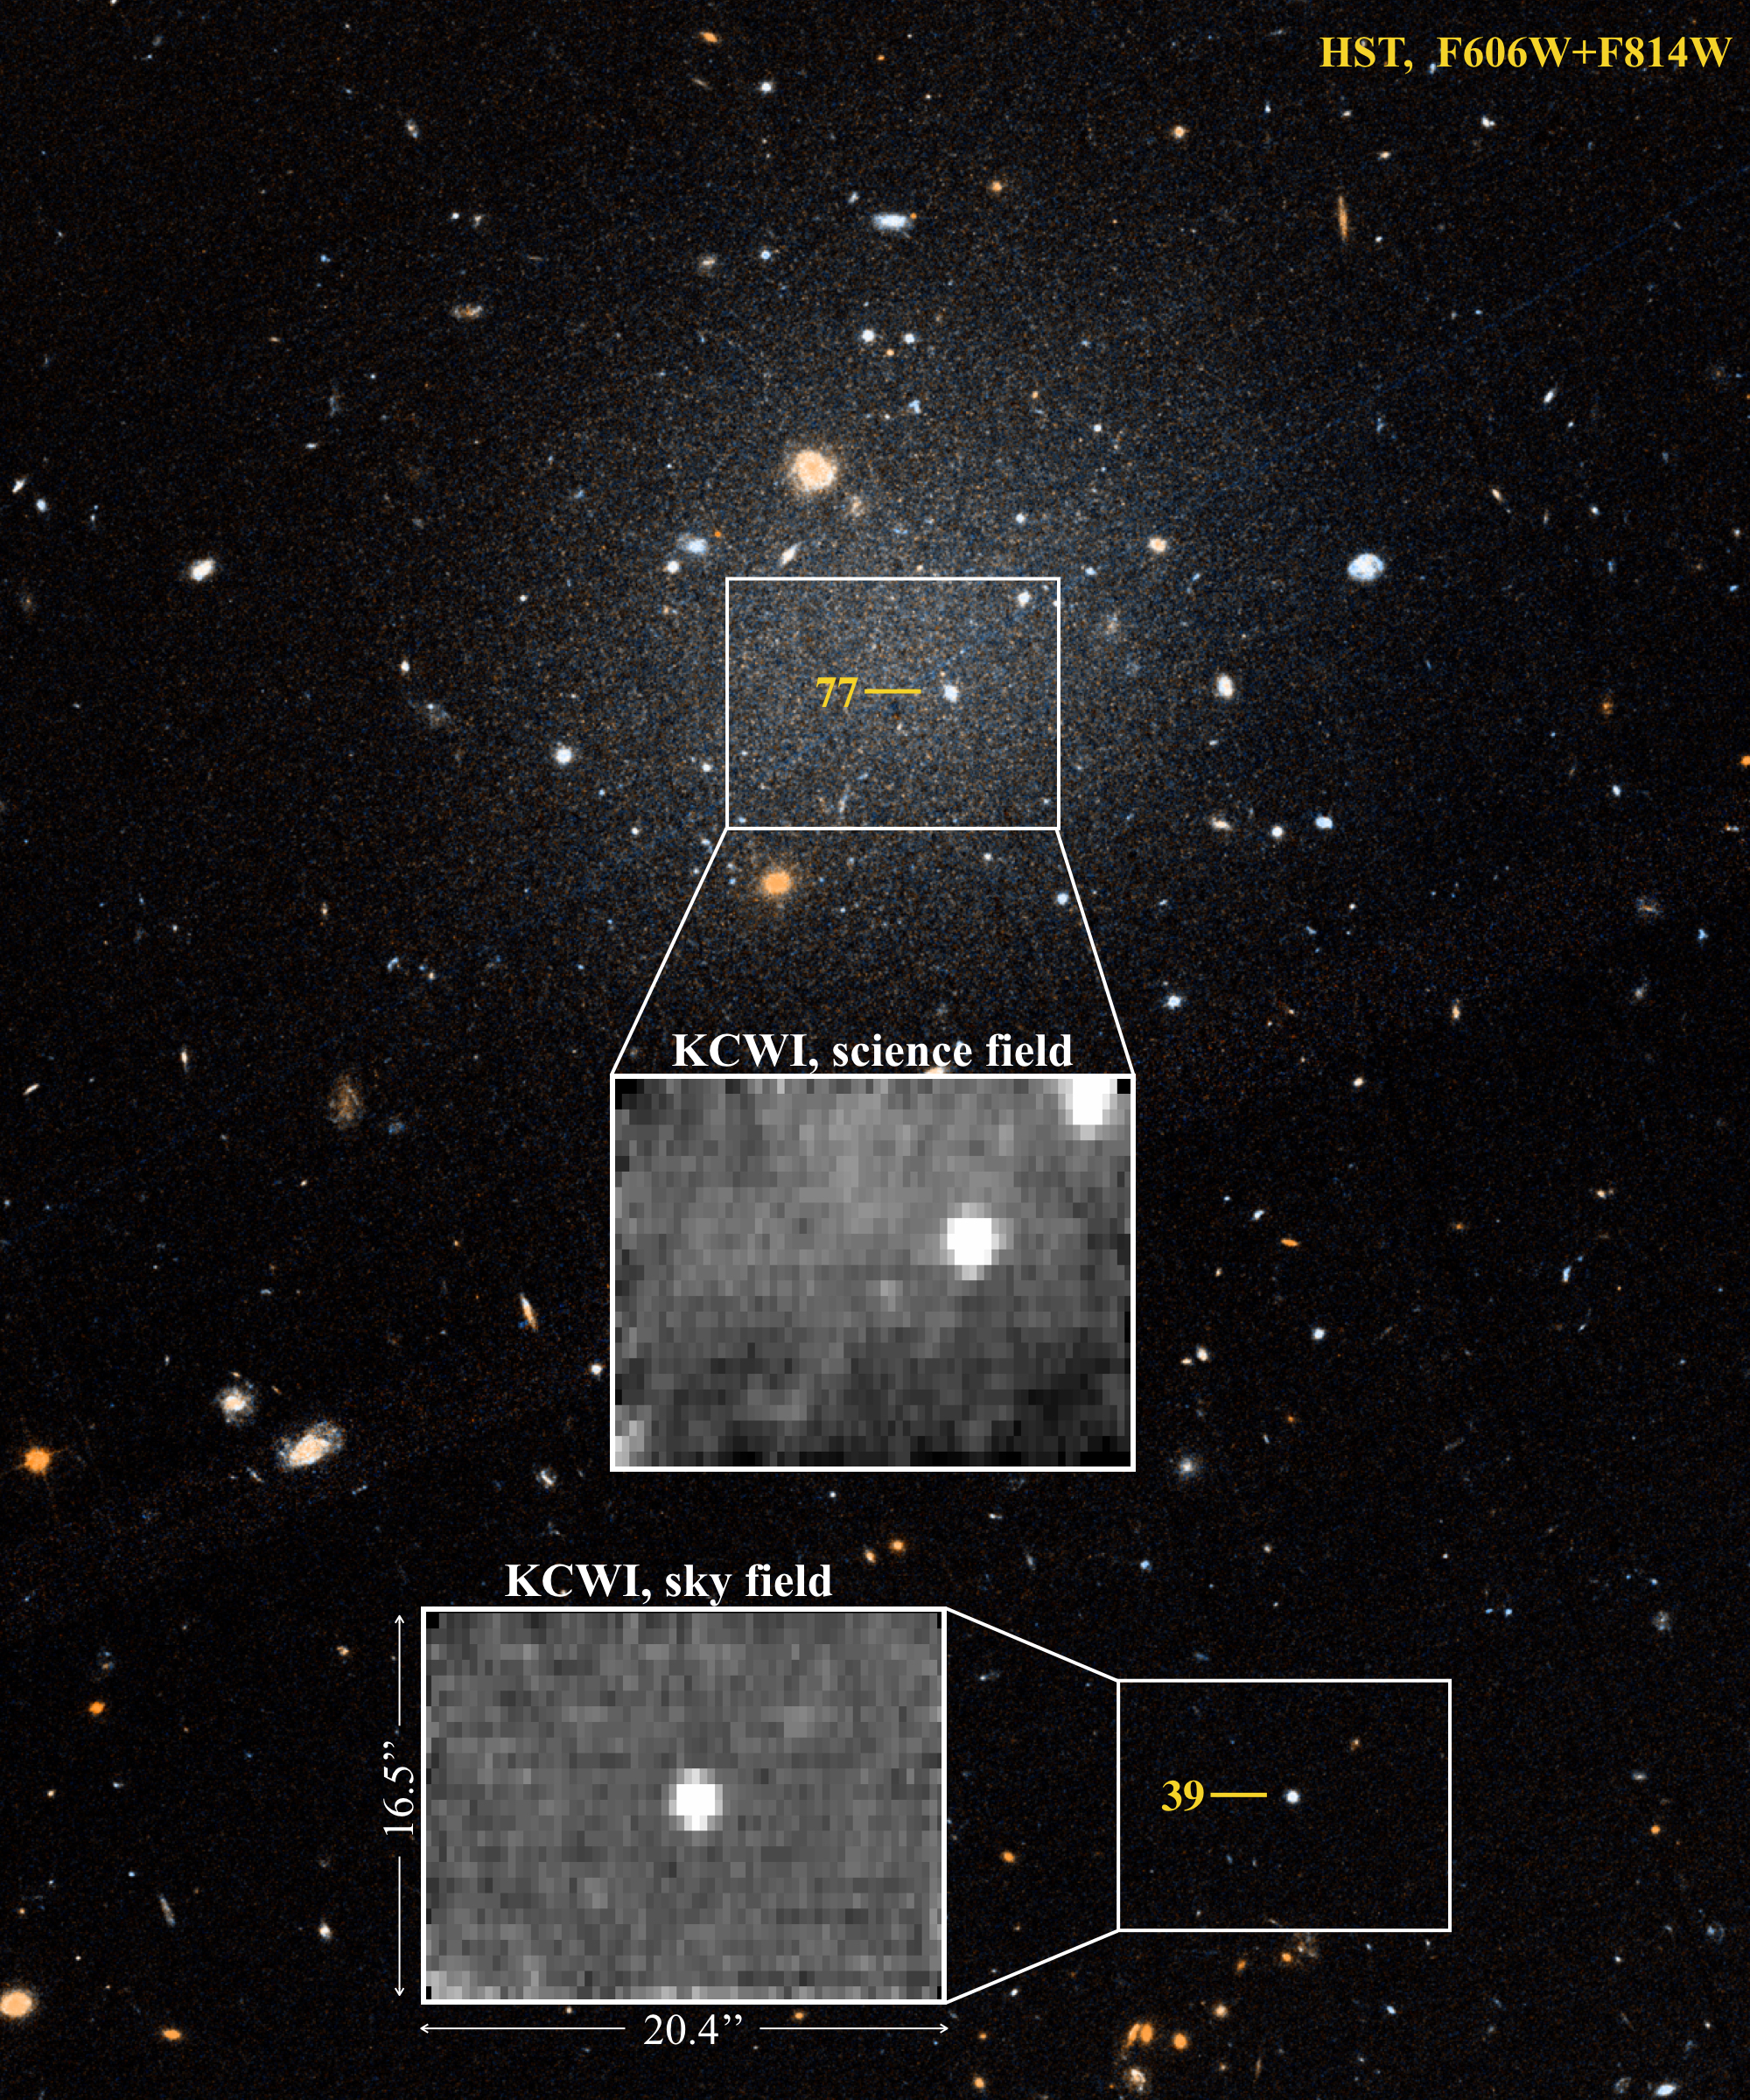
NGC1052-DF2 is larger than the KCWI field of view, which means that offset exposures have to be used to characterize the sky emission. In practice we alternated between two positions. In the first, “science” exposures were taken with the KCWI Field Of View (FOV) placed just south-west of the center of NGC1052-DF2, covering the stellar component of the galaxy out to as well as GC-77, the second-brightest globular cluster associated with the galaxy. In the second pointing, “sky” exposures were taken with the FOV placed on a field away, centered on the globular cluster GC-39. The globular cluster takes up only a small fraction of the KCWI area, and is masked in the sky analysis. The two pointings, along with stacked collapsed images of the science and sky exposures, are shown in Figure 1.
We obtained exposures of at each position, for a total of on the galaxy and on the offset field. The total science + sky time that is used in the analysis is 5.6 hrs. Conditions were somewhat variable, with thin cirrus present during most of the observations.
2.2 Reduction
The KCWI Data Extraction and Reduction Pipeline (KDERP), with default settings, is used to perform basic reduction and calibration of the data (Morrissey et al. 2018). Each of the 17 science and sky frames is treated independently. A combination of “bars” exposures, arc lamps, and the science data is used to derive distortion corrections and wavelength calibration solutions. The transformations are used to convert the 2D image into a 3D data cube, consisting of the slice number, the position along the slice, and wavelength. These data cubes, dubbed “ocubed” files by the KDERP, are used in the subsequent steps.
The sky background in the science exposures is determined from the offset sky exposures. The sky frames cannot be used directly as the sky spectrum changes significantly over the 20-minute interval between successive exposures. Instead, we model the variation in the sky spectrum with a principal component analysis (PCA). The method is introduced and explained in detail in van Dokkum et al. (2019). Briefly, 1D sky spectra are extracted from the nine offset exposures by averaging over the two spatial dimensions after masking GC-39 and serendipitous objects in the field. These nine spectra are analyzed with singular value decomposition using the scikit-learn package, with six components. These eigenspectra, along with the average of the nine spectra and an approximate model for the galaxy spectrum, are then fitted to 1D extractions of each of the eight science exposures. The 1D sky model for each science exposure is subtracted from each spatial pixel in the science data cube. We note that the model does not take possible spatial variation in the sky into account and is insensitive to offsets that are not correlated with specific sky emission or absorption features (see § 3).
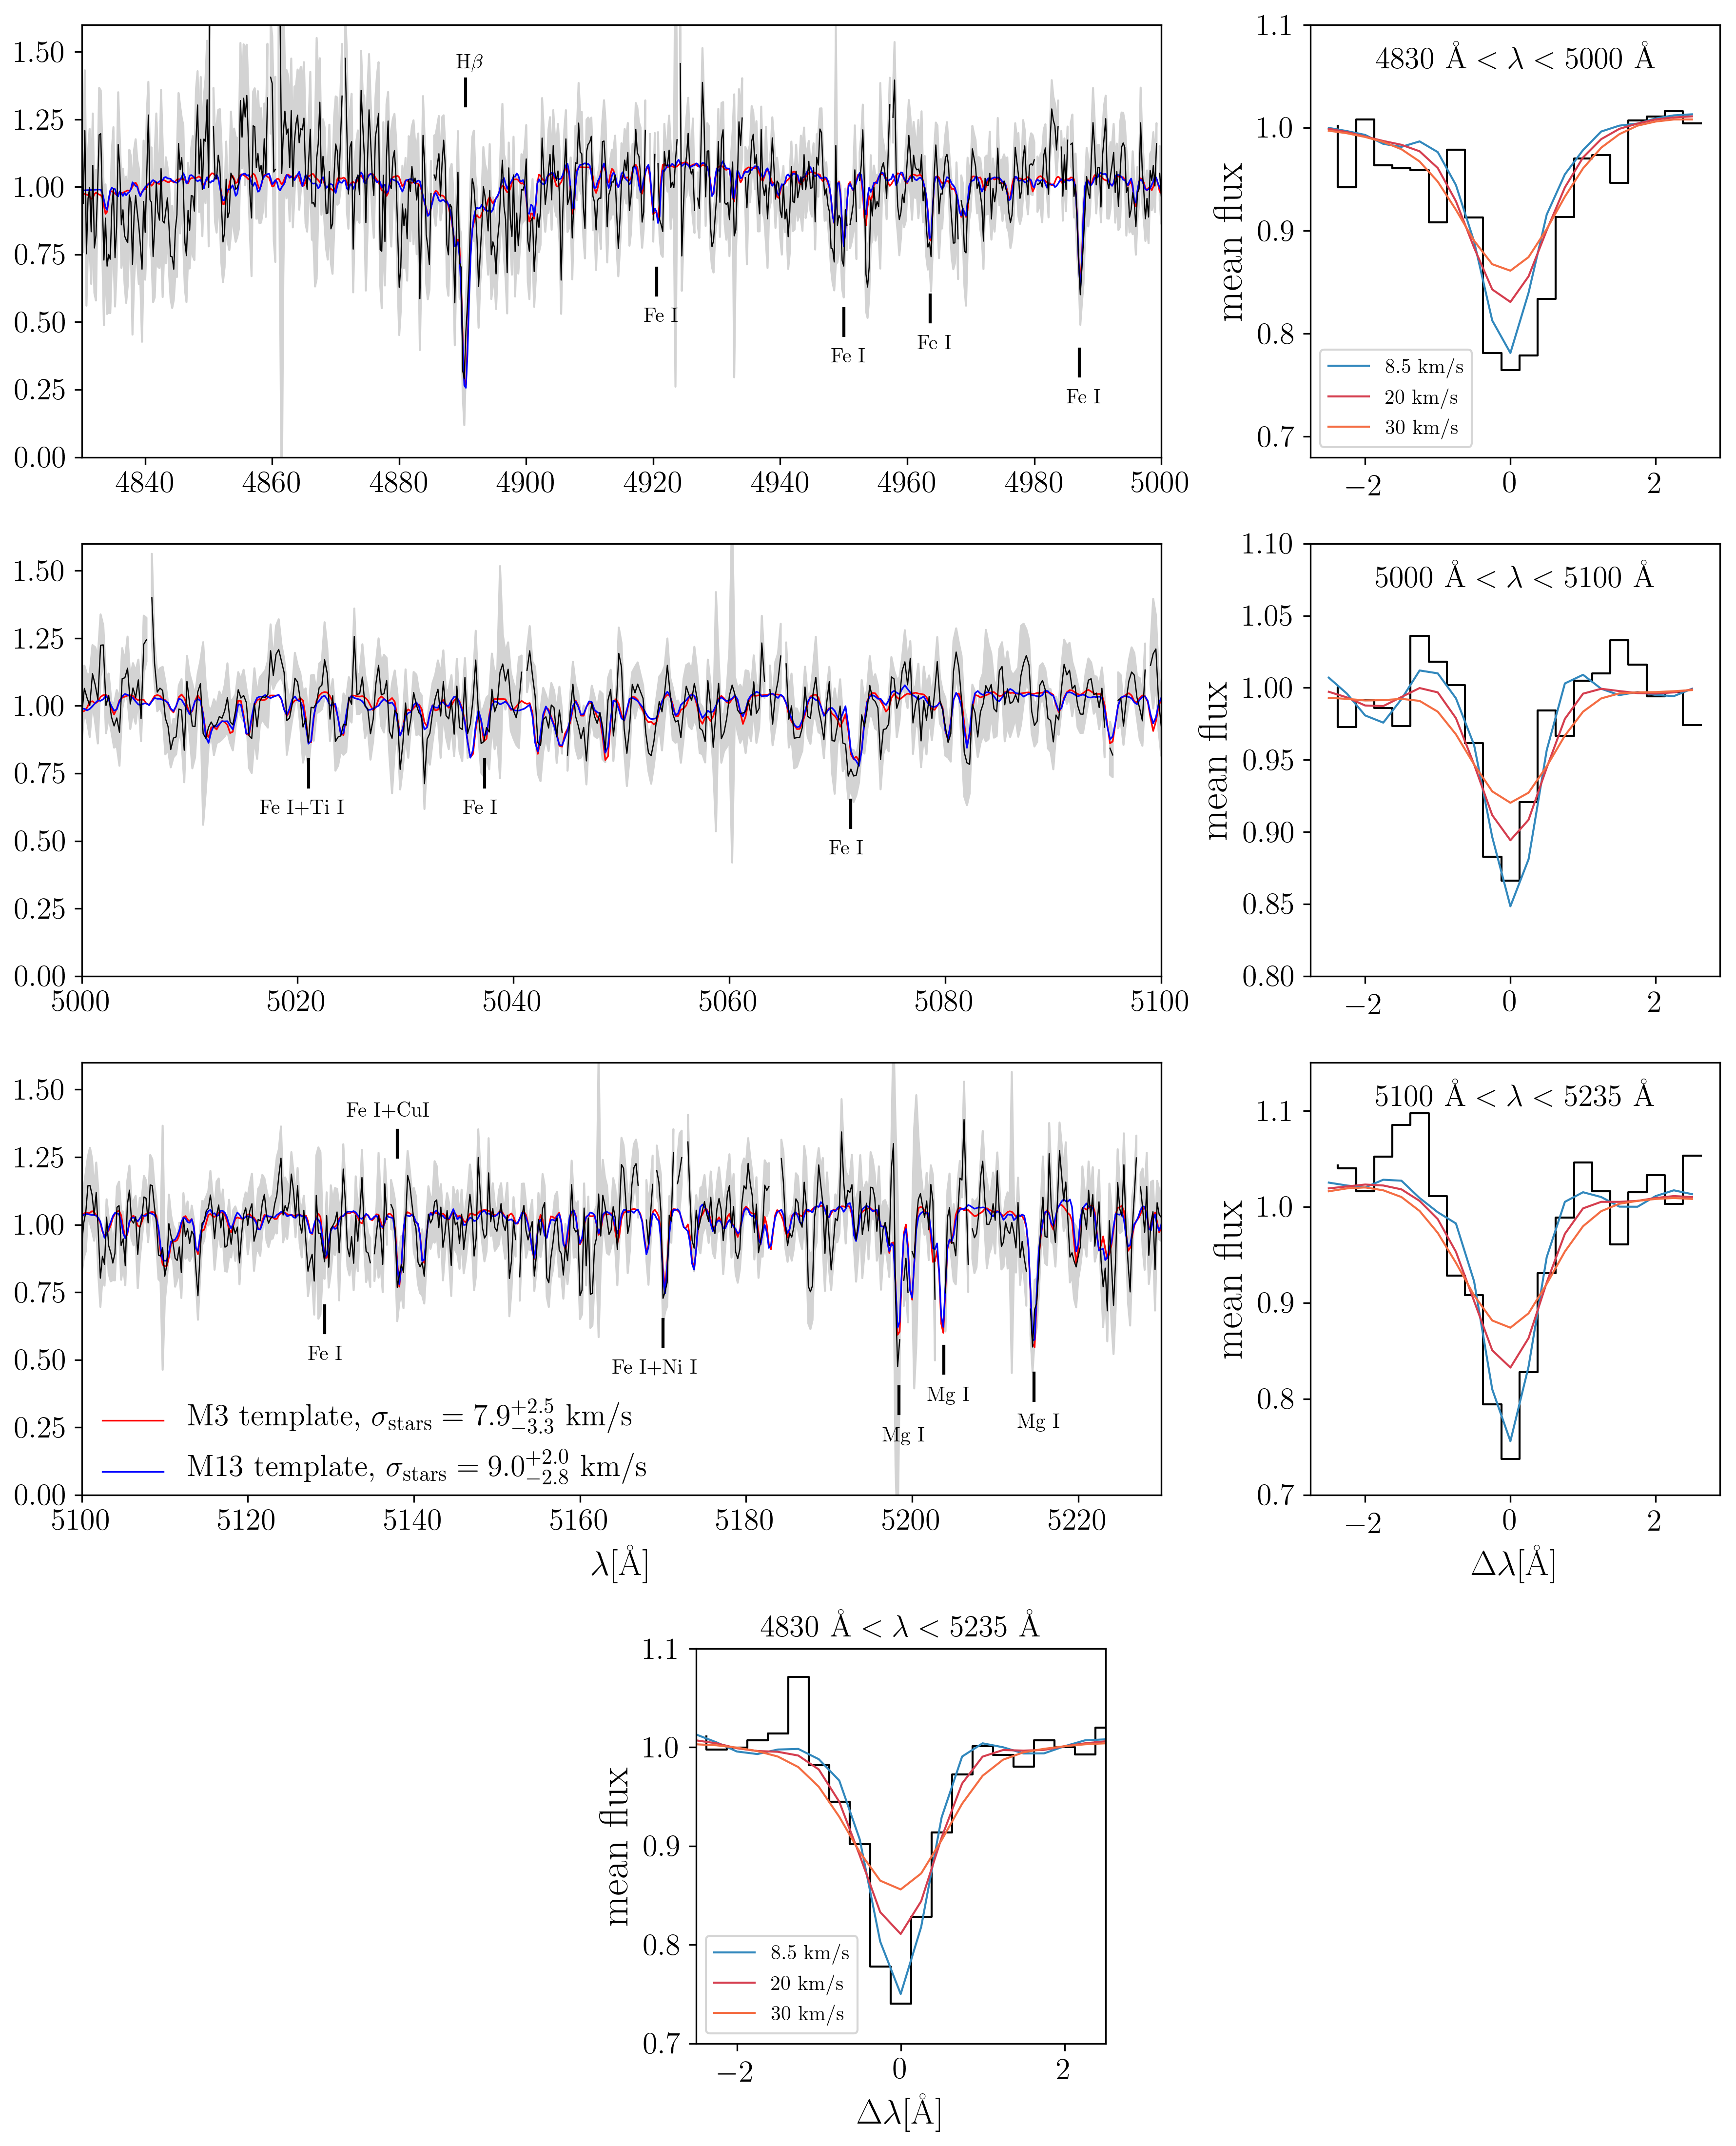
Finally, 1D combined spectra for different spatial regions are created by extracting them from the individual science cubes and averaging them with optimal weighting. In the combination step pixels that deviate from the median are not included in the average. Ten spatial regions are extracted: the sum over the entire field and nine rectangular regions in a grid (see § 3). The summed spectrum is shown in Figure 2; selected redshifted absorption lines are marked.
3 Kinematics
3.1 Empirical Templates
The stellar kinematics of NGC1052-DF2 are measured by fitting template spectra to the extracted 1D spectrum. Key requirements are that the resolution of the template is well characterized and that template mismatch is minimized. This is not easily accomplished, given the high resolution of our data ( km s-1at Å) and the low metallicity of the stellar population. We resolve these issues by using spatially-integrated spectra of old, metal poor Galactic globular clusters as templates, obtained with the same instrumental configuration.
The Galactic globular clusters M3 and M13 were observed on April 17, 2018. The metallicities of these clusters are (Harris 1996), slightly lower than the expected metallicity of NGC1052-DF2 based on its stellar mass and slightly higher than that based on its velocity dispersion (Kirby et al. 2013, Gu et al. 2018). The total integration time was 600 s on each cluster, and 600 s on a nearby sky field. The data reduction and spectral extraction followed the same procedures as described in § 2.2 for NGC1052-DF2; this ensures that any instrument-induced effects (such as small spatial variations in the wavelength calibration) are in common between the templates and the science data. The spectra are simple averages of the entire KCWI field, with individual stars contributing at most a few percent. We verified that the instrumental resolution, as measured from arc lamps, is consistent between the April globular clusters data and the October NGC1052-DF2 data.
3.2 Velocity Dispersion Measurement
The velocity dispersion was determined in the wavelength region 4830 Å 5235 Å, using the M3 and M13 templates. The fit was performed with an implementation of the emcee Markov Chain Monte Carlo sampler (Foreman-Mackey et al. 2013), with the redshift and velocity dispersion as free parameters (see van Dokkum et al., 2016). Besides a multiplicative polynomial we fit for a third-order additive polynomial, to account for both sky subtraction errors and template mismatch. Varying the order of this polynomial does not change the results significantly. When fitting the full spectral range we also fit for any subtle wavelength calibration mismatch between the template and the data, parameterized as an second-order polynomial with respect to the central wavelength. Although we find polynomial coefficients that are slightly different from zero, the resulting dispersion does not change when they are forced to zero. The best fitting models are shown in Figure 2 by the red and blue lines. The errors describe the differences between the data and the models well; the reduced values are 1.05 for the M3 template and 1.07 for the M13 template. The measured dispersion is the quadratic difference between the velocity dispersion of NGC1052-DF2 and that of the globular clusters. To obtain the stellar dispersion of NGC1052-DF2 we correct the measured values:
| (1) |
with km s-1 and km s-1(Harris 1996).
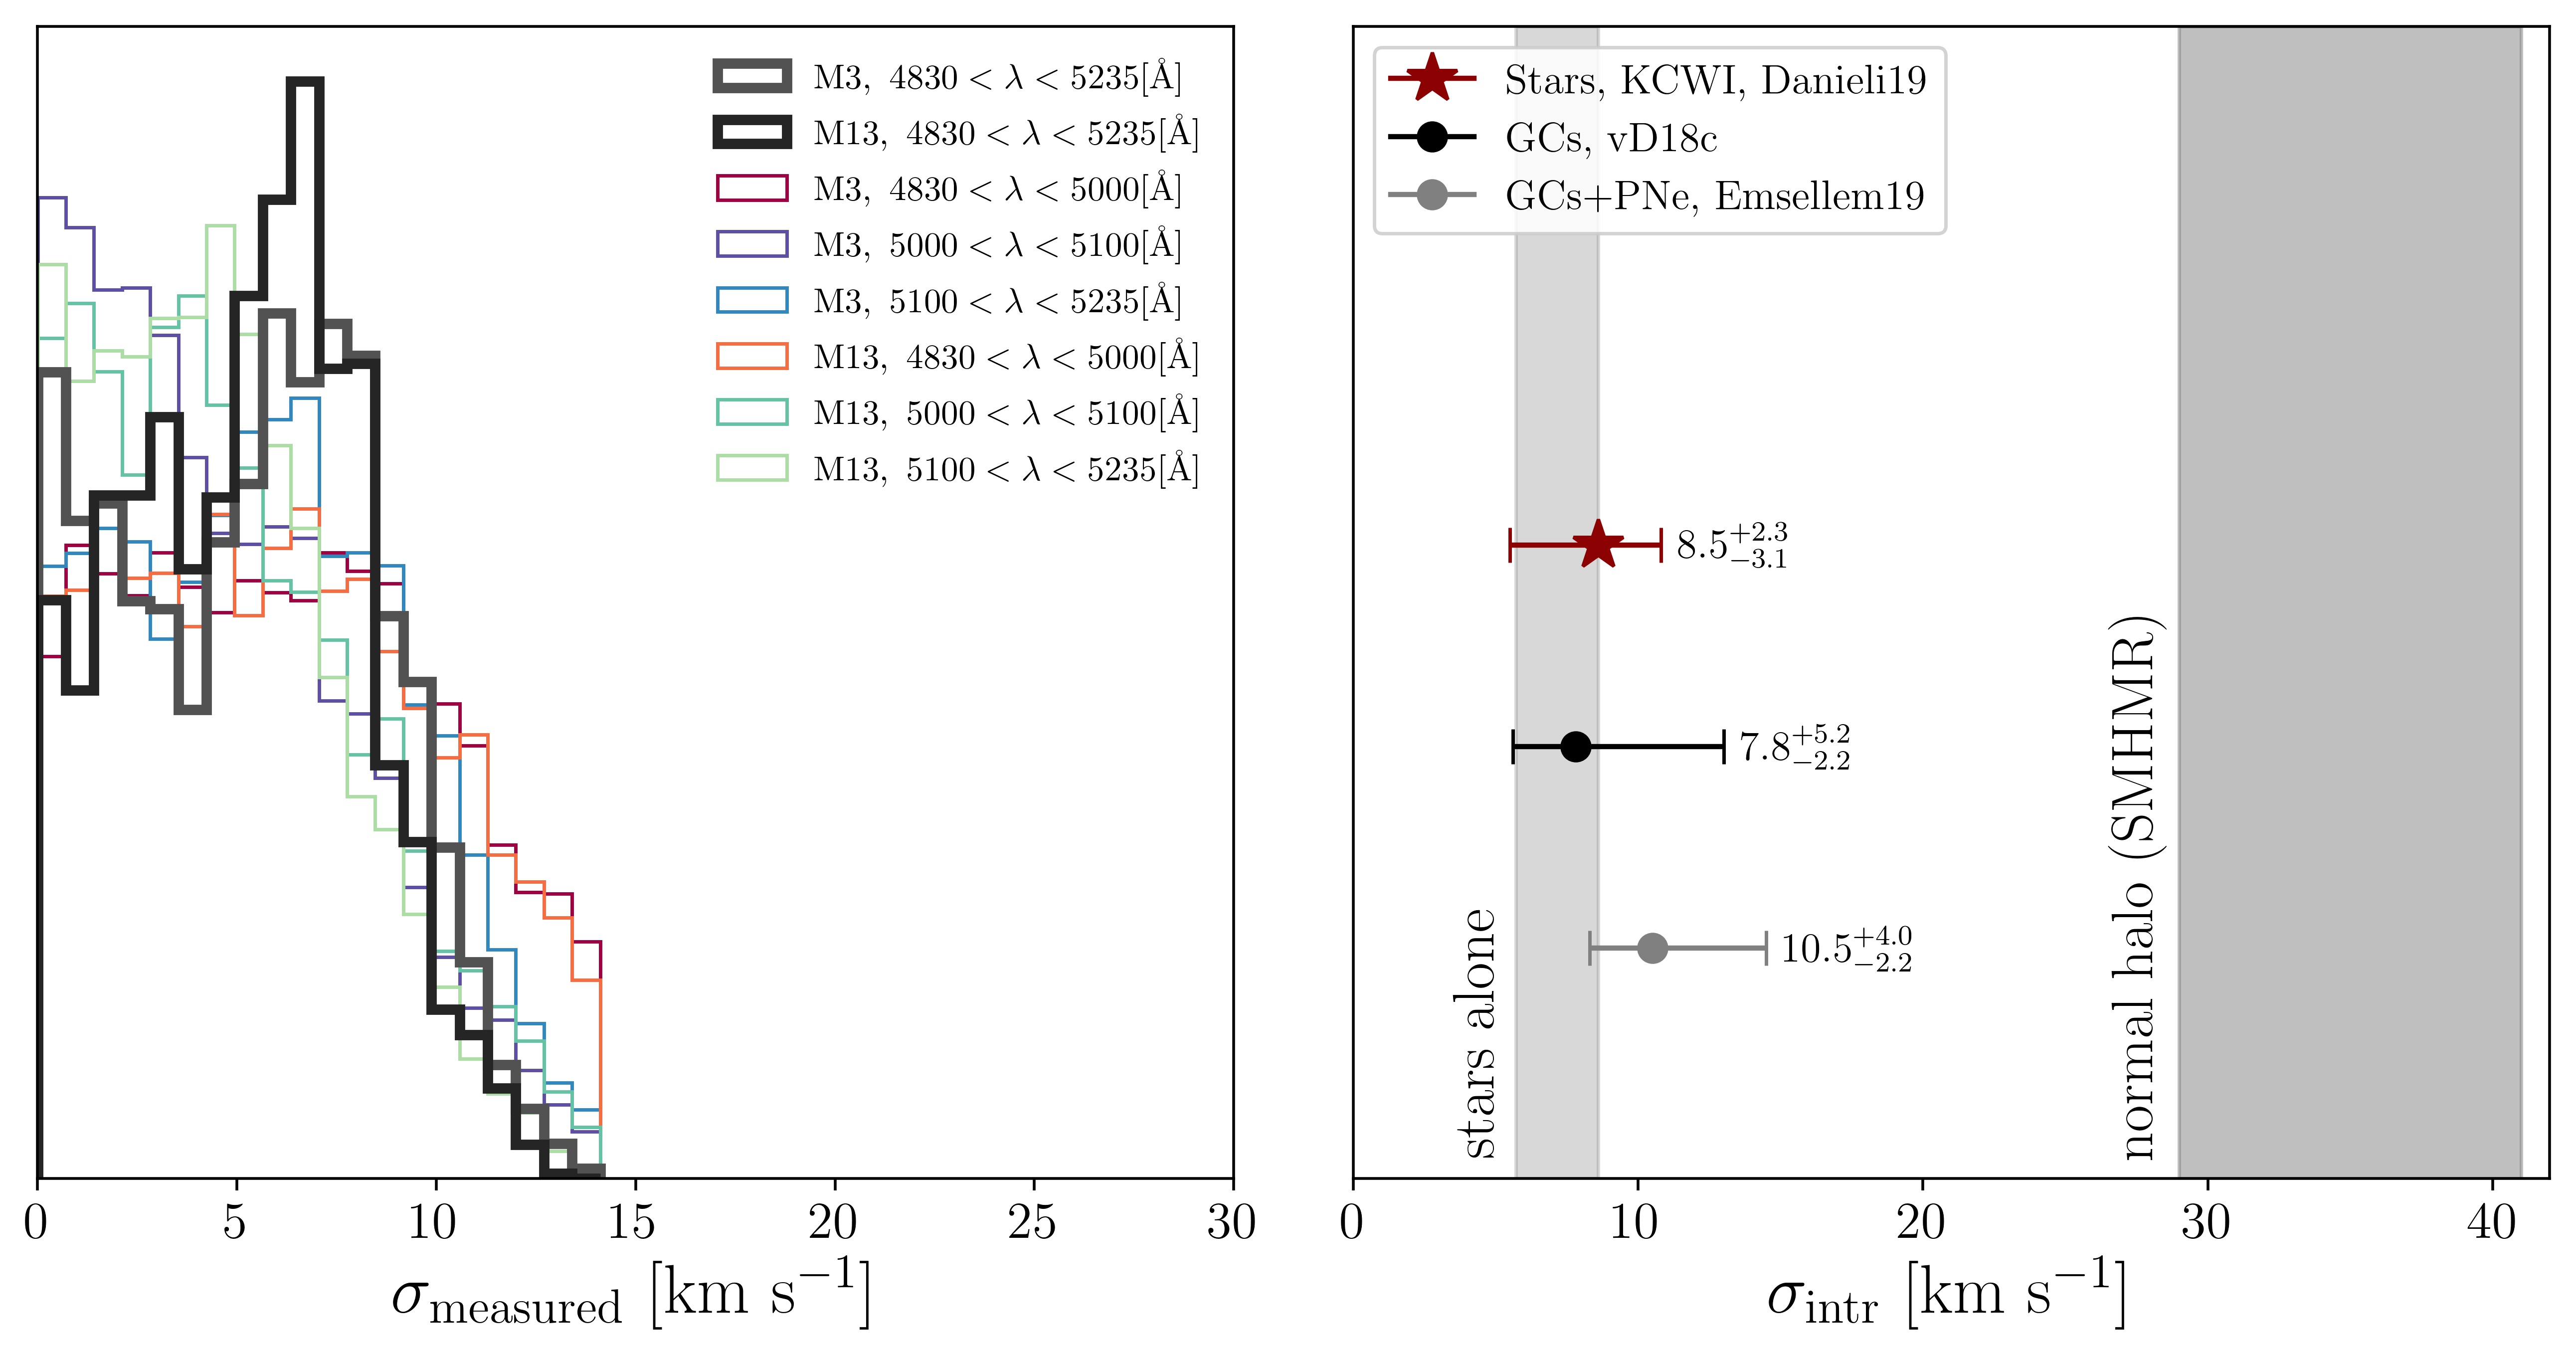
We find a stellar line-of-sight velocity dispersion of NGC1052-DF2 of km s-1 when fitting the M3 template and km s-1 when fitting the M13 template. These numbers are in excellent agreement. The mean is km s-1. We note that the lower bound of 5.4 km s-1 is somewhat artificial, as it is partially determined by the internal dispersion of the globular clusters. The MC samples extend all the way to 0 km s-1 (see Figure 3). The 95 % confidence upper limit on the dispersion is 11.8 km s-1. The central velocity dispersion for M13 is also somewhat uncertain; Kamann et al (2014) find a higher value than Harris 1996, although they note that dispersions in this regime cannot be measured reliably given the instrumental resolution of PMAS ( km s-1). An over- or underestimation of the intrinsic dispersion of M13 would result in a slightly different inferred dispersion for NGC1052-DF2. In that context, it is reassuring that the two independent measurements using the M3 and M13 templates are fully consistent with each other.
We performed two further tests of the stability of this result. First, the spectrum was split into three wavelength regions. The first region is dominated by H, the second by relatively weak Fe lines, and the third by Mg (see Figure 2). The MCMC posteriors for these fits are shown in the left panel of Figure 3, and the corrected velocity dispersions are listed in Table 1. All inferred dispersions are consistent within 1.5 km s-1. Next, we split the data into nine spatial bins and fitted those independently. In all cases, the best-fit dispersion is well within of the value from fitting the full wavelength range. An additional test we performed was fitting the M3 spectrum with the M13 spectrum as a template. The measured dispersion of M3 is consistent with zero and the intrinsic dispersion is consistent with the value from the literature (Pryor & Meylan 1993, Harris 1996).
The robustness of our results is illustrated by the small panels in Figure 2, where we show the average observed absorption in the spectral regions corresponding to the strongest absorption lines in the templates. The 8.5 km s-1 model is an excellent fit for all wavelength regions and also for the average of the 20 strongest lines in the entire spectrum. Measuring velocity dispersions in the 10 km s-1 – 30 km s-1 regime is well-suited to KCWI.
The inferred intrinsic stellar velocity dispersion is consistent with the constraints on the velocity dispersion derived using globular clusters in van Dokkum et al. (2018a) with km s-1 and in Emsellem et al. (2019) with an estimated value of km s-1. These various results are shown in the right panel of Figure 3.
| Template | |||
|---|---|---|---|
| [] | [km s-1] | [km s-1] | |
| M3 | |||
| M13 | |||
| M3 | |||
| M3 | |||
| M3 | |||
| M13 | |||
| M13 | |||
| M13 |
3.3 Systemic Velocity and Stellar Velocity Field
Besides the velocity dispersion we also obtain a measurement of the mean systemic velocity. The best-fit values for the M3 and M13 templates are km s-1and km s-1, respectively. The two values are consistent with each other and also with the mean velocity of the ten globular clusters as measured in van Dokkum et al. (2018b): km s-1.
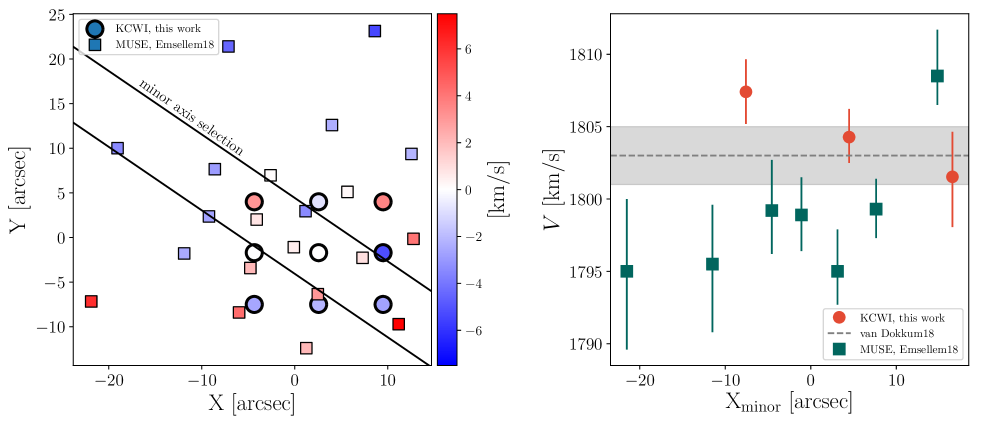
Next, we examine the systemic velocities in the nine spatial bins described in § 3.2. The rms scatter among the nine velocities is 2.8 km s-1. This is very similar to the mean velocity uncertainty (2.2 km s-1), leaving little room for velocity gradients of the same order as the velocity dispersion. In the left panel of Figure 4 we show the stellar velocity field. We find no clear gradient in the velocities measured from our data within our FOV. This is in contrast to results from Emsellem et al. (2019), who report a gradient of km s-1 per 10” along the minor axis. In the right panel of Figure 4 we compare the absolute velocities of several spatial bins along the minor axis directly, as were obtained from our data (orange circles) and from the MUSE data (green squares). We shift the MUSE velocities by km s-1 to account for the different applied redshift-velocity transformation ( in our analysis versus in Emsellem et al. 2019). If there is a slight trend in the KCWI data, it is in the opposite direction from that seen in the MUSE data. Given the large offset in the absolute velocities between the MUSE results on the one hand and the KCWI, LRIS, and DEIMOS results on the other, and the lack of a clear trend in our data, we do not confirm the presence of the gradient claimed in Emsellem et al. (2019). 111These authors have also measured the stellar velocity dispersion, but owing to the complexities of measuring well below the instrumental resolution, the final values are not yet known at the time of writing and we therefore cannot compare them directly to ours (E. Emsellem, private communication). We note that the MUSE velocities are consistent with ours in the lower (Southern) part of the MUSE data cube.
4 Discussion
In this Letter we have presented stellar kinematics measurements for the galaxy NGC1052-DF2, using high resolution ( km s-1) integral-field spectroscopy with the Keck Cosmic Web Imager (KCWI) on Keck II. We measure a systemic velocity of km s-1, and confirm that the ten star clusters that were previously used to constrain the kinematics of NGC1052-DF2 (van Dokkum et al. 2018a, Wasserman et al. 2018) are indeed associated with the diffuse stellar light of the galaxy. Thanks to the exceptionally high resolution of KCWI, we are providing a robust measurement of the stellar velocity dispersion of NGC1052-DF2. We measure km s-1 within the effective radius, consistent with the revised dispersion of km s-1 measured from the ten globular clusters using the maximum likelihood method in van Dokkum et al. (2018a).
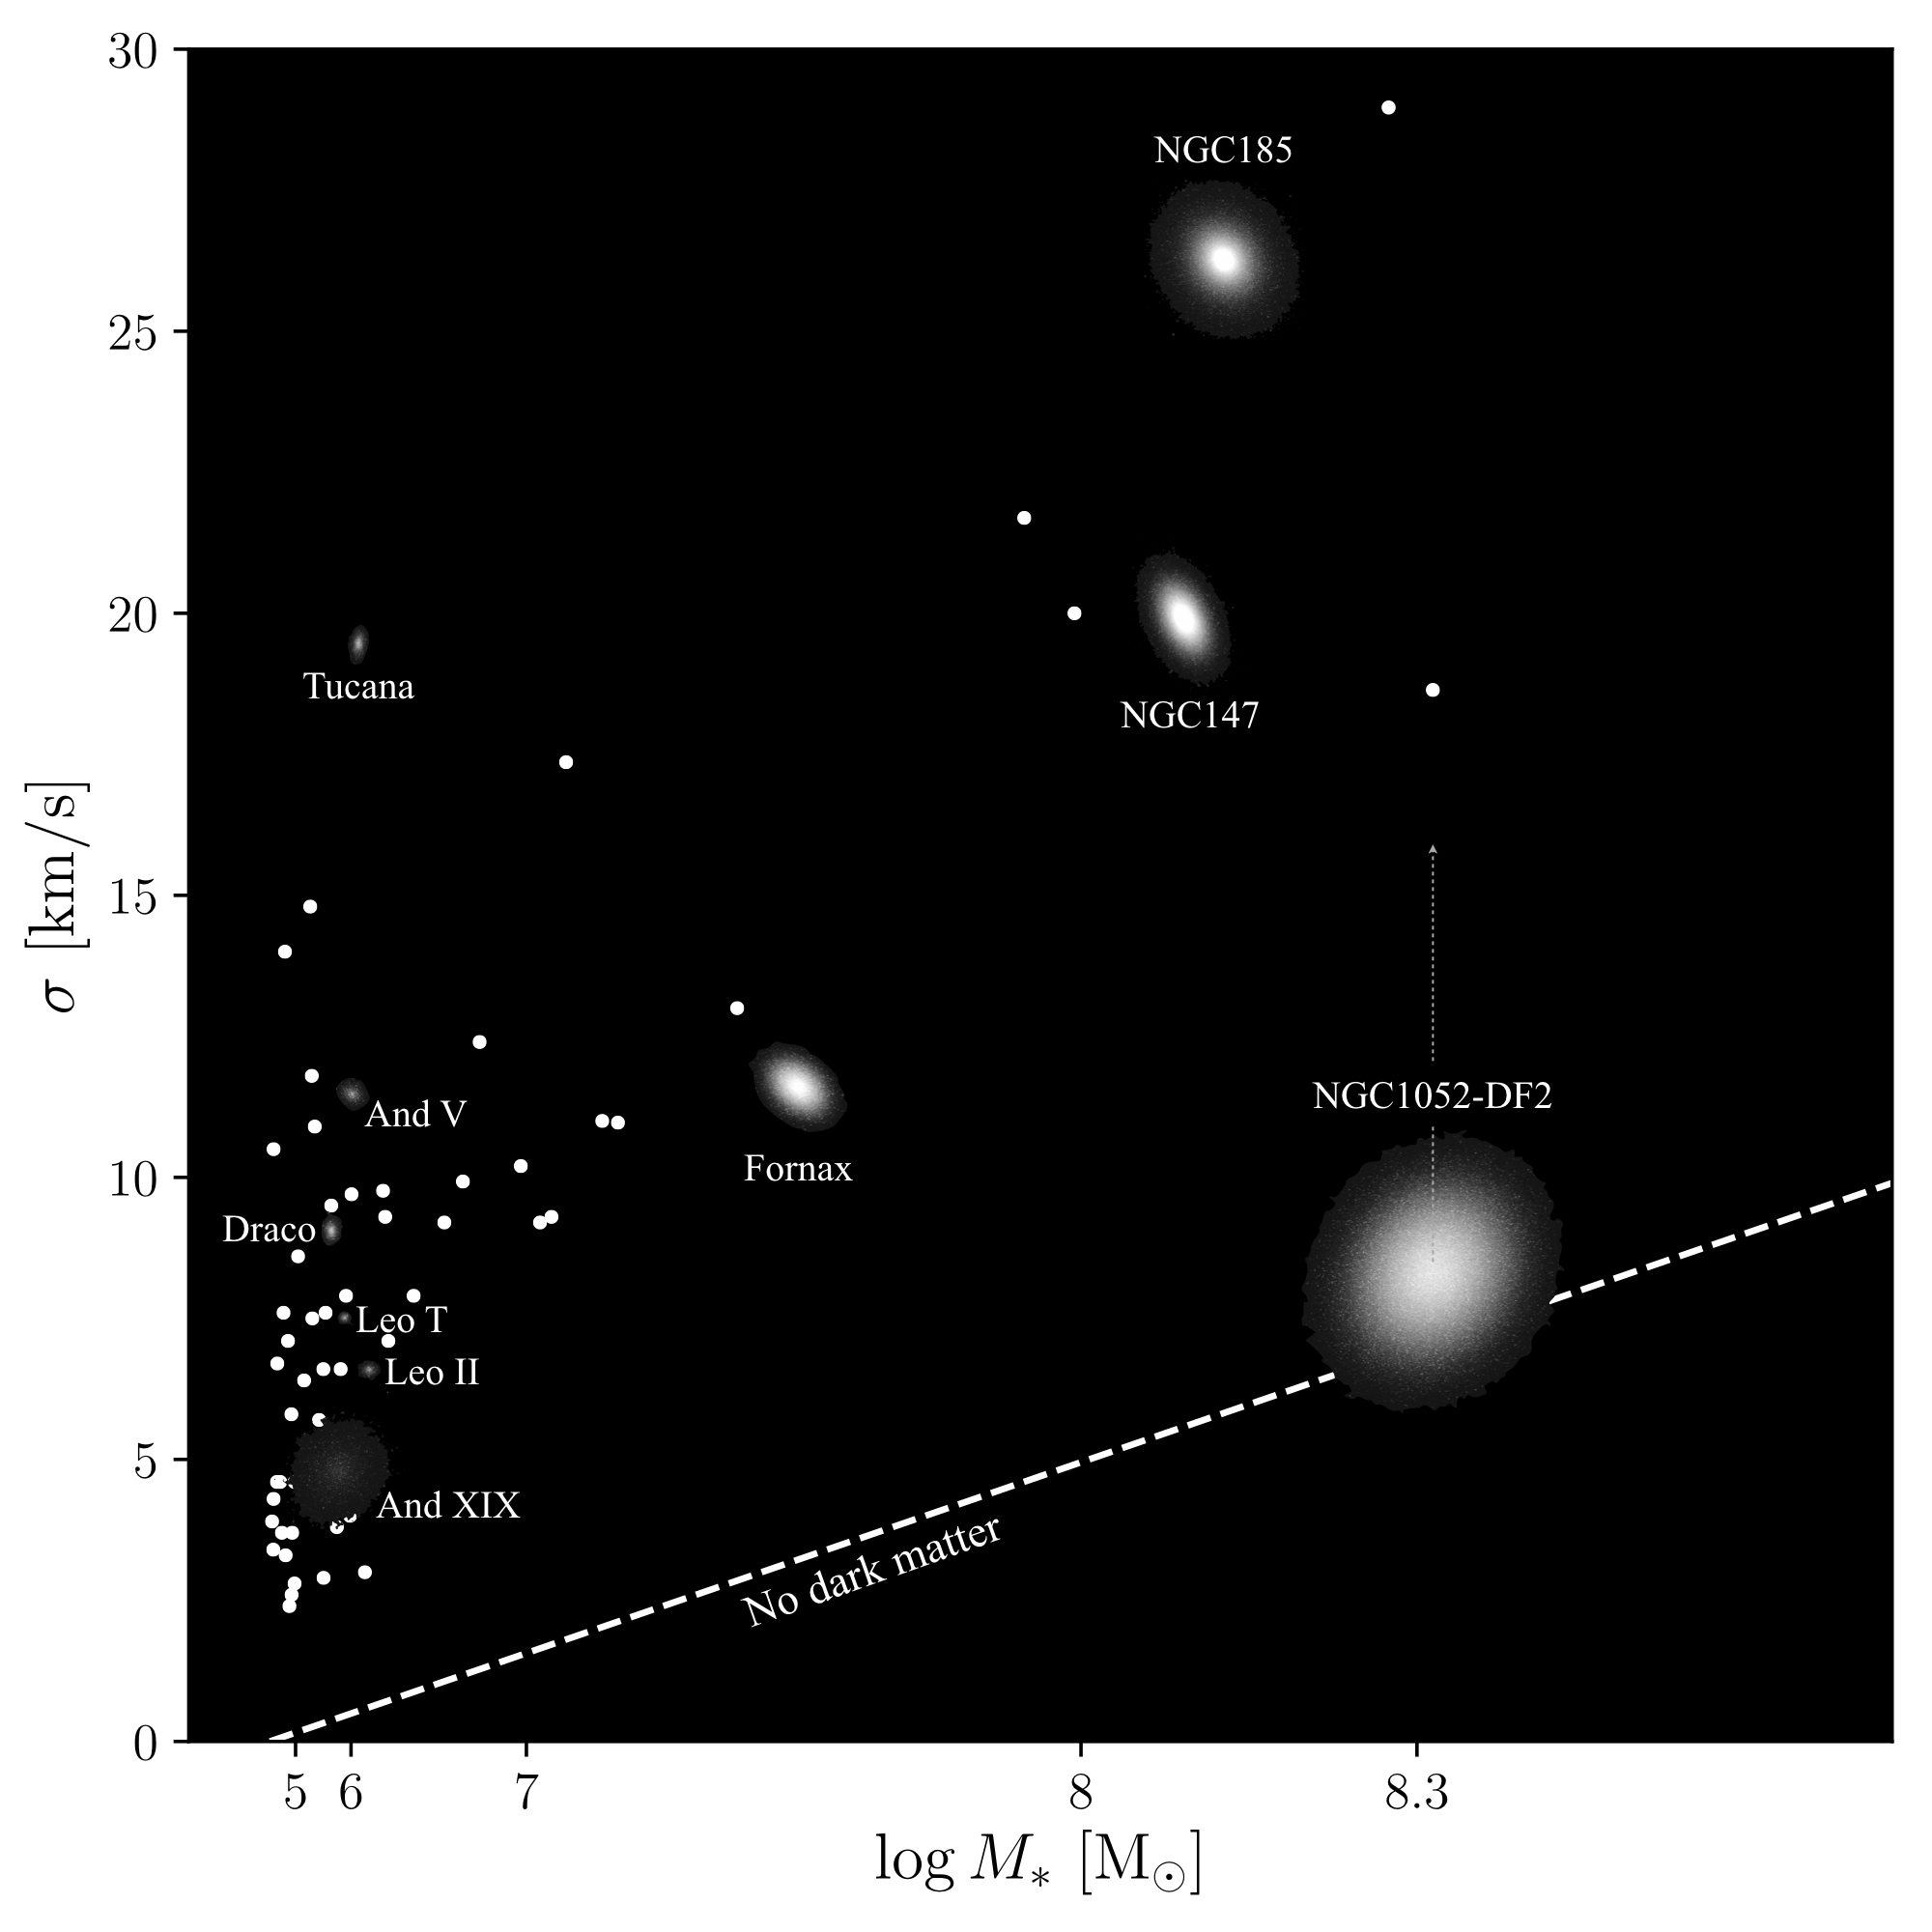
In Figure 5 we show the distribution of Local Group galaxies in the plane of velocity dispersion versus stellar mass, using the compilation of McConnachie (2012). Several galaxies are displayed as model images, created with the ArtPop code (Danieli et al. 2018). This Figure graphically illustrates the unusual nature of NGC1052-DF2: the galaxy combines a relatively high stellar mass with a large size and a very low velocity dispersion. The dashed line is an indicative relation between stellar mass and velocity dispersion in the absence of dark matter, for the radial regime where the dispersion profile is approximately isothermal: km s-1. Typical dwarf galaxies fall above the line, as they are dark matter dominated, but NGC1052-DF2 is on the line within the errors.
We quantify this by using the newly measured stellar velocity dispersion along with the projected circularized half-light radius of kpc (Cohen et al. 2018) to determine the dynamical mass of NGC1052-DF2 within the 3D half-light radius (Wolf et al. 2010). We find . The stellar mass within the half light radius is M⊙ (see van Dokkum et al. 2018b), and we infer that the dynamical mass is consistent with the mass in stars alone. We refer to Wasserman et al. (2018) for quantitative constraints on the halo mass as derived from the globular clusters; our measurement confirms the central assumption in Wasserman et al. (2018) that the globular clusters indeed trace the potential of NGC1052-DF2. We note that if NGC1052-DF2 is a thin rotating disk seen close to face-on, its axis ratio of 0.85 implies inclination-corrected velocities that are (at most) a factor of 1.9 higher than the observed ones (van Dokkum et al. 2018b). This scenario is unlikely given the lack of detected rotation along the major axis or in the globular clusters, and the discovery of a second galaxy missing dark matter, NGC1052-DF4, in the same group (van Dokkum et al. 2019). Nevertheless, for consistency with the other data points, we show this inclination correction with a dotted line in Figure 5.
Our study confirms that NGC1052-DF2 has far less dark matter than expected, and perhaps no dark matter at all. Future studies can examine what physical processes and formation schemes can result in this deficiency of dark matter on kpc scales. This is particularly challenging given that other similar-looking UDGs appear to have normal (or even “overmassive”) halos (see, e.g., Toloba et al. 2018). It is now critical to determine whether NGC1052-DF2 is a unique galaxy or whether this “missing dark matter problem” is relatively common. If it is, it implies that the scatter in stellar mass at low halo masses is extremely large (see, e.g., Behroozi et al. 2018).
Another essential question is whether other properties of NGC1052-DF2, such as its nature as a UDG and its intriguing population of globular clusters, are related to its dark matter deficiency. Finding a closer-by system with a low velocity dispersion would allow us to constrain its properties (even) more accurately, and place strong constraints on dark matter and halo models.
References
- Aaronson (1983) Aaronson, M. 1983, ApJ, 266, L11
- Beasley et al. (2016) Beasley, M. A., Romanowsky, A. J., Pota, V., et al. 2016, ApJ, 819, L20
- Behroozi et al. (2018) Behroozi, P., Wechsler, R., Hearin, A., & Conroy, C. 2018, arXiv e-prints, arXiv:1806.07893
- Behroozi et al. (2010) Behroozi, P. S., Conroy, C., & Wechsler, R. H. 2010, ApJ, 717, 379
- Behroozi et al. (2013) Behroozi, P. S., Wechsler, R. H., & Conroy, C. 2013, ApJ, 770, 57
- Cohen et al. (2018) Cohen, Y., van Dokkum, P., Danieli, S., et al. 2018, ApJ, 868, 96
- Danieli et al. (2018) Danieli, S., van Dokkum, P., & Conroy, C. 2018, ApJ, 856, 69
- de Blok et al. (2001) de Blok, W. J. G., McGaugh, S. S., & Rubin, V. C. 2001, AJ, 122, 2396
- Emsellem et al. (2019) Emsellem, E., van der Burg, R. F. J., Fensch, J., et al. 2019, MNRAS, submitted, arXiv:1812.07345
- Foreman-Mackey et al. (2013) Foreman-Mackey, D., Hogg, D. W., Lang, D., & Goodman, J. 2013, Publications of the Astronomical Society of the Pacific, 125, 306
- Geha et al. (2009) Geha, M., Willman, B., Simon, J. D., et al. 2009, ApJ, 692, 1464
- Gu et al. (2016) Gu, M., Conroy, C., & Behroozi, P. 2016, ApJ, 833, 2
- Gu et al. (2018) Gu, M., Conroy, C., Law, D., et al. 2018, ApJ, 859, 37
- Harris (1996) Harris, W. E. 1996, AJ, 112, 1487
- Kamann et al. (2014) Kamann, S., Wisotzki, L., Roth, M. M., et al. 2014, A&A, 566, A58
- Kirby et al. (2013) Kirby, E. N., Cohen, J. G., Guhathakurta, P., et al. 2013, ApJ, 779, 102
- Laporte et al. (2018) Laporte, C. F. P., Agnello, A., & Navarro, J. F. 2018, MNRAS, 2765
- Łokas & Mamon (2001) Łokas, E. L., & Mamon, G. A. 2001, MNRAS, 321, 155
- Mandelbaum et al. (2006) Mandelbaum, R., Seljak, U., Kauffmann, G., Hirata, C. M., & Brinkmann, J. 2006, MNRAS, 368, 715
- Martin et al. (2018) Martin, N. F., Collins, M. L. M., Longeard, N., & Tollerud, E. 2018, ApJ, 859, L5
- Martin et al. (2016) Martin, N. F., Geha, M., Ibata, R. A., et al. 2016, MNRAS, 458, L59
- McConnachie (2012) McConnachie, A. W. 2012, AJ, 144, 4
- Morrissey et al. (2012) Morrissey, P., Matuszewski, M., Martin, C., et al. 2012, in Society of Photo-Optical Instrumentation Engineers (SPIE) Conference Series, Vol. 8446, Ground-based and Airborne Instrumentation for Astronomy IV, 844613
- Morrissey et al. (2018) Morrissey, P., Matuszewski, M., Martin, D. C., et al. 2018, ApJ, 864, 93
- Moster et al. (2010) Moster, B. P., Somerville, R. S., Maulbetsch, C., et al. 2010, ApJ, 710, 903
- Oman et al. (2016) Oman, K. A., Navarro, J. F., Sales, L. V., et al. 2016, MNRAS, 460, 3610
- Pryor & Meylan (1993) Pryor, C., & Meylan, G. 1993, in Astronomical Society of the Pacific Conference Series, Vol. 50, Structure and Dynamics of Globular Clusters, ed. S. G. Djorgovski & G. Meylan, 357
- Toloba et al. (2018) Toloba, E., Lim, S., Peng, E., et al. 2018, ApJ, 856, L31
- Torrealba et al. (2018) Torrealba, G., Belokurov, V., Koposov, S. E., et al. 2018, arXiv e-prints, arXiv:1811.04082
- Vale & Ostriker (2004) Vale, A., & Ostriker, J. P. 2004, MNRAS, 353, 189
- van den Bosch & Swaters (2001) van den Bosch, F. C., & Swaters, R. A. 2001, MNRAS, 325, 1017
- van Dokkum et al. (2019) van Dokkum, P., Danieli, S., Abraham, R., Conroy, C., & Romanowsky, A. J. 2019, arXiv e-prints, arXiv:1901.05973
- van Dokkum et al. (2016) van Dokkum, P., Abraham, R., Brodie, J., et al. 2016, ApJ, 828, L6
- van Dokkum et al. (2018a) van Dokkum, P., Cohen, Y., Danieli, S., et al. 2018a, Research Notes of the American Astronomical Society, 2, 54
- van Dokkum et al. (2018b) van Dokkum, P., Danieli, S., Cohen, Y., et al. 2018b, Nature, 555, 629
- van Dokkum et al. (2015) van Dokkum, P. G., Abraham, R., Merritt, A., et al. 2015, ApJ, 798, L45
- Wasserman et al. (2018) Wasserman, A., Romanowsky, A. J., Brodie, J., et al. 2018, ApJ, 863, L15
- Wechsler & Tinker (2018) Wechsler, R. H., & Tinker, J. L. 2018, Annual Review of Astronomy and Astrophysics, 56, 435
- Wolf et al. (2010) Wolf, J., Martinez, G. D., Bullock, J. S., et al. 2010, MNRAS, 406, 1220