Benchmarking Substellar Evolutionary Models Using New Age Estimates for HD 4747 B and HD 19467 B
Abstract
Constraining substellar evolutionary models (SSEMs) is particularly difficult due to a degeneracy between the mass, age, and luminosity of a brown dwarf. In cases where a brown dwarf is found as a directly imaged companion to a star, as in HD 4747 and HD 19467, the mass, age, and luminosity of the brown dwarf are determined independently, making them ideal objects to use to benchmark SSEMs. Using the Center for High Angular Resolution Astronomy Array, we measured the angular diameters and calculated the radii of the host stars HD 4747 A and HD 19467 A. After fitting their parameters to the Dartmouth Stellar Evolution Database, MESA Isochrones and Stellar Tracks, and Yonsei-Yale isochronal models, we adopt age estimates of Gyr for HD 4747 A and Gyr for HD 19467 A. Assuming the brown dwarf companions HD 4747 B and HD 19467 B have the same ages as their host stars, we show that many of the SSEMs under-predict bolometric luminosities by 0.75 dex for HD 4747 B and dex for HD 19467 B. The discrepancies in luminosity correspond to over-predictions of the masses by 12% for HD 4747 B and 30% for HD 19467 B. We also show that SSEMs that take into account the effect of clouds reduce the under-prediction of luminosity to dex and the over-prediction of mass to for HD 4747 B, an L/T transition object that is cool enough to begin forming clouds. One possible explanation for the remaining discrepancies is missing physics in the models, such as the inclusion of metallicity effects.
1 Introduction
The atmospheres of brown dwarfs are quite complicated, including multiple convection zones, the possibility of cloud formation, and the presence of molecules that results in highly wavelength-dependent opacities (Marley & Robinson, 2015). Atmospheric effects are also the main factor in determining how a brown dwarf evolves and cools. If we hope to fully understand brown dwarfs and other substellar objects, we need models that take into account all of these effects. Having complete models is especially important when studying free-floating “field” brown dwarfs, whose properties cannot be determined other than from the atmosphere.
Recent substellar evolutionary models do a better job at predicting optical color of brown dwarfs and matching observations for older objects than their predecessors (Baraffe et al., 2015). However, tests of these models are still fairly limited due to degeneracies between mass, age, and luminosity for brown dwarfs; a young, less massive brown dwarf can appear to have the same luminosity as an old, more massive brown dwarf. These degeneracies are the main source of uncertainty in age estimates for field brown dwarfs, inhibiting the accuracy of model tests. To properly constrain the models, we need benchmark brown dwarfs – objects whose masses, ages, and luminosities can be determined independently.
The mass of a benchmark brown dwarf can be calculated using the orbital mechanics of the system in which it is found (Liu et al., 2008; Dupuy et al., 2009a; Crepp & Johnson, 2011; Dupuy & Liu, 2017). Other properties of a benchmark brown dwarf – such as age and metallicity – can be more readily inferred by studying the host star rather than the brown dwarf itself.
Using isochronal models, a more accurate age estimate of the host star can be determined by measuring the precise stellar radius, which places additional constraints on the location of the star on the HR-diagram (Crepp et al., 2012). For nearby stars (d 50 parsecs), it is possible to determine the stellar radius precisely using interferometry (Boyajian et al., 2012a, b).
In this paper, we present angular diameter measurements from the Center for High Angular Resolution Astronomy (CHARA) Array and calculate the radius (§2) of two Sun-like stars, HD 4747 A and HD 19467 A, known to host benchmark brown dwarf companions (Crepp et al., 2014, 2016, 2018). We also present new age estimates for these systems (§4) using the Dartmouth Stellar Evolution Database, MESA Isochrones and Stellar Tracks (MIST), and Yonsei-Yale (YY) isochrone models (Dotter et al., 2007, 2008; Paxton et al., 2011, 2013, 2015; Dotter, 2016; Choi et al., 2016; Spada et al., 2013). Assuming the directly imaged brown dwarf companions HD 4747 B and HD 19467 B have the same ages as their respective host stars, we use the isochronal age estimates to test and constrain several substellar evolutionary models (§6) (Chabrier et al., 2000; Baraffe et al., 2002, 2003, 2015; Saumon & Marley, 2008). Both benchmark brown dwarfs have precisely measured dynamical masses and metallicities, making them ideal objects to calibrate models.
2 Interferometric Observations and Stellar Radii
In order to obtain direct estimates for the stellar diameters, we performed interferometric observations with Georgia State University’s CHARA Array, a long-baseline optical/infrared interferometer located within the Mount Wilson Observatory in California. The CHARA Array consists of six 1-m diameter telescopes with distances between telescopes ranging from meters (ten Brummelaar et al., 2005). The predicted angular sizes of HD 4747 A and HD 19467 A, based on the surface brightness relations in Boyajian et al. (2014), are on the order of a few tenths of a milli-arcsecond (mas). Thus, we conducted our observations using the PAVO beam combiner (Ireland et al., 2008) in the -band with the baseline configurations listed in Table 1 in order to adequately resolve the stars.
| Object | UT Date | CHARA Baseline | Calibrator |
|---|---|---|---|
| HD 4747 | 2015/08/14 | W1-E1 (313.53 m) | HD 4622 |
| 2016/08/01 | W2-E2 (156.27 m) | HD 4622 | |
| 2016/11/11 | W1-E2 (251.34 m) | HD 2696, HD 4622 | |
| HD 19467 | 2014/09/06 | E1-S1 (330.66 m) | HD 17943, HD 22243 |
| 2014/09/07 | W1-E1 (313.53 m) | HD 17943, HD 22243 | |
| 2015/08/17 | E2-S1 (278.76 m) | HD 17943, HD 22243 | |
| 2016/11/11 | W1-E2 (251.34 m) | HD 16141, HD 17943, HD 22243 |
Note. — Refer to §2 for details.
HD 4747 A was observed during the nights of 14 August 2015 UT, 1 August 2016 UT, and 11 November 2016 UT. HD 19467 A was observed during the nights of 6 and 7 September 2014 UT, 17 August 2015 UT, and 11 November 2016 UT. The observations of our targets are bracketed in time with several calibrator stars, the selection of which is based on the JMMC Stellar Diameters Catalog (JSDC; Duvert, 2016)111http://www.jmmc.fr/jsdc.. In order to identify and thus avoid unknown systematic errors in our interferometry data, we require the use of at least two calibrator stars per target, the use of at least two combinations of telescopes (baselines), and data from at least two nights. Calibrator stars for HD 4747 A are HD 2696 ( mas) and HD 4622 ( mas). Calibrators for HD 19467 A are HD 16141 ( mas), HD 17943 ( mas), and HD 22243 ( mas) (Duvert, 2016; Chelli et al., 2016). These calibrators are selected based upon their physical attributes: no known multiplicity, low projected rotational velocity, similar brightness as the respective target in , close angular proximity (max 10 degrees) to the respective science target, and to be unresolved sources based on their estimated angular sizes (van Belle & van Belle, 2005; Boyajian et al., 2013; von Braun et al., 2014). A summary of our observations is shown in Table 1.
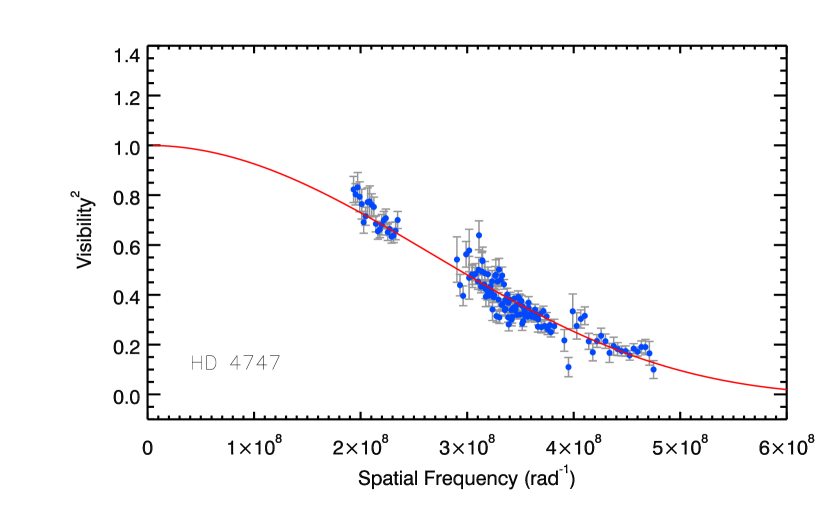
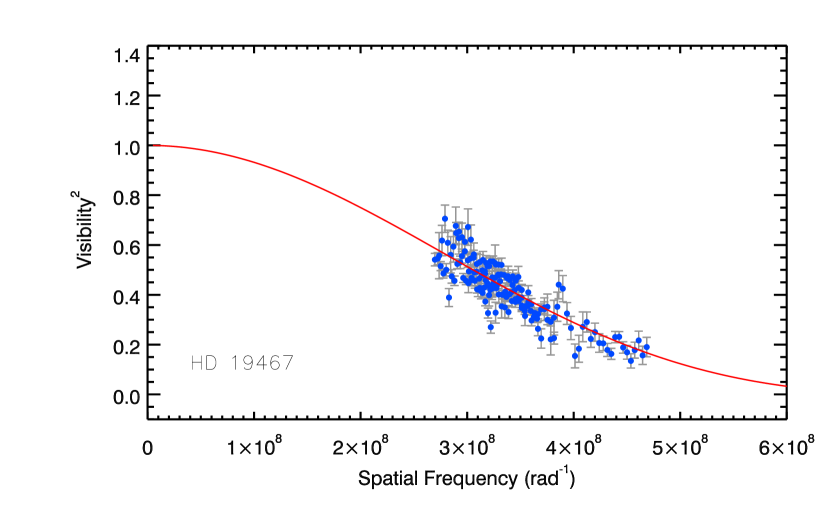
Our data reduction procedure to extract calibrated squared-visibility measurements (, Figure 1) is described in section 2.1 in Boyajian et al. (2015) and is based on the methods outlined in Maestro et al. (2013) and White et al. (2013). We measure uniform disk angular diameters of mas for HD 4747 A and mas for HD 19467 A. We determine limb-darkened angular diameters of mas for HD 4747 A and mas for HD 19467 A using respective limb-darkening coefficients of and (Claret & Bloemen, 2011). Combined with parallaxes from Gaia DR2 (Gaia Collaboration et al., 2018), we obtain stellar radii of R = R☉ for HD 4747 A and R = R☉ for HD 19467 A (Table 2). Our new radius measurements are consistent with literature values within 1 for HD 4747 A (Crepp et al., 2018) and within 3 for HD 19467 A (Crepp et al., 2014).
| Property | HD 4747 A | HD 19467 A | |
|---|---|---|---|
| RA (J2000) | 00 49 26.77 | 03 07 18.57 | |
| Dec (J2000) | -23 12 44.93 | -13 45 42.42 | |
| Spectral Type | G9Vaa Crepp et al. (2016) | G3Vbb Crepp et al. (2014) | |
| Parallax (mas)cc Gaia Collaboration et al. (2018) | |||
| Distance (pc) | |||
| Mass () | aa Crepp et al. (2016) | bb Crepp et al. (2014) | |
| [Fe/H ] | aa Crepp et al. (2016) | bb Crepp et al. (2014) | |
| log(g) (cm ) | aa Crepp et al. (2016) | bb Crepp et al. (2014) | |
| (mas)dd This paper (§2, 3, 4) | |||
| (mas)dd This paper (§2, 3, 4) | |||
| Radius ()dd This paper (§2, 3, 4) | |||
| ( erg s-1 cm-2)dd This paper (§2, 3, 4) | |||
| Luminosity ()dd This paper (§2, 3, 4) | |||
| (K)dd This paper (§2, 3, 4) | |||
| (K)d,ed,efootnotemark: |
3 Bolometric Fluxes, Stellar Effective Temperatures, and Stellar Luminosities
Coupled with stellar angular diameter, the knowledge of stellar bolometric flux () provides a direct estimate of stellar temperature, which, when combined with physical stellar radius, yields stellar luminosity via a reformulation of the Stefan-Boltzmann Law,
| (1) |
where has units of and has units of milliarcseconds. can be obtained by spectral energy distribution (SED) fitting by scaling spectral templates to literature photometry values. For the SED fitting of our targets (Figure 2), we follow the approach used in Mann et al. (2013) and von Braun et al. (2014). Interstellar extinction is set to zero for both targets due to the small distances to our targets (less than 70 pc)222See Aumer & Binney (2009) for more details. and we use the updated broad-band filter profiles presented in Mann & von Braun (2015). In the calculation of the errors in effective temperature and stellar luminosity, we inflate the calculated uncertainty in our (as given below) by adding 2% of the error in quadrature, thereby compensating for unknown systematic errors in the literature photometry (Bohlin et al., 2014).
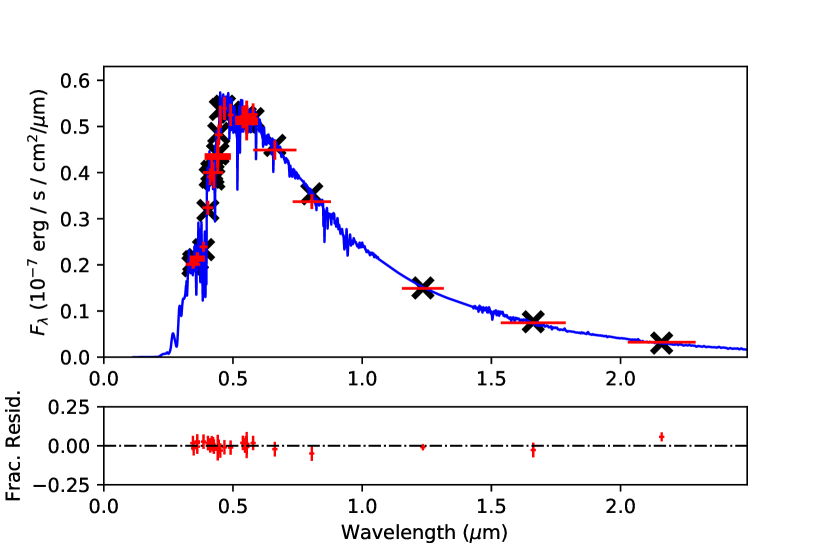
Based on fitting a G8V spectral template from the Pickles (1998)333See also https://lco.global/apickles/INGS/ for updated spectral templates. library to literature photometry from Irwin (1961), Stoy (1963), Wild (1969), Mermilliod (1986), Rufener (1988), Mermilliod & Nitschelm (1989), Olsen (1993), Hauck & Mermilliod (1998), Cutri et al. (2003), and Koen et al. (2010), we measure HD 4747 A’s to be erg s-1 cm-2, which, when combined with angular diameter as stated in Equation 1, produces K and a luminosity of . Compared to previous literature values, our new temperature estimate for HD 4747 A is consistent within 1 (Crepp et al., 2018).
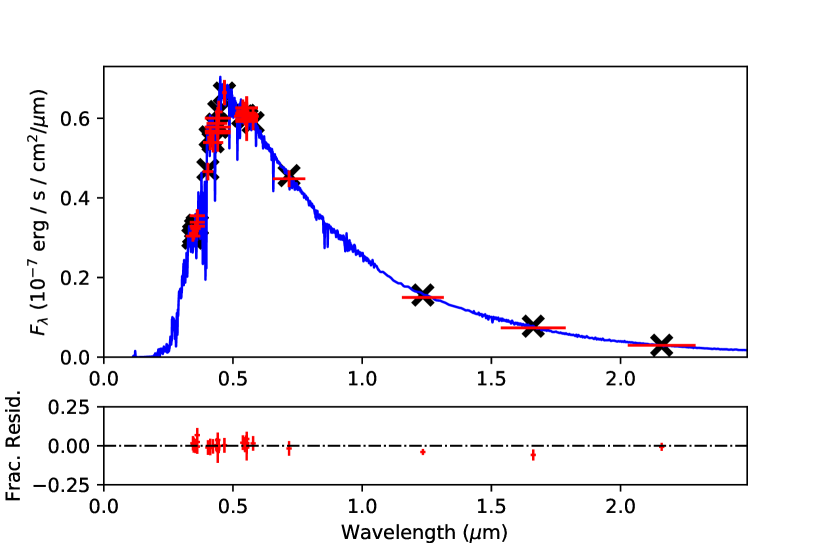
Using the same approach, we fit a G2V spectral template from the Pickles (1998) library to literature photometry from Corben (1971), Corben et al. (1972), Olsen (1983), Eggen (1983), Mermilliod (1986), Rufener (1988), Olsen (1994), Kornilov et al. (1996), Hauck & Mermilliod (1998), and Cutri et al. (2003) to obtain HD 19467 A’s to be erg s-1 cm-2. Based on the stellar angular diameter, this yields K (Equation 1) and a luminosity of . Compared with previous literature values, our new temperature estimate for HD 19467 A is consistent within 2 (Crepp et al., 2014).
4 Stellar Age Estimates
We derived age estimates for HD 4747 A and HD 19467 A using three different sets of isochrones and two different interpolation procedures. For each estimate, we started with stellar parameters derived from high resolution (R 70,000) spectra of the two stars from the Keck HIRES spectrograph (Vogt et al., 1994), analyzed using the procedure in Brewer et al. (2016). The procedure uses forward modeling of 350 Å of the spectrum, first fitting for global parameters and deviations from a solar abundance pattern. It then fits for the abundances of 15 elements and repeats the entire procedure using this new abundance pattern. This method has been shown to recover surface gravities consistent with asteroseismology to within dex (Brewer et al., 2015). The effective temperatures obtained from the spectral fitting were consistent with those from the interferometric measurements (Table 2).
4.1 Yonsei-Yale Isochrones
With estimates for [Fe/H], [Si/H] (as a proxy for -element enhancement), , and bolometric luminosity we used the interpolation routines for the YY isochrones from Brewer et al. (2016) to derive masses, radii, surface gravities and ages. The interpolation procedure does not allow us to utilize all of the constraints at our disposal, but the returned radii and surface gravities were consistent with our measured values. One constraint used that is not available for the other interpolation scheme is the Si/Fe ratio. Dotter (2016) showed that stars near their main-sequence turn-off will show an overall depletion of heavy elements in their atmospheres due to diffusion. The ratios of elements remain largely unchanged and so inclusion of this ratio may better capture the abundance of older main sequence stars.
4.2 MIST and Dartmouth Isochrones
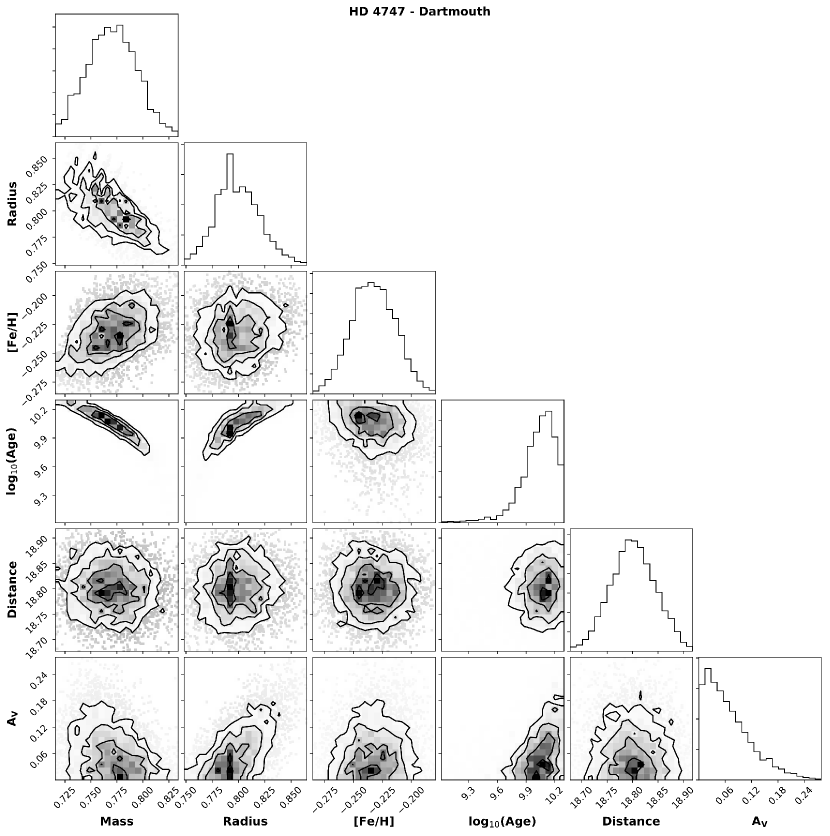
The isochrones package (Morton, 2015) uses the MultiNest algorithm (Feroz & Hobson, 2008; Feroz et al., 2009, 2013) to interpolate in either the MIST or Dartmouth isochrone grids. The routine allows for simultaneous fitting of many parameters, which we made use of to include additional constraints not possible with the YY isochrones. For both model grids, we fit the stars using our , , [Fe/H], radius, parallax from Gaia DR2 (Gaia Collaboration et al., 2018), and V magnitudes. The results of the fitting and correlations can be seen in the corner plots in Figure 3 and the Figure Set.
Fig. Set3. Corner Plots for HD 4747 A and HD 19467 A from Isochrone Fitting
4.3 Isochrone Age Results
| Isochrone | HD 4747 A | HD 19467 A | |
|---|---|---|---|
| Dartmouth | |||
| MIST | |||
| Yonsei-Yale | |||
| Adopted Ageaa Calculated as an average between the three age estimates. See §4.3. |
The results for both stars and all three isochrone grids is summarized in Table 3. Ages for HD 4747 A were consistent among the three different isochrone grids, though the uncertainties were large and the YY ages were lower by several Gyrs. Low mass stars on the main sequence spend a large amount of time with only minimal changes in their temperature and brightness, making precise age determinations challenging. The YY age estimate for HD 19467 A was also lower than that for the MIST or Dartmouth estimates, which were again consistent with one-another. In all three cases, HD 19467 A is fit to be on the sub-giant branch and has much smaller age uncertainties due to the rapid evolution in this region.
The low age from the YY isochrones could be due to the inclusion of the Si/Fe ratio and its additional constraint on the initial metallicity. However, the MIST isochrones also place additional constraints on the initial metallicity by using surface abundances instead of initial abundances. Instead, the systematically lower ages from YY for both stars points to a difference in the stellar structure of the models at older evolutionary states, resulting in an age offset.
Unlike the Dartmouth and MIST isochrones, the YY isochrones do not allow us to include the surface gravity as a constraint. Since the surface gravities are consistent to within dex of those from asteroseismology, we trust the Dartmouth and MIST age estimates over the YY age estimates, however we still include the YY estimates in our analysis. We adopt ages that are averages of the Dartmouth, MIST, and YY estimates: Gyr for HD 4747 A and Gyr for HD 19467 A.
4.4 Discrepancies Between Age Estimates
The gyrochronological age estimates for HD 4747 A ( Gyr; Crepp et al., 2016) and HD 19467 A ( Gyr; Crepp et al., 2014) are several Gyr younger than the isochronal age estimates. One possible explanation for this discrepancy is tidal interactions with a nearby companion “spinning up” the star (Brown, 2014; Maxted et al., 2015). This seems unlikely, as the only known massive companions to both HD 4747 A and HD 19467 A are the benchmark brown dwarfs separated by AU and AU respectively. A more probable explanation is weakened magnetic braking, which occurs in solar-type stars with ages Gyr (van Saders et al., 2016). This would result in gyrochronological age estimates of around 4 Gyr, despite the actual age of the star being older.
Isochronal models become less reliable as a star’s properties deviate from those of the Sun (Bonaca et al., 2012; Tayar et al., 2017). However, both HD 4747 A and HD 19467 A are nearly Sun-like in mass, radius, luminosity, and metallicity, so we expect the isochronal models to be well-calibrated. In addition, gyrochronology is only precisely constrained for stars younger than the Sun (Mamajek & Hillenbrand, 2008). As a result, we adopt the isochronal age estimates (Table 3) over the gyrochronological age estimates for both HD 4747 A and HD 19467 A.
To further investigate the discrepancy between isochronal and gyrochronological age estimates, the ages of HD 4747 A and HD 19467 A could be determined using asteroseismology (Ulrich, 1986; Lebreton & Goupil, 2014; Silva Aguirre et al., 2015). While neither star is on the TESS Asteroseismic Science Consortium (TASC) target list due to lower probabilities of detection of solar-like oscillations (about 5% for HD 4747 A and 20% for HD 19467 A; Campante et al., 2016), it is worth looking at since they are both relatively high on the Candidate Target List and should still be targeted with the two-minute cadence (Stassun et al., 2017). Other methods of determining age that are related to stellar activity or rotation, such as measuring lithium abundance or X-ray emission, would be correlated with the gyrochronological age and therefore not useful for resolving the discrepancy.
5 Bolometric Luminosities of HD 4747 B and HD 19467 B
We calculate the bolometric luminosities of the brown dwarfs following the method outlined in Appendix A of Crepp et al. (2012) using the following equations:
| (2) |
| (3) |
where the bolometric magnitude of the Sun .
HD 4747 B has an absolute magnitude (Crepp et al., 2016). Combined with the 0.11 mag correction to convert to (Rudy et al., 1996) and an estimated bolometric correction (Golimowski et al., 2004) using the updated spectral type and temperature from Crepp et al. (2018), we obtain a bolometric magnitude . This gives us a bolometric luminosity .
6 Comparison to Substellar Evolutionary Models
Assuming the brown dwarf companions HD 4747 B and HD 19467 B have the same ages as their respective host stars, we can directly test the accuracy of several substellar evolutionary models (SSEM). For this paper, we looked at SSEMs from Baraffe et al. (2003) (COND03), Baraffe et al. (2015) (BHAC15), and Saumon & Marley (2008) (SM08) and compared them to calculated properties of HD 4747 B and HD 19467 B both graphically and numerically.
6.1 Visual Comparisons
We directly compare the calculated bolometric luminosities (§5) for the brown dwarfs to the theoretical predictions from each SSEM given their dynamical masses and isochronal age estimates. Each SSEM is linearly interpolated across ages and masses using the SciPy (Jones et al., 2001–) algorithm LinearNDInterpolator to give a grid of bolometric luminosity predictions, with age and mass spanning ranges determined by the extent of each model444Ages generally range from 0.0010 to 10 Gyr and masses generally range from 0.001 to 0.072 .. We then plot the SSEM linear interpolations with the data points for each brown dwarf to see if they are consistent (Figure 4).
We find that the COND03 and SM08 SSEMs under-predict the bolometric luminosities of both brown dwarf companions, which is consistent with previous tests of SSEMs using benchmark brown dwarfs (Dupuy et al., 2009b; Crepp et al., 2012; Dupuy et al., 2014; Crepp et al., 2018). The model predictions are too low by dex for HD 4747 B at the best-fit age and mass and dex for HD 19467 B. If the masses of both objects are slightly higher, which has been suggested for HD 4747 B (Peretti et al., 2018), the measured bolometric luminosity would be more consistent with the models. For HD 4747 B, increasing the mass places the object around the hydrogen burning limit, increasing the range in the predicted luminosity. We do not make any conclusions regarding the BHAC15 models at this time as they currently do not extend to ages older than Gyr for masses lower than 0.080 .
6.1.1 Effects of Metallicity on Luminosity Predictions
There are few SSEMs available that explore the effect of metallicity on brown dwarf evolution. Of the models tested, only Saumon & Marley (2008) provide grids for metallicities other than solar. To effectively explore how metallicity changes the luminosity predictions of brown dwarfs, SSEMs that span a wider range of metallicities are needed, such as the upcoming Sonora models (Marley et al., 2017).
Since both HD 4747 B and HD 19467 B have metallicities slightly less than solar, we compare them to the grid assuming [M/H ]= -0.3 (Figure 5). In both cases, this comparison does not improve the discrepancy between the calculated and predicted bolometric luminosities. The lower metallicity model under-predicts the bolometric luminosity for HD 4747 B by dex and dex for HD 19467 B.
6.1.2 Effects of Clouds on Luminosity Predictions for HD 4747 B
HD 4747 B is an early T-dwarf (spectral type T12) near the L/T transition, where its atmosphere is cool enough to begin forming clouds (Crepp et al., 2016, 2018). To account for this, we also compare HD 4747 B to SSEMs that include cloud formation by Chabrier et al. (2000) and Baraffe et al. (2002) (DUSTY00) and Saumon & Marley (2008) (SM08-C) (Figure 6). The cloudy models are a closer fit to the data for HD 4747 B than the cloudless models, reducing the discrepancy in the bolometric luminosity to dex.
6.2 Photometric Mass Estimates
Using a Markov-Chain Monte Carlo (MCMC) simulation, we calculate the photometric mass of HD 4747 B and HD 19467 B according to each SSEM given their isochronal ages and bolometric luminosities. We perform the MCMC simulation using the Python package emcee (Foreman-Mackey et al., 2013), which implements an affine-invariant ensemble sampler to explore our three-dimensional (age, mass, and luminosity) parameter space with Gaussian priors on age and luminosity and a Gaussian likelihood function for mass. The results of the MCMC are shown in Table 5.
As expected based on our plots from §6.1, the predicted photometric masses for both HD 4747 B and HD 19467 B are higher ( and respectively) than the dynamical mass measurements when considering the cloudless models. For HD 19467 B, the models are discrepant by about . Due to the larger lower bound errors from the models for HD 4747 B, the cloudless models are consistent with the dynamical mass. When comparing to the cloudy models, the predicted mass for HD 4747 B is reduced to higher than the dynamical mass, which is still consistent within .
7 Summary and Conclusions
For brown dwarfs found as companions to stars, certain properties such as metallicity and age can be determined independent from the brown dwarf’s mass and luminosity by studying the host star instead of the brown dwarf. As a result, such objects are ideal to use as benchmarks for substellar evolutionary models. While not many are known, benchmark brown dwarfs tend to be over-luminous compared to SSEMs.
Using new age estimates for HD 4747 B and HD 19467 B, determined by studying the host stars with interferometry, we have shown that current SSEMs under-predict the bolometric luminosities and over-predict the masses of these brown dwarfs. Our discrepancy between measured and predicted bolometric luminosities is high compared to previous results for HD 130948 BC and HR 7672 B (Dupuy et al., 2009b; Crepp et al., 2012), but the discrepancy between measured and predicted masses is consistent with results for Gl 417 BC (Dupuy et al., 2014). Since both HD 4747 B and HD 19467 B orbit far from their host stars, we do not expect this additional luminosity to result from heating due to the star.
Although including clouds in the SSEMs puts the predicted mass and luminosity of HD 4747 B in better agreement to the measured data, the brown dwarf still appears over-luminous. A possible explanation for the remaining discrepancy is missing physics in the models. The effect of metallicity on brown dwarf atmospheres is one area of improvement that has yet to be fully explored in SSEMs. The presence of additional metals could affect the amount of cloud formation and which condensates are formed, both of which would affect the opacity of the atmosphere and therefore the observed luminosity of the brown dwarf (Marley & Robinson, 2015). Future SSEMs such as the Sonora models (Marley et al., 2017) plan to cover a wider range of metallicities.
To improve the comparisons of HD 4747 B and HD 19467 B to SSEMs, more study should be done to constrain the masses and the ages of the brown dwarfs. Mass estimates will be improved with more radial velocity and direct imaging data combined with the latest parallaxes from Gaia DR2 (Brandt et al., 2018). Current age estimates are highly disparate and method-dependent. Although neither HD 4747 A nor HD 19467 A are on the TASC target list, both stars should be targeted with the TESS two-minute cadence and could be studied with asteroseismology to help resolve the age discrepancy.
References
- Aumer & Binney (2009) Aumer, M., & Binney, J. J. 2009, MNRAS, 397, 1286, doi: 10.1111/j.1365-2966.2009.15053.x
- Baraffe et al. (2002) Baraffe, I., Chabrier, G., Allard, F., & Hauschildt, P. H. 2002, A&A, 382, 563, doi: 10.1051/0004-6361:20011638
- Baraffe et al. (2003) Baraffe, I., Chabrier, G., Barman, T. S., Allard, F., & Hauschildt, P. H. 2003, A&A, 402, 701, doi: 10.1051/0004-6361:20030252
- Baraffe et al. (2015) Baraffe, I., Homeier, D., Allard, F., & Chabrier, G. 2015, A&A, 577, A42, doi: 10.1051/0004-6361/201425481
- Bohlin et al. (2014) Bohlin, R. C., Gordon, K. D., & Tremblay, P.-E. 2014, PASP, 126, 711, doi: 10.1086/677655
- Bonaca et al. (2012) Bonaca, A., Tanner, J. D., Basu, S., et al. 2012, ApJ, 755, L12, doi: 10.1088/2041-8205/755/1/L12
- Boyajian et al. (2015) Boyajian, T., von Braun, K., Feiden, G. A., et al. 2015, MNRAS, 447, 846, doi: 10.1093/mnras/stu2502
- Boyajian et al. (2014) Boyajian, T. S., van Belle, G., & von Braun, K. 2014, AJ, 147, 47, doi: 10.1088/0004-6256/147/3/47
- Boyajian et al. (2012a) Boyajian, T. S., McAlister, H. A., van Belle, G., et al. 2012a, ApJ, 746, 101, doi: 10.1088/0004-637X/746/1/101
- Boyajian et al. (2012b) Boyajian, T. S., von Braun, K., van Belle, G., et al. 2012b, ApJ, 757, 112, doi: 10.1088/0004-637X/757/2/112
- Boyajian et al. (2013) —. 2013, ApJ, 771, 40, doi: 10.1088/0004-637X/771/1/40
- Brandt et al. (2018) Brandt, T. D., Dupuy, T., & Bowler, B. P. 2018, arXiv e-prints. https://arxiv.org/abs/1811.07285
- Brewer et al. (2015) Brewer, J. M., Fischer, D. A., Basu, S., Valenti, J. A., & Piskunov, N. 2015, ApJ, 805, 126, doi: 10.1088/0004-637X/805/2/126
- Brewer et al. (2016) Brewer, J. M., Fischer, D. A., Valenti, J. A., & Piskunov, N. 2016, ApJS, 225, 32, doi: 10.3847/0067-0049/225/2/32
- Brown (2014) Brown, D. J. A. 2014, MNRAS, 442, 1844, doi: 10.1093/mnras/stu950
- Campante et al. (2016) Campante, T. L., Schofield, M., Kuszlewicz, J. S., et al. 2016, ApJ, 830, 138, doi: 10.3847/0004-637X/830/2/138
- Chabrier et al. (2000) Chabrier, G., Baraffe, I., Allard, F., & Hauschildt, P. 2000, ApJ, 542, 464, doi: 10.1086/309513
- Chelli et al. (2016) Chelli, A., Duvert, G., Bourgès, L., et al. 2016, A&A, 589, A112, doi: 10.1051/0004-6361/201527484
- Choi et al. (2016) Choi, J., Dotter, A., Conroy, C., et al. 2016, ApJ, 823, 102, doi: 10.3847/0004-637X/823/2/102
- Claret & Bloemen (2011) Claret, A., & Bloemen, S. 2011, A&A, 529, A75, doi: 10.1051/0004-6361/201116451
- Corben (1971) Corben, P. M. 1971, Monthly Notes of the Astronomical Society of South Africa, 30, 37
- Corben et al. (1972) Corben, P. M., Carter, B. S., Banfield, R. M., & Harvey, G. M. 1972, Monthly Notes of the Astronomical Society of South Africa, 31, 7
- Crepp et al. (2016) Crepp, J. R., Gonzales, E. J., Bechter, E. B., et al. 2016, ApJ, 831, 136, doi: 10.3847/0004-637X/831/2/136
- Crepp & Johnson (2011) Crepp, J. R., & Johnson, J. A. 2011, ApJ, 733, 126, doi: 10.1088/0004-637X/733/2/126
- Crepp et al. (2014) Crepp, J. R., Johnson, J. A., Howard, A. W., et al. 2014, ApJ, 781, 29, doi: 10.1088/0004-637X/781/1/29
- Crepp et al. (2012) Crepp, J. R., Johnson, J. A., Fischer, D. A., et al. 2012, ApJ, 751, 97, doi: 10.1088/0004-637X/751/2/97
- Crepp et al. (2018) Crepp, J. R., Principe, D. A., Wolff, S., et al. 2018, ApJ, 853, 192, doi: 10.3847/1538-4357/aaa2fd
- Cutri et al. (2003) Cutri, R. M., Skrutskie, M. F., van Dyk, S., et al. 2003, 2MASS All Sky Catalog of point sources.
- Dotter (2016) Dotter, A. 2016, ApJS, 222, 8, doi: 10.3847/0067-0049/222/1/8
- Dotter et al. (2007) Dotter, A., Chaboyer, B., Jevremović, D., et al. 2007, AJ, 134, 376, doi: 10.1086/517915
- Dotter et al. (2008) —. 2008, ApJS, 178, 89, doi: 10.1086/589654
- Dupuy & Liu (2017) Dupuy, T. J., & Liu, M. C. 2017, ApJS, 231, 15, doi: 10.3847/1538-4365/aa5e4c
- Dupuy et al. (2009a) Dupuy, T. J., Liu, M. C., & Ireland, M. J. 2009a, ApJ, 699, 168, doi: 10.1088/0004-637X/699/1/168
- Dupuy et al. (2009b) —. 2009b, ApJ, 692, 729, doi: 10.1088/0004-637X/692/1/729
- Dupuy et al. (2014) —. 2014, ApJ, 790, 133, doi: 10.1088/0004-637X/790/2/133
- Duvert (2016) Duvert, G. 2016, VizieR Online Data Catalog, 2345
- Eggen (1983) Eggen, O. J. 1983, AJ, 88, 813, doi: 10.1086/113368
- Feroz & Hobson (2008) Feroz, F., & Hobson, M. P. 2008, MNRAS, 384, 449, doi: 10.1111/j.1365-2966.2007.12353.x
- Feroz et al. (2009) Feroz, F., Hobson, M. P., & Bridges, M. 2009, MNRAS, 398, 1601, doi: 10.1111/j.1365-2966.2009.14548.x
- Feroz et al. (2013) Feroz, F., Hobson, M. P., Cameron, E., & Pettitt, A. N. 2013, ArXiv e-prints. https://arxiv.org/abs/1306.2144
- Foreman-Mackey (2016) Foreman-Mackey, D. 2016, The Journal of Open Source Software, 24, doi: 10.21105/joss.00024
- Foreman-Mackey et al. (2013) Foreman-Mackey, D., Hogg, D. W., Lang, D., & Goodman, J. 2013, PASP, 125, 306, doi: 10.1086/670067
- Gaia Collaboration et al. (2018) Gaia Collaboration, Brown, A. G. A., Vallenari, A., et al. 2018, ArXiv e-prints. https://arxiv.org/abs/1804.09365
- Golimowski et al. (2004) Golimowski, D. A., Leggett, S. K., Marley, M. S., et al. 2004, 127, 3516, doi: 10.1086/420709
- Hauck & Mermilliod (1998) Hauck, B., & Mermilliod, M. 1998, A&AS, 129, 431, doi: 10.1051/aas:1998195
- Ireland et al. (2008) Ireland, M. J., Mérand, A., ten Brummelaar, T. A., et al. 2008, in Proc. SPIE, Vol. 7013, Optical and Infrared Interferometry, 701324
- Irwin (1961) Irwin, J. B. 1961, ApJS, 6, 253, doi: 10.1086/190066
- Jones et al. (2001–) Jones, E., Oliphant, T., Peterson, P., et al. 2001–, SciPy: Open source scientific tools for Python. http://www.scipy.org/
- Koen et al. (2010) Koen, C., Kilkenny, D., van Wyk, F., & Marang, F. 2010, MNRAS, 403, 1949, doi: 10.1111/j.1365-2966.2009.16182.x
- Kornilov et al. (1996) Kornilov, V., Mironov, A., & Zakharov, A. 1996, Baltic Astronomy, 5, 379, doi: 10.1515/astro-1996-0224
- Lebreton & Goupil (2014) Lebreton, Y., & Goupil, M. J. 2014, A&A, 569, A21, doi: 10.1051/0004-6361/201423797
- Liu et al. (2008) Liu, M. C., Dupuy, T. J., & Ireland, M. J. 2008, ApJ, 689, 436, doi: 10.1086/591837
- Maestro et al. (2013) Maestro, V., Che, X., Huber, D., et al. 2013, MNRAS, 434, 1321, doi: 10.1093/mnras/stt1092
- Mamajek & Hillenbrand (2008) Mamajek, E. E., & Hillenbrand, L. A. 2008, ApJ, 687, 1264, doi: 10.1086/591785
- Mann et al. (2013) Mann, A. W., Gaidos, E., & Ansdell, M. 2013, ApJ, 779, 188, doi: 10.1088/0004-637X/779/2/188
- Mann & von Braun (2015) Mann, A. W., & von Braun, K. 2015, PASP, 127, 102, doi: 10.1086/680012
- Marley & Robinson (2015) Marley, M. S., & Robinson, T. D. 2015, ARA&A, 53, 279, doi: 10.1146/annurev-astro-082214-122522
- Marley et al. (2017) Marley, M. S., Saumon, D., Fortney, J. J., et al. 2017, in American Astronomical Society Meeting Abstracts, Vol. 230, American Astronomical Society Meeting Abstracts #230, 315.07
- Maxted et al. (2015) Maxted, P. F. L., Serenelli, A. M., & Southworth, J. 2015, A&A, 577, A90, doi: 10.1051/0004-6361/201525774
- Mermilliod (1986) Mermilliod, J.-C. 1986, Catalogue of Eggen’s UBV data., 0 (1986)
- Mermilliod & Nitschelm (1989) Mermilliod, J. C., & Nitschelm, C. 1989, A&AS, 81, 401
- Morton (2015) Morton, T. D. 2015, isochrones: Stellar model grid package, Astrophysics Source Code Library. http://ascl.net/1503.010
- Olsen (1983) Olsen, E. H. 1983, A&AS, 54, 55
- Olsen (1993) —. 1993, A&AS, 102, 89
- Olsen (1994) —. 1994, A&AS, 106, 257
- Paxton et al. (2011) Paxton, B., Bildsten, L., Dotter, A., et al. 2011, ApJS, 192, 3, doi: 10.1088/0067-0049/192/1/3
- Paxton et al. (2013) Paxton, B., Cantiello, M., Arras, P., et al. 2013, ApJS, 208, 4, doi: 10.1088/0067-0049/208/1/4
- Paxton et al. (2015) Paxton, B., Marchant, P., Schwab, J., et al. 2015, ApJS, 220, 15, doi: 10.1088/0067-0049/220/1/15
- Peretti et al. (2018) Peretti, S., Ségransan, D., Lavie, B., et al. 2018, ArXiv e-prints, arXiv:1805.05645. https://arxiv.org/abs/1805.05645
- Pickles (1998) Pickles, A. J. 1998, PASP, 110, 863, doi: 10.1086/316197
- Rudy et al. (1996) Rudy, R. J., Rossano, G. S., & Puetter, R. C. 1996, 458, L41, doi: 10.1086/309909
- Rufener (1988) Rufener, F. 1988, Catalogue of stars measured in the Geneva Observatory photometric system : 4 : 1988
- Saumon & Marley (2008) Saumon, D., & Marley, M. S. 2008, ApJ, 689, 1327, doi: 10.1086/592734
- Silva Aguirre et al. (2015) Silva Aguirre, V., Davies, G. R., Basu, S., et al. 2015, MNRAS, 452, 2127, doi: 10.1093/mnras/stv1388
- Spada et al. (2013) Spada, F., Demarque, P., Kim, Y.-C., & Sills, A. 2013, ApJ, 776, 87, doi: 10.1088/0004-637X/776/2/87
- Stassun et al. (2017) Stassun, K. G., Oelkers, R. J., Pepper, J., et al. 2017, ArXiv e-prints. https://arxiv.org/abs/1706.00495
- Stoy (1963) Stoy, R. H. 1963, Monthly Notes of the Astronomical Society of South Africa, 22, 157
- Tayar et al. (2017) Tayar, J., Somers, G., Pinsonneault, M. H., et al. 2017, ApJ, 840, 17, doi: 10.3847/1538-4357/aa6a1e
- ten Brummelaar et al. (2005) ten Brummelaar, T. A., McAlister, H. A., Ridgway, S. T., et al. 2005, ApJ, 628, 453, doi: 10.1086/430729
- Ulrich (1986) Ulrich, R. K. 1986, ApJ, 306, L37, doi: 10.1086/184700
- van Belle & van Belle (2005) van Belle, G. T., & van Belle, G. 2005, PASP, 117, 1263, doi: 10.1086/449603
- van Saders et al. (2016) van Saders, J. L., Ceillier, T., Metcalfe, T. S., et al. 2016, Nature, 529, 181, doi: 10.1038/nature16168
- Vogt et al. (1994) Vogt, S. S., Allen, S. L., Bigelow, B. C., et al. 1994, in Proc. SPIE, Vol. 2198, Instrumentation in Astronomy VIII, ed. D. L. Crawford & E. R. Craine, 362
- von Braun et al. (2014) von Braun, K., Boyajian, T. S., van Belle, G. T., et al. 2014, MNRAS, 438, 2413, doi: 10.1093/mnras/stt2360
- White et al. (2013) White, T. R., Huber, D., Maestro, V., et al. 2013, MNRAS, 433, 1262, doi: 10.1093/mnras/stt802
- Wild (1969) Wild, P. A. T. 1969, Monthly Notes of the Astronomical Society of South Africa, 28, 123