Disorder Induced Suppression of CDW Long Range Order: STM Study of Pd-intercalated ErTe3
Abstract
Pd-intercalated ErTe3 is studied as a model system for the interplay between a bidirectional two component charge density wave (CDW) state and disorder. Using scanning tunneling microscopy (STM), we show that introducing Pd-intercalants (i.e. disorder) disrupts the long-range order of both CDW states via the creation of dislocations, which appear associated with each CDW separately. While for weak disorder both CDW states continue to coexist throughout the sample, with no “domains” of one CDW direction or another, increasing Pd concentration has a stronger effect on the secondary CDW state, manifested in higher density of dislocations. Vestiges of the two distinct CDW phases persist to intercalation levels much above where signatures of the original phase transition are totally suppressed. This study therefore presents a first look into the disruption of multiple 2D strong-coupling CDW states by the proliferation of dislocations.
Introduction - Charge ordered states are a key feature in strongly correlated materials Fradkin et al. (2015); Keimer et al. (2015); Kivelson et al. (2003). For example, the cuprate high temperature superconductors exhibit various signatures of charge-ordering and fluctuating order, raising the question of their impact on the occurrence and nature of superconductivity. While notionally “charge order” refers to states that spontaneously break the spatial symmetries of the host crystal, the presence of unavoidable quenched disorder, even in the cleanest materials, frequently precludes true long-range order. This, and the fact that the magnitude of the resulting ion displacements are relatively small, delayed the identification of such order in the cuprates with traditional methods, such as X-ray scattering, even though evidence of local order was deduced earlier from Scanning Tunneling Microscopy (STM) and Spectroscopy (STS) studies Howald et al. (2003); Hoffman et al. (2002); McElroy et al. (2005). Moreover, since quenched disorder always precludes any long-range-ordered incommensurate charge density wave (CDW) state Imry and Ma (1975), it proved difficult to infer the exact form of symmetry breaking that would take place in the “ideal,” zero disorder limit in these systems Robertson et al. (2006); Del Maestro et al. (2006), a question that may have far reaching implications for the nature of the electronic state in many other correlated electron systems.
More generally, because charge order is so sensitive to quenched randomness, it is extremely important to complement spatially averaged information obtained from transport or diffraction measurements, with information from local probes. Thus, to shed light on this issue, we turn here to a model system which mimics certain aspects of the main features of the charge ordering phenomena of the cuprates, where a fairly solid understanding of the theory of the pure system exists (see Nie et al. (2014) and supplementary Information of Jang et al. (2016)), and disorder can be introduced in a controlled fashion and its effects studied using both global (scattering and transport) and local (STM) probes.
It was recently suggested that Pd-intercalated RTe3 (R = rare earth element) might be such a model system He et al. (2016); Lou et al. (2016); Straquadine and Fisher (2019). Here we explicitly study the case R = Er. The pristine (un-intercalated) compound undergoes two successive mutually perpendicular unidirectional incommensurate CDW phase transitions, with critical temperature K, and K respectively Ru et al. (2008). (At low temperatures, this phase with two co-existing, but different, CDWs is called bidirectional.) In particular, Straquadine et al. demonstrated that signatures of the two phase transitions in pristine ErTe3 are rapidly smeared and suppressed by Pd intercalation, consistent with a scenario in which the dominant effect arises from disorder induced by the intercalant atoms Straquadine and Fisher (2019).
In this paper we present a low-temperature scanning tunneling microscopy study of the effects of disorder on the two orthogonal components of the incommensurate CDW order in Pd-intercalated ErTe3. This allows us to obtain clear insight into the nature of the interplay between the two components of the order, the relation between the fundamental density wave order and composite orientational (“vestigial nematic” Nie et al. (2014)) order, and the role of topological defects (dislocations) in all these phenomena. Our principal results are: i) Both of the two perpendicular CDWs resolved by the STM are consistent with bulk measurements Moore et al. (2010); Straquadine and Fisher (2019), including the fact that the wavelengths in the two directions are slightly but significantly different from each other. ii) Both CDW components coexist throughout the sample, whether in the absence or presence of disorder, consistent with the intrinsically bidirectional character of the low temperature CDW order. However, the CDW associated with the larger gap and is dominant. iii) Introducing Pd-intercalants disrupts the long-range order of both components of the CDW via the creation of both phase disorder and dislocations (primarily dislocation pairs), which appear associated with each component separately. This has a stronger disruptive effect on the secondary CDW, which has a greater number of dislocations than the dominant component. iv) In the presence of disorder, nematic order is preserved over much longer length scales than the CDW order itself, consistent with there being nematic long range order Nie et al. (2014); Jang et al. (2016). For example, at weak disorder (our lowest intercalation sample of 0.3%), there are typically no dislocations in the “stronger” component of the CDW order (within the scan range), which we suggest indicates the first observation of a “nematic Bragg Glass” phase Feigel’man et al. (1989); Nattermann (1990); Bouchaud et al. (1991); Giamarchi and Le Doussal (1995); Gingras and Huse (1996); Okamoto et al. (2015) in a CDW system. v) None-the-less, vestiges of the two distinct CDW phases persist all the way to 5% Pd-intercalation, far beyond where signatures of the smeared phase transitions are observed in bulk probes.
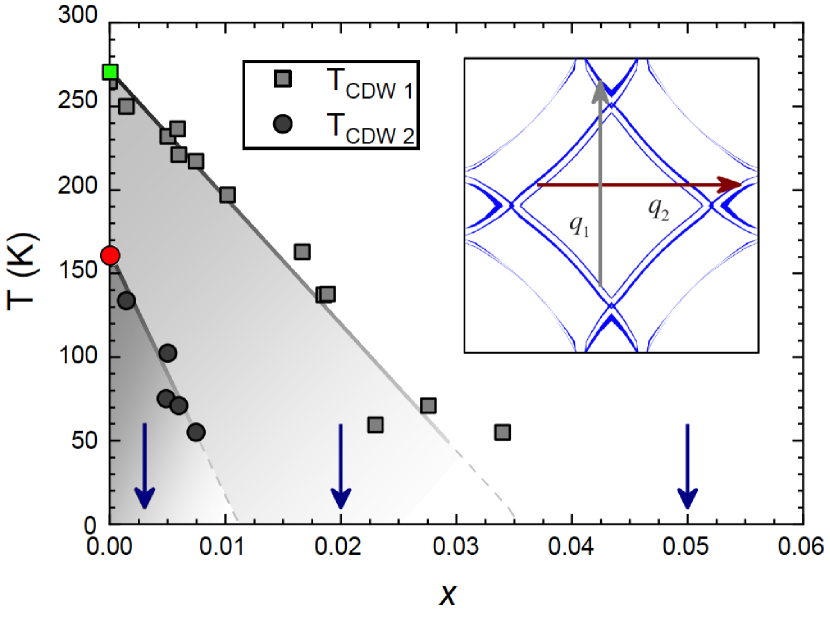
ErTe3 belongs to the RTe3 (R = rare-earth) family of quasi-2D metals which exhibit unidirectional incommensurate charge density wave states DiMasi et al. (1995); Ru and Fisher (2006); Fang et al. (2007); Ru et al. (2008). It is formed in the orthorhombic space group Norling and Steinfink (1966), and contains double layers of nominally square Te planes separated by RTe block layers. Orthorhombicity is derived from a glide plane stacking of these tetragonal layers which determine the electronic properties of this system at high temperatures. A unidirectional CDW was first detected in this system by transmission electron microscopy (TEM) DiMasi et al. (1995). Further studies of angle resolved photoemission spectroscopy (ARPES) have shown that large portions of the Fermi surface (FS) nested by are indeed gapped Brouet et al. (2004). Scanning tunneling microscopy (STM) and spectroscopy (STS) established the fully incommensurate nature of the CDW in TbTe3, while also revealing an additional CDW ordering perpendicular to the principal one Fang et al. (2007), but weaker in amplitude. Subsequent ARPES studies on ErTe3 established that two incommensurate CDW gaps are created in two step transitions by perpendicular FS nesting vectors Moore et al. (2010). Despite the near-nesting conditions that result in gapping of a substantial portion of the Fermi surface in the CDW state, several factors indicate that strong coupling effects unrelated to Fermi surface nesting play a role Johannes and Mazin (2008). Some evidence for such a perspective might be found in the large values of ( and for the first and second CDW respectively) Varma and Simons (1983), though several other factors can also yield such an effect. More convincingly, high-energy-resolution inelastic x-ray scattering investigation of TbTe3 revealed strong phonon softening and increased phonon linewidths over a large part in reciprocal space adjacent to the CDW ordering vector, thus showing momentum-dependent electron-phonon coupling Maschek et al. (2015). Resistivity measurements resolved in the two perpendicular in-plane directions in pristine ErTe3 show a kink at each of the CDW transitions, and it was observed that the introduction of Pd intercalation broadens and suppresses both features to lower temperatures (see Fig. 1).
Experiment -
PdxErTe3 with were grown using a Te self-flux as described elsewhere for pure RTe3 compounds Ru and Fisher (2006), with the addition of small amounts of Pd to the melt Straquadine and Fisher (2019). The resulting Pd concentration was determined by electron microprobe analysis.
Three levels of intercalation were studied: 0.3%, 2% and 5% (marked in Fig. 1). Prior to STM measurements, samples were characterized as described in Straquadine and Fisher (2019).
STM was performed with a hybrid UNISOKU-USM1300 system constructed with a home-made ultra high vacuum sample preparation and manipulation system. The samples were cleaved at room temperature at pressures of low torr and immediately transferred to the low temperature STM. Topography was performed at K, with typical tunneling parameters of =50-100 mV and I=100-300 pA.
Results and Discussion - The phase diagram in Fig. 1 shows that the weaker CDW state along the -axis is more sensitive to disorder. Its “transition temperature” is suppressed quickly as increases, and extrapolates to zero around . Thus, samples with low levels of intercalants should be an excellent starting point to observe the effect of weak disorder on both transitions.
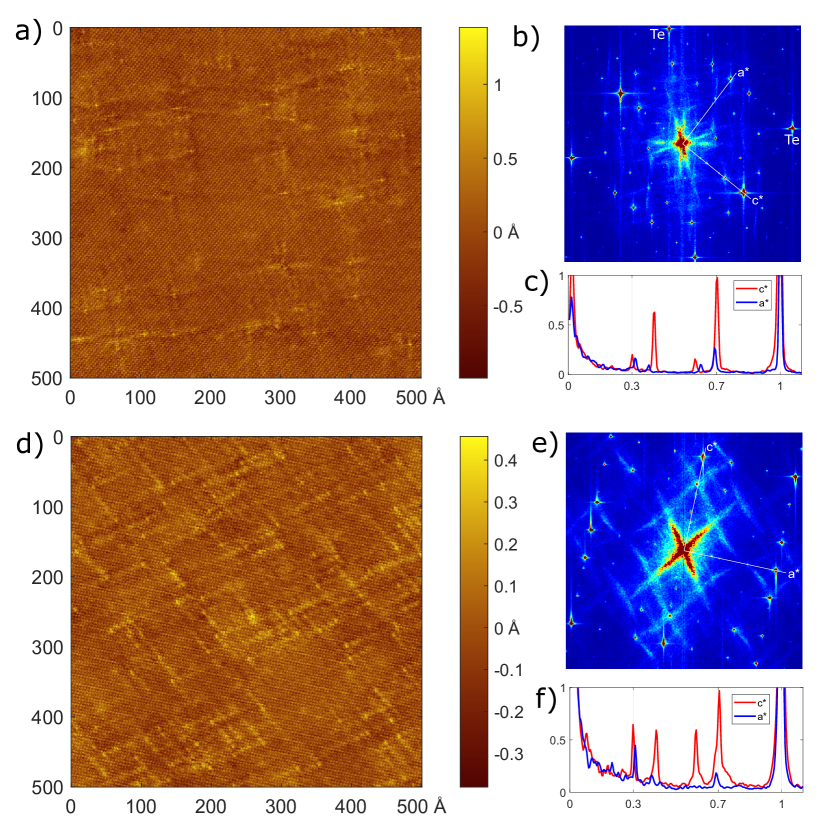
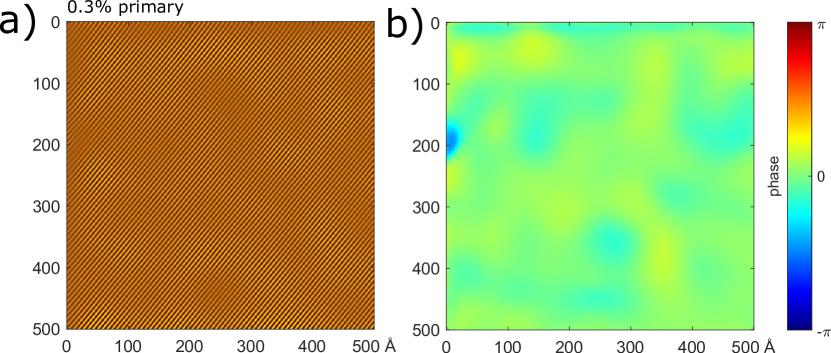
Fig. 2a shows a topography of a sample. The features visible are an atomic corrugation, CDW corrugations, as well as small lumps on the surface, often with a skewed “” pattern around them. The lumps, which with simple counting roughly agree with the intercalation density, are only a fraction of an angstrom high, and thus must arise from sub-surface intercalants rather than surface Pd atoms. Single-crystal x-ray diffraction on the same crystals confirmed the increase in the -axis lattice constant consistent with Pd atoms intercalating between the van der Waals bonded Te bilayer Straquadine and Fisher (2019). DFT calculations also show this to be the most favorable location for intercalation He et al. (2016). No surface Pd atoms were observed for low intercalations, presumably due to the high volatility of the Pd atoms upon cleaving at room temperature.
Much of the analysis of the CDW and effects of disorder, are done via the Fourier transform (FFT) of the topographic data, as in Fig. 2b. The dominant CDW generates a series of very sharp peaks from the origin to both lattice points corresponding to the RTe block layer crystal structure. As in previous STM and X-ray studies of the parent compound Fang et al. (2007); Yao et al. (2006); Ru and Fisher (2006), there are four characteristic CDW points due to mixing with the lattice of , , and . (In this material, the four-fold symmetry is broken by a glide plane, rendering the structure weakly orthorhombic; in the standard setting for the orthorhombic space group, the wavevector of the primary CDW lies along the c-axis.) To identify and distinguish the two perpendicular CDWs, we take line cuts in the FFT data from the origin to either the a* (blue) or c* (red) lattice points. (Fig. 2c) We see a set of peaks with , , etc., and another set with , , etc. (The uncertainty is approximately , or one FFT pixel, in our 100 nm scans.) Based on the wavelength alone, we can identify the former with the “first”, or higher Tc, CDW which forms in the c-axis and breaks the nearly four-fold symmetry of the material Ru et al. (2008); Brouet et al. (2008); Moore et al. (2010). The latter set of peaks is the “second” CDW transition which occurs at lower temperatures, and is the one that shows a weaker signal in diffraction measurements and disappears first with rising temperature or intercalation level Straquadine and Fisher (2019). In our STM data, depending on many factors such as tunneling parameters, tip condition, and scan location, the relative amplitudes of the four peaks within one line scan can vary. However, it is generally true that the CDW1 signal is always stronger everywhere in the sample, thus giving the visual impression of a unidirectional CDW. We also note the presence of strong satellite peaks at . The CDW exists in the Te plane, and its signal is strongly modulated by this lattice (). Similar strong satellites were also seen in STM data of pristine TbTe3 Fang et al. (2007).
Next we present the effects of a higher level of intercalation, where the secondary CDW is expected (from resistivity data) to be absent. Data for intercalation is shown in Fig. 2d-f. Similar to the , we note the lack of surface Pd atoms. There also exists the same sub-angstrom lumps, the “” pattern, and their greater abundance is in accordance with with the higher intercalation level. However, even at this intercalation level, signatures of both CDWs are present, with the second CDW having a lower amplitude, as also seen in the low temperature X-ray data of Straquadine and Fisher (2019)
Unlike the parent compound, the presence of intercalants creates additional features in the topography and FFT due to quasiparticle scattering interference (QPI). In real space, this manifests itself as the streaks that emanate from some of the “lumps” in a skewed “” pattern. In Fourier space, it manifests as a compressed “” at the origin, which is biased in the c* direction in the sample, and may reflect the broken 4-fold symmetry via two different CDW gaps Moore et al. (2010). In the sample there are two of these features, perpendicularly overlapped. This “”, as well as the other streaks in the FFT most likely come from quasiparticle scattering along un-gapped portions of the Fermi surface, which generally run 45 degrees to the CDW vectors. (See Fig. 1)
To analyze the effect of the impurities on the CDW, we filter the data in Figs. 2a,d around the (or ) point and plot it in Figs. 3a,c,e. Highlighted in the red rectangle, and further zoomed in the upper corner, is a dislocation (with no neighbors within 100 Å) for the sample, and a pair of dislocations for the sample. Two CDW stripes merge into one, and within a few tens of angstroms, the opposite occurs. The result is that outside of this region, the two dislocations cancel out and the total number of CDW stripes is conserved. The effect is further quantified when we do a variant of the Fujita-Lawler analysis of a localized Fourier transform in order to get the phase of the CDW Lawler et al. (2010); Fang et al. (2018). This is shown in Figs. 3b,d,f. Taking a closed-path around each of the dislocations, the phase picks up 2, but outside the pair, the phase is continuous. In the sample, there are few dislocations within the (500 Å)2 scan range for the secondary CDW (Fig. 3b), and typically no dislocations for the primary CDW (shown in the Supplementary sup ). As explained in the theoretical discussion in the Supplemental Materials, this is consistent with it being in a stripe-glass phase, which is a variant of the Bragg glass phase Giamarchi and Le Doussal (1995). For the sample, there are overall more dislocations (Figs. 3d,f), with the secondary CDW having slightly more than the primary (indicating a shorter correlation length). (Significantly, the dislocations in the two perpendicular directions appear uncorrelated.)
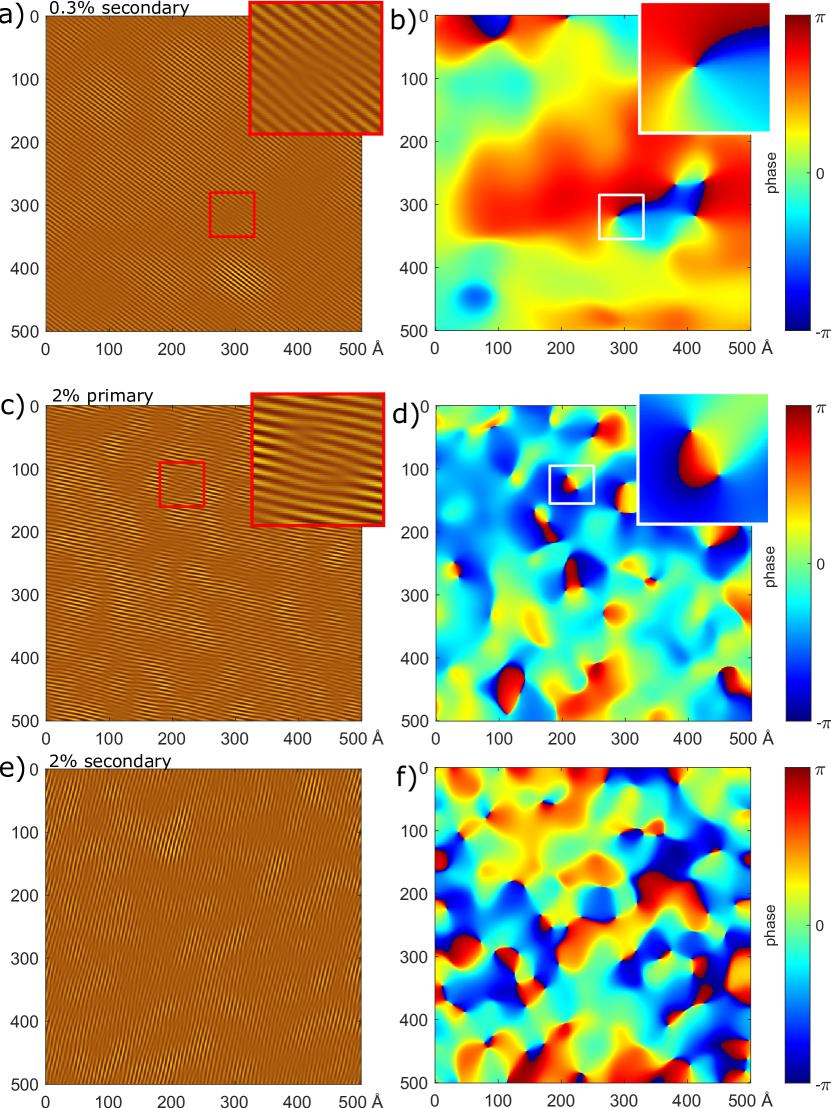
We see phase variations over length scales of tens of Å in the and samples, which represent mild distortions in the CDW from the impurities (even if there is no dislocation). Within our scan ranges, there are no domains of exclusively one CDW direction over the other, which rules out unidirectional (stripe) phases in favor of bidirectional.
Finally, we discuss the Pd-intercalation sample, where Fig. 1 would suggest that remnants of both CDW phase transitions are completely suppressed. Fig. 4a shows a topographic image of the Pd-intercalation sample taken at 1.7 K. It is qualitatively different than the lower intercalation samples, lacking the skewed “” pattern, but still having sub-Å height modulations with small length-scale corrugations. We typically observe an adatom on the surface approximately once every 30 nm, of height a few Å, which occasionally moves or causes a tip reconstruction. This limits our scan size and therefore FFT resolution.
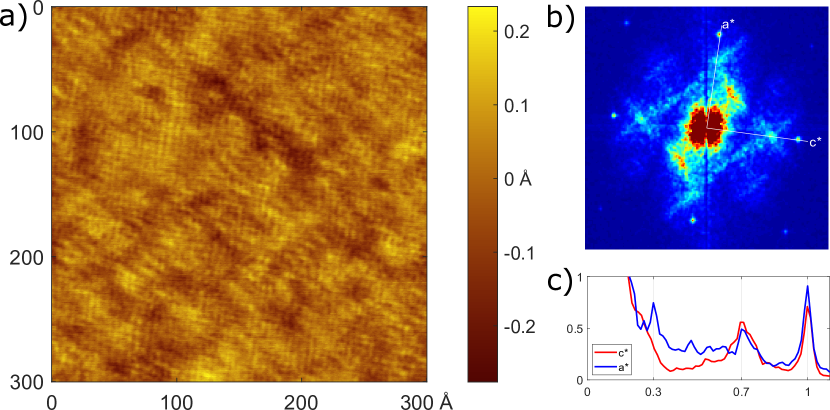
Examination of the FFT (Fig. 4b) reveals that the typical CDW peaks that appeared at lower Pd concentrations are now significantly broadened, as shown in the line cuts (Fig. 4c). In particular, no sharp -space points were seen in X-ray and electron diffraction measurements at intermediate temperatures (95 K) Straquadine and Fisher (2019). Instead, broad and diffuse streaks were seen spanning between the original CDW points, indicating 2 dimensional short range correlations that are consistent with the q-dependent susceptibility. What could be these same streaks appear in our data between the CDW points as well. In fact, the visible corrugations seen in the topograpahy are due to these streaks plus the broad CDW peaks, and not the atomic lattice, although the lattice points are well-defined in the FFT.
This short range CDW order likely originates from CDW fluctuations pinned by the disorder as the sample is cooled to the STM working temperature Kivelson et al. (2003). A similar observation was reported for the CDW system NbSe2 Arguello et al. (2014)
Conclusions - Large area STM scans of Pd-intercalated ErTe3 allow for a direct comparison with diffraction data. High spatial resolution local measurements probe the origin of the destruction of the two distinct, mutually perpendicular, incommensurate CDW orders that coexist in the parent material. The Pd intercalants, which are local on the atomic scale, create a larger concentration of dislocations in the secondary CDW. Proliferation of dislocations is the driving mechanism by which the long range order of the CDW state is destroyed. Even without CDW order, there is a large degree of orientational long-range (nematic) order. Upon increased levels of intercalation and thus increased disorder, only very short range CDW order persists. Finally, the fact that at the lowest disorder levels, we observe dislocations in CDW2 but not CDW1 is suggestive of the existence of a nematic glass phase - a specific version of a “Bragg glass.”
Acknowledgments: This work was supported by the U. S. Department of Energy (DOE) Office of Basic Energy Science, Division of Materials Science and Engineering at Stanford under contract No. DE-AC02-76SF00515. JS is supported by an ABB Stanford Graduate Fellowship. Various parts of the STM system were constructed with support from the Army Research Office (ARO), grant No. W911NF-12-1-0537 and by the Gordon and Betty Moore Foundation through Emergent Phenomena in Quantum Systems (EPiQS) Initiative Grant GBMF4529.
References
- Fradkin et al. (2015) E. Fradkin, S. A. Kivelson, and J. M. Tranquada, Rev. Mod. Phys. 87, 457 (2015).
- Keimer et al. (2015) B. Keimer, S. A. Kivelson, M. R. Norman, S. Uchida, and J. Zaanen, Nature 518, 179 EP (2015).
- Kivelson et al. (2003) S. A. Kivelson, I. P. Bindloss, E. Fradkin, V. Oganesyan, J. M. Tranquada, A. Kapitulnik, and C. Howald, Rev. Mod. Phys. 75, 1201 (2003).
- Howald et al. (2003) C. Howald, H. Eisaki, N. Kaneko, M. Greven, and A. Kapitulnik, Phys. Rev. B 67, 014533 (2003).
- Hoffman et al. (2002) J. E. Hoffman, E. W. Hudson, K. M. Lang, V. Madhavan, H. Eisaki, S. Uchida, and J. C. Davis, Science 295, 466 (2002), http://science.sciencemag.org/content/295/5554/466.full.pdf .
- McElroy et al. (2005) K. McElroy, D.-H. Lee, J. E. Hoffman, K. M. Lang, J. Lee, E. W. Hudson, H. Eisaki, S. Uchida, and J. C. Davis, Phys. Rev. Lett. 94, 197005 (2005).
- Imry and Ma (1975) Y. Imry and S.-k. Ma, Phys. Rev. Lett. 35, 1399 (1975).
- Robertson et al. (2006) J. A. Robertson, S. A. Kivelson, E. Fradkin, A. C. Fang, and A. Kapitulnik, Phys. Rev. B 74, 134507 (2006).
- Del Maestro et al. (2006) A. Del Maestro, B. Rosenow, and S. Sachdev, Phys. Rev. B 74, 024520 (2006).
- Nie et al. (2014) L. Nie, G. Tarjus, and S. A. Kivelson, Proceedings of the National Academy of Sciences 111, 7980 (2014).
- Jang et al. (2016) H. Jang, W. S. Lee, H. Nojiri, S. Matsuzawa, H. Yasumura, L. Nie, A. V. Maharaj, S. Gerber, Y. J. Liu, A. Mehta, D. A. Bonn, R. Liang, W. N. Hardy, C. A. Burns, Z. Islam, S. Song, J. Hastings, T. P. Devereaux, Z. X. Shen, S. A. Kivelson, C. C. Kao, D. Zhu, and J. S. Lee, Proceedings of the National Academy of Sciences 113, 14645 (2016).
- He et al. (2016) J. He, P. Wang, H. Yang, Y. Long, L. Zhao, C. Ma, M. Yang, D. Wang, X. Shangguan, M. Xue, P. Zhang, Z. Ren, J. Li, W. Liu, and G. Chen, Superconductor Science and Technology 29, 065018 (2016).
- Lou et al. (2016) R. Lou, Y. Cai, Z. Liu, T. Qian, L. Zhao, Y. Li, K. Liu, Z. Han, D. Zhang, J. He, G. Chen, H. Ding, and S. Wang, Phys. Rev. B 93, 115133 (2016).
- Straquadine and Fisher (2019) J. A. W. Straquadine and I. R. Fisher, “Suppression of charge density wave order by disorder in Pd-intercalated ErTe3,” (2019), preprint.
- Ru et al. (2008) N. Ru, C. L. Condron, G. Y. Margulis, K. Y. Shin, J. Laverock, S. B. Dugdale, M. F. Toney, and I. R. Fisher, Phys. Rev. B 77, 035114 (2008).
- Moore et al. (2010) R. G. Moore, V. Brouet, R. He, D. H. Lu, N. Ru, J.-H. Chu, I. R. Fisher, and Z.-X. Shen, Phys. Rev. B 81, 073102 (2010).
- Feigel’man et al. (1989) M. V. Feigel’man, V. B. Geshkenbein, A. I. Larkin, and V. M. Vinokur, Phys. Rev. Lett. 63, 2303 (1989).
- Nattermann (1990) T. Nattermann, Phys. Rev. Lett. 64, 2454 (1990).
- Bouchaud et al. (1991) J.-P. Bouchaud, M. Mézard, and J. S. Yedidia, Phys. Rev. Lett. 67, 3840 (1991).
- Giamarchi and Le Doussal (1995) T. Giamarchi and P. Le Doussal, Phys. Rev. B 52, 1242 (1995).
- Gingras and Huse (1996) M. J. Gingras and D. A. Huse, Physical Review B 53, 15193 (1996).
- Okamoto et al. (2015) J.-i. Okamoto, C. J. Arguello, E. P. Rosenthal, A. N. Pasupathy, and A. J. Millis, Phys. Rev. Lett. 114, 026802 (2015).
- Ru and Fisher (2006) N. Ru and I. R. Fisher, Phys. Rev. B 73, 033101 (2006).
- DiMasi et al. (1995) E. DiMasi, M. C. Aronson, J. F. Mansfield, B. Foran, and S. Lee, Phys. Rev. B 52, 14516 (1995).
- Fang et al. (2007) A. Fang, N. Ru, I. R. Fisher, and A. Kapitulnik, Phys. Rev. Lett. 99, 046401 (2007).
- Norling and Steinfink (1966) B. K. Norling and H. Steinfink, Inorganic Chemistry 5, 1488 (1966).
- Brouet et al. (2004) V. Brouet, W. L. Yang, X. J. Zhou, Z. Hussain, N. Ru, K. Y. Shin, I. R. Fisher, and Z. X. Shen, Phys. Rev. Lett. 93, 126405 (2004).
- Johannes and Mazin (2008) M. D. Johannes and I. I. Mazin, Phys. Rev. B 77, 165135 (2008).
- Varma and Simons (1983) C. M. Varma and A. L. Simons, Phys. Rev. Lett. 51, 138 (1983).
- Maschek et al. (2015) M. Maschek, S. Rosenkranz, R. Heid, A. H. Said, P. Giraldo-Gallo, I. R. Fisher, and F. Weber, Phys. Rev. B 91, 235146 (2015).
- Yao et al. (2006) H. Yao, J. A. Robertson, E.-A. Kim, and S. A. Kivelson, Phys. Rev. B 74, 245126 (2006).
- Brouet et al. (2008) V. Brouet, W. L. Yang, X. J. Zhou, Z. Hussain, R. G. Moore, R. He, D. H. Lu, Z. X. Shen, J. Laverock, S. B. Dugdale, N. Ru, and I. R. Fisher, Phys. Rev. B 77, 235104 (2008).
- Lawler et al. (2010) M. J. Lawler, K. Fujita, J. Lee, A. R. Schmidt, Y. Kohsaka, C. K. Kim, H. Eisaki, S. Uchida, J. C. Davis, J. P. Sethna, and E.-A. Kim, Nature 466, 347 EP (2010).
- Fang et al. (2018) A. Fang, C. Adamo, S. Jia, R. J. Cava, S.-C. Wu, C. Felser, and A. Kapitulnik, Science Advances 4, eaaq0330 (2018).
- (35) See Supplemental Material at http://link.aps.org/ supplemental/xxx for details.
- Arguello et al. (2014) C. J. Arguello, S. P. Chockalingam, E. P. Rosenthal, L. Zhao, C. Gutiérrez, J. H. Kang, W. C. Chung, R. M. Fernandes, S. Jia, A. J. Millis, R. J. Cava, and A. N. Pasupathy, Phys. Rev. B 89, 235115 (2014).
- Kivelson and Emery (2000) S. Kivelson and V. Emery, in STRIPES AND RELATED PHENOMENA, SELECTED TOPICS IN SUPERCONDUCTIVITY, edited by Bianconi, A and Saini, NL (2000) pp. 91–100, 2nd International Conference on Stripes and High Tc Superconductivity, ROME, ITALY, JUN 02-06, 1998.
Supplemental Material for:
Disorder Induced Suppression of CDW Long Range Order: STM Study of Pd-intercalated ErTe3
Alan Fang,1,2,3 Joshua A. W. Straquadine,2,3 Ian R. Fisher,1,2,3 Steven A. Kivelson,1,2,4 and Aharon Kapitulnik1,2,3,4
I I. MATERIALS AND EXPERIMENTAL METHODS
In this section we provide details on the experimental methods and the analyses of the experimental data.
I.1 Single Crystals Growth and Characterization
PdxErTe3 with were grown using a Te self-flux as described elsewhere for pure RTe3 compounds Ru and Fisher (2006), with the addition of small amounts of Pd to the melt Straquadine and Fisher (2019). Plate-shaped crystals (-axis normal to the plane) 1-3 mm across were routinely produced. Microprobe chemical analysis was used to determine the amount of Pd incorporation into the samples, while the decrease in crystals thickness from several hundred microns for to approximately 50 microns for x = 0.05 served as evidence that Pd atoms act as intercalants between the weakly-coupled Te planes. Resistivity and magnetic susceptibility were used to track the transition temperature and sharpness of the two unidirectional CDW phases, and the emergence of superconductivity with increasing intercalation level. Single-crystal x-ray diffraction was used to determine the lattice parameters, and in particular the relation between intercalation and the increase in the -axis lattice constant as a result of the Pd intercalation. The - and in-plane lattice parameters are unchanged within experimental error, arguing against chemical substitution of Pd on the Er site, as the smaller radius of Pd ions would be expected to compress the lattice in-plane. A detailed description of sample preparation, characterization and the effect of Pd intercalation on the bulk properties are given in Straquadine and Fisher (2019).
I.2 Scanning Tunneling Microscopy and Spectroscopy Measurements
The apparatus -
Scanning tunneling microscopy (STM) was performed with a hybrid UNISOKU USM1300 system (base temperature 370 mK) plus home-made Ultra High Vacuum (UHV) sample preparation and manipulation system. The samples were cleaved at room temperature and at pressures of low torr and immediately transferred to the low temperature STM. Topography was performed at 1.7 K with typical tunneling parameters of =50-100 mV, I=100-300 pA, and scan sizes up to 100 nm with atomic resolution.
Additional Data on Analysis of Dislocations-
As explained in the main text, to analyze the effect of the impurities on the CDW, we filter the topographic data around the (or ) point to obtain a real-space representation of the CDW. To highlight distortion and dislocations, we employ a variant of the Fujita-Lawler analysis of a localized Fourier transform in order to get the phase of the CDW Lawler et al. (2010); Fang et al. (2018). Not shown in the main body of the paper is this analysis for the 0.3% primary CDW, which lacks dislocations. (Fig. S1) Note the un-interrupted CDW, and the fairly uniform phase. (It is possible that a dislocation exists beyond the left of the scan area)
II II. Theoretical Background
In this section we provide a summary of the theoretical background behind our analyses of the experimental data. It sketches an effective field theory of two component CDW order in the presence of quenched randomness. In reality, the crystals involved are slightly orthorhombic, but this seems to be a very small effect so we will consider an idealization in which the crystal is taken to be tetragonal and the orthorhombicity – when included at all – will be represented as an infinitesimal external symmetry breaking field.
II.1 Reviewing the phase diagram in the clean limit
In the absence of disorder (or the best achievable approximation to this limit) the phase diagram in the and chemical pressure shows three distinct phases: a uniform (no CDW) phase for , a phase with “bidirectional” CDW order, but with distinctly different strengths and slightly different ordering vectors for the two CDW components at , and a “unidirectional” CDW for intermediate temperatures . Both CDW phases break the tetragonal point-group symmetry, and in this sense have a nematic component.
Since the two transitions are separated from each other, it is reasonable to treat them separately. However, since the various ordering tendencies get both truncated and scrambled when disorder is introduced, we would like to treat them from the perspective of a single, unified effective field theory. Moreover, it is observed that as a function of increasing , the two lines tend to approach one another, so that for the case of ErTe3 studied here (which has the largest effective - i.e. the smallest lattice constant of any of the stoichiometric tri-tellurides studied to date) . We would thus like to think that this allows us to organizing our thinking about a putative multicritical point at and at which these two lines would meet at slightly higher pressure, i.e. .
The nature of such a multicritical point in a tetragonal system is already somewhat unusual. To see this, consider the lowest order effective (Landau) potential as a function of the two components of the CDW order represented by two complex scalar fields, and . To the extent that the crystal can be treated as approximately tetragonal, the effective Hamiltonian density, , is symmetric under discrete rotations (and other point group interactions) that exchange and . (The weak effect of the subtle orthorhombicity of the actual crystal structure can be modeled as a small symmetry breaking term of the form .)
II.2 theory of stripe and nematic phases
To fourth order in the fields, the effective potential is
where we have assumed that the quartic term is positive and have normalized the fields such that its strength is unity.
The phase diagram in the plane that results from minimizing this effective potential (i.e. Landau theory) is shown in Fig. S2a. For , there is a second-order transition to a stripe ordered CDW phase as changes from positive to negative values, while for the transition is to a checkerboard state. In the stripe phase, either the thermal average of is non-zero and or the converse; in addition to breaking translational symmetry in one direction, this phase strongly breaks the rotational symmetry that interchanges the two components of the order parameter. In the checkboard phase, the thermal averages of and are not only non-zero, but of equal magnitude; this state breaks translation symmetry in both directions but leaves an unbroken rotational symmetry. The point is a bicritical point, below which, as a function of , there is a first order boundary between the stripe and checkerboard phases. Fluctuation effects for an effective Landau-Ginzburg-Wilson model with this form of the effective potential have been considered elsewhere - see especially in Nie et al. (2014). In addition to their effects on critical exponents, these can lead to additional subtleties in the nature of the phase diagram and even to additional phases making their appearances; for instance, in a quasi-2D system, there can be a narrow strip between the stripe ordered phase and the fully symmetric phase in which CDW order is melted but in which vestigial symmetry breaking persists, giving rise to a vestigial nematic phase.
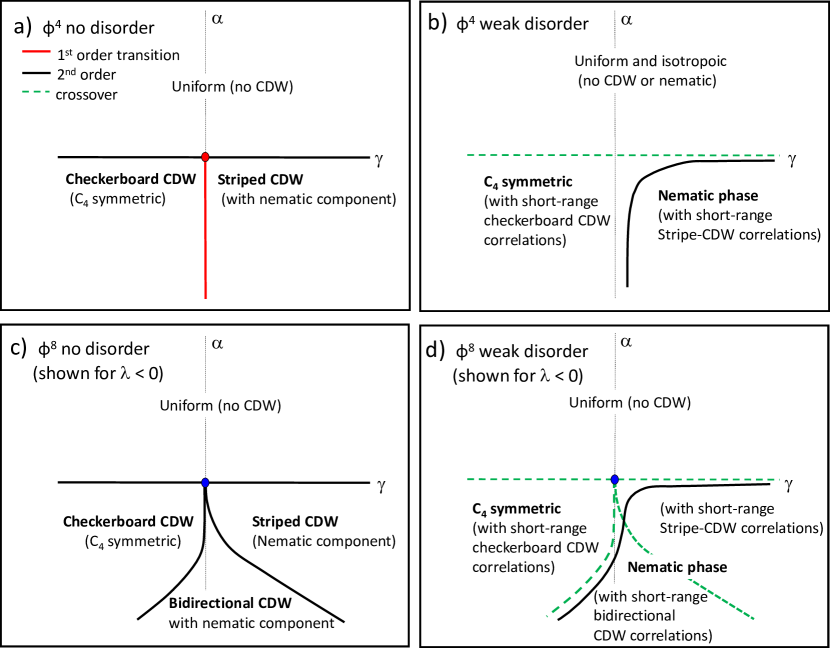
More interesting is what happens to this phase diagram in the presence of weak but non-negligible disorder. Here (in ) no incommensurate CDW long-range order is possible, which likely implies that the CDW transitions are all replaced by crossover lines separating regions with little in the way of CDW correlations from regions with substantial intermediate range CDW order. (An interesting possibility, which we will ignore for now but to which we will return below, is that for weak enough disorder there could exist a Bragg glass phase with power-law CDW order and no unbound dislocations Giamarchi and Le Doussal (1995); Gingras and Huse (1996).) However, as shown in Ref. Nie et al. (2014)(and as would anyway be expected on general grounds) the nematic component of the stripe order persists up to a non-vanishing critical disorder strength. The shape of the phase boundary follows from continuity - in the limit that the disorder strength tends to zero, this boundary must coincide with the phase boundary of whatever CDW phase has a nematic component. Thus, the phase diagram in the presence of weak disorder becomes that in Fig. S2b, where the dashed lines indicate crossovers and the solid black line bounds the nematic phase.
II.3 theory and the nematic bidirectional CDW phase
Manifestly, the theory is inadequate, in that it is missing one phase that is observed in experiments (the nematic bidirectional CDW), and yet has one implied phase (the checkerboard CDW) not seen in experiments. While we can always imagine that the checkerboard CDW is lurking, as yet undiscovered, in the large reaches of the phase diagram, the missing bidirectional phase is something that needs to be addressed.
Even in the case of pure ErTe3, is smaller than by a substantial factor, so at temperatures in the neighborhood of there is no justification for assuming that is small; there is thus no reason to keep only low order terms in powers of the field in the effective field theory. Indeed, away from the putative multicritical point, it is legitimate to treat the two clean-limit transitions in terms of two distinct effective field theories. Let us consider the case where we are well below , where the value of either or is not small, but above , and even slightly below it, the subdominant component is a legitimate expansion parameter. It is convenient to carry out the expansion of the effective potential in a way that is still manifestly invariant. We thus define new quantities as follows: and . Translational symmetry implies that the free energy must be independent of and , and the tetragonal symmetry implies that the free energy must be invariant under and . We can therefore in complete generality express the effective potential in terms of the two quantities and , such that near , is small. We thus expand in powers of giving
| (2) |
where (noting explicitly for future use all terms of order up to order and using the same conventions for the low order terms as above)
| (3) |
| (4) |
| (5) |
In the neighborhood of , is already large and does not change much in magnitude, so we can focus exclusively on . For , is minimal for i.e. we are in the stripe phase, while for the minimum is at i.e. we are in the checkerboard phase. (Here means the value of mod chosen to lie in the interval .) The shape of this intermediate regime depends on the sign of . For (the case illustrated in Fig. S2c), in the interval ,
| (6) |
Thus, the boundary between the stripe phase and the nematic bidirectional CDW phase (i.e. the line that implicitly defines ) occurs where , while the boundary between the nematic bidirectional CDW phase and the checkerboard phase occurs where . On the other hand, for , the stripe phase persists as long as . Thus, is defined by the condition , while the transition to the checkerboard phase occurs where . In both cases, all transitions are continuous.
For simplicity, this discussion was carried through in the case in which is well separated from . However, clearly the same considerations apply even as they approach each other at the multicritical point, . All that is different here is that the size of the intermediate nematic bidirectional CDW phase, which is bounded by , and thus gets to be parametrically small, as shown in Fig. S2c. Here, approximating these terms by their leading order expressions in powers of , we infer that the intermediate phase occurs for a range of such that .
It is interesting to note that the instability of the bicritical point seen in the treatment and its substitution by this peculiar tetracritical point appears to be inevitable - at least at the level of mean-field theory. We have not explicitly carried out the analogous treatment of fluctuation effects and the effects of disorder in the resulting theory as was carried out for the theory. Away from the multicritical point, however, more or less the same considerations apply, leading to the (conjectural) phase diagram shown in Fig. S2d in the presence of weak disorder.
Indeed, at the conjectural level, it is reasonable to propose that as a function of and disorder strength , one would expect a phase diagram with the general topology shown in Fig. S3. Here, the inset shows a portion of the clean limit phase diagram (plotted in the plane, where should be considered a proxy for ) and the dotted red line shows a trajectory through this diagram at fixed such that there are the two requisite transitions at and . The main figure assumes the same fixed but shows a putative phase diagram in the plane. Phases with CDW long-range order are confined to the axis. However, in just the same way as previously discussed, Nie et al. (2014) the disorder leaves us with a nematic transition, represented by the solid black line in the figure, that survives up to a critical value of , defined as the point at which the nematic critical temperature goes to 0. Strong local CDW correlations persist to finite disorder, vanishing with increasing or via a crossover that can be roughly identified with the nematic transition line although surely some local correlations survive arbitrarily far beyond this. No other symmetries are broken upon decreasing , so what was at becomes a crossover line, (which is only sharply defined for arbitrarily weak disorder) below which a second component of the local CDW correlations should be apparent. (This is indicated by the dashed blue line in the figure.)
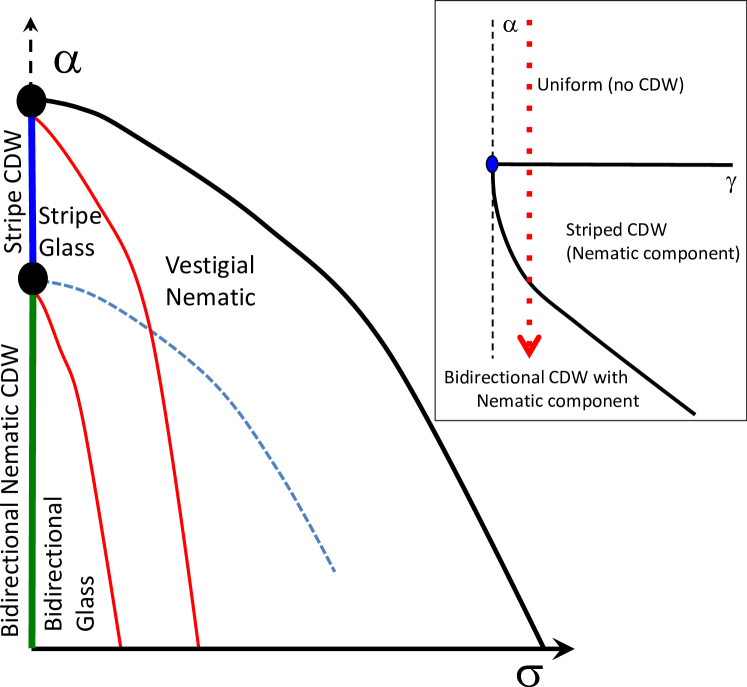
Finally, we have indicated two possible Bragg-glass transitions in the figure as solid red lines. A Bragg glass is characterized by quasi-long-range (power law) order and an absence of any free dislocations.Giamarchi and Le Doussal (1995); Gingras and Huse (1996) It is thermodynamically distinct from a CDW phase (which has long-range-order) and from a fully disordered phase (which has exponentially falling CDW correlations). The existence or not of such a phase is not inevitable, as it depends on an appropriate hierarchy of energies (e.g. a large core energy for the dislocation) but it is thought to be possible in 3-dimensions. In the present case there could be two such phases - one a “stripe-glass phase” (discussed previously in Ref. Kivelson and Emery (2000)) in which there is unidirectional CDW quasi-long-range order, and a “bidirectional glass phase” which has two orthogonal, non-equivalent CDW correlations, both with quasi-long-range order. In principle, such quasi-long-range order could be inferred from X-ray diffraction as it leads to a charge-order peak which has a power-law singularity, which is distinct from the delta-function that rises from long-range-order or the Lorenzian (or squared Lorenzian) that characterizes the disordered phase. While this distinction is likely difficult to establish in practice, a more promising way to establish such a phase is from STM studies in which disolocations can be directly visualized.