Type Ibn Supernovae May not all Come from Massive Stars
Abstract
Because core-collapse supernovae are the explosions of massive stars, which have relatively short lifetimes, they occur almost exclusively in galaxies with active star formation. On the other hand, the Type Ibn supernova PS1-12sk exploded in an environment that is much more typical of thermonuclear (Type Ia) supernovae: on the outskirts of the brightest elliptical galaxy in a galaxy cluster. The lack of any obvious star formation at that location presented a challenge to models of Type Ibn supernovae as the explosions of very massive Wolf–Rayet stars. Here we present a supplementary search for star formation at the site of PS1-12sk, now that the supernova has faded, via deep ultraviolet (UV) imaging of the host cluster with the Hubble Space Telescope. We do not detect any UV emission within 1 kpc of the supernova location, which allows us deepen the limit on star formation rate by an order of magnitude compared to the original study on this event. In light of this new limit, we discuss whether or not the progenitors of Type Ibn supernovae can be massive stars, and what reasonable alternatives have been proposed.
2019 January 22
1 Introduction
Core-collapse supernovae (SNe) are the terminal explosions of stars with zero-age main-sequence masses . Such stars have relatively short lifetimes: tens of millions of years for low-mass red supergiants down to a million years for high-mass Wolf–Rayet stars, assuming single-star evolution. Therefore, when we see these stars explode, they are almost always located in galaxies with recent or ongoing star formation. For example, in a sample of 2104 SN host galaxies, Hakobyan et al. (2012) found no core-collapse SNe in elliptical hosts, and only two in lenticular (S0) hosts.111Here we exclude the calcium-rich SNe Ib, which may not be core-collapse SNe (Perets et al., 2010). Both are SNe II, the most common class of core-collapse SNe, and Hakobyan et al. (2012) suspected that both host galaxies have some residual star formation associated with diffuse or unresolved spiral arms.
A small fraction (1%) of SNe belong to a class whose spectra show little to no hydrogen and are dominated by narrow (1000 km s-1) helium emission lines. Matheson et al. (2001), Foley et al. (2007), and Pastorello et al. (2007) first interpreted these spectral features as a sign of interaction between the SN ejecta and helium-rich circumstellar material (CSM). Pastorello et al. (2007) dubbed the class SNe Ibn, in analogy to the much larger class of SNe IIn, whose spectra indicate interaction with hydrogen-rich CSM. However, unlike SNe IIn, whose light curves show a wide range of rise times and decline rates (Kiewe et al., 2012), SNe Ibn have fast and relatively uniform light curves (Hosseinzadeh et al., 2017b), with some recent exceptions (Pastorello et al., 2015a; Karamehmetoglu et al., 2017). At the time of this writing, 31 SNe Ibn have been classified.
Despite these differences, the preponderance of evidence has suggested that both SNe IIn and SNe Ibn come from very massive stars, whose strong winds eject a significant amount of material into the region around the star. When the star then explodes, the SN ejecta flash ionize and then collisionally excite the initially slow-moving CSM, leading to narrow emission lines in the SN spectra (see Smith 2016 for a review). Hydrogen-rich SNe IIn are thought to come from hydrogen-rich luminous blue variable stars, while hydrogen-poor SNe Ibn have been attributed to hydrogen-poor Wolf–Rayet stars. While the former connection has been established by direct progenitor detection (Gal-Yam & Leonard 2009; Smith et al. 2010a, b; Foley et al. 2011; but see Fox et al. 2017), the only direct evidence for the latter comes from SN 2006jc, which was preceded by an outburst at the same location in 2004 (Pastorello et al., 2007).
Sanders et al. (2013) first reported on the mystery of PS1-12sk, the only SN Ibn not to occur in a star-forming galaxy. Instead, the SN exploded in the galaxy cluster RXC J0844.9+4258 at matching redshift (; Böhringer et al., 2000), with the most likely host being the elliptical brightest cluster galaxy (BCG) CGCG 208–042, at a projected separation of 28 kpc. They detected no source at the SN location to a limit of and no narrow H emission (from a potential host galaxy) in a spectrum of the SN to a 3 limit of . The latter corresponds to a limit on the star formation rate density of , which is low but not unheard of for the site of a core-collapse SN (see Figure 3; Kelly & Kirshner, 2012; Galbany et al., 2018). Nonetheless, Sanders et al. (2013) explored scenarios in which white dwarfs, which do not require recent star formation, could explode as SNe Ibn. Photometry and spectra of PS1-12sk match quite well with other members of its class (Hosseinzadeh et al., 2017b); only its host environment stands out.
Here we report deep ultraviolet (UV) imaging of the host cluster of PS1-12sk from the Hubble Space Telescope (HST) taken six years after the SN has faded. The continued nondetection of a source at the SN location allows us to strengthen the limit on star formation by an order of magnitude, moving it below all previous core-collapse SNe. This prompts a serious consideration of the possibility that PS1-12sk, and by association other SNe Ibn, do not come from massive stars.
2 Observations and Data Reduction
We obtained images, logged in Table 1, with the UVIS channel of HST’s Wide Field Camera 3 (Dressel, 2018) under program GO-15236 (PI: G. Hosseinzadeh): a total exposure time of 3.4 hours with F300X, an extremely wide UV filter ( nm), and 17.5 minutes with F625W, similar to the Sloan Digital Sky Survey (SDSS) filter ( nm). We downloaded the calibrated, charge transfer efficiency corrected (*_flc.fits; Gennaro et al., 2018) files from the Barbara A. Mikulski Archive for Space Telescopes.
| MJD | Filter | Exposure | PhaseaaTime after the -band peak of PS1-12sk (MJD 56006.1; Sanders et al., 2013) in the cluster rest frame. |
|---|---|---|---|
| at Start | Time (s) | (days) | |
| 58198.21573 | F300X | 896 | +2079.8 |
| 58198.22765 | F300X | 896 | +2079.8 |
| 58198.28063 | F300X | 896 | +2079.9 |
| 58198.54669 | F300X | 896 | +2080.1 |
| 58198.55861 | F300X | 896 | +2080.1 |
| 58198.57053 | F300X | 896 | +2080.1 |
| 58200.46627 | F300X | 896 | +2081.9 |
| 58200.47819 | F300X | 896 | +2082.0 |
| 58200.49011 | F300X | 896 | +2082.0 |
| 58255.22808 | F300X | 896 | +2133.9 |
| 58255.24000 | F300X | 896 | +2133.9 |
| 58255.25192 | F300X | 896 | +2133.9 |
| 58255.75761 | F300X | 675 | +2134.4 |
| 58255.76698 | F300X | 675 | +2134.4 |
| 58255.77664 | F625W | 350 | +2134.4 |
| 58255.78221 | F625W | 350 | +2134.4 |
| 58255.78778 | F625W | 350 | +2134.4 |
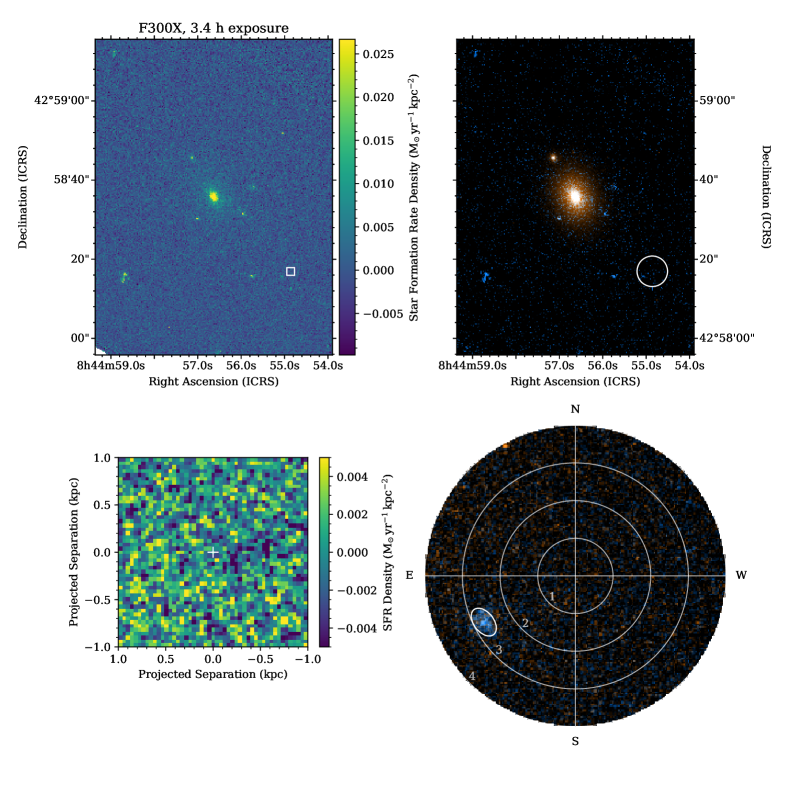
We then combined the images for each filter using SNHST (McCully et al., 2018a), an open-source pipeline for stacking HST images. SNHST begins by refining the astrometric solution for a single reference visit to match a ground-based catalog; in this case, we matched our F625W images to the Panoramic Survey Telescope And Rapid Response System 1 (Pan-STARRS1; Chambers et al., 2016) Survey catalog. It then refines the astrometric solutions for the other visits to match the reference visit. Once all the images have consistent astrometry, SNHST aligns and coadds them by filter, and optionally by visit, using DrizzlePac (Gonzaga et al., 2012). Finally it removes cosmic rays from the final images using Astro-SCRAPPY (McCully et al., 2018b), which is based on the L.A. Cosmic algorithm (van Dokkum, 2001). Our final stacked images are shown at the top of Figure 1.
To be consistent with Sanders et al. (2013), we assume a standard CDM cosmology with , , and , which yields a luminosity distance of 238 Mpc for the host cluster of PS1-12sk. We correct our measurements using the Schlafly & Finkbeiner (2011) Milky Way extinction coefficients in the direction of PS1-12sk: mag and mag. Observations of PS1-12sk suggest that host extinction is negligible (Sanders et al., 2013, and Appendix A). To convert luminosity to star formation rate, we use Kennicutt’s (1998) rescaling of the relationship from Madau et al. (1998) for a Salpeter (1955) initial mass function integrated from 0.1 to 100 M⊙:
| (1) |
where is the average luminosity spectral density in a rectangular filter centered at 280 nm with a bandwidth of 56 nm. At the redshift of PS1-12sk, F300X has a pivot wavelength (Koornneef et al., 1986) of 295.9 nm and a rectangular bandwidth of 69.9 nm, similar enough that we do not use a -correction. Dividing both sides of Equation (1) by area and rewriting luminosity in terms of surface brightness, we arrive at
| (2) |
| (3) |
is the redshift- and extinction-corrected UV surface brightness in AB magnitudes. (AB magnitudes are used throughout this Letter.)
There is no source visible within 1 kpc of the location of PS1-12sk in the final stacked F300X image. To quantify this, we measure the background-subtracted (see Appendix B) flux in a square around the location of PS1-12sk (Figure 1, bottom left), which is consistent with zero. Using the Poisson uncertainty on the total number of electrons in the aperture, we calculate a limiting surface brightness of 27.5 mag arcsec-2, corresponding to a star formation rate density below . We also run SEP (Barbary, 2016), a Python implementation of Source Extractor (Bertin & Arnouts, 1996), on this portion of the image and find no sources at significance. Smoothing the image with a Gaussian kernel with between 1 and 5 pixels does not change the result or reveal an obvious surface brightness gradient.
We also investigate the nature of the source closest to the SN location, which Sanders et al. (2013) suggested is likely an ultra-compact dwarf galaxy in the cluster, despite its unknown redshift. With HST’s resolution, we refine the position of this source to be 2.7 kpc from the SN location, slightly further than the 2.4 kpc reported by Sanders et al. (2013). The source is clearly detected in our F300X image and marginally detected in our F625W image, but is only marginally resolved even by HST (Figure 1, bottom right). Using SEP, we measure a Kron (1980) radius of about 120 pc, if the source is associated with the galaxy cluster, and Kron magnitudes of () and (), the latter of which agrees with the measurement from the Pan-STARRS1 image: (Sanders et al., 2013). Based on these measurements and those of Sanders et al. (2013, see their Figure 7), we conclude that the source is indeed part of the cluster.
3 Host Galaxies of Other SNe Ibn
To understand the context for our limit on the star formation rate near PS1-12sk, we examine the host galaxies of other SNe Ibn in the literature. Here and throughout this Letter, we include transitional SNe Ibn/IIn (Pastorello et al., 2008b), whose spectra show some hydrogen lines but are still dominated by helium. Previously, Pastorello et al. (2015b) listed the morphologies, -magnitudes, normalized offsets, and metallicities of a sample of 16 SN Ibn host galaxies, and Taddia et al. (2015) measured the host galaxy metallicities for a sample of interacting SNe, including 6 SNe Ibn. Other than the fact that they all occurred in spiral galaxies (except PS1-12sk), no obvious patterns emerge. As far as we are aware, no previous authors have systematically studied the star formation rates at the locations of SNe Ibn.
| Name | Redshift | ExtinctionaaSchlafly & Finkbeiner (2011) | Surface Brightness | Aperture | Discovery/Classification |
|---|---|---|---|---|---|
| (mag) | (mag arcsec-2) | (kpc) | Reference(s) | ||
| SN 2002ao | 0.005 | 0.185 | 23.54 ±0.08 | 0.20 | Martin et al. (2002) |
| SN 2006jc | 0.006 | 0.085 | 24.05 ±0.25 | 0.24 | Nakano et al. (2006) |
| SN 2010al | 0.017 | 0.199 | 22.38 ±0.04 | 0.68 | Rich (2010) |
| PTF11rfh | 0.060 | 0.220 | 24.20 ±0.12 | 2.26 | Hosseinzadeh et al. (2017b) |
| PS1-12sk | 0.054 | 0.129 | ¿24.28 | 2.05 | Sanders et al. (2013) |
| LSQ12btw | 0.058 | 0.096 | 22.58 ±0.08 | 2.19 | Valenti et al. (2012) |
| PTF12ldy | 0.106 | 0.250 | ¿24.15 | 3.79 | Hosseinzadeh et al. (2017b) |
| iPTF13beo | 0.091 | 0.185 | 23.77 ±0.12 | 3.31 | Gorbikov et al. (2014) |
| iPTF14aki | 0.064 | 0.137 | ¿24.98 | 2.40 | Polshaw et al. (2014); Hosseinzadeh et al. (2017b) |
| SN 2014av | 0.030 | 0.073 | 23.24 ±0.07 | 1.17 | Ciabattari et al. (2014) |
| SN 2014bk | 0.070 | 0.092 | 22.72 ±0.09 | 2.61 | Morokuma et al. (2014) |
| ASASSN-14ms | 0.054 | 0.049 | ¿24.77 | 2.05 | Kiyota et al. (2014); Vallely et al. (2018) |
| SN 2015U | 0.014 | 0.246 | 22.55 ±0.04 | 0.56 | Kumar et al. (2015); Ochner et al. (2015) |
| ASASSN-15ed | 0.049 | 0.104 | 23.54 ±0.11 | 1.87 | Fernandez et al. (2015); Noebauer et al. (2015) |
| iPTF15ul | 0.066 | 0.087 | 21.51 ±0.03 | 2.47 | Hosseinzadeh et al. (2017b) |
| iPTF15akq | 0.109 | 0.062 | ¿24.80 | 3.89 | Hosseinzadeh et al. (2017b) |
| SN 2016Q | 0.103 | 0.156 | 22.96 ±0.08 | 3.70 | Hounsell et al. (2016); Wright (2016); Pan (2016) |
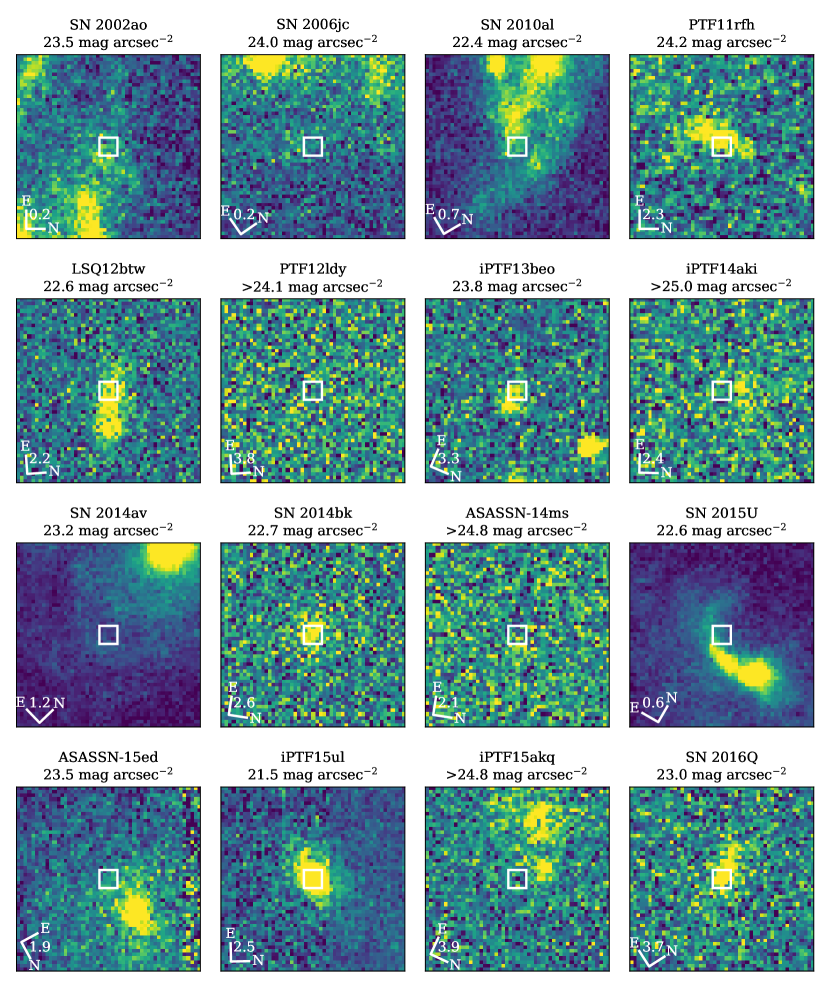
We followed a methodology similar to Kelly & Kirshner (2012) to measure -band surface brightnesses at the locations of the 17 SNe Ibn whose host galaxies were observed by SDSS (SDSS Collaboration 2017).222SN 2005la was an additional SN Ibn (actually a transitional Type Ibn/IIn) in an SDSS field, but that image is masked due to a nearby 5 mag star. Because we include all classified SNe Ibn in a predefined area of the sky, this should be an unbiased sample. Indeed, we do not observe any correlation between our measured surface brightnesses and redshift. We downloaded the background-subtracted -band images from SDSS, sometimes multiple frames per field, using Astroquery (Ginsburg et al., 2018) and calculated variance images according to the SDSS frame data model. We stacked the images of each host, weighting by inverse variance, and performed aperture photometry on the stacked image and the total variance image using a pixel () square aperture centered on the location of the SN. Although the physical size of this aperture varies by more than an order of magnitude within our sample, we chose it as a compromise between increasing our statistical uncertainties by including too few pixels and increasing our systematic uncertainties by including significant surface brightness gradients, where the relevant scale for the latter is set by the typical SDSS seeing of . In comparison, Kelly & Kirshner 2012 used a 20 pixel aperture. also approximately matches the 2 kpc aperture we use for the HST images of PS1-12sk in Section 2. The results are listed in Table 2 and shown in Figure 2.
Equations (1)–(2) are not strictly applicable to these measurements, because the SDSS filter does not overlap with the 280 nm filter used to derive them. However, -band luminosity is still dominated by young stars, but with significant contamination from older populations (Hopkins et al., 2003). Hopkins et al. (2003) calibrated star formation rate to -band luminosity, but because their relationship is nonlinear, we cannot rewrite it in terms of star formation rate density and surface brightness. Cram et al. (1998) produced a linear calibration between -band luminosity and the formation rate of 5 M☉ stars only. To convert this to a full star formation rate, we multiply by the ratio of mass from stars 0.5 M☉ to mass from stars 5 M☉ according to the Salpeter (1955) initial mass function, which we find to be 22. This ratio is very sensitive to the 0.5 M☉ lower limit but results in a relationship very close to Equation (1). Rather than trust this modified calibration, we take this to mean that Equation (1) can be used with -band measurements and apply it to our results in Table 2. Because all of the hosts are at redshifts , we again neglect -corrections.
Twelve events have -band surface brightnesses, and therefore star formation rate densities, well within the normal range for core-collapse SNe (see Figure 3). We do not see any SNe Ibn in very bright regions, but this could be an observational bias: rare and fast-evolving transients are harder to find and classify near galaxy centers. We do not detect flux at the locations of the remaining five SNe Ibn, but the limits are not very constraining. Apart from PS1-12sk, these occurred near very faint SDSS galaxies. In fact, Vallely et al. (2018) measured a star formation rate for the host galaxy of ASASSN-14ms of 0.02 M⊙ yr-1.
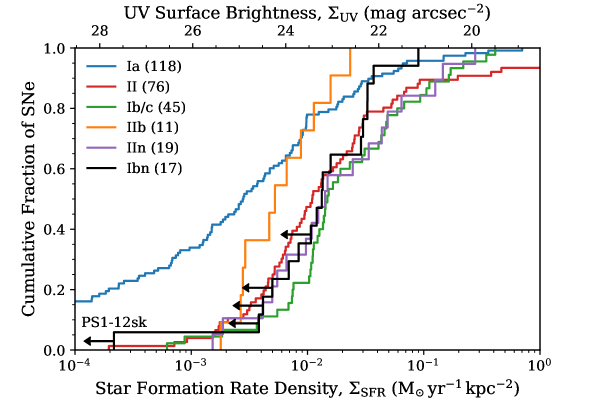
Figure 3 compares our results for SNe Ibn to star formation rate densities at the locations of other SNe from the sample of Galbany et al. (2018), who used H luminosity from IFU spectra as a diagnostic. Note that Galbany et al. (2018, p. 3) “aimed to resolve a bias identified in Galbany et al. (2014) due to the absence of low-mass galaxies in the CALIFA sample” and that all their measurements use a 1 kpc aperture, which is close to the average aperture in our SDSS sample (see Table 2) and close to the 2 kpc aperture we use for the HST images PS1-12sk. By comparing our star formation rate densities with theirs, we are implicitly assuming that our undetected hosts are larger than the aperture size and/or of similar physical size to the comparison samples, although an extremely small host would be interesting in itself. All of their core-collapse SN hosts are detected in H; SN Ia hosts that are not detected are plotted at . The faintest core-collapse host is that of the Type II SN 1948B, with a star formation rate density about equal to our limit for the host of PS1-12sk.333Following advice from L. Galbany (2018, private communication), we correct the erroneous value for SN 1948B to . However, this is just the extreme of a well-sampled distribution of SNe II, whereas PS1-12sk is clearly an outlier among the smaller sample of SNe Ibn. If we exclude PS1-12sk, the there would be no evidence that the distribution of SNe Ibn was any different than the distributions for other types of core-collapse SNe.
For completeness, we remark on the host galaxies of the four SNe Ibn that have been discovered in the past two years, as they have not been mentioned elsewhere. SN 2017ecp (Hosseinzadeh et al., 2017a; Kiyota et al., 2017) occurred from the center of the spiral galaxy PGC 727891 (Makarov et al., 2014). SN 2017iwp (Delgado et al., 2017a; Smith et al., 2017) occurred from the center of ESO 162-G7 (Lauberts, 1998), which is classified as an S0 galaxy but is small enough () that spiral structure might be unresolved. SN 2017jfv (Delgado et al., 2017b; Berton et al., 2018) occurred from the center and matches the redshift of the emission-line galaxy ESO 444-IG49 NED01, which is part of a galaxy pair (Lauberts, 1998). SN 2018fmt (Fremling, 2018; Gromadzki et al., 2018) occurred from the center and matches the redshift of the UV-bright galaxy GALEXASC J012100.76-135145.0 (Maddox et al., 1990), which is part of the galaxy cluster MXCX J0120.9-1351 (Piffaretti et al., 2011).
4 What Produced PS1-12sk?
Our limits at the location of PS1-12sk rule out all but one of the core-collapse SN hosts in the sample of Galbany et al. (2018) at significance; we rule out the host with the lowest star formation rate at (Figure 3). There are therefore three remaining possibilities for the origin of PS1-12sk.
4.1 Option 1: Ejected or Stripped from Ultra-compact Dwarf
The progenitor of PS1-12sk could have originated in the ultra-compact dwarf, in which case it would have had to travel more than 2.7 kpc to the SN location before exploding. Applying Equation (1) to the luminosity that we measure in Section 2, we calculate a star formation rate of for the dwarf. Botticella et al. (2012) gave the fraction of stars per unit mass that produce core-collapse supernovae as , meaning that we would expect a massive star from this galaxy to explode once every 20 kyr. However, at over 22.5 Kron radii, this would be by far the largest normalized offset for a core-collapse SN: the largest in the sample of Kelly & Kirshner (2012) is 8.77 half-light radii, and all the SNe Ibn examined by Pastorello et al. (2015b) occurred within the 25 mag arcsec-2 isophotal radius. The only SN Ibn with a direct progenitor detection (albeit in outburst) was SN 2006jc; Tominaga et al. (2008) estimated that this SN came from a star, which would have a lifetime of 5 Myr. To move 2.7 kpc during that time, a star this massive would need a velocity 530 km s-1.
Encounters with supermassive black holes can accelerate stars up to velocities of several hundred km s-1 (Hills, 1988). This is unusually fast for stars in the Milky Way (Brown et al., 2007), but well above the escape velocity for an ultra-compact dwarf. Recent observations of the velocity dispersion profiles of two ultra-compact dwarfs do suggest that they have central black holes of the required mass (Ahn et al., 2017). Alternatively, the BCG or another cluster member could have stripped the star from the ultra-compact dwarf during a tidal interaction, in which case the star’s velocity would be consistent with the velocity dispersion of the cluster (Moore et al., 1996; Sommer-Larsen et al., 2005; DeMaio et al., 2018). Böhringer et al. (2000) gave the cluster X-ray luminosity as , implying a velocity dispersion around 500 km s-1 (Zhang et al., 2011). Its relatively low X-ray luminosity makes it more likely to have tidal interactions and mergers (Zabludoff & Mulchaey, 1998). In fact, this cluster’s BCG is likely the result of such mergers (Eigenthaler & Zeilinger, 2009).
Although both of these processes are physically possible, we must keep in mind that this would be the first core-collapse SN discovered in the intracluster medium. For it to be of such a rare class (Type Ibn) suggests some connection between the progenitor system and its escape mechanism from the ultra-compact dwarf. SNe Ia, on the other hand, have been found in the intracluster medium before (Sand et al., 2011).
4.2 Option 2: Luck
We may have observed a very statistically improbable event. There could be a very low level of star formation at the SN location, beneath our very deep limits, and we happened to see one of the few massive stars that formed there explode. Even if there was more vigorous star formation that suddenly shut off sometime in the past 5 Myr, we would still expect to see UV emission today; the mean stellar age that contributes to this emission is 10 Myr (Kennicutt & Evans, 2012). This star formation could be associated with the BCG, the intracluster medium, or a gas flow into the cluster core. Previously, only a single core-collapse SN has been observed in an elliptical cluster galaxy, the SN II Abell399_11_19_0 (Graham et al., 2012).
As a rough estimate of the likelihood of this observation, we can multiply our limit on the star-formation rate by (Botticella et al., 2012) to get a rate of a few per Myr kpc2. Because SNe Ibn make up only about 1% of core-collapse SNe (Pastorello et al., 2008a), it is especially unlikely that the second core-collapse SN that we observed in such an environment was of a very rare type. We would expect this a few times per 100 Myr kpc2. If we assume the progenitor could have moved at most a few kpc during its lifetime (see previous section) and integrate over this region, we get a rate of SNe Ibn of .
4.3 Option 3: Low-mass Progenitor
The last remaining option is that PS1-12sk did not come from a massive star. In other words, we might not detect any star formation at the SN location because it ceased billions of years ago. The exploding star could then either be a white dwarf in a helium envelope or a nondegenerate helium star. For example, Sanders et al. (2013) suggested that explosions of stars like AM Canum Venaticorum and R Coronae Borealis could reproduce some of the observed features of SNe Ibn, but neither is completely satisfactory. Likewise, calcium-rich transients (Perets et al., 2010) share many features with PS1-12sk—spectra showing helium but not hydrogen, rapidly fading light curves, some host galaxies with no star formation, and large host offsets—but are much fainter and, crucially, do not show narrow spectral lines indicating circumstellar interaction.
One of the strongest pieces of evidence that SNe Ibn come from massive stars is the pre-explosion eruption observed two years before SN 2006jc, which peaked at mag and lasted for 10 days (Pastorello et al., 2007). We are not aware of any way to produce this phenomenon with a low-mass, hydrogen-poor star. Helium novae are orders of magnitude too faint (Kato & Hachisu, 2003). Theoretical .Ia SNe roughly match the required luminosity and time scale, but we would not expect their progenitors to explode two years later as SNe Ia (Bildsten et al., 2007). The fast-declining light curves of SNe Ibn also indicate that very little 56Ni is produced in the explosion (Foley et al., 2007; Pastorello et al., 2008a), which may challenge white dwarf explosion models.
One way of avoiding these issues is to allow PS1-12sk and SN 2006jc to come from different types of stars. SNe Ibn would then be a mixed class, with some low- and some high-mass progenitors. This could potentially explain some of the spectral diversity we see among SNe Ibn (Hosseinzadeh et al., 2017b). The five spectra that we have of PS1-12sk look almost identical to spectra of SN 2006jc,444SN 2006jc was discovered after peak, so the phases of these spectra are not well constrained. but perhaps any explosion into helium-rich CSM would look the same. This situation would be analogous to the discovery that some events initially classified as SNe IIn are actually the explosions of white dwarfs with hydrogen-rich CSM (now called SNe Ia-CSM; Dilday et al., 2012; Silverman et al., 2013). In fact, this may be the reason that events classified as SNe IIn are less correlated with star formation than other classes of core-collapse SNe (Anderson et al., 2012; Habergham et al., 2014), despite some having luminous progenitor detections.
5 Summary and Conclusions
We have presented a very deep limit on the star formation rate at the site of the SN Ibn PS1-12sk, nominally ruling out a massive star origin. We present three alternative proposals for how this SN could have occurred in such a unique environment.
-
1.
The progenitor of PS1-12sk was a massive star ejected or tidally stripped from a nearby ultra-compact dwarf galaxy.
-
2.
The progenitor of PS1-12sk was a rare massive star in a region with a very low star formation rate.
-
3.
The progenitor of PS1-12sk was a low-mass star.
Our result only deepens the mystery surrounding PS1-12sk, in that none of these possibilities is fully satisfactory in explaining the origins of SNe Ibn. Given that there is not much more data to collect on this particular event, the resolution will likely come from a statistical study of SN Ibn host galaxies. Although this is currently the only SN Ibn discovered in a non-star-forming environment, we still suffer from a small sample size of only tens of events. Current and future large-scale surveys will be much better suited to find these rare, fast-evolving transients, allowing us to better understand the statistical properties of their host environments.
Appendix A Extinction
Sanders et al. (2013, p. 4) claimed that “the SED of [PS1-12sk] is not consistent with significant reddening given reasonable assumptions about the photospheric temperature” and neglect extinction throughout their analysis. However, as an additional check, we calculate an upper limit on the host galaxy extinction based on the nondetection of sodium absorption in a spectrum of the SN. The highest-resolution spectrum available was taken 8 days after maximum light using MMT’s Blue Channel spectrograph with the 832 line mm-1 grating (; resolution = 0.204 nm; Schmidt et al., 1989). It is not plotted by Sanders et al. (2013), but it is available for download from WISEeREP (Yaron & Gal-Yam, 2012).
We follow a procedure similar to Leonard & Filippenko (2001). The sodium lines used to measure extinction (589.0 and 589.6 nm) are very near one of the spectrum’s strongest emission features (helium 587.6 nm), but because the sodium lines would be much narrower than the emission feature, this does not interfere with our analysis. We fit a second-order Savitzky & Golay (1964) filter with a width of 99 pixels to produce a smoothed spectrum and normalize the original data by the smoothed spectrum. We then calculate the standard deviation of the normalized spectrum () within 5 resolution elements of the sodium lines. The measurement does not change significantly if we use between 3 and 7 resolution elements. Applying Eq. 4 of Leonard & Filippenko (2001), we get a limit on the equivalent width of sodium of nm, where we have assumed the width of the line is nm. This corresponds to an extinction coefficient of mag (Cardelli et al., 1989; Barbon et al., 1990). At most, extinction could weaken our limit by about 8%.
Appendix B Background Subtraction
Because we are attempting to detect a low surface brightness feature in a galaxy cluster environment, careful measurement and subtraction of the background is crucial. Unfortunately, the background flux varies between the four detector quadrants (because each has its own amplifier) as well as across each quadrant. Quadrants A and B are not used in our analysis except for in refining the astrometric solution of the images before stacking. The BCG falls in quadrant C, and the SN location lies very near the quadrant boundary, such that our measurement aperture is spread across quadrants C and D. We want to remove any instrumental artifacts while preserving any light intrinsic to the galaxy cluster.
We model the instrumental signature by fitting a smoothly varying 2D background to the full image using sep.Background (Barbary, 2016) with a box size of 64 pixels. This is approximately the same size as the BCG, so we mask an pixel region centered on the BCG before doing the fit. From this model, we observe that the background varies smoothly by 5–10 electrons from the outer edges of the chips (brighter) toward the chip gap (fainter), but it does not vary significantly in the direction parallel to the chip gap, except for a small shift at the quadrant boundaries. We do not see any sign of intracluster light (an excess centered on the BCG) in our background model, so we proceed to subtract this model from the F300X image before doing any measurements.
The only number that quantitatively affects our analysis is the average value of the background inside our aperture. This determines whether or not the flux measurement surpasses our 5 threshold for a detection. We explored using several other values for this quantity: the median in quadrant C, the median in quadrant D, and the median in the region shown in Figure 1, all calculated using both the original image and the background model. None of these seven options yields a detection with more than significance, which, if real, would still be the lowest star formation rate density for a core-collapse host. As we are confident that there is no excess, we calculate an upper limit based on the Poisson uncertainty on the sum within the aperture, which is not affected by the background model.
References
- Ahn et al. (2017) Ahn, C. P., Seth, A. C., den Brok, M., et al. 2017, ApJ, 839, 72
- Anderson et al. (2012) Anderson, J. P., Habergham, S. M., James, P. A., & Hamuy, M. 2012, MNRAS, 424, 1372
- Astropy Collaboration et al. (2018) Astropy Collaboration, Price-Whelan, A. M., Sipőcz, B. M., et al. 2018, AJ, 156, 123
- Barbary (2016) Barbary, K. 2016, JOSS, 1, 58
- Barbon et al. (1990) Barbon, R., Benetti, S., Cappellaro, E., Rosino, L., & Turatto, M. 1990, A&A, 237, 79
- Bertin & Arnouts (1996) Bertin, E., & Arnouts, S. 1996, A&AS, 117, 393
- Berton et al. (2018) Berton, M., Bufano, F., Floers, A., et al. 2018, TNSCR, 19, 1
- Bildsten et al. (2007) Bildsten, L., Shen, K. J., Weinberg, N. N., & Nelemans, G. 2007, ApJ, 662, L95
- Böhringer et al. (2000) Böhringer, H., Voges, W., Huchra, J. P., et al. 2000, ApJS, 129, 435
- Botticella et al. (2012) Botticella, M. T., Smartt, S. J., Kennicutt, R. C., et al. 2012, A&A, 537, A132
- Brown et al. (2007) Brown, W. R., Geller, M. J., Kenyon, S. J., Kurtz, M. J., & Bromley, B. C. 2007, ApJ, 671, 1708
- Cardelli et al. (1989) Cardelli, J. A., Clayton, G. C., & Mathis, J. S. 1989, ApJ, 345, 245
- Chambers et al. (2016) Chambers, K. C., Magnier, E. A., Metcalfe, N., et al. 2016, arXiv:1612.05560
- Ciabattari et al. (2014) Ciabattari, F., Mazzoni, E., Masi, G., et al. 2014, CBET, 3865, 1
- Cram et al. (1998) Cram, L., Hopkins, A., Mobasher, B., & Rowan-Robinson, M. 1998, ApJ, 507, 155
- Delgado et al. (2017a) Delgado, A., Harrison, D., Hodgkin, S., et al. 2017a, TNSTR, 1399, 1
- Delgado et al. (2017b) Delgado, A., Harrison, D., Hodgkin, S., et al. 2017b, TNSTR, 1485, 1
- DeMaio et al. (2018) DeMaio, T., Gonzalez, A. H., Zabludoff, A., et al. 2018, MNRAS, 474, 3009
- Dilday et al. (2012) Dilday, B., Howell, D. A., Cenko, S. B., et al. 2012, Sci, 337, 942
- Dressel (2018) Dressel, L. 2018, Wide Field Camera 3 Instrument Handbook, Version 10.0 (Baltimore: STScI)
- Eigenthaler & Zeilinger (2009) Eigenthaler, P., & Zeilinger, W. W. 2009, AN, 330, 978
- Fernandez et al. (2015) Fernandez, J. M., Holoien, T. W.-S., Stanek, K. Z., et al. 2015, ATel, 7163, 1
- Foley et al. (2011) Foley, R. J., Berger, E., Fox, O., et al. 2011, ApJ, 732, 32
- Foley et al. (2007) Foley, R. J., Smith, N., Ganeshalingam, M., et al. 2007, ApJ, 657, L105
- Fox et al. (2017) Fox, O. D., Dyk, S. D. V., Dwek, E., et al. 2017, ApJ, 836, 222
- Fremling (2018) Fremling, C. 2018, TNSTR, 1262, 1
- Gal-Yam & Leonard (2009) Gal-Yam, A., & Leonard, D. C. 2009, Natur, 458, 865
- Galbany et al. (2014) Galbany, L., Stanishev, V., Mourão, A. M., et al. 2014, A&A, 572, A38
- Galbany et al. (2018) Galbany, L., Anderson, J. P., Sánchez, S. F., et al. 2018, ApJ, 855, 107
- Gennaro et al. (2018) Gennaro, M., et al. 2018, WFC3 Data Handbook, Version 4.0 (Baltimore: STScI)
- Ginsburg et al. (2018) Ginsburg, A., Sipőcz, B., Parikh, M., et al. 2018, Astroquery, 0.3.8, Zenodo, doi:10.5281/zenodo.1234036
- Gonzaga et al. (2012) Gonzaga, S., Hack, W., Fruchter, A., & Mack, J., eds. 2012, The DrizzlePac Handbook (Baltimore: STScI)
- Gorbikov et al. (2014) Gorbikov, E., Gal-Yam, A., Ofek, E. O., et al. 2014, MNRAS, 443, 671
- Graham et al. (2012) Graham, M. L., Sand, D. J., Bildfell, C. J., et al. 2012, ApJ, 753, 68
- Gromadzki et al. (2018) Gromadzki, M., Wevers, T., Pignata, G., Rodriguez, O., & Yaron, O. 2018, TNSCR, 1339, 1
- Habergham et al. (2014) Habergham, S. M., Anderson, J. P., James, P. A., & Lyman, J. D. 2014, MNRAS, 441, 2230
- Hakobyan et al. (2012) Hakobyan, A. A., Adibekyan, V. Z., Aramyan, L. S., et al. 2012, A&A, 544, A81
- Hills (1988) Hills, J. G. 1988, Natur, 331, 687
- Hopkins et al. (2003) Hopkins, A. M., Miller, C. J., Nichol, R. C., et al. 2003, ApJ, 599, 971
- Hosseinzadeh (2017) Hosseinzadeh, G. 2017, HST Proposal, 15236
- Hosseinzadeh et al. (2017a) Hosseinzadeh, G., Arcavi, I., McCully, C., Howell, D. A., & Valenti, S. 2017a, TNSCR, 579, 1
- Hosseinzadeh et al. (2017b) Hosseinzadeh, G., Arcavi, I., Valenti, S., et al. 2017b, ApJ, 836, 158
- Hounsell et al. (2016) Hounsell, R. A., Miller, J. A., Pan, Y.-C., et al. 2016, ATel, 8546, 1
- Jones et al. (2001) Jones, E., Oliphant, T., Peterson, P., et al. 2001, SciPy: Open Source Scientific Tools for Python, http://www.scipy.org/
- Karamehmetoglu et al. (2017) Karamehmetoglu, E., Taddia, F., Sollerman, J., et al. 2017, A&A, 602, A93
- Kato & Hachisu (2003) Kato, M., & Hachisu, I. 2003, ApJ, 598, L107
- Kelly & Kirshner (2012) Kelly, P. L., & Kirshner, R. P. 2012, ApJ, 759, 107
- Kennicutt (1998) Kennicutt, R. C. 1998, ARA&A, 36, 189
- Kennicutt & Evans (2012) Kennicutt, R. C., & Evans, N. J. 2012, ARA&A, 50, 531
- Kiewe et al. (2012) Kiewe, M., Gal-Yam, A., Arcavi, I., et al. 2012, ApJ, 744, 10
- Kiyota et al. (2017) Kiyota, S., Stanek, K. Z., & Shields, J. V. 2017, TNSTR, 559, 1
- Kiyota et al. (2014) Kiyota, S., Holoien, T. W. S., Stanek, K. Z., et al. 2014, ATel, 6853, 1
- Koornneef et al. (1986) Koornneef, J., Bohlin, R., Buser, R., Horne, K., & Turnshek, D. 1986, HiA, 7, 833
- Kron (1980) Kron, R. G. 1980, ApJS, 43, 305
- Kumar et al. (2015) Kumar, S., Yuk, H., Zheng, W., et al. 2015, CBET, 4164, 1
- Lauberts (1998) Lauberts, A. 1998, yCat, 7043, 0
- Leonard & Filippenko (2001) Leonard, D. C., & Filippenko, A. V. 2001, PASP, 113, 920
- Madau et al. (1998) Madau, P., Pozzetti, L., & Dickinson, M. 1998, ApJ, 498, 106
- Maddox et al. (1990) Maddox, S. J., Sutherland, W. J., Efstathiou, G., & Loveday, J. 1990, MNRAS, 243, 692
- Makarov et al. (2014) Makarov, D., Prugniel, P., Terekhova, N., Courtois, H., & Vauglin, I. 2014, A&A, 570, A13
- Martin et al. (2002) Martin, P., Li, W. D., Qiu, Y. L., & West, D. 2002, IAUC, 7809, 1
- Matheson et al. (2001) Matheson, T., Filippenko, A. V., Li, W., Leonard, D. C., & Shields, J. C. 2001, AJ, 121, 1648
- McCully et al. (2018a) McCully, C., Hosseinzadeh, G., Takaro, T., & Hiramatsu, D. 2018a, cmccully/snhst, 0.10.0, Zenodo, doi:10.5281/zenodo.1482004
- McCully et al. (2018b) McCully, C., Crawford, S., Kovacs, G., et al. 2018b, astropy/astroscrappy, 1.0.5, Zenodo, doi:10.5281/zenodo.1482019
- Moore et al. (1996) Moore, B., Katz, N., Lake, G., Dressler, A., & Oemler, A. 1996, Natur, 379, 613
- Morokuma et al. (2014) Morokuma, T., Shibata, T., Matsumoto, E., et al. 2014, CBET, 3894, 1
- Nakano et al. (2006) Nakano, S., Itagaki, K., Puckett, T., & Gorelli, R. 2006, CBET, 666, 1
- Noebauer et al. (2015) Noebauer, U., Ishida, E., Taubenberger, S., et al. 2015, ATel, 7219, 1
- Ochner et al. (2015) Ochner, P., Benetti, S., Pastorello, A., et al. 2015, ATel, 7105, 1
- Pan (2016) Pan, Y. 2016, TNSCR, 41, 1
- Pastorello et al. (2007) Pastorello, A., Smartt, S. J., Mattila, S., et al. 2007, Natur, 447, 829
- Pastorello et al. (2008a) Pastorello, A., Mattila, S., Zampieri, L., et al. 2008a, MNRAS, 389, 113
- Pastorello et al. (2008b) Pastorello, A., Quimby, R. M., Smartt, S. J., et al. 2008b, MNRAS, 389, 131
- Pastorello et al. (2015a) Pastorello, A., Wyrzykowski, Ł., Valenti, S., et al. 2015a, MNRAS, 449, 1941
- Pastorello et al. (2015b) Pastorello, A., Hadjiyska, E., Rabinowitz, D., et al. 2015b, MNRAS, 449, 1954
- Perets et al. (2010) Perets, H. B., Gal-Yam, A., Mazzali, P. A., et al. 2010, Natur, 465, 322
- Piffaretti et al. (2011) Piffaretti, R., Arnaud, M., Pratt, G. W., Pointecouteau, E., & Melin, J. B. 2011, A&A, 534, A109
- Polshaw et al. (2014) Polshaw, J., Benitez, S., Taubenberger, S., et al. 2014, ATel, 6091, 1
- Rich (2010) Rich, D. 2010, CBET, 2207, 1
- Salpeter (1955) Salpeter, E. E. 1955, ApJ, 121, 161
- Sand et al. (2011) Sand, D. J., Graham, M. L., Bildfell, C., et al. 2011, ApJ, 729, 142
- Sanders et al. (2013) Sanders, N. E., Soderberg, A. M., Foley, R. J., et al. 2013, ApJ, 769, 39
- Savitzky & Golay (1964) Savitzky, A., & Golay, M. J. E. 1964, AnaCh, 36, 1627
- Schlafly & Finkbeiner (2011) Schlafly, E. F., & Finkbeiner, D. P. 2011, ApJ, 737, 103
- Schmidt et al. (1989) Schmidt, G. D., Weymann, R. J., & Foltz, C. B. 1989, PASP, 101, 713
- SDSS Collaboration et al. (2017) SDSS Collaboration, Albareti, F. D., Allende Prieto, C., et al. 2017, ApJS, 233, 25
- Silverman et al. (2013) Silverman, J. M., Nugent, P. E., Gal-Yam, A., et al. 2013, ApJS, 207, 3
- Smith et al. (2017) Smith, M., Angus, C. R., Yaron, O., & Knezevic, N. 2017, TNSCR, 1427, 1
- Smith (2016) Smith, N. 2016, in Handbook of Supernovae, ed. A. W. Alsabti & P. Murdin (Cham: Springer)
- Smith et al. (2010a) Smith, N., Miller, A., Li, W., et al. 2010a, AJ, 139, 1451
- Smith et al. (2010b) Smith, N., Li, W., Miller, A. A., et al. 2010b, ApJ, 732, 63
- Sommer-Larsen et al. (2005) Sommer-Larsen, J., Romeo, A. D., & Portinari, L. 2005, MNRAS, 357, 478
- Taddia et al. (2015) Taddia, F., Sollerman, J., Leloudas, G., et al. 2015, A&A, 574, A60
- Tominaga et al. (2008) Tominaga, N., Limongi, M., Suzuki, T., et al. 2008, ApJ, 687, 1208
- Valenti et al. (2012) Valenti, S., Pastorello, A., Benitez-Herrera, S., et al. 2012, ATel, 4037, 1
- Vallely et al. (2018) Vallely, P. J., Prieto, J. L., Stanek, K. Z., et al. 2018, MNRAS, 475, 2344
- van Dokkum (2001) van Dokkum, P. G. 2001, PASP, 113, 1420
- Wright (2016) Wright, D. 2016, TNSTR, 32, 1
- Yaron & Gal-Yam (2012) Yaron, O., & Gal-Yam, A. 2012, PASP, 124, 668
- Zabludoff & Mulchaey (1998) Zabludoff, A. I., & Mulchaey, J. S. 1998, ApJ, 496, 39
- Zhang et al. (2011) Zhang, Y.-Y., Andernach, H., Caretta, C. A., et al. 2011, A&A, 526, A105