capbtabboxtable[][\FBwidth]
Long-term microstructural evolution of tungsten under heat and neutron loads
)
Abstract
In nuclear fusion reactors, tungsten will be exposed to high neutron loads at high temperatures (>900 °C). The evolution and degradation of the mechanical properties under these conditions is uncertain and therefore constitutes a major risk. Here, the microstructural evolution of tungsten under combined heat and neutron loads is studied, using a multi-scale approach incorporating clusters dynamics and a mean-field recrystallization model. The mean-field recrystallization model contains both nucleation in the bulk and at the grain boundaries. The cluster dynamics model includes the incorporation of loops in the dynamics of the dislocation network as a mechanism. The effects of bulk nucleation on the microstructural evolution are explored. The simulations predict a cyclically occuring neutron-induced recrystallization at all studied temperatures. Furthermore, the evolution of the irradiation hardening during neutron-induced recrystallization is assessed from the simulated microstructures.
1 INTRODUCTION
Nuclear fusion is a potential clean and cheap way to generate energy, making our society less dependent on oil, gas and coals. The most promising design for a large scale fusion reactor is the tokamak. Whereas the principle for fusion seems simple, the temperature required to achieve fusion, is extremely high (>150 million °C). The plasma-facing part of the divertor will receive high heat loads (10 MW/m2 for DEMO [1]) and on top of that, plasma ion loads (peak loads of 1024 ions/m3s [1]) and neutron loads (15 dpa (displacements per atom) for 5 year of operation of DEMO [1]). These severe loading conditions need to withstood during its economic lifetime, which is at least two years before these critical parts can be replaced.
The component in the wall that receives the highest heat loads, and that will thus reach the highest temperatures, is the divertor. The plasma-facing parts of this component will be made out of tungsten for ITER and DEMO, because of its favourable thermo-mechanical physical properties at high temperatures, its low activation levels and low tritium retention. Despite these qualities, it is not known how long tungsten can withstand these combined heat, neutron and ion loads.
So far, one aims to keep the temperature of the divertor in between the DBTT and the recrystallization temperature, to prevent both brittle fracture and the loss of the pre-existing microstructure. However, as argued in [2, 3], the combination of a continuous neutron load and a high temperature makes recrystallization and grain growth [4] hard to avoid. These processes cause a radical change in the materials microstructure and thus also in its properties, which makes the understanding of these processes critical.
Neutron irradiation of tungsten leads to displacement damage and transmutations (to e.g. Re, Os, Ta) as well as gas production (H, He). The fusion neutron energy spectrum consists largely of 14 MeV neutrons. These fast neutrons mostly create large displacement cascades, in contrast to fission neutrons, which are more often thermal, producing relatively more transmutations. The evolution of the material structure, and thus of the material properties, is expected to be radically different under the fusion neutron spectrum than under fission neutrons. No experimental setups currently exist with a sufficient neutron flux for fusion neutron testing. Therefore, models for the evolution of material properties under fusion neutron irradiation are essential.
The displacement cascades in tungsten have been observed with TEM to result in vacancies, self-interstitial atoms (SIAs) and clusters of these, which may form prismatic loops of interstitials and vacancies and voids [5]. These interact with the pre-existing dislocation network, with the grain boundaries and with the material impurities. The interactions between the different types of defects are complex: defects may be trapped and impurities may stabilize or promote certain types of defects. Furthermore, the self-interstitial clusters are notorious for their large mobility in a certain direction. Object kinetic Monte Carlo (OKMC) models as well as stochastic cluster dynamics models become increasingly more complete in describing the damage evolution, rendering them more accurate in predicting the defects that are observed experimentally [6, 7]. However, OKMC models are only able to describe the microstructural evolution in a volume that is several orders of magnitude smaller than the size of a single grain. Hence, they cannot be used to describe the evolution of a polycrystalline structure. Although less accurate, cluster dynamics (CD) models are computationally more efficient and better suited for use in polycrystalline modelling.
A first step towards a multi-scale model of the microstructural evolution under combined heat and neutron loads was made previously in [3]. With this model it is possible to study the competition between the various physical mechanisms and to assess their effects on the resulting grain size distribution and defect densities. In this model, the interaction between dislocations, vacancies, self-interstitial atoms and their clusters, modelled using CD modelling [8], determines the defect concentrations. Based on these concentrations, the driving forces for grain growth and nucleation are determined, using a mean-field recrystallization model [9].
In this paper, several important extensions to the modelling framework [3] for irradiation-induced recrystallization are made. The mechanism of loop incorporation into the dislocation network has been reported in [10, 11, 12] to occur in both bcc and fcc metals and was observed for tungsten in the form of coalescence of loops and dislocation network formation under certain conditions [5]. This mechanism is included in the present model and its effect on the microstructural evolution is investigated. Furthermore, nucleation at grain interiors (bulk nucleation) due to a high defect density as a result of neutron irradiation is incorporated and the effect of the amount of bulk nucleation on the evolution of the polycrystalline structure is explored. Lastly, the evolution of the hardness during neutron-induced recrystallization is predicted, based on the microstructural evolution.
2 Method
The microstructural evolution of polycrystalline tungsten under irradiation damage is modelled using a multi-scale approach. As a basis, the model as described in [3] is exploited, whereby several extensions are made in order to obtain a more realistic description of the microstructural behaviour.
The microstructural evolution that results from grain growth and nucleation, processes that occur at higher temperatures, are described using a mean-field model [9]. These processes are driven by the stored lattice energy that accumulates in the grains as a result of displacement cascade damage under neutron irradiation. The displacement damage consists of vacancies, vacancy clusters, self-interstitial atoms and their clusters and dislocations. The evolution of the defect concentrations and dislocation density inside each grain is described using cluster dynamics [8, 3]. The coupled model describes the evolution of the grain sizes , the defect concentrations and dislocation densities for a set of grains that are representative for the microstructure.
In this section, the recrystallization model and the cluster dynamics model are described, as well as the solution procedure for the coupled model. Details on the implementation are given in Appendix A.
2.1 Recrystallization
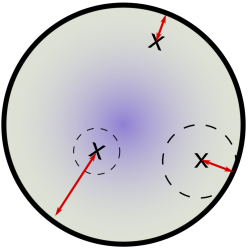
In the two-media mean field model [9, 3], the microstructure is represented by a set of grains that are distributed over a homogeneous equivalent medium with low defect density (LD-HEM) and a medium with high defect density (HD-HEM), see Figure 1a.
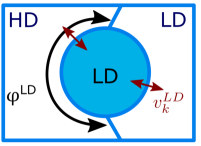
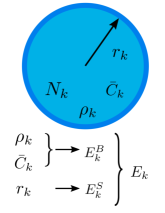
Each representative grain is assumed to be spherical and has as evolving properties: a radius , a number of grains , defect densities or defect concentrations , see Figure 1b. At a given moment in time, the stored bulk (i.e. excluding boundaries/surfaces) energy density of grain is calculated using the defect formation energies (see Appendix B.1), defect concentrations and the configurational entropy (Appendix B.2), as illustrated in Figure 1b. The surface energy density of a grain follows from the grain boundary surface energy and the grain radius . When for a grain, exceeds the energy density threshold , this grain is allocated to the HD-HEM. The grains interact with both their averaged surroundings (i.e. the HEMs). The stored energy in the material drives grain growth and nucleation, as a result of which the grain properties (grain size and defect concentrations) evolve.
2.1.1 Grain growth
During grain growth, a grain boundary segment that is shared between grain and a HEM, moves towards the HEM with velocity
| (1) |
where is the temperature-dependent grain boundary mobility, is the volume average of the stored energy densties of the grains in the HEM, is the total stored energy density of grain , and are the bulk parts (i.e. excluding boundaries/ surfaces) of the stored energy densities of the HEM and grain , and and are the volume averaged radius of the HEM and the radius of grain , respectively [3]. The velocities of both segments of the grain boundary (one for each HEM, see Figure 1a) lead to a volume change, and therefore to a new radius for the grain. The volume that is added to grains that are subject to growth, has thermal equilibrium defect concentrations and a thermal equilibrium dislocation density . For a growing grain, the average defect concentrations inside the grain thus diminish [3].
The fraction of the total grain boundary surface area of an LD-grain that is shared with the HD-HEM is taken as (see Figure 1a), with the total volume fraction of the microstructure that resides in the LD-HEM and for necklace-type nucleation [9]. For HD-grains, the fraction of the grain boundary surface that is shared with the LD-HEM is denoted as and is determined each time such that the volume transfers between the LD-medium and the HD-medium are equal [9]. The maximum of is limited to 1, and may be adjusted accordingly [9], see Appendix A.
The mobility of the grain boundaries is strongly temperature dependent. The Turnbull estimate [13] is used as a basis:
| (2) |
was characterized based on measurements on static recrystallization of tungsten in [3], is the activation energy for diffusion of tungsten along grain boundaries, is the thickness of the grain boundaries, is the atomic volume, is the gas constant, is the temperature, is the self-diffusivity of tungsten along the grain boundaries and is the Boltzmann constant. The parameter values are given in Appendix B.3. The implementation of the grain growth model is further described in section 2.3.
2.1.2 Nucleation
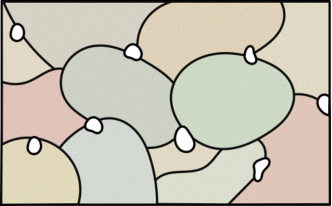
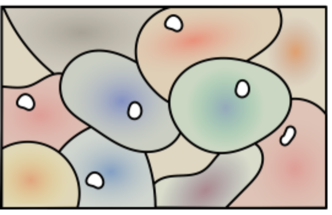
The formation of stable nuclei is driven by a reduction in the Gibbs free energy . Often, nucleation occurs more easily at the grain boundaries (necklace-type nucleation, see Figure 2a), where the activation barrier is reduced. EBSD-images taken during static recrystallization of pre-deformed tungsten indicate that necklace-type nucleation occurs in tungsten as well [14]. However, due to displacement cascades induced by neutrons, a high lattice stored energy may accumulate inside the grains, which triggers an additional nucleation mechanism, inside the grains (here referred to as bulk nucleation, see Figure 2b).
It has been suggested that under irradiation conditions, nucleation could be initiated at prismatic dislocation loops [15]. Here, both types of nucleation are modelled. The total rates for necklace nucleation and bulk nucleation in the microstructure are described by:
| (3) | |||
| (4) |
Here, and are the nucleation rate constants, and are the total available grain boundary area and nucleation volume respectively, and and are the activation energies for the formation of a stable grain. The activation energy and the radius of a stable nucleus are determined by solving (where denotes the Gibbs free energy difference) under the condition that the velocity of the grain boundary of the nucleus is positive, [3]. The expressions for are given in section 2.3.
During bulk nucleation, a new grain nucleates and grows completely at the cost of the HD grain interior (Figure 2b). Therefore, for a nucleated grain of radius , the Gibbs free energy changes as: , where is a parameter for the reduced activation energy during bulk nucleation, is the volume average of the bulk (i.e. excluding boundaries/surfaces) stored energy density for the grains in the HD-medium, is the bulk stored energy density for a grain with equilibrium defect concentrations and is the grain boundary surface energy. The grain boundary velocity of the newly nucleated grain that is volumetrically growing, is taken as , with the volume average of the total energy density of the HD-grains and the total stored energy density of the nucleated grain, including its grain boundary energy density. The grains that nucleate in the bulk, are referred to as HD daughter grains, as they initially only grow with respect to their HD parent grains. All the other grains in the microstructure are referred to as regular grains. In section 2.3, details about the treatment of HD daughter grains can be found.
In the case of necklace nucleation, the nucleus immediately can have both LD-grains and HD-grains as neighbours (Figure 2a). It is assumed that during necklace nucleation, of extra grain boundary area is formed [3]. The associated Gibbs free energy change is , where is a parameter for the reduced activation energy at grain boundaries. In this case, the grain boundary velocity right after nucleation is , where is the volume average of the stored energy density of all the grains in the microstructure. The surface area available for necklace nucleation consists of all the HD/LD grain boundaries (excluding the grain boundaries of the HD daughter grains) and all HD/HD grain boundaries.
2.2 Cluster dynamics
Highly energetic neutrons can create cascades of displaced atoms, which result in the creation of vacancies (), self-interstitial atoms () and their clusters and in the lattice with the size of the cluster. The concentrations and of all these different defects are the degrees of freedom in this model. Clusters from size are considered. All the vacancy clusters are assumed to take the shape of spherical voids, following [8], and all the SIA-clusters of more than 5 SIAs are assumed to form prismatic dislocation loops (a two-dimensional disk, with a dislocation line on the edge of this disk) [8].
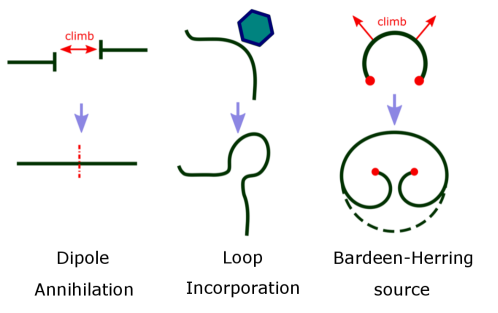
All displacement defects are considered to be immobile, except for single vacancies and single interstitials. The defects can change in size by absorption/emission of a mobile defect of the same type or of the opposite type (e.g. , or ). The mobile defects can also be absorbed at grain boundaries and dislocations, that act as a sink for them [8]. The absorption at dislocations entails dislocation climb [16]. The climb motion can lead to dipole annihilation of two dislocations of the opposite type [16]. When a dislocation segment is pinned at two points, climb of the segment can result in the creation of extra dislocation length (a Bardeen-Herring source) [17]. When the prismatic loops (which are considered immobile) absorb interstitials or emit vacancies, they may grow, or when they get in contact with other dislocations (either another prismatic loop or another dislocation line/segment), they become part of the dislocation network. This is modelled using the method of Jourdan [17], which was originally applied for faulted loops in austenitic stainless steels. Under irradiation conditions, dislocation loops first form and grow, subsequently unfault and become perfect loops. Thereafter, they interact and become part of the dislocation network [11]. In bcc metals, prismatic loops unfault at very small sizes, at least for Fe [11].
Note that even though a cluster dynamics model does not allow for direct dipole annihilation of prismatic dislocation loops, by including loop incorporation into the dislocation network density model, it becomes possible for the interstitial dislocation loops to annihilate. In Figure 3, the considered mechanisms for a change in dislocation density are shown schematically.
The concentrations of the interstitial clusters and the vacancy clusters of size and the dislocation density inside an irradiated grain follow from this set of equations:
| (5) | ||||
| (6) | ||||
| (7) |
In the first two equations, the concentrations of the interstitial and vacancy clusters of size change over time by defect generation (sources and ), by transport of mobile defects to/from the defect clusters of size providing fluxes between cluster size and the adjacent cluster sizes or (e.g. is the flux from to ), and by annihilation of mobile defects at dislocation and grain boundary sinks of total strengths and . For the interstitial clusters, a fraction of the loops of size that is about to grow, is incorporated in the dislocation network instead [17]. The third equation expresses the dislocation density evolution: more dislocations are produced by Bardeen-Herring sources based on the climb velocity and the source density , as well as by the incorporation of the prismatic loops . Dislocations annihilate by dipole annihilation, based on the average lifetime of dislocation segments, which depends on the climb velocity and on the average distance between the dislocations . See Appendix B.4 for more details. The transport fluxes and fluxes to the sinks are specified in Appendix B.5.
The production rate of defect clusters induced by neutron irradiation is based on MD-simulations of displacement cascades (50 ps simulation time) [18]. The majority of the neutron-induced defects vanish [19] by recombination of vacancies with self-interstitial atoms during thermal aging of the cascade. CD-modelling does account for recombination, as long as spatial correlations do not play an important role. A sophisticated method for transferring MD-results for neutron cascade damage into the CD-model, bridging the time scales by the use of a kinetic Monte Carlo model, can be found in [20]. Here, a simplified approach is taken: the power-law dependence found in [21] is assumed to hold, and a parameter denotes the remaining defect fraction after prolonged annealing of the MD cascade.
The production rate for a defect cluster of size is then given by
| (8) |
where is the total amount of vacancies and interstitials per atom, and with or , based on [21, 3]. Here and are temperature dependent constants that are based on MD-results, see Table 6 in Appendix B.3.
Loop incorporation
The expression for the rate with which dislocation loops are incorporated in the pre-existing dislocation network (i.e. loop incorporation) is based on [17] and is given by:
| (9) |
Here 5 is the minimum size adapted for a SIA-cluster to form a prismatic loop (in analogy with [16]), is the radius of the prismatic loop, the terms between the brackets are the growth rates of the prismatic loops from size to size by absorption of a self-interstitial atom/emission of a vacancy (further specified in Appendix B.1) and is the fraction of the growing prismatic loops of size that are incorporated, i.e. touching other dislocations. This fraction depends on the total dislocation density (the sum of all the prismatic loop dislocation densities and the network dislocation density) [17]:
| (10) |
with , , and .
Absorption/emission
The absorption rates of mobile defects at defect clusters are modelled as pure diffusion-limited [8]. For example, the absorption rate of an interstitial to a prismatic interstitial loop of size is given by , with the factor of preferential absorption of interstitials to dislocation loops, the diffusion coefficient for interstitials and is the capture radius of the prismatic loop [8]. For prismatic loops the capture radius is , where is the atomic volume and the length of the Burgers vector [8]. Similar expressions are used for the other interactions of mobile defects and clusters, as listed in Appendix B.1. For vacancy clusters, the capture radius is taken as [8], where is the lattice parameter. The rates of emission of mobile defects also depend on the binding energy of the defect to the cluster, e.g. . The binding energies are calculated using the capillarity approximation, see Appendix B.1.
Sinks for mobile defects
The sink strength (where = or , for interstitials and vacancies) is the sum of the grain boundary sink strength and the dislocation sink strength . The dislocation sink strength is given by , where is a bias factor to account for preferential absorption of interstitials. The grain boundary sink strength () depends on the sum of the sink strengths of all the other sinks within the grain (dislocations as well as defect clusters), and on the grain radius. See Appendix B.1 for the precise expressions.
Simulation parameters
A maximum cluster size = 100 is used in the simulations, along with for the damage production rate. It was verified that, compared to = 1000, the evolution of the atomic defect fraction was in reasonable agreement for most damage rates (varying from 0.001 to 1) at each of the irradiation temperatures (1000-1300°C).
2.3 Solution procedure
The two-level model is solved incrementally, as follows:
-
1.
Determination of the time step for the next time increment (see below);
- 2.
-
3.
Assignment of the grains to the HEMs: based on their bulk stored defect energy densities , the grains are placed in the HD-set when their energy exceeds the energy density threshold , (see below, HEM allocation). If HD daughter grains (see section 2.1.2) are placed in the HD-set, they are subsequently treated as regular grains;
-
4.
Nucleation: both for necklace- and bulk-type nucleation, the nucleation rates ( and ), the nucleus radii ( and ) and the activation energies ( and ) are determined, as well as the nucleation surface area () and nucleation volume (), and new grains are defined. The new nuclei are either represented by a new LD-grain, or they are merged with an existing representative grain (see below, HEM allocation). The procedure for nucleation is described in more detail in Appendix A;
-
5.
Grain growth: first, all grains except for the HD daughter grains interact with both HEMs. As a result, the grain sizes and defect densities change. If grains are vanishing, subincrements are used in this step. The use of subincrements is detailed in Appendix A. Finally, the HD-daughter grains interact with the HD-HEM only, and the grain sizes and defect densities are updated accordingly.
Time step
The size of the time step from to is chosen in such a way that during a single increment, none of the grains (except grains that are already very small, 0.3 m) grow or shrink with more than 2% of their volume, based on the volume changes determined in the previous time step :
| (11) |
Moreover, the size of the time step is constrained to increase only slowly (2-5% depending on the value) with respect to the previous time step size.
Grain growth
For a growing/shrinking grain , the (fractional) volume change due to interaction with a HEM during a time step is given by
| (12) |
Here is the fraction of the grain boundary that the grain shares with the HEM. For normal grains, there surface fractions are: (between an LD-grain and the HD-HEM), (between an HD-grain and the LD-HEM), or (between a grain and its own HEM) [3]. The total volume change of a grain is then given by . These equations are applied for all types of grain growth for the regular grains, however in case of shrinkage of a grain with respect to its own HEM, the corresponding volume change is determined such that volume is conserved within the HEM, i.e. for the HD-HEM [3]. The interactions result in new grain sizes and new defect densities for all the regular grains. Next, the HD daughter grains grow at the cost of the HD-HEM. For these interactions a grain boundary surface fraction of 1 is used. This leads to a second change in grain size within the same time increment for the HD-grains. The HD daughter grains are not treated separately anymore from the moment that (1) their radius exceeds (see Figure 4); or (2) once their bulk stored energy exceeds the threshold for becoming part of the HD-set themselves.
For all recrystallization simulations, the grain boundaries between original grains are assumed to move more slowly due to pinning effects. For those boundaries, the pinned mobility constant is used instead of , see also [3].
Nucleation
The Gibbs free energy change over time for bulk nucleation is given by:
| (13) | ||||
| whereas for necklace nucleation it is | ||||
| (14) | ||||
| (15) | ||||
The values for the derivatives and are determined numerically. To obtain the radius of the nucleus , the equation is solved. The nucleated grain size is taken as 1.01 , to ensure . If multiple solutions exist, then the largest value is adopted as the nucleus radius. The energy barrier that needs to be overcome for the formation of a stable grain is given by , where is the solution to the static case . If there is no solution, then the nucleation rate is zero for that time step.
Nucleation of new grains leads to small reductions of the sizes of other grains. The nucleation volume for grains that form in the grain interior is extracted from the HD-grains (all HD grain radii shrink with the same fraction). For necklace nucleation, the volume for nucleation is extracted similarly, but from both HEMs, where the share of each HEM is proportional to the surface fraction that it shares with the LD-grains (further detailed in Appendix A).
HEM allocation
The original grain set (consisting of 50 original representative grains) is placed in the HD-HEM at the beginning of the simulation. All nucleated grains are initially defect-free and are thus placed in the LD-HEM. As soon as the energy density threshold is reached, they are placed in the HD-HEM. The maximum amount of nucleated representative grains in the HD-HEM is restricted to 50 to limit the computation time. Furthermore up to 50 nucleated representative grains may reside in the LD-HEM. In the case of bulk nucleation, maximum 16 out of the 50 representative grains in the LD-HEM may contain HD-daughter grains (which have low defect densities).
When nucleation occurs, or when a representative grain is placed in the HD-HEM, it can be necessary to merge two representative grains together (two existing ones or an existing one with the nucleated one). Naturally, HD daughter grains and regular grains can only merge with grains of their own type. The two representative grains within a HEM that are most similar (based on the least-square difference of their bulk and surface stored energy densities and and based on the type of grain growth) are selected for merging. After merging, their properties in grain size and defect densities are averaged.
Numerical method
To solve the set of equations of the cluster dynamics model, Matlab’s solver ode15s is used for each global time increment. Non-negativity of the solution is enforced with ode15s, and a relative tolerance of is used.
In Appendix A, the solution procedure is set out in more detail, including a detailed description of the procedure with subincrements for handling grains that are completely consumed by their surroundings.
2.4 Structure-property relations
The yield strength is often considered as a key parameter for the divertor lifetime, as it gives an indication for the material hardening and embrittlement. Here, the evolution of the hardness is assessed, based on the predicted evolution of the microstructure.
The hardening (which is proportional to the yield strength increase) of neutron-irradiated tungsten has been measured using Vickers micro-indentation tests for various doses and temperatures, as summarized in [22, 23]. TEM and positron annihilation spectroscopy (PAS) were used to link the hardness increase to the microstructural changes. Hu et al. [24] performed isochronal annealing testing following neutron irradiation of tungsten samples with neutrons at a temperature of 90 °C to 0.006 dpa and 0.03 dpa. They investigated the evolution of the Vickers hardness, vacancy clusters (with sizes ranging from monovacancies to several nm using PAS and TEM) and interstitial clusters (of at least 1 nm) as the temperature was increased. Their results suggest that vacancy clusters with sizes above 1 nm dominate the hardening, but small interstitial clusters were not taken into account in their analysis, as they are not detectable by PAS or TEM techniques. In [25], ion-irradiation was used to study the hardening of pure W and of W-3%Re at temperatures of 500 and 800 °C and at high doses of up to 5 dpa. Nano-indentation tests showed a saturation of the hardening at 1 dpa. For W-3%Re, less hardening was found and this was attributed to the lower amount of voids (determined using TEM) [25].
In [23], Hu et al. predicted the hardness increase based on the TEM-observed sizes and densities of the voids, dislocation loops and precipitates, by using the dispersed barrier hardening (DBH) model, using experimental results that were obtained in three different reactors HFIR, JMTR and JOYO [26, 27, 28, 29, 23]. The defect barrier strengths, different for every defect type and size, were chosen such that the DBH-model and the measured Vickers hardness adequately matched for most samples. Their results suggest that the hardness increase is dose dependent but not strongly temperature dependent. Voids of over 4 nm were identified as the main contributors to hardening in most cases, except for samples that received doses of above 1.5 dpa in the HFIR-reactor. In the latter case, the precipitates were the dominant defect contributing to hardening, according to their DBH-model [23]. Huang et al. [7] simulated the hardness increase in the reactors DEMO, HFIR and JOYO using stochastic cluster dynamics (SCD), including Re-transmutations, for temperatures of 400-800 °C and for doses up to 2 dpa. They found precipitates to be the main contributor to hardening, already for doses of 0.5 dpa, for each of the three reactors. Between voids and dislocation loops, the latter contributed more to the hardening than the voids, in most of the cases. The predicted hardness increases were in the order of 5-20 GPa. Without explicit formation of precipitates, the measured displacement-induced irradiation hardening does generally not exceed 4 GPa (see Hu et al. [23]). In [30], stochastic cluster dynamics (SCD) was used to predict hardening in the fission reactor JOYO and in ITER. In this case, the production of He gas was taken into account but not the Re-precipitation. Low hardening values were found in the order of 100 MPa.
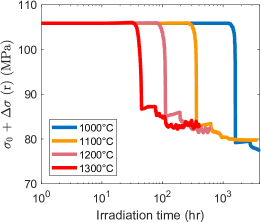
The yield strength depends on the concentrations of the vacancy and interstitial clusters, the dislocation network density and the grain size (grain boundary density). Each of these defect types form obstacles that restrict dislocations in their motion. The yield strength is then given by:
| (16) | ||||
| with the yield strength of coarse grained recrystallized tungsten, the grain boundary hardening contribution and the hardening contributions of the dislocation network density and the vacancy and interstitial clusters. The Hall-Petch relation describes the grain size dependence, the Taylor relation [31, 32] the effect of dislocation hardening and the Dispersed Barrier Hardening Model [23] the contributions of the vacancy and interstitial clusters. Combining the contributions in a similar manner as in [33, 34] leads to: | ||||
| (17) | ||||
with . In the grain size contribution, is the grain radius, is the radius of the defect type that forms the barrier and is a constant. should be dependent on the temperature, but here, a value of 0.099 MPa m1/2 is used, based on experimental results by Vashi [35]. For , 64 MPa is used (the value for recrystallized tungsten at 1200 °C, taken from [IMPH2013]). In the contributions of the various defect types, is the Taylor factor, is the shear modulus, is the defect barrier strength factor (for perfectly strong barriers to dislocations, ) and is the defect concentration. The parameter values are given in Table 5 (Appendix B.3) and in section 3.2. In the simulations, the parameters and are treated as temperature independent and also given in Table 5. The yield strength increase is directly related to the Vickers hardness increase [23]. In this work, only the qualitative aspects of the hardness evolution under the combined effects of irradiation, recrystallization and grain growth are studied. Therefore, a hardness indicator is introduced:
| (18) |
where is the initial network dislocation density. The Hall-Petch effect is neglected in this expression.
3 Results
This section analyses how the microstructural evolution of tungsten, under combined heat and neutron loads, is affected by loop incorporation and bulk nucleation, as an extension to the work done in [3]. In section 3.1, the effects of loop incorporation on the defect concentration distribution and on the defect energy evolution of individual grains are studied. Next, in section 3.2, the temperature-dependent neutron-induced recrystallization with loop incorporation is explored and a prediction of the irradiation hardening during the process is made. The effects of bulk nucleation are described in section 3.3.
3.1 Single grain
First, the effect of the incorporation of prismatic loops on the microstructural evolution of tungsten at high irradiation temperatures is investigated using the cluster dynamics model only. In Figure 5a, the concentration distribution in a grain of 3 m after 100 hrs of irradiation at a temperature of 1100 °C is shown, with and without loop incorporation, using an initial dislocation density of m-2.
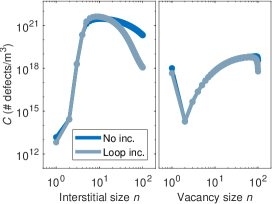
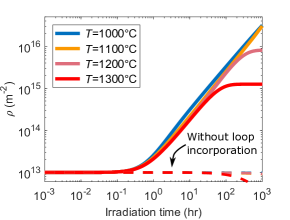
As visible in Figure 5a, loop incorporation leads to a decrease in the concentration of the largest interstitial clusters and to an increase of the dislocation network density (see Figure 5b). Note that without the loop incorporation mechanism, the dislocation density in the simulations stays close to m-2. The strength of the sinks for the mobile defects (the grain boundaries and the dislocations) thus increases and with that, the concentrations of the single vacancies and single SIAs decrease. The concentration of the interstitial clusters of intermediate size ( to 25) increases slightly, whereas the concentration of the largest vacancy clusters decreases somewhat. The dislocation density, shown in Figure 5b, rises considerably for all simulated temperatures when loop incorporation is included, approaching the physical limit for the dislocation density in metals, m-2 [37].
Figure 6 shows the evolution of the bulk stored energy density inside the grain, with and without the loop incorporation mechanism.
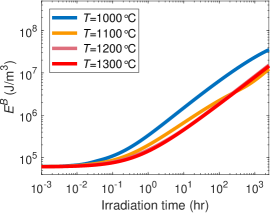
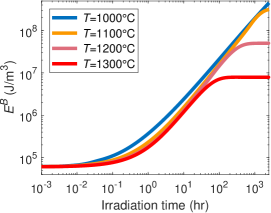
Figures 6a and 6b reveal that at longer irradiation times, the temperature dependence of the bulk stored energy density becomes more pronounced when loop incorporation is included in the simulations, reaching much higher values for the lower temperatures (1000 °C - 1200 °C) and a similar/lower value at 1300 °C. Comparison of Figure 5b and Figure 6b indicates that the value of is largely determined by the dislocation network density. Furthermore, when loop incorporation is included, saturation of the stored energy density in the single grain occurs. For e.g. 1300 °C, this occurs within 100 hours and for 1100 °C, saturation is reached at 2500 hours.
As an example, the influence of the damage rate and on the results is shown for °C in Figure 14 in Appendix C.1.
3.2 NIRX with loop incorporation
Previously, the competition between damage and recovery during the microstructural evolution of tungsten under heat and neutron loads was already investigated in [3], omitting loop incorporation. It was found that the original grains, which accumulate defect energy during irradiation, all shrink simultaneously at the cost of newly nucleated grains. This simultaneous loss of the original grains triggered temporal fluctuations in the average stored energy density in the microstructure . Now that loop incorporation is included, shows fluctuations that are clearly periodic, see Figure 7a. Before, only the first undulation was clear. The undulations in correspond to the cyclic recrystallization of the entire irradiated microstructure [3]. For the simulations displayed in Figure 7, an energy density threshold J/m3 was used. In all original grains the initial dislocation density was m-2. The defect-free volume has a dislocation density m-2. For the initial vacancy and interstitial defect concentrations, thermal equilibrium values were used. The 50 original representative grains had a number average radius of = 3 m and a standard deviation of = 0.5 m.
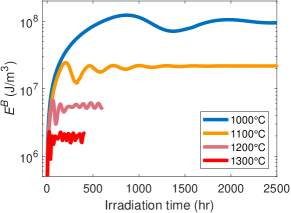
The time period characterizing cyclic recrystallization is temperature-dependent. Over time, the behaviour of the individual grains becomes less synchronized, and the amplitude of the fluctuations of decreases and the stored energy density evolves to a temperature-dependent equilibrium value. For temperatures of 1200 °C - 1300 °C, oscillates around the equilibrium value.
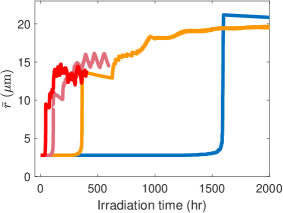
The average grain size, shown in Figure 7b, does not reveal a strong temperature dependence. Both the evolution of the grain size and of the defect density depend strongly on the nucleation rate, see Figure 8a.
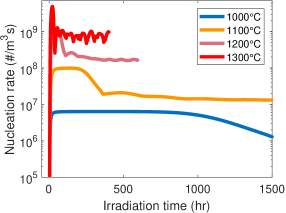
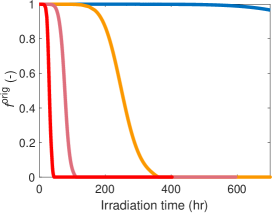
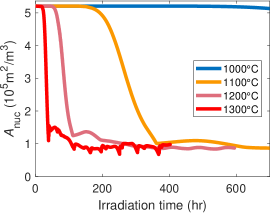
At each temperature the nucleation rate shows a clear drop when the nucleation surface area has decreased, which occurs when the grain size has increased (when the original microstructure has been replaced). The nucleation rate depends on the choice of the energy density threshold , since all the grain boundaries of the HD-grains act as nucleation surfaces. From Figure 8b it becomes clear that the fraction of the total microstructural volume that resides in the high defect density medium is close to 1 most of the time for the temperatures up to 1200 °C. From 1200 °C, the surface area that is available for nucleation per unit volume (Figure 8c) fluctuates, which leads to variations in the nucleation rate and in .
Distributions in grain size and defect density
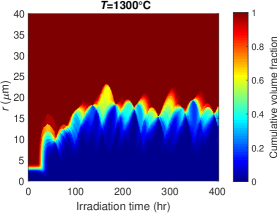
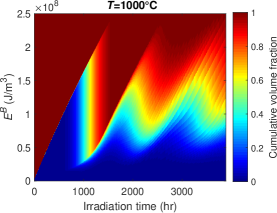
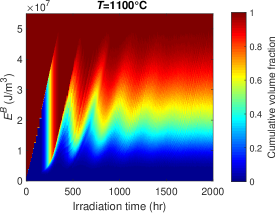
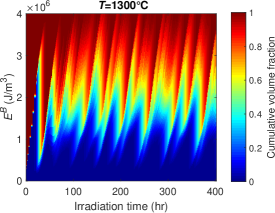
In Figure 9, the evolution of the bulk energy density distribution and grain size distribution are shown for an irradiation temperature of 1200 °C.
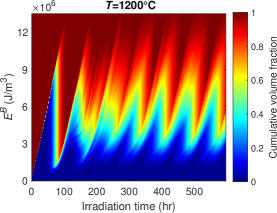
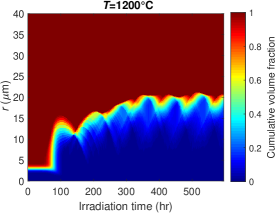
Over time, the distributions broaden, i.e. the microstructure becomes more heterogeneous and recrystallization becomes more gradual. This explains the decrease in the amplitude of in Figure 7 after the first 200 hours. The evolution of the grain size and energy distributions at the other simulated temperatures are reported in Figure 15 and Figure 16 in Appendix C.2.
Irradiation hardening
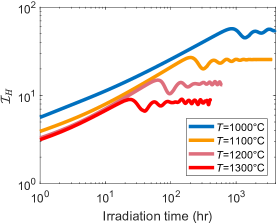
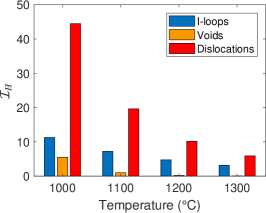
The evolution of the irradiation hardening was predicted, using the values in Table 1 for the DBH-model for the indicated cluster sizes. In Figure 10a, the results are shown, in comparison with results from Vicker’s hardness tests on samples that were irradiated in the fission reactors HFIR, JOYO and JMTR [23]. Figure 10b exclusively shows the (negligible) effect of the grain size on the evolution of the yield strength, based on the Hall-Petch relation. The contributions of the different defect types to the irradiation hardening indicator, taken at time instances of the maximum value for the hardness indicator, are shown in Figure 10c.
| Barrier strength factor | Diameter (nm) | Cluster size | |
|---|---|---|---|
| Interstitial loop | 0.15 | 1.0 - 2.7 | 14 - 100 |
| Void | 0.25 | 1.0 - 1.4 | 33 - 100 |
Under the selected neutron displacement damage rate, the hardness indicator increases during the first 20-900 hours of irradiation (for 1300°C and 1000°C). Subsequently, cyclic recrystallization leads to a periodic increase and decrease of the hardness indicator. The hardness indicator reaches a maximum value of 10-80 times the initial value (=1).
Figure 10c reveals it can be seen that the contribution of the dislocation network density to the hardening is the highest at each of the simulated temperatures, which is logical based on the high dislocation density reached, see Figure 5b. In [24], it is suggested that the large voids are the main defects that are responsible for the hardness increase. Therefore, additional simulations were performed using the cluster dynamics model at 1100 °C on a single grain of 3 m for increasing maximum vacancy cluster size . The results (not displayed here) showed that the evolution of the hardness is almost converged for , as expected, since the same holds for , indicating that large clusters would not play a significant role in the hardness prediction for this model.
In the present analysis, the influence of the grain boundaries on the yield strength is taken into account only partly. In [10], it is pointed out that at high temperatures, the grain boundary loses strength relative to the grain interior. Furthermore, recrystallization and grain growth may lead to an increase of impurities at the grain boundaries, some of which may cause embrittlement at the grain boundaries [38, 39].
3.3 NIRX with bulk nucleation
The effect of nucleation in the bulk (on top of necklace-type nucleation) on the microstructural evolution is next studied for an irradiation temperature of 1100 °C. The parameter for the reduction of the activation energy for nucleation in the bulk is varied from - and (#/m3s) is used. An energy density threshold of J/m3 is adopted. To ensure that most newly nucleated grains that are indeed growing, = 1.3 is taken.
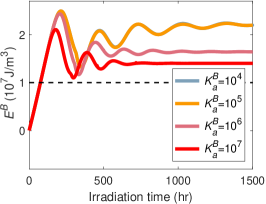
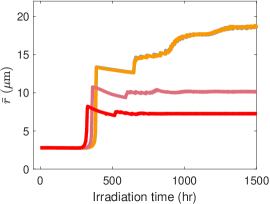
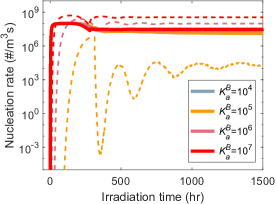
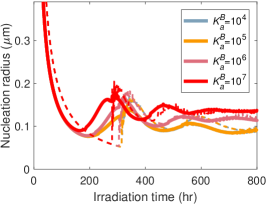
Figure 11 depicts the effects of bulk nucleation on the microstructural evolution. At this temperature, the effects of bulk nucleation on the average grain size and defect energy become visible for values of larger than ( overlaps with in the figure). For these values, the nucleation rate in the bulk is in the same order of, or exceeds, the necklace-type nucleation rate, see Figure 11c. The total nucleation rate increases, which leads to a faster replacement of the original grains (visible from the first dip in ) and to a shorter cycle for the cyclic recrystallization. The equilibrium value for drops, as well as the average grain size . At , the bulk nucleation rate strongly depends on (indirectly, through the calculation of ), while for , the bulk nucleation barrier becomes so small that the nucleation rate does not depend on the stored energy density anymore.
Evolution of individual nuclei
It is investigated whether the nucleation spot (in the bulk or at the grain boundaries) has a significant effect on the evolution of a nucleus. For this, the simulation at 1100 °C and is used. During the simulation, a single grain in the bulk and a single grain at the grain boundary are nucleated at specific irradiation times. The grains represent a negligible microstructural volume and therefore do not affect the evolution of the other representative grains. They are not allowed to merge with any other grains, so that the development of their size and stored defect energy can be traced.
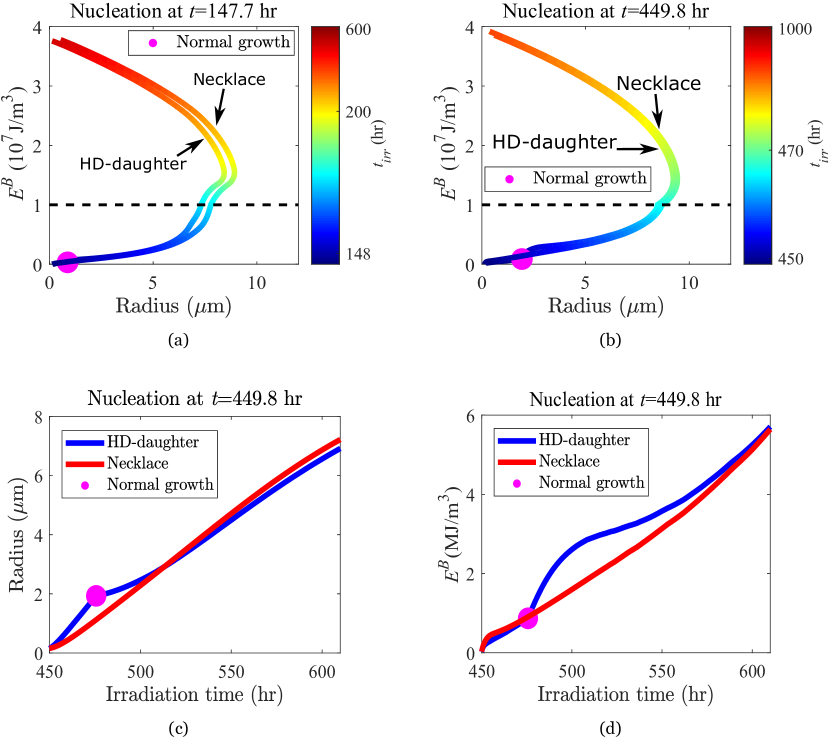
Figure 12 shows the results of the evolution of the individual HD daughter grain and necklace nucleated grain for initiation after 147.7 hours and 449.8 hours of irradiation. The evolution paths for both grains are quite similar, but not the same. The necklace nucleated grain reaches a slightly higher maximum radius than the HD daughter grain; this was the case for each of the initiation times that were simulated approximately every 50 hours, ranging from 50 to 500 hours). The point at which the HD daughter grain resumes normal growth is marked. Figure 12c and 12d explain why the -paths in Figure 12b do not overlap: the HD daughter starts with a much faster growth than the necklace nucleated grain. After resuming normal growth, the defect energy accumulates rapidly. The paths in the graphs are quite similar but not fully synchronized in time, as is clearified by Figure 12c and d.
4 Conclusions and discussion
A model was developed for neutron-induced recrystallization using cluster dynamics and a mean-field recrystallization model. The model includes the incorporation of interstitial loops to become part of the dislocation network and nucleation in both the bulk and at the grain boundaries. In the recrystallization model, distinction was made between the growth mechanism of a bulk nucleus and of a grain boundary nucleus. The effects of nucleation in the bulk on the evolution of the overall microstructural behavior and the evolution of individual grains were investigated. The predicted microstructural properties were used to make qualitative predictions for the evolution of the hardness during the neutron-induced recrystallization.
With the loop incorporation included, a cyclic neutron-induced recrystallization process is systematically predicted. This cyclic behaviour is apparent from the evolution of the bulk stored energy density, as well as from the evolution of the grain size and grain energy distributions. The period for complete renewal of the grains is clearly temperature-dependent. Over time the microstructure becomes more heterogenous and the periodicity fades out.
Based on the concentrations of the vacancy clusters, interstitial clusters and dislocation densities, the increasing hardness was assessed, using a hardness indicator. The type of defects that dominate the hardening in these simulations were identified as dislocations. The Hall-Petch effect was shown to be negligible in comparison to the hardening due to obstacles at the grain interior; the evolution of the integrity of the grain boundaries was not taken into account here. The obtained simulation results on the evolution of the hardness call for more experimental results on the evolution of this quantity under irradiation, also for low doses. The inclusion of loop incorporation as a mechanism into the model leads to high values for the dislocation density and to a (faster) saturation of the defect concentrations in a single grain, when recrystallization is not included (as was shown in cluster dynamics simulations on a single grain).
The effect of bulk nucleation on the evolution of the microstructural properties has been studied. Depending on the nucleation barrier, the bulk nucleation rate may heavily depend on for large barriers, or only very little if the nucleation barrier is very low. A higher total nucleation rate will lead to a lower equilibrium value for , a smaller average grain size and a shorter period for cyclic recrystallization. Nuclei that form and grow in the bulk initially grow faster and accumulate less damage; afterwards they evolve quite similarly as necklace nucleated grains. Because of their faster initial growth, they accumulate a somewhat higher bulk stored defect energy density, which leads to a lower maximum grain size.
One way to increase the lifetime of the divertor monoblocks could be by means of a heat treatment. With the developed model, it can be explored what the effect of possible heat treatments on the microstructural evolution could be. By linking the mechanical properties to the microstructural properties, an optimal microstructure may be determined. This model can then be applied to identify the conditions under which such a microstructure can be formed.
5 Data availability
The data generated or analysed in this study are available upon simple request.
Appendix A Solution procedure
The following steps are taken to solve the grain growth and nucleation model.
Nucleation
The procedure is explained for necklace nucleation. For bulk nucleation, a similar procedure is used. The main differences are pointed out.
-
1.
The volume averaged total HEM-energy densities and and the volume averaged bulk stored energy densities of the HEMs, and are calculated, as well as the total energy density and bulk energy density for each grain .
-
•
Here, , where and are the concentrations of clusters and in grain .
-
•
-
2.
The mobile surface fractions and are calculated:
-
•
The volume fraction of LD-grains: .
-
•
The mobile surface fraction of LD grains is given by . The condition of volume conservation (the total volume transferring from LD to HD should equal the total volume that transfers from HD to LD) is met by using:
. -
•
The maximum value of is limited to 1. In that case is calculated based on , such that volume conservation is met.
-
•
-
3.
and .
-
4.
The numerical derivatives and are calculated using a linear least-squares fit to approximate the derivative:
, where the results of the last hour of irradiation are used. -
5.
The radius and activation energy for necklace nucleation are determined:
-
•
All roots of to the polynomial =0 are determined. The largest real solution is .
-
•
The static solution is calculated.
-
•
The candidate solution for the nucleus radius is .
-
•
If , then the candidate solution is stable. If this is the case, then . If not, then .
-
•
-
6.
The nucleation surface area, which consists of all HD/HD and HD/LD-grain boundaries, is .
-
7.
The amount of new nuclei in this time increment is:
. -
8.
The total nucleation volume . This nucleation volume is delivered by the other grains. The new radii for the HD- and LD-grains are respectively:
-
•
;
-
•
.
-
•
-
9.
For bulk nucleation, the procedure is similar, with main differences:
-
•
;
-
•
The new radii for the HD-grains change a second time during the nucleation procedure, to become:
.
-
•
-
10.
The nucleated grains are added to the LD-set. If necessary, the merging procedure is used. In this procedure, and are calculated for all grains that exist within the HEM (that are of the same type) and for the grain that will be added to the set during the procedure. For each of the candidates for merging, the square difference with all the other grains, , is calculated. The grains with the smallest square difference are merged. The grain properties are volume averaged.
-
11.
If any HD daughter grain satisfies , it is subsequently treated as a normal grain.
Grain Growth
-
1.
The HD-daughter grains that grow only at the expense of the HD-interior, are kept separate. For all the other grains, steps 2-6 are performed.
-
2.
The energy density difference for each grain is computed.
-
3.
The mobile surface fractions and are computed.
-
4.
The volume changes per grain are computed. For LD-grains that shrink with respect to their own HEM, is used, and likewise for the HD-grains that shrink with respect to their own HEM.
-
5.
Based on the volume changes, the concentrations and the new grain radii are updated. The new concentrations are , where is the concentration of a certain defect of a certain grain , is the defect-free volume that is added to the grain and is the grain volume at time . The thermal equilibrium concentrations for vacancy and interstitial defects are determined from their formation energies: .
-
6.
In case a grain volume becomes negative during the increment, the following procedure is used:
-
•
A subincrement for the time step is used, for which the grain exactly vanishes: , see Figure 13.
-
•
Steps 2-6 of the grain growth routine are repeated, starting from , using the subincrement .
-
•
To complete the increment, steps 2-5 of the grain growth routine are repeated, starting from , using a time step size (see Figure 13). In case another grain volume becomes negative during the remainder of the increment, the time interval is further subdivided using the described procedure.
-
•
-
7.
Finally, each HD-daughter grain interacts with the HD-HEM, leading to a volume change of: . Using this, the new grain radius and new defect concentrations are calculated.
Appendix B Modelling details
B.1 Rate coefficient details
The formulas for computation of each rate coefficient can be found in Table 2. The parameter values that have been used can be found in Table 5.
| Dislocation loop | ||
|---|---|---|
| Absorption rate | Emission rate | |
| Interstitial | ||
| Vacancy | ||
| VI-recombination | ||
| Vacancy cluster | ||
| Absorption rate | Emission rate | |
| Interstitial | ||
| Vacancy | ||
| Dislocation sink | |
|---|---|
| Interstitial | |
| Vacancy | |
| Grain boundary sink | |
| Interstitial | |
| Vacancy | |
| Sink strength coefficient for GB-sink strength calculation (based on [40]) | |
| Binding energy (using the capillarity approximation) | |
| Diffusion coefficients | |
| Dislocation bias factor | |
B.2 Entropy of point defect clusters
The point defect clusters contribute to the entropy of mixing of the system. As long as the defect density can be called dilute, the sum of all the individual contributions of each defect type to the mixing entropy can be taken as [41].
| (19) |
is the entropy density (J/(m3K)) and is the number of possible configurations of the defects in the material, with:
| (20) | ||||
Here denotes the number of point defects in the cluster, is the number of lattice sites that is availabe in a unit volume. If the unit volume is 1 m3, then and if the concentrations are in atomic units, then . Lastly, is the defect distribution.
B.3 Model parameters
| Parameter | Unit | Value | Description | Source |
|---|---|---|---|---|
| nm | 0.31652 | Lattice parameter | [42] | |
| J/m2 | 0.869 | GB-surface energy | [14] | |
| m2/s | 0.27 | Self-diffusivity | Estimated, | |
| along grain boundaries | using [42] | |||
| nm | 1 | GB thickness | [43] | |
| m2/s | 8.77 | SIA-diffusivity | [44] | |
| m2/s | 177 | Vacancy diffusivity | [44] | |
| eV | 9.466 | Formation energy SIA | [8] | |
| eV | 3.80 | Formation energy vacancy | [8] | |
| eV | 2.12 | Binding energy SIA-SIA | [8] | |
| eV | 0.6559 | Binding energy V-V | [8] | |
| eV | 0.013 | SIA migration energy | [44] | |
| eV | 1.66 | Vacancy migration energy | [44] | |
| - | 1 | Nucleation activation energy reduction | - | |
| - | 1.8 | GB mobility parameter | - | |
| - | 25 | GB mobility parameter with pinning | - | |
| #/m2s | 3.16 | Necklace nucleation rate constant | - | |
| #/m3s | 1 | Bulk nucleation rate constant | - | |
| - | 3.06 | Taylor factor | [45] | |
| Pa | 161 | Shear modulus () | [42] | |
| - | 100 | Maximum cluster size | - | |
| J/mol | 4 | Activation energy for GB mobility | [42] | |
| nm | 0.465 | Recombination radius | [8] | |
| m-2 | 109 | Equilibrium dislocation density | - | |
| - | 1.2 | SIA-dislocation bias | [8] | |
| - | 1 | V-dislocation bias | [8] |
| (K) | ( defects/atom s) | ||
|---|---|---|---|
| 300 | 4.3 | 2.20 | 1.63 |
| 1025 | 3.3 | 2.50 | 1.86 |
| 2050 | 3.1 | 2.17 | 2.42 |
B.4 Dislocation evolution details
Here, the expressions governing the evolution of the dislocation density (Equation 7), based on [16], are given. The density of the Bardeen-Herring sources depends on the pinned dislocation density as . The pinned dislocation density is assumed to be given by , following [16]. The dislocations climb with a velocity , which is given by . Here and are the same dislocation biases as in the equations for the rate coefficients, see Appendices B.3 and B.1, and are the dislocations outer and core radii ( is used here) and is the equilibrium concentrations of vacancies nearby a dislocation. depends on the equilibrium vacancy concentration in the bulk and on the internal stress due to immobilized dislocations, by: [10], with , where is a geometric parameter and is the shear modulus. Finally, the dislocations can travel a distance before they annihilate.
B.5 Cluster evolution details
The full set of cluster dynamics equations is given below, adapted from [8]. At every cluster growth term, a factor is added to account for the incorporation of prismatic loops, after [17].
The full Cluster Dynamics equations
Appendix C Additional results
C.1 Influence of the damage rate on the cluster dynamics results
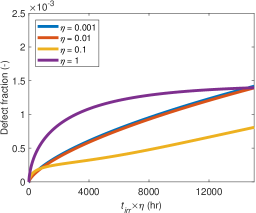
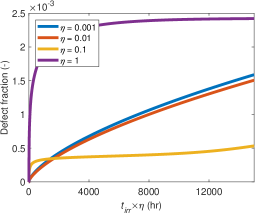
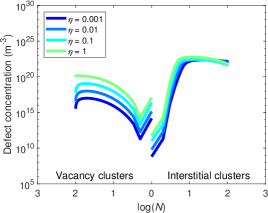
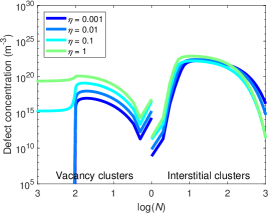
To illustrate the influence of the damage rate on the results produced with the cluster dynamics model, the evolution of the defect fractions and the final concentration distributions are shown for = 0.001, 0.01, 0.1 and 1 and for = 100 and 1000, at an irradiation temperature of 1000 °C, in Figure 14. For simplicity, loop incorporation is not considered in these simulations. The trends are the same for both values of . The origin of the differences in the results for the different damage rates is simple, i.e.: at low damage rates, it takes longer for the material to receive the same amount of damage. Therefore, the mobile defects have more time to diffuse to sinks (dislocations, grain boundaries). Moreover, vacancy clusters have more time to emit vacancies and SIA-clusters absorb more vacancies. This leads to lower concentrations for the mobile defects, vacancy clusters and the SIA-clusters of medium size. The concentrations of the large SIA-clusters are not significantly affected at this stage. Later on, the lower concentration of medium-sized SIA-clusters leads to considerable absorption of mobile SIAs at large SIA-clusters, for the lowest damage rate (=0.001). The differences in defect concentrations that thus form, explain the differences in the evolution of the defect fraction. The defect fraction evolves linearly with the amount of applied damage, diminished by the annihilation rate at defect sinks. From the results, it was found that for each damage rate, initially, the main defect sinks are vacancies and dislocations. From roughly =0.1 hr, the main manner in which mobile defects are removed, is by the absorption of vacancies at SIA-clusters.
C.2 Evolution of the grain size distribution
References
- [1] H. Bolt, V. Barabash, W. Krauss, J. Linke, R. Neu, S. Suzuki, N. Yoshida, and ASDEX Upgrade Team. Materials for the plasma-facing components of fusion reactors. In: Journal of Nuclear Materials 329 (2004), pp. 66-73.
- [2] W. V. Vaidya and K. Ehrlich. Radiation-induced recrystallization, its cause and consequences in heavy-ion irradiated 20p cold-drawn steels of type 1.4970. In: Journal of Nuclear Materials 113 (1983), pp. 149-162.
- [3] A. Mannheim, J. A. W. van Dommelen, and M. G. D. Geers. Modelling recrystallization and grain growth of tungsten induced by neutron displacement defects. In: Mechanics of Materials 123 (2018), pp. 43-58.
- [4] D. Kaoumi, A. T. Motta, and R. C. Birtcher. A thermal spike model of grain growth under irradiation. In: Journal of Applied Physics 104 (2008), p. 073525.
- [5] F. Ferroni, X. Yi, K. Arakawa, S. P. Fitzgerald, P. D. Edmondson, and S. G. Roberts. High temperature annealing of ion irradiated tungsten. In: Acta Materialia 90 (2015), pp. 380-393.
- [6] N. Castin, G. Bonny, A. Bakaev, C. J. Ortiz, A. E. Sand, and D. Terentyev. Object kinetic Monte Carlo model for neutron and ion irradiation in tungsten: Impact of transmutation and carbon impurities. In: Journal of Nuclear Materials 500 (2018), pp. 15-25.
- [7] C. H. Huang, M. R. Gilbert, and J. Marian. Simulating irradiation hardening in tungsten under fast neutron irradiation including Re production by transmutation. In: Journal of Nuclear Materials 499 (2018), pp. 204-215.
- [8] Y. G. Li, W. H. Zhou, R. H. Ning, L. F. Huang, Z. Zeng, and X. Ju. A cluster dynamics model for accumulation of helium in tungsten under helium ions and neutron irradiation. In: Communications in Computational Physics 11 (2012), pp. 1547-1568.
- [9] P. Bernard, S. Bag, K. Huang, and R. E. Logé. A two-site mean-field model of discontinuous dynamic recrystallization. In: Materials Science and Engineering A 528 (2011), pp. 7357-7367.
- [10] G. S. Was. Fundamentals of Radiation Materials Science. Springer, 2007, p. 839. isbn: 9783540494713.
- [11] S. J. Zinkle. Radiation-induced effects on microstructure. 1st ed. Vol. 1. Elsevier Inc., 2012, pp. 65-98. isbn: 9780080560335.
- [12] A. Patra and D. L. McDowell. Crystal plasticity investigation of the microstructural factors influencing dislocation channeling in a model irradiated bcc material. In: Acta Materialia 110 (2016), pp. 364-376.
- [13] D. G. Cram, H. S. Zurob, Y. J. M. Brechet, and C. R. Hutchinson. Modelling discontinuous dynamic recrystallization using a physically based model for nucleation. In: Acta Materialia 57 (2009), pp. 5218-5228.
- [14] A. Lopez. Thermal stability of warm-rolled tungsten. PhD Thesis. Technical University of Denmark, 2015.
- [15] J. Rest. A model for the influence of microstructure, precipitate pinning and fission gas behavior on irradiation-induced recrystallization of nuclear fuels. In: Journal of Nuclear Materials 326 (2004), pp. 175-184.
- [16] R. E. Stoller. Modeling dislocation evolution in irradiated alloys. In: Metallurgical Transactions A 21 (1990), pp. 1829-1837.
- [17] T. Jourdan. Influence of dislocation and dislocation loop biases on microstructures simulated by rate equation cluster dynamics. In: Journal of Nuclear Materials 467 (2015), pp. 286-301.
- [18] W. Setyawan, G. Nandipati, K.J. Roche, H. L. Heinisch, B. D. Wirth, and R. J. Kurtz. Displacement cascades and defects annealing in tungsten, Part I: defect database from molecular dynamics simulations. In: Journal of Nuclear Materials 462 (2015), pp. 329-337.
- [19] K. Nordlund, S. J. Zinkle, A. E. Sand, F. Granberg, R. S. Averback, R. E. Stoller, T. Suzudo, L. Malerba, F. Banhart, W. J. Weber, F. Willaime, S. L. Dudarev, and D. Simeone. Primary radiation damage: A review of current understanding and models. In: Journal of Nuclear Materials 512 (2018), pp. 450-479.
- [20] T. Jourdan and J. P. Crocombette. On the transfer of cascades from primary damage codes to rate equation cluster dynamics and its relation to experiments. In: Computational Materials Science 145 (2018), pp. 235-243.
- [21] X. Yi, A. E. Sand, D. R. Mason, M. A. Kirk, S. G. Roberts, K. Nordlund, and S. L. Dudarev. Direct observation of size scaling and elastic interaction between nano-scale defects in collision cascades. In: Europhysics Letters 110 (2015), p. 36001.
- [22] M. Fukuda, N. A. P. Kiran Kumar, T. Koyanagi, L. M. Garrison, L. L. Snead, Y. Katoh, and A. Hasegawa. Neutron energy spectrum influence on irradiation hardening and microstructural development of tungsten. In: Journal of Nuclear Materials 479 (2016), pp. 249-254.
- [23] X. Hu, T. Koyanagi, M. Fukuda, N. A. P. Kiran Kumar, L. L. Snead, B. D. Wirth, and Y. Katoh. Irradiation hardening of pure tungsten exposed to neutron irradiation. In: Journal of Nuclear Materials 480 (2016), pp. 235-243.
- [24] X. Hu, T. Koyanagi, M. Fukuda, Y. Katoh, L. L. Snead, and B. D. Wirth. Defect evolution in single crystalline tungsten following low temperature and low dose neutron irradiation. In: Journal of Nuclear Materials 470 (2016), pp. 278-289.
- [25] T. Hwang, M. Fukuda, S. Nogami, A. Hasegawa, H. Usami, K. Yabuuchi, K. Ozawa, and H. Tanigawa. Effect of selfion irradiation on hardening and microstructure of tungsten. In: 9 (2016), pp. 430-435.
- [26] J. C. He, G. Y. Tang, A. Hasegawa, and K. Abe. Microstructural development and irradiation hardening of W and W+(3-26) wt% Re alloys after high-temperature neutron irradiation to 0.15 dpa. In: Nuclear Fusion 46 (2006), pp. 877-883.
- [27] T. Tanno, A. Hasegawa, J. -C. He, M. Fujiwara, S. Nogami, M. Satou, T. Shishido, and K. Abe. Effects of transmutation elements on neutron irradiation hardening of tungsten. In: Materials Transactions 48 (2007), pp. 2399-2402.
- [28] M. Fukuda, T. Tanno, S. Nogami, and A. Hasegawa. Effects of Re content and fabrication process on microstructural changes and hardening in neutron irradiated tungsten. In: Materials Transactions 53 (2012), pp. 2145-2150.
- [29] A. Hasegawa, M. Fukuda, T. Tanno, and S. Nogami. Neutron irradiation behavior of tungsten. In: Materials Transactions 54 (2013), pp. 466-471.
- [30] J. Marian and T. L. Hoang. Modeling fast neutron irradiation damage accumulation in tungsten. In: Journal of Nuclear Materials 429 (2012), pp. 293-297.
- [31] G. I. Taylor. The Mechanism of Plastic Deformation of Crystals. Part I. Theoretical. In: Proceedings of the Royal Society of Londen. Series A. 145 (1934), pp. 362-387.
- [32] K. M. Davoudi and J. J. Vlassak. Dislocation Evolution During Plastic Deformation: Equations vs. Discrete Dislocation Simulations. In: arXiv preprint arXiv:1408.6609 (2014), pp. 1-23.
- [33] F. A. Garner, M. L. Hamilton, N. F. Panayotou, and G. D. Johnson. The microstructural origins of yield strength changes in AISI 316 during fission or fusion irradiation. In: Journal of Nuclear Materials 104 (1981), pp. 803-808.
- [34] N. Hansen. Hall Petch relation and boundary strengthening. In: Scripta Materialia 51 (2004), pp. 801-806.
- [35] U. K. Vashi, R. W. Armstrong, and G. E. Zima. The hardness and grain size of consolidated fine tungsten powder. In: Metallurgical Transactions 1 (1970), pp. 1769-1771.
- [36] V. Barabash. Historical baseline document: Appendix A, materials design limit data. In: ITER (2013).
- [37] R. M. J. Cotterill. Does dislocation density have a natural limit? In: Physics Letters A 60 (1977), pp. 61-62.
- [38] W. Setyawan and R. J. Kurtz. Effects of transition metals on the grain boundary cohesion in tungsten. In: Scripta Materialia 66 (2012), pp. 558-561.
- [39] D. Scheiber, R. Pippan, P. Puschnig, and L. Romaner. Ab initio calculations of grain boundaries in bcc metals. In: Modelling and Simulation in Materials Science and Engineering 24 (2016), p. 35013.
- [40] R. Bullough and M. H. Wood. Mechanisms of radiation induced creep and growth. In: Journal of Nuclear Materials 90 (1980), pp. 1-21.
- [41] D. R. Olander. Fundamental aspects of nuclear reactor fuel elements. California: California University, 1972.
- [42] E. Lassner and W. Schubert. The element tungsten. Springer, 1999.
- [43] J. Favre, D. Fabregue, D. Piot, N. Tang, Y. Koizumi, E. Maire, and A. Chiba. Modeling grain boundary motion and dynamic recrystallization in pure metals. In: The Minerals, Metals and Materials Society 44 (2013), pp. 5861-5875.
- [44] T. Faney. Numerical simulations of tungsten under helium irradiation. PhD thesis. University of California, Berkeley, 2013.
- [45] R. E. Stoller and S. J. Zinkle. On the relationship between uniaxial yield strength and resolved shear stress in polycrystalline materials. In: Journal of Nuclear Materials 283-287 (2000), pp. 349-352.