Investigating the origin of the faint non-thermal emission of the Arches cluster using the 2015-2016 NuSTAR and XMM–Newton X-ray observations
Abstract
Recent NuSTAR and XMM–Newton observations of the molecular cloud around the Arches stellar cluster demonstrate a dramatic change both in morphology and intensity of its non-thermal X-ray emission, similar to that observed in many molecular clouds of the Central Molecular Zone at the Galactic Center. These variations trace the propagation of illuminating fronts, presumably induced by past flaring activities of Sgr A⋆. In this paper we present results of a long NuSTAR observation of the Arches complex in 2016, taken a year after the previous XMMNuSTAR observations which revealed a strong decline in the cloud emission. The 2016 NuSTAR observation shows that both the non-thermal continuum emission and the Fe 6.4 keV line flux are consistent with the level measured in 2015. No significant variation has been detected in both spectral shape and Fe equivalent width , which may be interpreted as the intensity of the Arches non-thermal emission reaching its stationary level. At the same time, the measured 2016 non-thermal flux is not formally in disagreement with the declining trend observed in 2007-2015. Thus, we cannot assess whether the non-thermal emission has reached a stationary level in 2016, and new observations, separated by a longer time period, are needed to draw stringent conclusions. Detailed spectral analysis of three bright clumps of the Arches molecular cloud performed for the first time showed different and absorption. This is a strong hint that the X-ray emission from the molecular cloud is a mix of two components with different origins.
keywords:
ISM: clouds, X-rays: individual (Arches cluster)1 Introduction
The Arches cluster (Cotera et al., 1996; Serabyn et al., 1998) is a massive star cluster, which is located in the Galactic Center (GC) region at the projected angular distance of pc from Sgr A⋆. The cluster contains more than 160 O-type stars with initial masses larger than 20 and its average mass density is (Figer et al., 1999; Figer et al., 2002). The Arches core is about ( pc at 8 kpc) in radius (Figer et al., 1999).
The first X-ray observation of the region around the Arches cluster with Chandra (Yusef-Zadeh et al., 2002) revealed its bright X-ray emission. This emission, characterized by the 6.7 keV Fe line, was detected in the narrow region consistent with the Arches cluster position (hereafter “the core”). The thermal emission of the cluster was attributed to the multiple collisions between strong winds of massive stars (Yusef-Zadeh et al., 2002; Wang et al., 2006; Capelli et al., 2011a). In addition to the cluster’s core emission, the extended emission of a different origin, spatially consistent with a nearby molecular cloud, was detected around the cluster (hereafter “the cloud”). The observed prominent Fe line and the power-law continuum emission point out to its non-thermal nature. (Wang et al., 2006; Tsujimoto et al., 2007; Capelli et al., 2011b; Tatischeff et al., 2012; Krivonos et al., 2014, 2017; Clavel et al., 2014).
Two main hypotheses have been developed to explain the non-thermal emission from the Arches “cloud” emission. The first approach implies irradiation of the molecular cloud by an external X-ray source. The possible X-ray sources inside or nearby the cloud have been excluded, based on the required X-ray luminosity (Capelli et al., 2011b) to explain the 6.4 keV line flux (Tatischeff et al., 2012; Krivonos et al., 2014). The sufficient luminosity could be provided by a nearby X-ray source, e.g. 1E1740.7–2942 (Churazov et al., 1993) or with the past activity of Sgr A⋆, as originally suggested by Sunyaev et al. (1993) to explain the fluorescent line emission observed in the giant molecular cloud Sgr B2 in the GC region (see also Koyama et al., 1996; Sunyaev & Churazov, 1998; Murakami et al., 2000; Revnivtsev et al., 2004; Terrier et al., 2010; Zhang et al., 2015). The hypothesis of the past Sgr A⋆’s flaring activity is also supported by the discovery of a propagation of Fe K echos in the Central Molecular Zone (CMZ), where Sgr A⋆ is presumably the source of the illumination on the clouds (Ponti et al., 2010, 2013; Clavel et al., 2013; Ryu et al., 2013; Churazov et al., 2017a, b; Terrier et al., 2018).
Alternatively, a fluorescent emission of the molecular cloud can be a result of bombardment by low-energy cosmic ray (CR) particles (Capelli et al., 2011b; Tatischeff et al., 2012). The steady non-thermal continuum and Fe K flux observed in the Arches cloud for a decade was initially considered as a strong evidence for the CR heating of the Arches molecular cloud (Tatischeff et al., 2012). However, a recently discovered time variability of the non-thermal power-law continuum and 6.4 keV line (Clavel et al., 2014), strongly contradicts the CR scenario (see e.g. Dogiel et al., 2014) for a significant fraction of this emission.
Using the 2015 XMMNuSTAR data set, Krivonos et al. (2017) showed that the Arches cloud experienced a strong emission decrease, along with a significant decrease of the Fe equivalent width (EW). This could indicate either a change in the reflection geometry (illumination of different structures along the line of sight) or that the putative CR component has become more dominant. In any case, the question remains whether the non-thermal continuum and the 6.4 keV line emission will decrease to a zero flux level when the X-ray illuminating front leaves the molecular cloud or if some background CR heating takes place.
As discussed above, the variable component of the Arches complex non-thermal emission is generated by Thomson scattering of X-ray flare photons leaving the Arches cloud complex. Chernyshov et al. (2018) suggested that the other (possibly stationary) component can be caused by either i) Thompson scattering of photons from the same or a different X-ray flare, ii) another molecular cloud complex which is situated at large distance from the Arches cluster and on the same line of sight, or iii) the excitation of CR particles, however more restrictions must be satisfied. The authors argue that in case of a single cloud complex (i) the variations are likely associated with iron abundance changes in it during the flare moving across the cloud. For the second case with two different clouds (ii), Chernyshov et al. (2018) calculated the temporal delay of the Compton echo for the first variable component at about 100 yrs. This is in agreement with Churazov et al. (2017a) who estimated X-ray flare event with 110 yrs age. For the second variable component the estimated time delay is about 230 yrs (Chernyshov et al., 2018). It is more likely that these two components were caused by the different flares rather than the same flare. The suggestion of two different flares are consistent with scenario of two flares of Sgr A⋆ 110 and 240 yrs ago (Clavel et al., 2013; Terrier et al., 2018; Chuard et al., 2018).
Changes in the morphology of the Arches cluster cloud are similar to those seen for Sgr B2, where the non-thermal emission likely reaching the background level as well, revealing a substructure of two compact cores and a newly emerging cloud that confirms the propagation of the illuminating front(s) from an X-ray flare (Zhang et al., 2015). These similarities between the Arches cloud emission and GC molecular clouds (Krivonos et al., 2017) support the reflection mechanism of the non-thermal emission.
In this work we analyzed observations of the Arches cluster region with NuSTAR in 2015-2016 and XMM–Newton in 2015, with the aim to monitor the non-thermal emission around the cluster. Additionally, we carried out detailed spectral analysis of the emission clumps detected with XMM–Newton observations in 2015. The paper is structured as follows: in Sect. 2 we describe observations of the Arches cluster with NuSTAR in 2016 and outline the data analysis; 2016 NuSTAR data analysis morphology and spectral analyses are presented in Sect. 3; Sect. 4 contains the analysis of the combined NuSTAR and XMM–Newton 2015-2016 observations. We investigate the substructure of the Arches cloud non-thermal emission revealed by the 6.4 keV line emission clumps observed with XMM–Newton (Sect. 5). We discuss and summarize the obtained results in Sect. 6.
2 Observation and data analysis
The Arches cluster region was observed in October 2016 during the NuSTAR Legacy survey111https://www.nustar.caltech.edu/page/legacy_surveys of the Sgr A molecular clouds with a total exposure time of 150 ks. The list of the used NuSTAR observations is shown in Table 1.
| Experiment | ObsID | Start Date | Exposure, s |
|---|---|---|---|
| XMM | 0762250301 | 2015-09-27 15:48:39 | 114000 |
| NuSTAR | 40101001002 | 2015-10-19 06:21:08 | 107189 |
| 40101001004 | 2015-10-25 13:56:08 | 107856 | |
| 40202001002 | 2016-10-28 13:16:08 | 150856 |
The hard X-ray orbital telescope NuSTAR (Harrison et al., 2013), launched in 2012, provides imaging at energies above 10 keV with sub-arcminute angular resolution. NuSTAR carries two identical co-aligned X-ray telescope modules (referred as FPMA and FPMB) with a full width at half maximum (FWHM) of . The energy response covers a wide range from 3 to 79 keV with a spectral resolution of 400 eV (FWHM) at 10 keV.
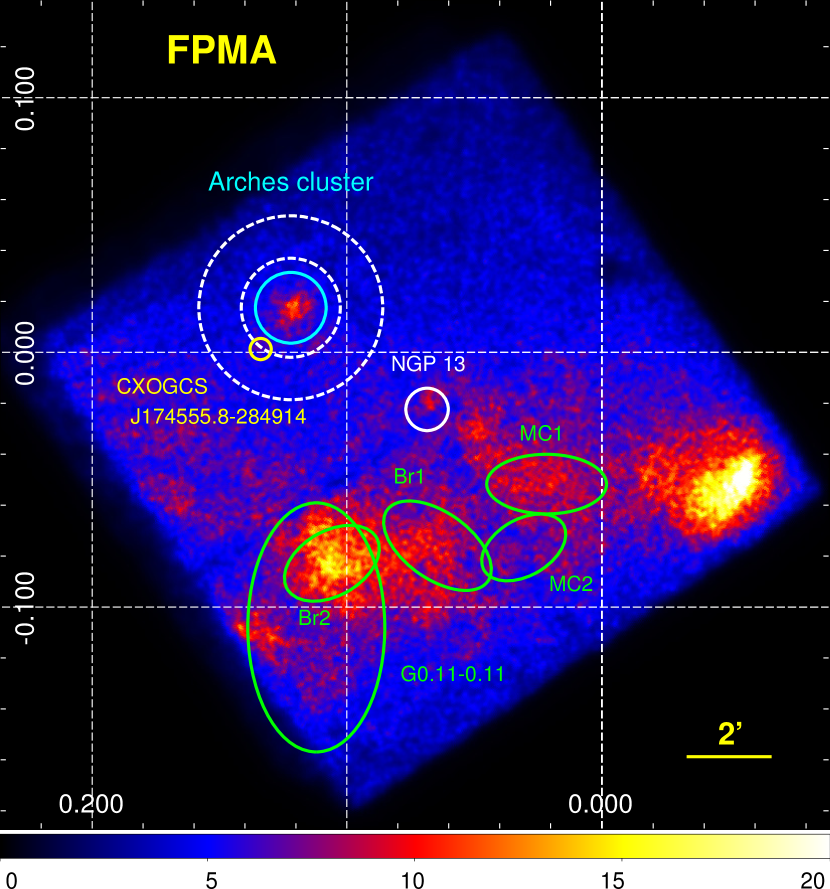
Due to NuSTAR’s known ‘stray-light’ issue, when detectors can be illuminated by X-rays passing outside the field of view the X-ray optics (Madsen et al., 2017), the data from FPMB are strongly contaminated by photons from the bright X-ray source GX 31, which forced us to exclude FPMB data in this work. Fig. 1 shows the FPMA image of the Arches cluster region in the full keV energy band. Arches was observed at distance from the optical axis, which led to a somewhat efficiency decrease, however without a visible distortion of the point spread function (PSF).
It is worth noting that celestial coordinates of each photon registered by NuSTAR are subject to a systematic offset, which can be as high as (Mori et al., 2015). We noticed an offset between the cluster’s centroid position and its catalogued coordinates at the level of . Similar to Krivonos et al. (2017), we performed an astrometric correction by shifting coordinates of each photon using a reference position of the Arches core centroid, measured in the first NuSTAR observation of the Arches cluster in 2012 (Krivonos et al., 2014), when the offset was negligible.
We extracted spectrum of the Arches cluster complex, and corresponding response matrices, using the nuproducts task, a part of NuSTAR Data Analysis Software package (nustardas v.1.8.0), built in heasoft software (version 6.22). Note that in this paper we often compare our results with those of Krivonos et al. (2017) who used older heasoft version 6.17. We checked that different versions do not introduce strong deviations to the results. The source extraction region was a circle with a radius of positioned at the cluster position , (Krivonos et al., 2014, 2017). The background spectrum was obtained from the annulus region within the radii range (see Fig. 1), excluding circular region of the source CXOGCS J174555.8–284914 (Law & Yusef-Zadeh, 2004), as described in Sect. 4.1. The interactive spectral and 2D image analysis were done using xspec (Arnaud, 1996) and sherpa (Freeman et al., 2001) tools included, respectively, in heasoft 6.22 and ciao-v.4.9 (Fruscione et al., 2006) software packages.
3 NuSTAR observations of the Arches cluster in 2016
3.1 2D image analysis
Since the Arches cluster demonstrated a strong drop of its non-thermal emission in 2007-2015 (Clavel et al., 2014; Krivonos et al., 2017), one would expect a further fall even below the detection threshold. The main question we address in this section is whether the Arches stellar cluster is still surrounded by the spatially extended emission, previously detected with NuSTAR in 2012-2015 (Krivonos et al., 2014, 2017). The NuSTAR angular resolution of (FWHM) does not allow us to directly resolved the emission around the cluster’s core. Therefore we use a simple 2D image analysis with the sherpa package to estimate a spatial extension of the cluster emission compared to that expected from the NuSTAR PSF. sherpa performs spatial fitting of a data image using a 2D source model convolved with supplied instrumental PSF.
We first analyzed the 2016 NuSTAR keV image of the Arches cluster region using 2D Gaussian model G1 with a fixed FWHM (PSF smearing effect) and free center position, representing a point-like X-ray source. The model is represented in the sherpa notation as psf(gauss2d.G1)*emap+const2d.bkg*emap, where G1 is 2D Gaussian, associated with the emission of the stellar cluster, emap contains exposure map, and const2d.bkg component estimates the background count rate, in the assumption of a flat distribution. As shown in Fig. 1, the fitting area was limited by a circle with around the cluster’s centroid position and the background count rate was estimated in the annulus with the same center position, excluding the circle region with of X-ray source CXOGCS J174555.8–284914 (Sect. 4.1). The difference between the keV image and the best-fit model is characterized by strong deviations indicating that the X-ray emission of the Arches cluster is not consistent with a point-like X-ray source (Wang et al., 2006; Law & Yusef-Zadeh, 2004). To quantitatively estimate the spatial scale of the extended emission of the Arches cluster we added a second 2D Gaussian model G2 with a free position and FWHM parameter. The list of free parameters of this new complex model includes the position of G1, the position and width of G2, and the flat background level. The extended model provides a good fit to the data, characterized by no strong deviations in the residuals, and fit statistics . The fitting procedure estimates a spatial scale of the extended emission G2 as being FWHM, which is significantly larger than the NuSTAR PSF (18′′ FWHM). This result indicates that the spatially extended emission of the Arches cluster is still present in 2016. The position of the G2 extended component is shifted off by from the position of the Arches stellar core (G1), which also indicates that the extended emission is not associated with the stellar cluster.
3.2 Spectral analysis
As shown in the previous subsection, the extended emission, associated with the non-thermal radiation of the neutral or low ionization state material of the molecular cloud is still present around the stellar cluster. For quantitative evaluation, we perform a spectral analysis comparing the recent 2016 NuSTAR observations with previous results from by Krivonos et al. (2017) based on the NuSTAR and XMM–Newton data acquired in 2015.
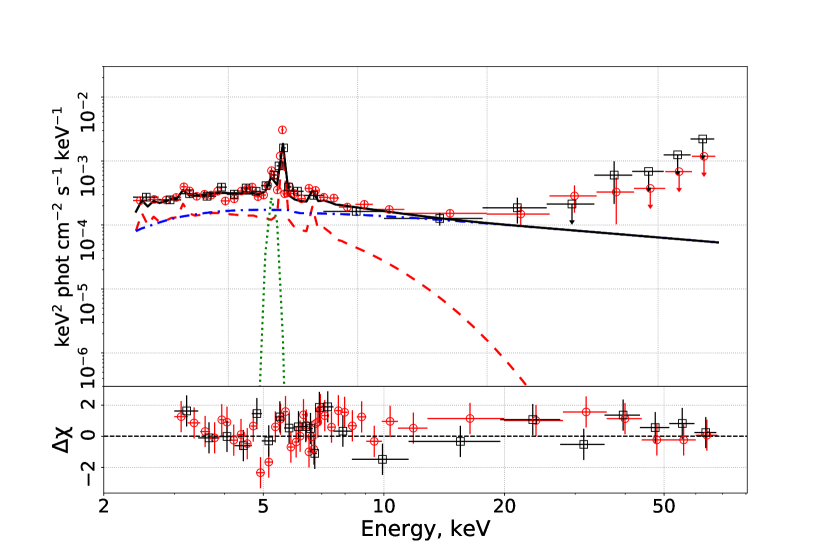
We reduced the 2016 NuSTAR observation of the Arches cluster and extracted source and background spectra from circular and annulus regions, respectively, as described in Section 2. The background-subtracted FPMA spectrum of the Arches cluster region is shown in Fig. 2. To fit the spectrum, we applied the same spectral model used in Krivonos et al. (2017), which contains the thermal emission of the stellar cluster described by the collisionally ionized plasma emission model (APEC) and the non-thermal emission of the molecular cloud in the form of power-law and Gaussian 6.4 keV line. The thermal emission is characterized by , Z/Z⊙, and parameters describing, respectively, the temperature in keV, the metallicity relative to the solar one, and the normalization in units of , where and are the electron and proton number densities in units of , and D is the cluster distance in cm. The metallicity was fixed at according to Tatischeff et al. (2012). The non-thermal emission is approximated by a power-law continuum and Fe 6.4 keV line, represented by a Gaussian with the width fixed at 0.1 keV. All the emission spectral components are subject to interstellar photo-electric absorption modeled with wabs in xspec. Due to limited energy response of the NuSTAR below 5 keV, the fitting procedure does not allow us to constrain the absorption, and we fixed it at cm-2 (Tatischeff et al., 2012). The equivalent width (EW) of the 6.4 keV line was estimated with the sherpa package with respect to the powerlaw component only. The fitting procedure demonstrated a strong correlation between components, causing a degeneracy of model parameters: plasma temperature and power-law photon index . To overcome this, for the following analysis we fixed the APEC temperature at keV, as measured by Krivonos et al. (2017) in 2015 NuSTAR observations. Best-fitting model parameters are listed in Table 2. For comparison with 2015 NuSTAR observations we included to the table the best-fitting parameters of the same model adopted from Krivonos et al. (2017).
The spectral analysis of the NuSTAR observations of the Arches cluster complex in 2015 and 2016 does not demonstrate strong variations of both thermal emission of the cluster and non-thermal emission of the surrounding molecular cloud. The main parameters of the non-thermal emission, power-law slope and normalization, and of the iron 6.4 keV line, are consistent within uncertainties between the observations. We conclude that further observations of the Arches cluster region are needed to confirm or deny the stationary level of the Arches cloud non-thermal emission.
| Parameter | Unit | 2015 yr | 2016 yr | |
| cm-2 | (fixed) | (fixed) | (fixed) | |
| keV | (fixed) | (fixed) | ||
| see Sect. 3.2 | ||||
| keV | 0.1 (fixed) | 0.1 (fixed) | 0.1 (fixed) | |
| keV | ||||
| ph cm-2 s-1 | ||||
| eV | ||||
| 10-13 erg cm-2 s-1 | ||||
| /d.o.f. | 0.97/364 | 0.82/204 | 0.91/574 |
4 The combined 2015-2016 data set
4.1 2D image analysis
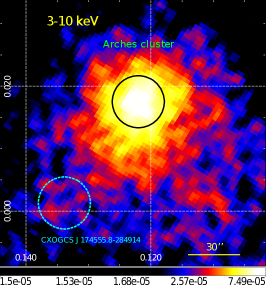
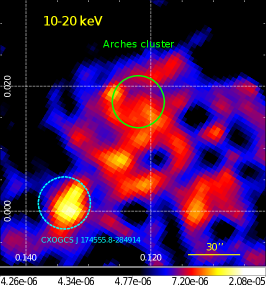
Assuming that the morphology of the Arches extended emission has not significantly changed since 2015 (which is confirmed by spectral analysis, see previous section), we combined the NuSTAR observations from 2015 and 2016 into one data set, producing mosaic images in three energy bands: keV, keV and keV, shown in Fig. 3. The full keV band mosaic image reveals both the emission of the stellar cluster and the extended emission. The surface brightness distribution of the Arches in the keV band is dominated by the stellar cluster. Finally, the hard keV band highlights the distribution of the non-thermal emission around the Arches cluster.

| Parameter | keV | keV | keV |
|---|---|---|---|
| Core (2D Gaussian, G1) | |||
| Center RA (J2000) | 17:45:50.52 | 17:45:50.54 | |
| Center Dec (J2000) | -28:49:22.39 | -28:49:22.35 | |
| FWHM | (fixed) | (fixed) | |
| Norm. () | 3.7 | 3.6 | |
| Cloud (2D Gaussian, G2) | |||
| Center RA (J2000) | 17:45:51.47 | 17:45:51.35 | 17:45:52.05 |
| Center Dec (J2000) | -28:49:30.76 | -28:49:29.71 | -28:49:31.72 |
| FWHM | |||
| Norm. () | 63.8 | 67.0 | 6.1 |
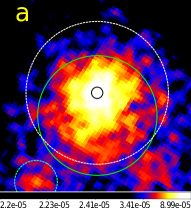
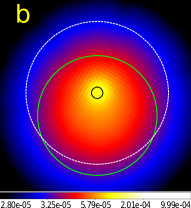
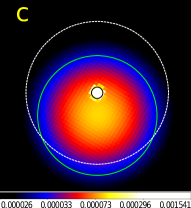
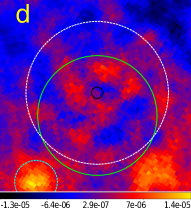
We then repeated the 2D image analysis on the combined NuSTAR mosaic images, in order to better determine properties of the extended emission. The best-fit model and residuals of the fit for keV energy band image are shown in Fig 4. The residual image shows small scale fluctuations with amplitude an order of magnitude less than the input keV NuSTAR mosaic image. The positions of the residual fluctuations are spatially consistent with the 6.4 keV Arches cloud clumps described in Sect. 5. Note that we excluded the G1 Gaussian model from the fitting procedure in the keV band due to negligible contribution of the thermal emission from the stellar cluster at energies above 10 keV. The best-fitting model parameters are shown in Table 3. In all three bands the spatial size of the G2 component is larger than the NuSTAR PSF, which confirms the presence of the extended emission around the cluster above 10 keV. We checked that the centroid position of the extended G2 component in the keV and keV bands are consistent with each other within confidence interval, which points out to the same extended component detected in the soft and the hard energy bands, respectively.
Note the G2 component is more extended in the keV band compared to the keV (see Table 3). This is mainly caused by lower statistics of the Arches non-thermal emission above 10 keV and nearby image fluctuations probably associated with the systematic noise. To estimate the level of the systematics we analyzed the source-free region of the keV image and found that the relative non-statistical fluctuations can be as high as .
Fig. 3 also reveals an X-ray excess located to the east of the cluster, clearly seen in the full keV and hard keV band images. Its centroid position , is consistent within uncertainty with the position of the X-ray source CXOGCS J174555.8–284914 (Yusef-Zadeh et al., 2002; Law & Yusef-Zadeh, 2004), as identified with the SIMBAD astronomical database (Wenger et al., 2000). The source, also labeled as A4 in Yusef-Zadeh et al. (2002), is highly absorbed () and has a hard power-law like spectrum with a peak near the 6.4 keV Fe line (Law & Yusef-Zadeh, 2004). To avoid a possible contribution from this source to the background count rate assessment, we excluded circular region around it from the spatial and spectral analysis.
4.2 Spectral analysis
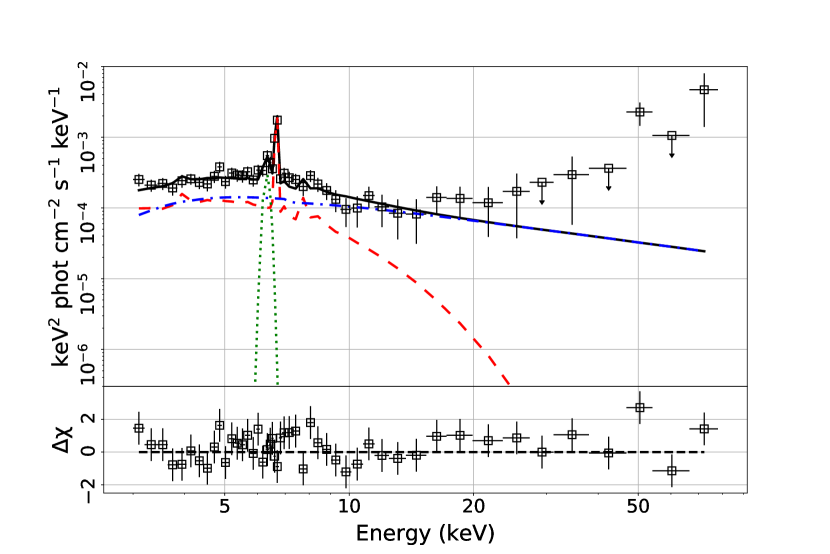
To better estimate the model parameters, we simultaneously fitted the 2015 and 2016 data sets for the following spectral analysis. The last column of Table 2 shows the results of the fitting procedure with the same model used in Sect. 3.2, and Fig. 5 demonstrates the combined spectral fit. The best-fitting model parameters of the data sets are in general agreement with individual NuSTAR observations in 2015 and 2016.
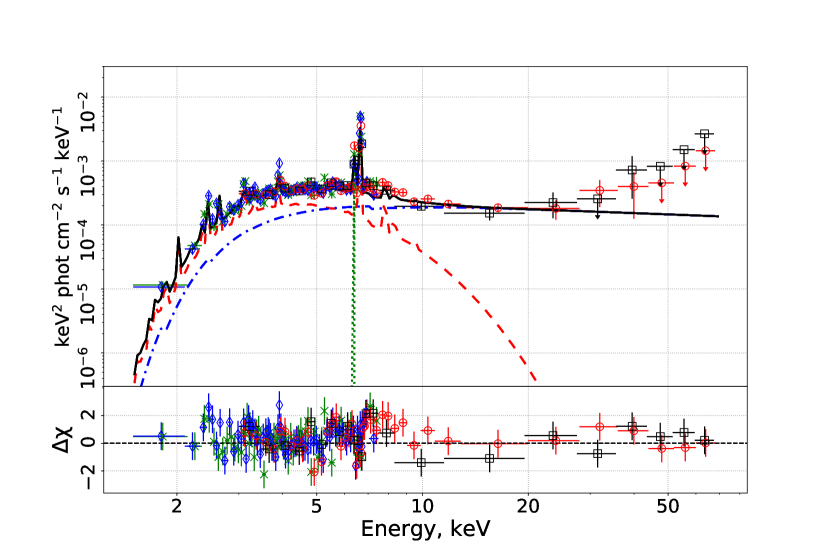
To extend a spectral coverage to the low energies, and to determine the total line-of-sight absorption column density , we added spectrum based on XMM–Newton observation carried out on 27th September 2015 (Table 1), extracted from the same circular region (Krivonos et al., 2017). The combined 2015 XMM–Newton and 2015-2016 NuSTAR broad-band spectrum of the Arches cluster region is shown in Fig. 6. The best-fitting model parameters with the free absorption parameter are listed in Table 4. The value was determined as cm-2, which is consistent with cm-2 measured by Tatischeff et al. (2012). The joint fit gives a solid measurement of the power-law up to keV, which is in agreement within uncertainty with measured by Krivonos et al. (2017).
To describe the Arches non-thermal continuum in the combined 2015 XMM–Newton and NuSTAR spectrum, additionally to a simple power-law model, Krivonos et al. (2017) also applied CR-induced emission model developed by Tatischeff et al. (2012) and self-consistent X-ray reflection model REFLIONX (Ross & Fabian, 2005). We checked that adding 2016 NuSTAR data set to the joint 2015 XMM–Newton and NuSTAR fit allows to better constrain the parameters of these models, however, the improvements are still not enough to significantly confirm or rule out either of them. For simplicity we do not list the best-fitting results of physically motivated spectral models in this paper.
| Parameter | Unit | 2015 | 20152016 |
|---|---|---|---|
| cm-2 | |||
| keV | |||
| see Sect. 3.2 | |||
| keV | 0.01 (fixed) | 0.01 (fixed) | |
| keV | |||
| ph cm-2 s-1 | |||
| eV | |||
| 10-5 cm-2 s-1 keV-1 | |||
| C | |||
| /d.o.f. | 1.00/918 | 0.97/1167 |
5 6.4 keV clumps of the Arches cloud
The broad-band NuSTAR spectral analysis of the Arches non-thermal X-ray emission has been previously performed in a wide circular region covering the stellar cluster itself and surrounding molecular cloud (see Sections 3 and 4, Krivonos et al., 2014, 2017, and). Other studies, mainly based on XMM–Newton observations, used an elliptical region excluding the stellar cluster (see ellipse parameters in Tatischeff et al., 2012; Clavel et al., 2014; Krivonos et al., 2017). Thus, the spectral extraction region often included the whole Arches non-thermal emission, which was characterized by regular and extended shape, traced by iron 6.4 keV line flux (Tatischeff et al., 2012). Note that integrating the signal over large region may average emission having different trend andor different origin (see e.g. Clavel et al., 2013). The smaller ellipse which was used in the previous XMM–Newton analysis may still be too large to understand the complexity of the current variation. To investigate this we carried out new analysis of the clumps revealed in the 6.4 keV line using the 2015 XMM–Newton data.
| Region | RA (J2000) | Dec. (J2000) | Parameters | Area, arcsec2 |
| Clump S | 17:45:52.92 | -28:50:21.30 | 26′′, 44′′, 130∘ | 3556 |
| Clump N | 17:45:49.24 | -28:48:54.65 | 20′′, 33′′, 169∘ | 14371 |
| Clump E | 17:45:52.82 | -28:49:25.35 | 13′′, 22′′, 162∘ | 906 |
| Excluded cluster | 17:45:50.47 | -28:49:15.70 | 16′′, 29′′, 177∘ | |
| 1) The surface area of clump N is computed with the cluster region excluded. |
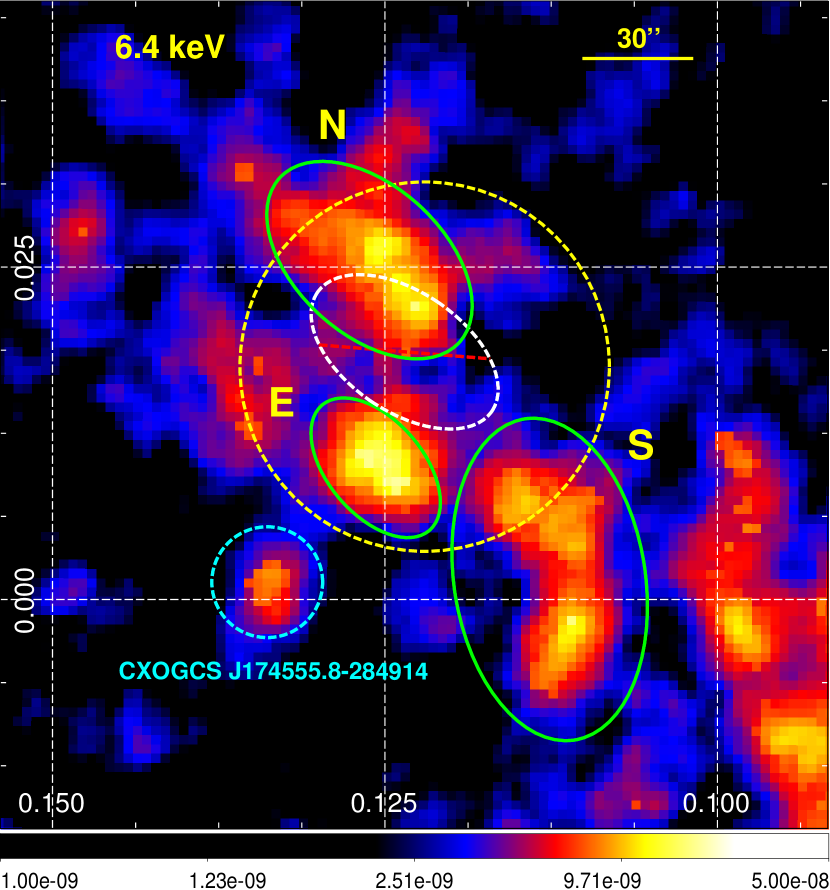
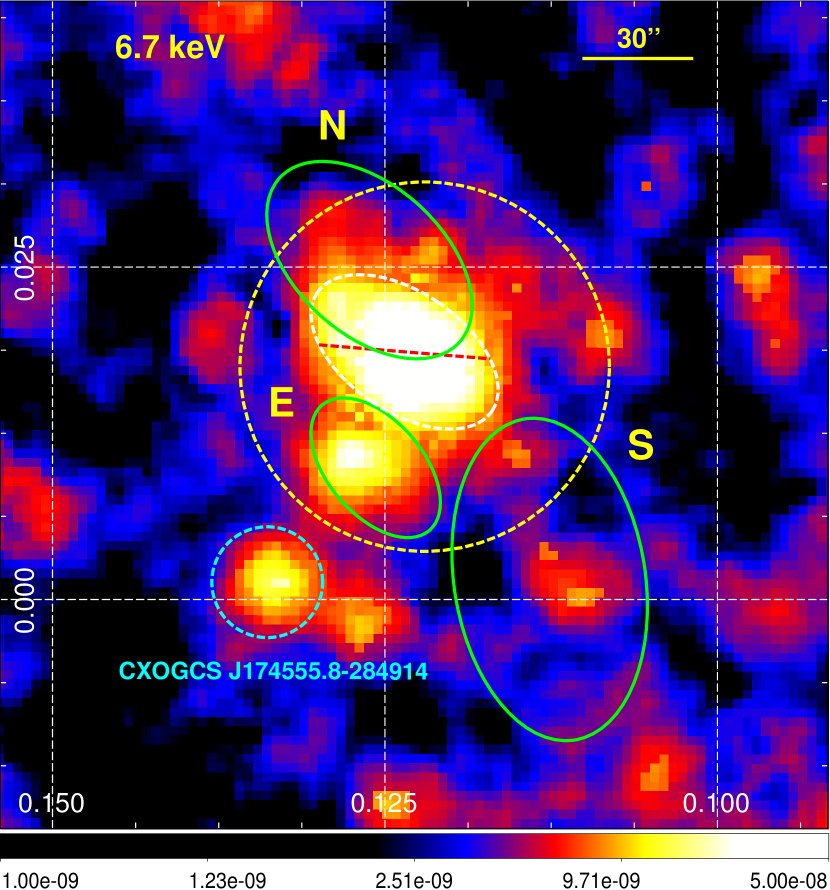
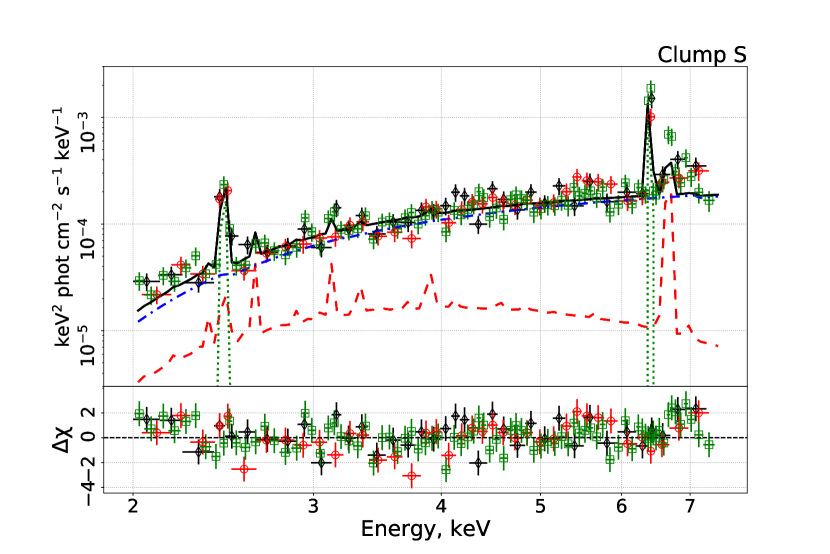
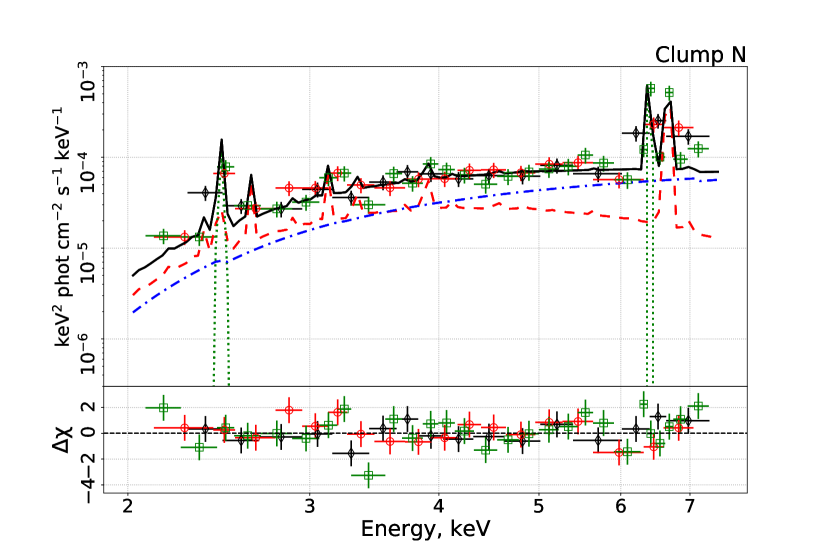
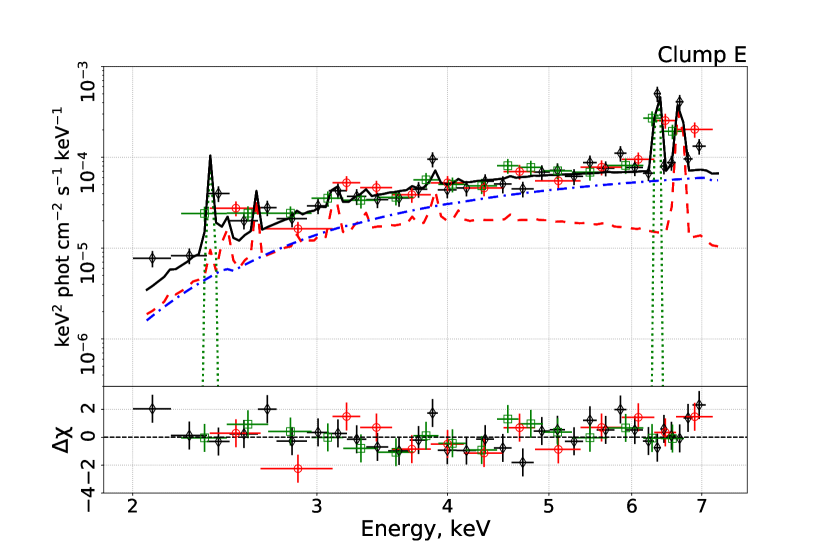
We followed the procedure described in Krivonos et al. (2017) for analyzing the XMM–Newton MOS1, MOS2 and PN data and extracted keV spectra of three clumps S, N and E (see Fig. 7) within elliptical regions, which parameters are listed in Table 5. The regions are shown in Fig. 7. Note that for the clump N region we excluded the elliptical region containing the bright 6.7 keV line emission from the Arches cluster core. The spectra of clumps are shown in Fig. 8. Each spectrum was approximated with the xspec model , consistent with previous XMM–Newton study of the Arches non-thermal emission by Clavel et al. (2014). The spectral model includes the APEC thermal emission of the astrophysical plasma with keV (chosen to mimic the combination of 1 and 7 keV plasma components in the Galactic center, Clavel et al., 2014), non-thermal power-law continuum with a fixed photon index and unabsorbed Fe 6.4 keV line with a fixed width of 0.01 keV. Following Krivonos et al. (2017) we also added an absorbed Gaussian line at 2.45 keV, presumably belonging to the line from He-like Sulfur (S). The strength of photo-electric absorption is freely fitted for each clump individually. The equivalent width of the Gaussian lines was calculated with respect to the power-law component without absorption. The results of the fitting procedure are shown in Table 6.
The spectral properties of N and E emission are similar, including , which indicates the same origin of the cloud emission. The clump S has the highest flux in the 6.4 keV line and continuum, however its value ( eV) is smaller than for N and E ( eV and , respectively). From the other side the clump S has the largest size compared to the others. To estimate the surface brightness we divided the observed keV flux of each clump by the corresponding source extraction area as listed in Table 6.
| Parameter1) | Unit | Clump S | Clump N | Clump E |
|---|---|---|---|---|
| cm-2 | 5.5 | 7.2 | 8.2 | |
| see Sect. 3.2 | 0.9 | 1.7 | 1.3 | |
| keV | 2.45 | 2.46 | 2.37 | |
| ph cm-2 s-1 | 5.3 | 4.3 | 4.9 | |
| eV | 260 | 710 | 1500 | |
| keV | 6.39 | 6.39 | 6.35 | |
| ph cm-2 s-1 | 2.6 | 1.4 | 1.2 | |
| eV | 570 | 980 | 830 | |
| ph keV-1 cm-2 s-1 | 9.1 | 2.9 | 3.0 | |
| erg cm-2 s-1 | 3.35 | 1.08 | 1.30 | |
| erg cm-2 s-1 arcsec-2 | 9.4 | 7.5 | 14.3 | |
| C | 1.02 | 0.72 | 1.1 | |
| 1.33151 | 1.1854 | 1.0753 |
1) S is the flux in the keV band divided on the clump region area. C denotes cross-normalization factor between MOS1MOS2 and PN data.
6 Discussion and summary
In this paper we present results of a long NuSTAR (150 ks) observation of the Arches complex in 2016. The complex includes a stellar cluster with a bright thermal ( keV) X-ray emission and a nearby molecular cloud, characterized by an extended non-thermal X-ray continuum and fluorescent Fe 6.4 keV line. Recent NuSTAR and XMM–Newton observations of the Arches non-thermal emission demonstrate a dramatic change both in morphology and intensity, and continuous observations are needed to shed light on the nature of the current low-level emission.
Despite the fast decrease observed in 2007-2015 (Krivonos et al., 2017), the NuSTAR observations in 2016 show that the non-thermal emission is still present around the Arches stellar cluster, as demonstrated by our spectral and spatial analysis. Furthermore, the keV flux of the emission in 2016 remains at the same level as measured in 2015 without a significant change in the spectral shape. However, one year interval may not be long enough to see a strong flux variation, which is followed from the fact that the measured 2016 non-thermal flux is not in contradiction with the declining trend observed in 2007-2015 (Krivonos et al., 2017). The overall drop of the from keV in 2002-2015 to keV in 2015 (Krivonos et al., 2017) has been confirmed at the same level in 2016. These results may indicate that the intensity of the Arches non-thermal emission reached its stationary level. At the same time, the declining trend predicts the 2016 flux at the level of erg cm-2 s-1, which is consistent within the errors with our measurement erg cm-2 s-1 in 2016 (Table 2). Thus, we cannot assess whether the non-thermal emission has reached a stationary level in 2016, and new observations, separated by a longer time period, are needed.
To better constrain the spectral properties of the Arches complex in this state, we constructed its broad-band spectrum using NuSTAR 2015-2016 and XMM–Newton 2015 observations, with the total exposure time of 350 ks and 114 ks, respectively. The joint fit gives a solid measurement of the power-law up to keV, which is, however softer than measured by Krivonos et al. (2017) in 2015 with the same XMM–Newton data set.
The rough 2D spatial analysis with NuSTAR shows that the morphology of the non-thermal emission in 2016 is still associated with molecular cloud and is not consistent with the possible emission of the stellar cluster.
Finally, we performed the spectral analysis of three bright Fe line emission clumps of the Arches molecular cloud (Krivonos et al., 2017), based on XMM–Newton observations in 2015. The analysis showed different values for clumps S ( eV) and N-E ( eV). The clump S also demonstrates a weaker interstellar absorption than two others. This finding confirms that the X-ray emission from the molecular cloud is a combination of two components with different origins. The different s of the iron line may also be produced by the different reflection geometry of the clumps. Chernyshov et al. (2018) favor the scenario of two Sgr A⋆ flaring events, consistent with different 6.4 keV line s found in this work. This is also in agreement with the studies of other molecular clouds in the CMZ, which imply two Sgr A⋆ flares (Clavel et al., 2013; Terrier et al., 2018; Chuard et al., 2018).
Further monitoring observations of the Arches complex are strongly needed to trace the on-going evolution of the clumps and to confirm the reached stationary level of the non-thermal emission of the whole Arches cloud region.
Acknowledgments
This work has made use of data from the NuSTAR mission, a project led by the California Institute of Technology, managed by the Jet Propulsion Laboratory and funded by NASA, and observations obtained with XMM–Newton, an ESA science mission with instruments and contributions directly funded by ESA Member States and NASA. The research has made use of the NuSTAR Data Analysis Software jointly developed by the ASI Science Data Center (ASDC, Italy) and the California Institute of Technology. EK and RK acknowledge support from the Russian Basic Research Foundation (grant 16-02-00294). GP acknowledges financial support from the Bundesministerium für Wirtschaft und Technologie/Deutsches Zentrum für Luft- und Raumfahrt (BMWI/DLR, FKZ 50 OR 1812, OR 1715 and OR 1604) and the Max Planck Society. DC is supported by the grant RFBR 18-02-00075.
References
- Arnaud (1996) Arnaud K. A., 1996, in Jacoby G. H., Barnes J., eds, Astronomical Society of the Pacific Conference Series Vol. 101, Astronomical Data Analysis Software and Systems V. p. 17
- Capelli et al. (2011a) Capelli R., Warwick R. S., Cappelluti N., Gillessen S., Predehl P., Porquet D., Czesla S., 2011a, A&A, 525, L2
- Capelli et al. (2011b) Capelli R., Warwick R. S., Porquet D., Gillessen S., Predehl P., 2011b, A&A, 530, A38
- Chernyshov et al. (2018) Chernyshov D. O., Ko C. M., Krivonos R. A., Dogiel V. A., Cheng K. S., 2018, ApJ, 863, 85
- Chuard et al. (2018) Chuard D., et al., 2018, A&A, 610, A34
- Churazov et al. (1993) Churazov E., et al., 1993, ApJ, 407, 752
- Churazov et al. (2017a) Churazov E., Khabibullin I., Sunyaev R., Ponti G., 2017a, MNRAS, 465, 45
- Churazov et al. (2017b) Churazov E., Khabibullin I., Sunyaev R., Ponti G., 2017b, MNRAS, 471, 3293
- Clavel et al. (2013) Clavel M., Terrier R., Goldwurm A., Morris M. R., Ponti G., Soldi S., Trap G., 2013, A&A, 558, A32
- Clavel et al. (2014) Clavel M., Soldi S., Terrier R., Tatischeff V., Maurin G., Ponti G., Goldwurm A., Decourchelle A., 2014, MNRAS, 443, L129
- Cotera et al. (1996) Cotera A. S., Erickson E. F., Colgan S. W. J., Simpson J. P., Allen D. A., Burton M. G., 1996, ApJ, 461, 750
- Dogiel et al. (2014) Dogiel V. A., Chernyshov D. O., Kiselev A. M., Cheng K.-S., 2014, Astroparticle Physics, 54, 33
- Figer et al. (1999) Figer D. F., Kim S. S., Morris M., Serabyn E., Rich R. M., McLean I. S., 1999, ApJ, 525, 750
- Figer et al. (2002) Figer D. F., et al., 2002, ApJ, 581, 258
- Freeman et al. (2001) Freeman P., Doe S., Siemiginowska A., 2001, in Starck J.-L., Murtagh F. D., eds, Proc. SPIEVol. 4477, Astronomical Data Analysis. pp 76–87 (arXiv:astro-ph/0108426), doi:10.1117/12.447161
- Fruscione et al. (2006) Fruscione A., et al., 2006, in Society of Photo-Optical Instrumentation Engineers (SPIE) Conference Series. p. 62701V, doi:10.1117/12.671760
- Harrison et al. (2013) Harrison F. A., et al., 2013, ApJ, 770, 103
- Hong et al. (2016) Hong J., et al., 2016, ApJ, 825, 132
- Koyama et al. (1996) Koyama K., Maeda Y., Sonobe T., Takeshima T., Tanaka Y., Yamauchi S., 1996, PASJ, 48, 249
- Krivonos et al. (2014) Krivonos R. A., et al., 2014, ApJ, 781, 107
- Krivonos et al. (2017) Krivonos R., et al., 2017, MNRAS, 468, 2822
- Law & Yusef-Zadeh (2004) Law C., Yusef-Zadeh F., 2004, The Astrophysical Journal, 611, 858
- Madsen et al. (2017) Madsen K. K., Christensen F. E., Craig W. W., Forster K. W., Grefenstette B. W., Harrison F. A., Miyasaka H., Rana V., 2017, Journal of Astronomical Telescopes, Instruments, and Systems, 3, 3
- Mori et al. (2015) Mori K., et al., 2015, ApJ, 814, 94
- Murakami et al. (2000) Murakami H., Koyama K., Sakano M., Tsujimoto M., Maeda Y., 2000, ApJ, 534, 283
- Ponti et al. (2010) Ponti G., Terrier R., Goldwurm A., Belanger G., Trap G., 2010, ApJ, 714, 732
- Ponti et al. (2013) Ponti G., Morris M. R., Terrier R., Goldwurm A., 2013, in Torres D. F., Reimer O., eds, Astrophysics and Space Science Proceedings Vol. 34, Cosmic Rays in Star-Forming Environments. p. 331 (arXiv:1210.3034), doi:10.1007/978-3-642-35410-6_26
- Revnivtsev et al. (2004) Revnivtsev M. G., et al., 2004, A&A, 425, L49
- Ross & Fabian (2005) Ross R. R., Fabian A. C., 2005, MNRAS, 358, 211
- Ryu et al. (2013) Ryu S. G., Nobukawa M., Nakashima S., Tsuru T. G., Koyama K., Uchiyama H., 2013, PASJ, 65, 33
- Serabyn et al. (1998) Serabyn E., Shupe D., Figer D. F., 1998, Nature, 394, 448
- Sunyaev & Churazov (1998) Sunyaev R., Churazov E., 1998, MNRAS, 297, 1279
- Sunyaev et al. (1993) Sunyaev R. A., Markevitch M., Pavlinsky M., 1993, ApJ, 407, 606
- Tatischeff et al. (2012) Tatischeff V., Decourchelle A., Maurin G., 2012, A&A, 546, A88
- Terrier et al. (2010) Terrier R., et al., 2010, ApJ, 719, 143
- Terrier et al. (2018) Terrier R., Clavel M., Soldi S., Goldwurm A., Ponti G., Morris M. R., Chuard D., 2018, A&A, 612, A102
- Tsujimoto et al. (2007) Tsujimoto M., Hyodo Y., Koyama K., 2007, PASJ, 59, 229
- Wang et al. (2006) Wang Q. D., Dong H., Lang C., 2006, MNRAS, 371, 38
- Wenger et al. (2000) Wenger M., et al., 2000, A&AS, 143, 9
- Yusef-Zadeh et al. (2002) Yusef-Zadeh F., Law C., Wardle M., Wang Q. D., Fruscione A., Lang C. C., Cotera A., 2002, ApJ, 570, 665
- Zhang et al. (2015) Zhang S., et al., 2015, ApJ, 815, 132