Pearl-Necklace-Like Local Ordering Drives Polypeptide Collapse
Abstract
Collapse of the polypeptide backbone is an integral part of protein folding. Using polyglycine as a probe, we explore the nonequilibrium pathways of protein collapse in water. We find that the collapse depends on the competition between hydration effects and intra-peptide interactions. Once intra-peptide van der Waal interactions dominate, the chain collapses along a nonequilibrium pathway characterized by formation of pearl-necklace-like local clusters as intermediates that eventually coagulate into a single globule. By describing this coarsening through the contact probability as a function of distance along the chain, we extract a time-dependent length scale that grows in linear fashion. The collapse dynamics is characterized by a dynamical critical exponent that is much smaller than the values of reported for non-biological polymers. This difference in the exponents is explained by the instantaneous formation of intra-chain hydrogen bonds and local ordering that may be correlated with the observed fast folding times in proteins.
Changing the solvent condition from good to poor renders an extended polymer to undergo a collapse transition by forming a compact globule Stockmayer (1960); Nishio et al. (1979). Both experiments Pollack et al. (2001); Sadqi et al. (2003) and simulations Camacho and Thirumalai (1993); Reddy and Thirumalai (2017) indicate that a protein also experiences such a collapse transition while folding into its native state. However, the nonequilibrium dynamics of the collapse of proteins is only poorly understood and an active research topic Asthagiri et al. (2017). Most previous studies consider only the hydrophobicity of apolar side chains of amino acids in a protein as driving force for collapse Kauzmann (1959); Dill (1990). In the present paper we focus instead on the contributions by intra-peptide interactions, present even for residues with no hydrophobic or only weakly hydrophobic side chains Bolen and Rose (2008); Tran et al. (2008); Holthauzen et al. (2010); Teufel et al. (2011) where the collapse-driving forces are not necessarily proportional to the exposed surface. Our test system is polyglycine, and has been chosen to connect our work with recent studies of homopolymer collapse dynamics Majumder and Janke (2015, 2016); Majumder et al. (2017); Christiansen et al. (2017) that found nonequilibrium scaling laws as known for generic coarsening phenomena Bray (2002). Our hope is to establish such scaling laws also for the collapse of proteins. As a first stride towards this goal, here, we explore the kinetics of collapse of polyglycine.
Collapse of homopolymers was first described by de Gennes’ seminal “sausage” model de Gennes (1985), but today the phenomenological “pearl-necklace” picture by Halperin and Goldbart Halperin and Goldbart (2000) is more commonly used, both for flexible Byrne et al. (1995); Abrams et al. (2002); Kikuchi et al. (2005); Reddy and Yethiraj (2006); Guo et al. (2011); Majumder and Janke (2015); Majumder et al. (2017); Christiansen et al. (2017) and semiflexible polymer models Montesi et al. (2004); Lappala and Terentjev (2013). In this picture the collapse begins with nucleation of small local clusters (of monomers) leading to formation of an interconnected chain of (pseudo-)stable clusters, i.e., the “pearl-necklace” intermediate. These clusters grow by eating up the un-clustered monomers from the chain and subsequently coalesce, leading eventually to a single cluster. Finally, monomers within this final cluster rearrange to form a compact globule.
Of central interest in this context is the scaling of the collapse time with the degree of polymerization (the number of monomers). While scaling of the form , where is the dynamic exponent, has been firmly established, there is no consensus on the value of . Molecular dynamics (MD) simulations provide much smaller values () than Monte Carlo (MC) simulations (). This difference is often explained with the presence of hydrodynamics in the MD simulations, but a value has been reported recently also for MC simulations Majumder et al. (2017). The “pearl-necklace” stage or the cluster-growth kinetics can be understood by monitoring the time () dependence of the mean cluster size , the relevant length scale. By drawing analogy with coarsening ferromagnets, it has been shown that scaling of the form with growth exponent holds for flexible homopolymers Majumder and Janke (2015); Majumder et al. (2017).
Protein collapse is much less understood. While it has been shown by modeling a protein as semiflexible heteropolymer that the equilibrium scaling of the radius of gyration with is random-coil-like in a good solvent and globule-like in a poor solvent Wilkins et al. (1999); Uversky (2002), there have been few attempts to explore nonequilibrium collapse pathways Cooke and Williams (2003); Pham et al. (2010), and the corresponding scaling laws are not known. In order to probe the existence of such nonequilibrium scaling laws in protein collapse, we have simulated polyglycine chains of various numbers of residues. This choice allows us to probe in a systematic way the collapse of polypeptide chain, considering only homopolymers built from the simplest amino acid, glycine. Our results show that in water there is a tug of war between collapse-disfavoring hydration effects and collapse-favoring intra-peptide interactions. For longer chains () the intra-peptide interactions win over the hydration effect leading to a collapse, making water in practice a poor solvent. We use these longer polyglycine chains to shed light on the collapse kinetics, with an emphasis on the presence of nonequilibrium scaling laws. Our results from all-atom MD simulations in the NVT ensemble using a hydrodynamics preserving thermostat (see the Method section for details), suggest a collapse mechanism that relies on fast local ordering by formation of pearl-necklace structures which eventually merge into a single globule. This process is characterized by a dynamic critical exponent much smaller than the exponents observed for non-biological polymers, and we speculate that this quicker local ordering and collapse enables the fast folding times seen in proteins.
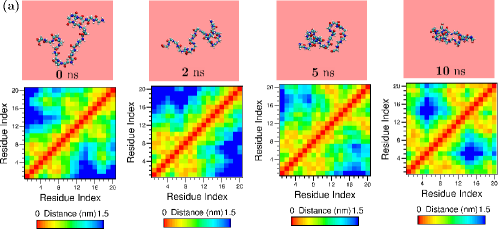
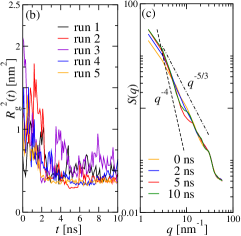
We begin our analysis with a rather short chain, i.e., . The time evolution snapshots during the collapse in water at a temperature , well below the corresponding collapse transition temperature, are shown in Fig. 1(a). In a protein, collapse leads eventually to folding characterized by formation of distinct native contacts among the residues. We show for this reason in the lower panel the residue contact maps where we define two residues as being in contact if they are within a distance of nm. The red stripe along the diagonals depicts the self-contacts. The size of the extended chain is nm, thus almost all the mutual distances between the residues fall under . This makes it difficult to capture segregation or formation of any local structures on length scales comparable to . Only late in the trajectories do we find a signature for loop formation, which is also apparent in the snapshot at ns. Emergence of such loop is due a competition between the hydration effects and the intra-peptide interactions leading to residue-residue contacts along the chain, although there are trapped water molecules. The interplay can be deduced from the non-monotonous behavior of the squared radius of gyration as function of time in Fig. 1(b), obtained from independent runs. Note that for all the cases decays eventually to the equilibrium value.
In order to probe further the structural evolution of the chain along the collapse of , we calculate the static structure factor at different times. Fig. 1(c) shows for the times corresponding to the snapshots. At ns, within the range , the chain can be described as an extended coil with Rubenstein and Colby (2003), where is the critical exponent describing the scaling of for a self-avoiding polymer. With time the decay exponent should increase from and is expected to approach , in order to be consistent with the globule-like behavior of Rubenstein and Colby (2003). Although the slope in our data in Fig. 1(c) gradually increases with time, it does not appear to approach . This again could be due to the still ongoing interplay between the hydration effect and the intra-peptide interactions which hinders the chain to form a compact globule, however, extending the simulations up to ns does not change the overall behavior. Similar observations are made for all systems having a chain length of residue units.
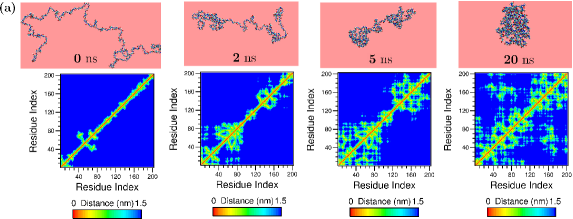
For longer chains, the collapse is more pronounced, and we finally encounter characteristic features reminiscent of the homopolymer collapse. For instance, in Fig. 2(a), we present snapshots of the collapse of at K. The sequence of these snapshots demonstrates a process that starts with local ordering of the residues along the chain. These local structures later merge with each other before finally forming a single globule at ns. The emergence of these local arrangements is similar to the formation of local clusters in the “pearl-necklace” picture of homopolymer collapse Halperin and Goldbart (2000); Byrne et al. (1995); Majumder and Janke (2015); Majumder et al. (2017). The resemblance becomes even more obvious when looking at the corresponding contact maps in the lower panel. The box-like clustering along the diagonal indicates formation of “pearls” along the chain (see particularly at and ns) that are reminiscent to the ones observed during the collapse of semiflexible homopolymer in Ref. Lappala and Terentjev (2013). However, we do not see the anti-parallel hairpins that were associated with this diamond-shaped internal orders within these boxes.
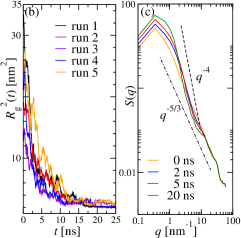
In order to check for the presence of a competition between hydration effects and the intra-peptide interactions we probe again the time dependence of as measured in five independent runs. Data are presented in Fig. 2(b). Unlike for the shorter chain, the radius of gyration is now monotonically decreasing. This can be explained by the assumption that for longer chains the intra-chain interactions overcome the hydration effects. A similar picture emerges from Fig. 2(c). The plots of the structure factor as function of time demonstrate how the extended coil behavior of at ns gradually changes to a globule-like behavior of at ns.
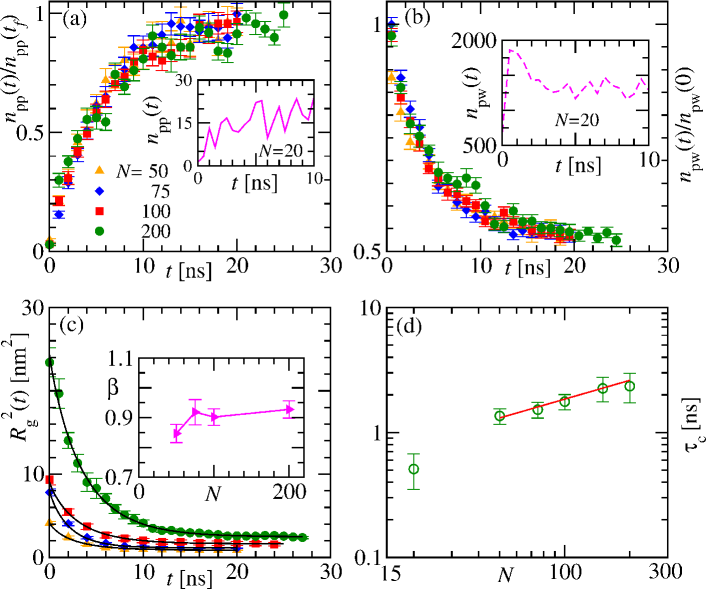
Next, we analyze the number of intra-molecular, i.e., protein-protein and inter-molecular, i.e., protein-water hydrogen (H)-bonds. These quantities, measured for different and normalized by the respective values at (the maximum time up to which the simulations are run; for details see the Method section) are plotted as function of time in the main frame of Fig. 3(a) and (b). Data for all in Fig. 3(a) attain the value at the same time, demonstrating a reasonable overlap of the normalized data. Similarly happens in (b) the decay of to the saturation value at almost the same time for different , leading again to nicely overlapping curves. In the inset of Fig. 3(a), the time dependence of for is non-monotonous whereas the data in the inset of Fig. 3(b) exhibit a jump at early time before reaching saturation. This again confirms the hydration effects for smaller chains. The overlap of the hydrogen-bond kinetics for large indicates that the collapse is not guided by the intra-peptide hydrogen bonds but depends mostly on the intra-peptide van der Waals interactions.
However, the overlap of the hydrogen-bond data does not allow one to calculate the collapse time from the time evolution of this quantity. More suitable for this purpose is the decay of the average squared radius of gyration depicted in Fig. 3(c). The non-overlapping data are consistent with the respective solid lines obtained from the previously proposed fit Majumder et al. (2017); Christiansen et al. (2017)
| (1) |
where corresponds to the value of in the collapsed state, and and are associated non-trivial fitting parameters. The obtained values of [see the inset of Fig. 3(c)] indicate a very weak dependence on , similar to the case of the earlier studied collapse of synthetic homopolymers Majumder et al. (2017). Although the above fit yields a collapse time , more accurate estimates can be calculated from the time when has decayed to of its total decay, i.e., . We plot the measured values of for different chain length (including ) in Fig. 3(d) to check for a scaling of the form . Due to the competition between hydration effects and intra-peptide interactions that dominate for smaller one expects distinct scaling forms for small and large . Our data indeed hint at the existence of two such scaling regions. Especially interesting is the consistency of our data for large with the solid line having . This exponent suggests that the dynamics is faster than the one observed in MC simulations of non-biological homopolymer Majumder et al. (2017). Surprisingly, it is even faster than in the case of homopolymer collapse in presence of hydrodynamics Abrams et al. (2002); Kikuchi et al. (2005). We conjecture that the more rapid collapse is due to the almost instantaneous presence of intra-chain hydrogen bonds that hasten local ordering. Simulations of longer chains would be desirable to confirm the value of and the super-fast collapse mechanism in hydrogen-bonded polymers, however, such simulations were computationally too costly to be considered in the present study.
In a final step we want to quantify the coarsening kinetics of the “pearl-necklace” observed in Fig. 2(a). A measure of the relevant length scale, i.e., the mean cluster or pearl size , can be obtained from a box-plot analysis of the contact maps Lappala and Terentjev (2013). Conjecturing that the collapse is driven by the intra-peptide van der Waals attraction of the backbone, we extract from an analysis of the contact probability as a function of the contour distance between any two C-atoms at the -th and -th position along the chain Scolari et al. (2018). Two C-atoms are said to have a contact if they are within a cut-off distance . Using nm, we show in Fig. 4(a) values of calculated at different times during the collapse of . These contact probabilities indicate indeed a growing length scale as their decay slows with time. At the beginning, for ns, the chain is in extended state and decays according to a power law with an exponent , as expected in a good solvent de Gennes (1980). As time progresses, this power-law behavior appears at larger after crossing over from a plateau-like behavior for small which marks the local ordering along the chain. For any reasonable choice of the form of the curves stays unchanged as demonstrated in Fig. 4(b). Similarly, the form of the curve also does not depend on the chain length as illustrated in the inset of Fig. 4(b) where we use nm and choose the point in time ns.
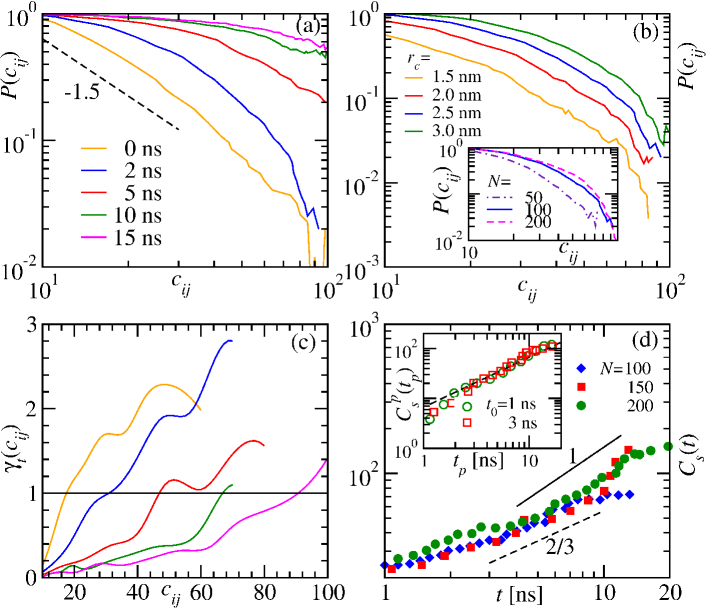
The crossover point in the decay as a function of is estimated from the discrete local slope as calculated by Scolari et al. (2018)
| (2) |
Plots of as a function of are shown Fig. 4(c) for the data presented in Fig. 4(a). The crossing of the data with the line happens at larger as increases, and thus this crossover point gives a measure of . The obtained for three different are shown as a function of on a double-log scale in the main frame of Fig. 4(d). The flattening of the data at very large is due to finite-size effects when no more ordering is possible due to formation of single globule. At large , before hitting size effects, the growth resembles a power law where the amplitude depends still on the chain length as the considered are not large enough. Hence, calculated using the same will overlap with each other, a fact that is demonstrated in the inset of Fig. 4(b). However, since their form stays invariant in the large regime, they apparently follow the same power law. Our data do not span over decades in time, hence, it is hard to distinguish between and behavior as shown by the dashed and the solid lines, respectively. In such cases it is advantageous to describe the growth instead as by considering a crossover time and cluster size . This ansatz, originally developed for ferromagnets Majumder and Das (2010), was already necessary in our earlier work for describing the collapse of synthetic homopolymers Majumder and Janke (2015); Majumder et al. (2017); Christiansen et al. (2017). Using the transformation one finds , with the shifted time . For , the above transformation is invariant under any choice of in the post-crossover regime. This is demonstrated in the inset of Fig. 4(d). The consistency of our data with the solid line representing a linear behavior further consolidates our finding of a linear cluster growth.
In summary, we have investigated the nonequilibrium pathways by which polyglycine collapses in water. For short chains, the pathway has few noticeable features and is driven by the competition between the hydration of the peptide, opposing the collapse, and the intra-peptide attractions, favoring the collapse Asthagiri et al. (2017). For long enough chains the importance of hydration effects decreases, and the kinetics of hydrogen bonds indicates that van der Waals interactions of the backbone dominate and drive the collapse. The nonequilibrium intermediates seen during the collapse exhibit local ordering or clustering that is analogous to the phenomenological “pearl-necklace” picture known to be valid for the earlier studied coarse-grained homopolymer models Halperin and Goldbart (2000). Using the contact probability of the C-atoms in the backbone, we extract a relevant dynamic length scale, i.e., cluster size, that as in simple homopolymer models grows linearly with time Majumder et al. (2017). We believe that this linear growth is a result of the Brownian motion of the clusters and subsequent coalescence as in the case of droplet growth in fluids Binder and Stauffer (1974).
Especially intriguing is that the scaling of the collapse time with length of the chain indicates a faster dynamics, with a critical exponent instead of , as seen in earlier homopolymer collapse studies Abrams et al. (2002); Kikuchi et al. (2005) that considered simplified models describing non-hydrogen-bonded polymers such as polyethylene and polystyrene Kremer and Grest (1990). The smaller exponent suggests that the fast folding times of proteins (typically in the s – ms range for proteins with residues) may be connected with a mechanism that allows in amino acid based polymers a more rapid collapse than seen in non-biological homopolymers, where collapse times of ms Xu et al. (2006) up to s Chu et al. (1995) for poly(N-isoporpylacrylamide) and polystyrene, respectively, have been reported. This would also have implications for possible folding mechanisms as the fast collapse times in our simulations are connected with a quick appearance of local ordering. In fact, we conjecture that the smaller exponent is characteristic for collapse transitions where the presence of intra-chain hydrogen bonding in amino acid based polymers immediately seeds (transient) local ordering, a step that in non-hydrogen-bonded polymers only happens as the consequence of diffusive motion. However, in order to test this conjecture, one would need to repeat first our above investigation for the other 19 amino acids. While such study is beyond the scope of our current paper, the presented results demonstrate already that our approach provides a general platform to understand various conformational transitions that occur in biomolecules via local ordering. Another example would be, for instance, the helix-coil transition of polyalanine where the short-time dynamics has already been explored Arashiro et al. (2006, 2007), or the study of two-time properties such as aging and dynamical scaling in collapse and folding Majumder and Janke (2016); Christiansen et al. (2017).
Methods
We construct molecules with hydrogenated N-terminus (–NH2) and C-terminus (–COOH). All-atom MD simulations are performed using standard GROMACS 5.0.2 tools while CHARMM22 with CMAP corrections MacKerell Jr. et al. (1998); Mackerell Jr. et al. (2004) is used for interactions between the atoms. For studying the collapse dynamics, we first prepare an extended chain in gas phase at K. This follows solvation of this extended chain in a simple cubic box with water (modeled by the TIP3P model Jorgensen et al. (1983)). The final MD run is performed at the desired quench temperature K which is lower than K, roughly the collapse transition temperature of in water. The size of the box and the number of water molecules, of course, are dependent on and are so chosen that the number density of water molecules is same for all . For the smallest , i.e., for the default box size was nm. Subsequently, the box sizes for longer chains were determined using the relation . The size of the boxes should not have much role in collapse provided the two ends of the chain do not interact while using the periodic boundary condition. However, the number density of water molecules is supposed to play a role which we kept the same for all . For the total number of water molecules used was giving a number density of per which was maintained for all . After the solvation we run our MD simulations using the Verlet-velocity integration scheme with time step fs, in the NVT ensemble using the Nosé-Hoover thermostat that conserves the linear momentum, and thus is believed to be sufficient for preserving hydrodynamic effects Frenkel and Smit (2002). Here, we use chains of length , and all the results presented are averaged over different initial configurations, except for where this number is . The simulations are run up to time which is ns for , ns for , and ns for .
For a polymer of length (number of monomers) the squared radius of gyration is calculated as . For the chain length was determined from , the number of residues or repeating units which contain a fixed set of atoms. Thus for was calculated considering all the atoms present in all the residues. However, the scaling can still be checked in terms , as is done here. The structure factor for a polymer of length is calculated using the relation , where is the distance vector between the -th and -th monomer along the chain. As explained above in the case for measuring , for too we use all the atoms in all the residues. We calculate the hydrogen bonds using the standard GROMACS tool gmx hbond. It considers all possible donars and acceptors and decides for the existence of a hydrogen bond if the distance between them is less than nm and the hydrogen-donar-acceptor angle is less than °.
Acknowledgements.
This project was funded by the Deutsche Forschungsgemeinschaft (DFG) under Grant Nos. SFB/TRR 102 (project B04) and JA 483/33-1 and the National Institutes of Health (NIH) under grants GM120578 and GM120634. It was further supported by the Deutsch-Französische Hochschule (DFH-UFA) through the Doctoral College “” under Grant No. CDFA-02-07 and the Leipzig Graduate School of Natural Sciences “BuildMoNa”. U.H. thanks the Institut für Theoretische Physik and especially the Janke group for kind hospitality during his sabbatical stay at Universität Leipzig.Contributions
All authors contributed to develop the project and S.M. performed the simulations. All authors discussed, analyzed the results and wrote the manuscript.
COMPETING FINANCIAL INTERESTS
The authors declare that they have no competing financial interests.
References
- Stockmayer (1960) W.H. Stockmayer, “Problems of the statistical thermodynamics of dilute polymer solutions,” Macromol. Chem. Phys. 35, 54 (1960).
- Nishio et al. (1979) I. Nishio, S.-T. Sun, G. Swislow, and T. Tanaka, “First observation of the coil–globule transition in a single polymer chain,” Nature 281, 208 (1979).
- Pollack et al. (2001) L. Pollack, M.W. Tate, A.C. Finnefrock, C. Kalidas, S. Trotter, N.C. Darnton, L. Lurio, R.H. Austin, C.A. Batt, S.M. Gruner, and S.G.J. Mochrie, “Time resolved collapse of a folding protein observed with small angle x-ray scattering,” Phys. Rev. Lett. 86, 4962 (2001).
- Sadqi et al. (2003) M. Sadqi, L.J. Lapidus, and V. Muñoz, “How fast is protein hydrophobic collapse?” Proc. Natl. Acad. Sci. U.S.A. 100, 12117 (2003).
- Camacho and Thirumalai (1993) C.J. Camacho and D. Thirumalai, “Kinetics and thermodynamics of folding in model proteins,” Proc. Natl. Acad. Sci. U.S.A. 90, 6369 (1993).
- Reddy and Thirumalai (2017) G. Reddy and D. Thirumalai, “Collapse precedes folding in denaturant-dependent assembly of ubiquitin,” J. Phys. Chem. B 121, 995 (2017).
- Asthagiri et al. (2017) D. Asthagiri, D. Karandur, D.S. Tomar, and B.M. Pettitt, “Intramolecular interactions overcome hydration to drive the collapse transition of gly15,” J. Phys. Chem. B 121, 8078 (2017).
- Kauzmann (1959) W. Kauzmann, “Some factors in the interpretation of protein denaturation1,” Adv. Protein Chem. 14, 1 (1959).
- Dill (1990) K.A. Dill, “Dominant forces in protein folding,” Biochemistry 29, 7133 (1990).
- Bolen and Rose (2008) D.W. Bolen and G.D. Rose, “Structure and energetics of the hydrogen-bonded backbone in protein folding,” Ann. Rev. Biochem. 77, 339 (2008).
- Tran et al. (2008) H.T. Tran, A. Mao, and R.V. Pappu, “Role of backbone-solvent interactions in determining conformational equilibria of intrinsically disordered proteins,” J. Am. Chem. Soc. 130, 7380–7392 (2008).
- Holthauzen et al. (2010) L.M.F. Holthauzen, J. Rösgen, and D.W. Bolen, “Hydrogen bonding progressively strengthens upon transfer of the protein urea-denatured state to water and protecting osmolytes,” Biochemistry 49, 1310 (2010).
- Teufel et al. (2011) D.P. Teufel, C.M. Johnson, J.K. Lum, and H. Neuweiler, “Backbone-driven collapse in unfolded protein chains,” J. Mol. Bio. 409, 250 (2011).
- Majumder and Janke (2015) S. Majumder and W. Janke, “Cluster coarsening during polymer collapse: Finite-size scaling analysis,” Europhys. Lett. 110, 58001 (2015).
- Majumder and Janke (2016) S. Majumder and W. Janke, “Evidence of aging and dynamic scaling in the collapse of a polymer,” Phys. Rev. E 93, 032506 (2016).
- Majumder et al. (2017) S. Majumder, J. Zierenberg, and W. Janke, “Kinetics of polymer collapse: Effect of temperature on cluster growth and aging,” Soft Matter 13, 1276 (2017).
- Christiansen et al. (2017) H. Christiansen, S. Majumder, and W. Janke, “Coarsening and aging of lattice polymers: Influence of bond fluctuations,” J. Chem. Phys. 147, 094902 (2017).
- Bray (2002) A.J. Bray, “Theory of phase-ordering kinetics,” Adv. Phys. 51, 481 (2002).
- de Gennes (1985) P.-G. de Gennes, “Kinetics of collapse for a flexible coil,” J. Phys. Lett. 46, 639 (1985).
- Halperin and Goldbart (2000) A. Halperin and P.M. Goldbart, “Early stages of homopolymer collapse,” Phys. Rev. E 61, 565 (2000).
- Byrne et al. (1995) A. Byrne, P. Kiernan, D. Green, and K.A. Dawson, “Kinetics of homopolymer collapse,” J. Chem. Phys. 102, 573 (1995).
- Abrams et al. (2002) C.F. Abrams, N.K. Lee, and S.P. Obukhov, “Collapse dynamics of a polymer chain: Theory and simulation,” Europhys. Lett. 59, 391 (2002).
- Kikuchi et al. (2005) N. Kikuchi, J.F. Ryder, C.M. Pooley, and J.M. Yeomans, “Kinetics of the polymer collapse transition: The role of hydrodynamics,” Phys. Rev. E 71, 061804 (2005).
- Reddy and Yethiraj (2006) G. Reddy and A. Yethiraj, “Implicit and explicit solvent models for the simulation of dilute polymer solutions,” Macromolecules 39, 8536 (2006).
- Guo et al. (2011) J. Guo, H. Liang, and Z.-G. Wang, “Coil-to-globule transition by dissipative particle dynamics simulation,” J. Chem. Phys. 134, 244904 (2011).
- Montesi et al. (2004) A. Montesi, M. Pasquali, and F.C. MacKintosh, “Collapse of a semiflexible polymer in poor solvent,” Phys. Rev. E 69, 021916 (2004).
- Lappala and Terentjev (2013) A. Lappala and E.M. Terentjev, “Raindrop coalescence of polymer chains during coil–globule transition,” Macromolecules 46, 1239 (2013).
- Wilkins et al. (1999) D.K. Wilkins, S.B. Grimshaw, V. Receveur, C.M. Dobson, J.A. Jones, and L.J. Smith, “Hydrodynamic radii of native and denatured proteins measured by pulse field gradient nmr techniques,” Biochemistry 38, 16424 (1999).
- Uversky (2002) V.N. Uversky, “Natively unfolded proteins: A point where biology waits for physics,” Protein Sci. 11, 739 (2002).
- Cooke and Williams (2003) I.R. Cooke and D.R.M. Williams, “Collapse dynamics of block copolymers in selective solvents: Micelle formation and the effect of chain sequence,” Macromolecules 36, 2149 (2003).
- Pham et al. (2010) T.T. Pham, B. Dünweg, and J.R. Prakash, “Collapse dynamics of copolymers in a poor solvent: influence of hydrodynamic interactions and chain sequence,” Macromolecules 43, 10084. (2010).
- Rubenstein and Colby (2003) M. Rubenstein and R.H. Colby, Polymer Physics (Chemistry) (Oxford University Press, Oxford, 2003).
- Scolari et al. (2018) V.F. Scolari, G. Mercy, R. Koszul, A. Lesne, and J. Mozziconacci, “Kinetic signature of cooperativity in the irreversible collapse of a polymer,” Phys. Rev. Lett. 121, 057801 (2018).
- de Gennes (1980) P.-G. de Gennes, Scaling Concepts in Polymer Physics (AIP, Melville, New York, 1980).
- Majumder and Das (2010) S. Majumder and S.K. Das, “Domain coarsening in two dimensions: Conserved dynamics and finite-size scaling,” Phys. Rev. E 81, 050102 (2010).
- Binder and Stauffer (1974) K. Binder and D. Stauffer, “Theory for the slowing down of the relaxation and spinodal decomposition of binary mixtures,” Phys. Rev. Lett. 33, 1006 (1974).
- Kremer and Grest (1990) K. Kremer and G.S. Grest, “Dynamics of entangled linear polymer melts: A molecular-dynamics simulation,” J. Chem. Phys. 92, 5057 (1990).
- Xu et al. (2006) J. Xu, Z. Zhu, S. Luo, C. Wu, and S. Liu, “First observation of two-stage collapsing kinetics of a single synthetic polymer chain,” Phys. Rev. Lett. 96, 027802 (2006).
- Chu et al. (1995) B. Chu, Q. Ying, and A.Yu. Grosberg, “Two-stage kinetics of single-chain collapse. Polystyrene in cyclohexane,” Macromolecules 28, 180 (1995).
- Arashiro et al. (2006) E. Arashiro, J.R. Drugowich de Felício, and U.H.E. Hansmann, “Short-time dynamics of the helix-coil transition in polypeptides,” Phys. Rev. E 73, 040902 (2006).
- Arashiro et al. (2007) E. Arashiro, J.R. Drugowich de Felício, and U.H.E. Hansmann, “Short-time dynamics of polypeptides,” J. Chem. Phys. 126, 045107 (2007).
- MacKerell Jr. et al. (1998) A.D. MacKerell Jr., D. Bashford, M.L.D.R. Bellott, R.L. Dunbrack Jr., J.D. Evanseck, M.J. Field, S. Fischer, J. Gao, H. Guo, S. Ha, et al., “All-atom empirical potential for molecular modeling and dynamics studies of proteins,” J. Phys. Chem. B 102, 3586 (1998).
- Mackerell Jr. et al. (2004) A.D. Mackerell Jr., M. Feig, and C.L. Brooks III, “Extending the treatment of backbone energetics in protein force fields: limitations of gas-phase quantum mechanics in reproducing protein conformational distributions in molecular dynamics simulations,” J. Comp. Chem. 25, 1400 (2004).
- Jorgensen et al. (1983) W.L. Jorgensen, J. Chandrasekhar, J.D. Madura, R.W. Impey, and M.L. Klein, “Comparison of simple potential functions for simulating liquid water,” J. Chem. Phys. 79, 926 (1983).
- Frenkel and Smit (2002) D. Frenkel and B. Smit, Understanding Molecular Simulations: From Algorithms to Applications (Academic Press, San Diego, 2002).