Detailed band structure of twinned and detwinned BaFe2As2 studied with angle-resolved photoemission spectroscopy
Abstract
We study the band structure of twinned and detwinned BaFe2As2 using angle-resolved photoemission spectroscopy (ARPES). The combination of measurements in the ordered and normal state along four high-symmetry momentum directions /Z–X/Y enables us to identify the complex reconstructed band structure in the ordered state in great detail. We clearly observe the nematic splitting of the and orbitals as well as folding due to magnetic order with a wave vector of . We are able to assign all observed bands. In particular we suggest an assignment of the electron bands different from previous reports. The high quality spectra allow us to achieve a comprehensive understanding of the band structure of BaFe2As2.
I Introduction
In most high-temperature iron-based superconductors (SC), the superconducting transition temperature reaches its maximum when the nematic and magnetic phases are suppressed. Paglione and Greene (2010) It was proposed that either nematic or magnetic quantum fluctuations may play a critical role for the high value of . Shibauchi et al. (2014) Therefore, it is important to understand the impact of these two ordering phenomena on the electronic structure. In this paper, we will focus on the prototypical parent compound BaFe2As2, but the results can be generalized to other 122 Fe-based SCs.
The nematic phase transition breaks the rotational symmetry between and directions below K Fernandes et al. (2014). It lowers the lattice symmetry from tetragonal to orthorhombic but is electronically driven Chu et al. (2012). It leads to a different occupation of previously degenerate Fe and orbitals, which implies an energy shift of the corresponding bands in opposite directions. The nematic order develops twin domains. Mechanical stress and magnetic field have been used to obtain single-domain samples Fisher et al. (2011). The spin-density wave (SDW) order with a wave vector of Huang et al. (2008) tracks the nematic one with in the BaFe2As2-family of compounds; they coincide by less than 0.3 K in BaFe2As2Kim et al. (2011a).
Many angle-resolved photoemission experiments have been performed to study the evolution of the electronic structure across these two transitions. However, it is challenging to disentangle their influence, since and are often very close. The effects of the nematic order were recently studied in detail in FeSe Tan et al. (2013); Shimojima et al. (2014); Nakayama et al. (2014); Watson et al. (2015); Zhang et al. (2015); Suzuki et al. (2015); Zhang et al. (2016); Fanfarillo et al. (2016); Watson et al. (2016); Fedorov et al. (2016); Watson et al. (2017), in which the magnetic order is absent. While the size of the nematic band splitting remains controversial Zhang et al. (2016); Fedorov et al. (2016), a non-trivial momentum dependence could be extracted Zhang et al. (2016); Suzuki et al. (2015).
In the magnetically ordered 122 systems the situation is less clear. The large number of bands in the ordered state in combination with a typically rather broad line-width poses a challenge to fully characterize the band structure in the ordered state. So far the following observations have been made on the 122 systems, in particular for BaFe2As2: Many studies show a clear folding pattern due to SDW ordering Hsieh et al. ; Yang et al. (2009); Yi et al. (2011); Kim et al. (2011b); Wang et al. (2013); Kondo et al. (2010); Liu et al. (2009); Fuglsang Jensen et al. (2011); Yi et al. (2009a); de Jong et al. (2010); Liu et al. (2010); Richard et al. (2010); Shimojima et al. (2010); Zabolotnyy et al. (2009). As a result one finds petal-like Fermi surfaces Yi et al. (2011); Kim et al. (2011b); Wang et al. (2013); Kondo et al. (2010); Yi et al. (2009a); de Jong et al. (2010); Liu et al. (2009, 2010); Richard et al. (2010); Shimojima et al. (2010); Zabolotnyy et al. (2009); Fuglsang Jensen et al. (2011) and tiny Fermi surface pockets susceptible to Lifshitz transitions Liu et al. (2010); Richard et al. (2010). Studies on de-twinned samples clearly observe a four-fold symmetry breaking attributed to the nematic order Yi et al. (2011); Kim et al. (2011b). Signs of band shifting and band splitting as expected for nematicity were observed Wang et al. (2013); Liu et al. (2009); Kondo et al. (2010); Fuglsang Jensen et al. (2011). For a specific momentum, a -dependent nematic splitting could be extracted.Yi et al. (2011). Simple calculations of the folded band structure are unsatisfactory to describe the experimental observations Kim et al. (2011b); Yi et al. (2009a). This is unsurprising as we expect a non-trivial nematic splitting of the same energy scale as the SDW order parameter and the spin-orbit coupling. So far, a comprehensive band assignment in the ordered state of BaFe2As2 is missing.
Here, we study the band structure of BaFe2As2 in both ordered and paramagnetic states on twinned and detwinned samples using angle-resolved photoemission spectroscopy (ARPES). The high quality of the data enables us to identify a large number of details of the folded band structure not clearly resolved before. Since the magnetic ordering vector has a finite out-of-plane component, we combine measurements along four high-symmetry cuts /Z–X/Y to determine the folding pattern. Starting from a clear characterization of the normal state, we are able to follow the band structure and perform a band assignment inside the ordered state.
II Methods
High quality single crystals of BaFe2As2 were grown using a self-flux method Chu et al. (2009); Wang et al. (2009); Rotundu et al. (2010). ARPES measurements were performed at Stanford Synchrotron Radiation Lightsource beamline 5-2 with an energy resolution of better than 12 meV and an angular resolution of 0.1∘. The base pressure stayed below Torr, and we compare results for K inside the ordered phase with 150 K data above the transition temperature. The samples were cleaved in-situ below 30 K. Linear horizontal (LH) and linear vertical (LV) polarizations are used to probe the different orbital characters Zhang et al. (2011); Brouet et al. (2012); Yi et al. (2011). The corresponding matrix elements are strongly momentum dependent Yi et al. (2011) and we indicate the expected dominant contributions of the , , and orbitals for selected high-symmetry points in each spectrum.
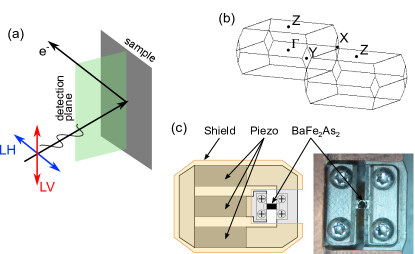
Figures 1(a) and (b) sketch the measurement geometry and the notation in the orthorhombic Brillouin zone (BZ) of BaFe2As2. All data were obtained using a photon energy of 47 eV, which probes close to the -plane in the first BZ and close to Z in the second BZ Brouet et al. (2009). The high symmetry points X and Y are degenerate in the tetragonal phase. In the orthorhombic phase at low temperatures we studied both twinned and detwinned crystals. For twinned crystals, the typical beam spot size is on the order of 50 , much larger than the domain size Chu et al. (2010). Hence the ARPES signals integrate over both domains. To obtain the intrinsic single domain electronic structure, we detwin the single crystals using a device based on piezoelectric stacks as sketched in Fig. 1(c), which is similar to Ref. Hicks et al., 2014. The device is temperature compensated due to the arrangement of the piezoelectric stacks. The sample is detwinned by a compressive uniaxial pressure applied by the inner stack set to 200 V. We verified that a metallic shield prevents the electric field from altering the ARPES measurements. The orthorhombic distortion of unstrained samples is % far inside the ordered phase Avci et al. (2012). The additionally applied strain to detwin BaFe2As2 is %, which we measured by a strain gauge. Since it is much smaller than the orthorhombic distortion, it has a negligible effect on the nematic band splitting far below .
We studied four different momentum directions –X, –Y, Z–X and Z–Y. To probe orthogonal directions in the detwinned samples, we rotate the sample with an in-plane rotation stage. The measurements in the plane were performed in normal emission corresponding to a light incident angle of 50∘ with respect to the sample normal. To reach Z–X/Y we rotated the sample towards smaller incident angles.
III Normal state band structure
The band structure in the normal state of BaFe2As2 (or doped versions of it) was studied numerous times Mansart et al. (2011); Thirupathaiah et al. (2010); Zhang et al. (2011); Yi et al. (2009b); Fuglsang Jensen et al. (2011); Brouet et al. (2012) and many of the features we will discuss below are consistent with previous studies. Here, we aim to obtain a complete data set along the high-symmetry cuts as a basis set for our discussion of the data in the ordered state, which are taken with the same photon energy. However, there are also certain aspects that extend or differ from previous reports.
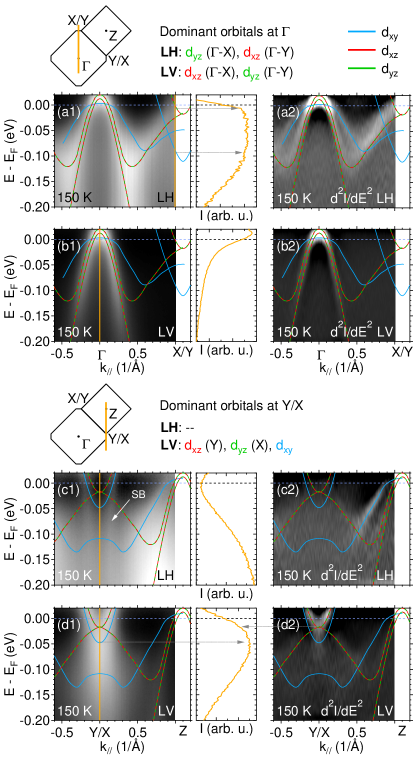
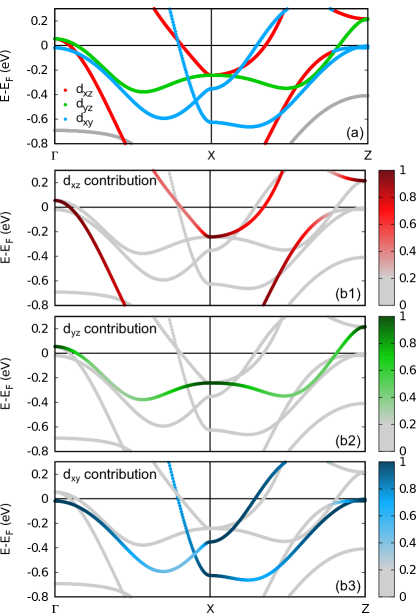
The ARPES results in the normal state at 150 K are presented along the –X/Y direction in Fig. 2(a,b) and the Z–Y/X direction in Fig. 2(c,d). We use LH and LV polarization to probe different orbitals and the second derivatives of the ARPES images to highlight band dispersions. We will use the band structure calculated from a tight binding model shown in Fig. 3 to assist with the band assignment of the observed dispersions and summarize the experimentally determined band structure in Fig. 4(a).
We identify the expected three hole pockets centered at [Fig. 2(a2,b2)] and at Z [Fig. 2(c2,d1,d2)] with , and orbital character. At X and Y we expect two electron pockets. They are more difficult to resolve and identify than the hole bands. We will discuss the assignment of the electron bands in detail in Sec. V, where we consider both the high- and low-temperature data especially on the detwinned sample. The combination of all data sets will support the following discussion of the normal state.
Along the Z–Y/X direction in Fig. 2(d) we find two electron bands: The energy distribution curve (EDC) at Y/X in Fig. 2(d1) shows a peak at meV. The second derivative in Fig. 2(d2) highlights the existence of a second electron band with a band bottom at meV at Y/X. The deeper electron pocket is predicted to be of character, the shallower one is predicted to be of character (see Fig. 3). Another deep electron band with a band bottom extending well beyond 200 meV is visible in Fig. 2(c1). We assign this electron band to a surface band as will be further discussed in Sec. V. Our assignment of the electron pockets along Z–Y/X differs from previous reports Brouet et al. (2012); Fuglsang Jensen et al. (2011); Zhang et al. (2011). The and electron bands in Fig. 2(d) could not be separated in previous studies and were together assigned to one band. The deep electron band in Fig. 2(c1) was assigned to the band Brouet et al. (2012); Fuglsang Jensen et al. (2011) or Zhang et al. (2011).
We are not able to clearly observe the electron pockets along –X/Y. For symmetry reasons, the band has the same binding energy at X/Y along –X/Y as along Z–X/Y (see Fig. 3). Therefore, we can assume a pocket of similar size, which we mark in Fig. 2(a,b). This assignment fits with the rise of intensity in the EDC of Fig. 2(a1) close to . The electron band is predicted to have a lower binding energy along –X/Y than along Z–Y/X (see Fig. 3). This difference is due to the band folding from the 1Fe to the 2Fe BZ that contains a component in the body-centered tetragonal crystal structure of BaFe2As2. We find a drop in the intensity at 100 meV in the EDC close to X/Y [Fig. 2(a1)] and assign this signature to the electron band. We will see later that this dispersion fits the corresponding folded electron band in the ordered state [Fig. 5(d2)].
The middle and outermost hole bands are expected to extend towards the zone corner and be degenerate with the electron bands at X/Y. This is consistent with the observations in Fig. 2(a2,c2,d2) and confirms the bottom of the electron band is at 20 meV. The hole band has a small matrix element close to X/Y [Fig. 2(a2)]. We therefore extend its dispersion such that it matches the electron band at 50 meV at X/Y as discussed above. This dispersion fits well the one observed in the ordered state (Fig. 5(c2)), where orbital splitting moves the band farther apart to uncover the band.
We can compare the experimentally determined band structure in the normal state shown in Fig. 4(a) with the calculated one from Fig. 3. The bands are renormalized by a factor of approximately 3. However, a simple renormalization cannot reproduce the experimentally determined band structure. Instead, an orbital- and momentum-dependent renormalization and shift of the bands need to be considered, as is universally found in Fe-based SC Yi et al. (2017); Lu et al. (2008); Charnukha et al. (2015); Lee et al. (2012); Brouet et al. (2013); Yin et al. (2011); Nishi et al. (2011); Richard et al. (2011); Yi et al. (2009b). Density functional theory (DFT) calculations generally underestimate correlation effects, which in part gives rise to the observed renormalization. It has been suggested that the moderate correlation effects in Fe- based SCs are driven by Hund’s rule coupling Haule and Kotliar (2009); de’ Medici et al. (2014). On top of the overall renormalization, it was found that there is an orbital selectivity of the renormalization with increasing overall correlation strength de’ Medici et al. (2014); Yi et al. (2017); Yin et al. (2011); Yu and Si (2013). It is attributed to a decoupling of charge excitations between different orbitals which originates from Hund’s rule coupling de’ Medici et al. (2014); Yin et al. (2011); Yu and Si (2013). The momentum-dependent shifts are less well understood. In principle, results from DFT calculations sensitively depend on the As height, which could lead to shifts. However, they cannot account for the trend observed in Fe-based SCs. It was proposed that the strong particle-hole asymmetry in pnictides generates such momentum-dependent shifts Ortenzi et al. (2009).
IV Band structure in the ordered state
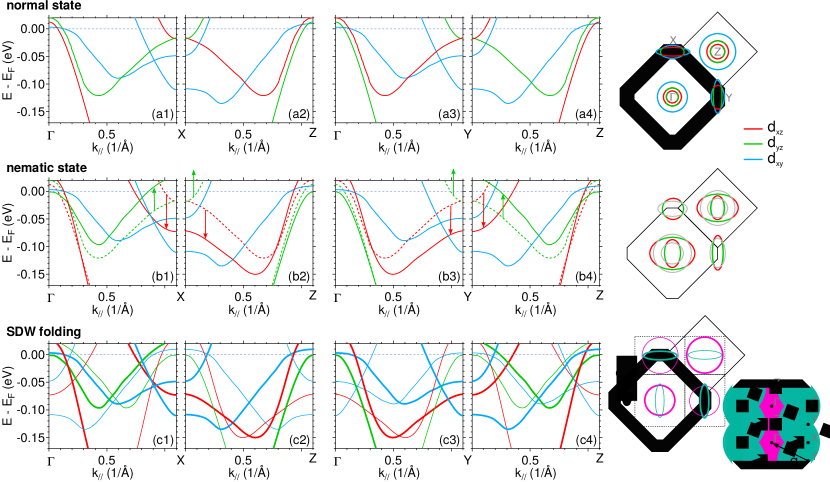
The band structure in the ordered state is modified by the nematic and SDW orders. The nematic order precedes the magnetic order by 250 mK Kim et al. (2011a). The temperature difference becomes larger and more evident e.g. in Co-doped BaFe2As2Rotundu and Birgeneau (2011). In the nematic phase, the degeneracy between the and direction will be lifted due to rotational symmetry breaking. Therefore, we expect a difference in the binding energies of and bands along –X and –Y as well as along Z–X and Z–Y. In FeSe, the nematic band splitting is strongly momentum dependent and changes sign between the zone center and the zone corner Zhang et al. (2016); Suzuki et al. (2015). We assume a similar momentum dependence here, which is confirmed by our recent studies on BaFe2As2 and will be detailed in a separate paper Pfau . We sketch the expected band shifts in Fig. 4(b). We did not include gaps due to spin-orbit coupling in this sketch.
The SDW order has a commensurate ordering wave vector expressed in the basis of the tetragonal 2Fe BZ shown in Fig. 1(b). It leads to a ferromagnetic ordering along the orthorhombic crystal axis and an antiferromagnetic ordering along the and axes () Huang et al. (2008). The resulting folding pattern of the bands is sketched in Fig. 4(c). The folding in the magnetic state leads to the opening of SDW gaps, which we did not include in the sketch for better illustration. These gaps alter the dispersions and overlap with the signatures of the nematic band splitting and spin-orbit coupling. It is therefore difficult to unambiguously determine the nematic band splitting in the SDW phase.
The sketches in Fig. 4(b,c) will serve as a guide for the band assignment in the ordered state. The results from the ARPES measurements will, in turn, feed back into these sketches and allow for the estimation of the nematic band splitting.
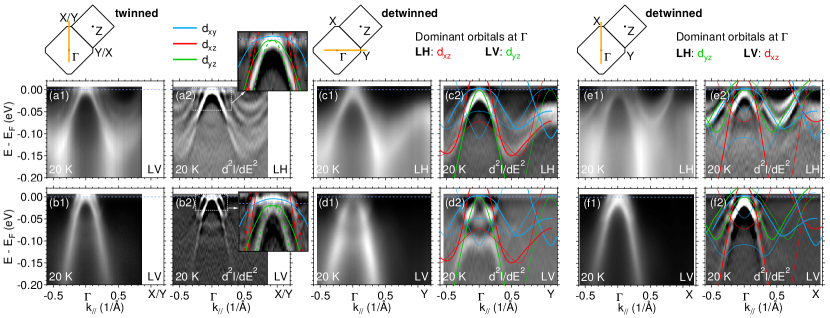
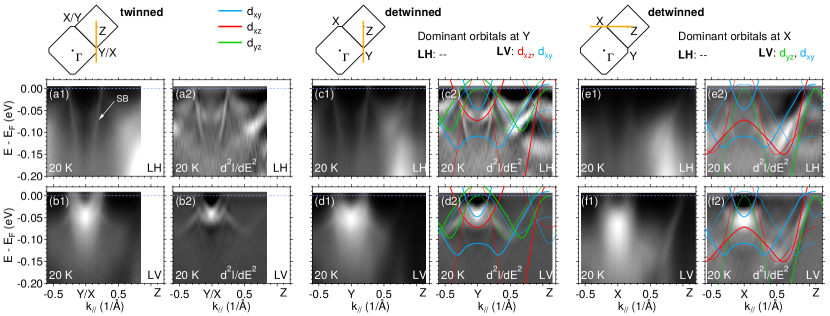
Figure 5 presents our ARPES results in the ordered state at 20 K along the –X and –Y directions for twinned and detwinned crystals. Figure 6 summarizes our results along the Z–X and the Z–Y direction. We use again LV and LH polarization to probe different orbital contributions. We overlay the data on the detwinned sample with the folded band structure shown in Fig. 4(c).
First, we will determine the nematic band splitting. From Fig. 6(d2) we can extract the shift of the electron band at Y. In this spectrum, we find three concentric electron bands. The shallow one (band bottom: 50 meV) has the same dispersion as the band at 150 K in the normal state [Fig. 2(d)]. The middle one (band bottom: 70 meV) is therefore assigned to the band that shifted down by 50 meV due to the nematic order. The largest one (band bottom: meV) has the same dispersion as in the normal state and originates from a surface state. We will discuss this assignment in detail in Sec. V. We do not find a signature of the electron band in our measurements for the corresponding cut in Fig. 6(e2,f2). Assuming the same amount of shift for and bands in opposite direction, we expect it to be above the Fermi level [Fig. 4(b2,b3)]. The overall nematic splitting will then amount to approximately meV at the zone corner for such a symmetric shift.
From Fig. 5(c2) we extract the nematic band shift of the middle hole band with character, which is now clearly separated from the hole band. We can follow its dispersion for momenta . The nematic band shift decreases away from Y. The influence of SDW gaps and spin-orbit coupling impedes the extraction of the exact band dispersion below . However, the very high quality of the spectrum in Fig. 5(a2,b2) on the twinned crystal in conjunction with the detwinned data in Fig. 5(c2)-(f2) helps us to identify the nematic shift of the hole bands around . We find the hole bands shifted just below the Fermi level. The hole bands are shifted to higher binding energies at and we can identify their Fermi level crossing in the insets of Fig. 5(a2,b2). Deviations from the observed dispersions can be explained by effects of spin-orbit coupling, which will hybridize the and bands.
The band positions of the hole and electron bands are used to obtain Fig. 4(b). We assume that the and bands move by the same amount in opposite directions. The resulting folded band structure from Fig 4(c) fits very well the observed spectra in Fig. 5 and 6. In Fig. 4(b,c), we omitted the opening of gaps due to spin-orbit coupling where and bands cross for better illustration. Gaps due to magnetic order are omitted for the same reason. It is particularly difficult to determine the size of the SDW gap as it is strongly orbital dependent Plonka et al. (2013); Yi et al. (2017). This leads to certain discrepancies between the sketched band structure and the ARPES spectra particularly along –X [Fig. 5(e2)] and along Z–Y [Fig. 6(c2)], where the and hole bands follow each other very closely. However, we can exactly reproduce their number and roughly their binding energies. For all other bands we find very good agreement including binding energies.
V Electron Bands
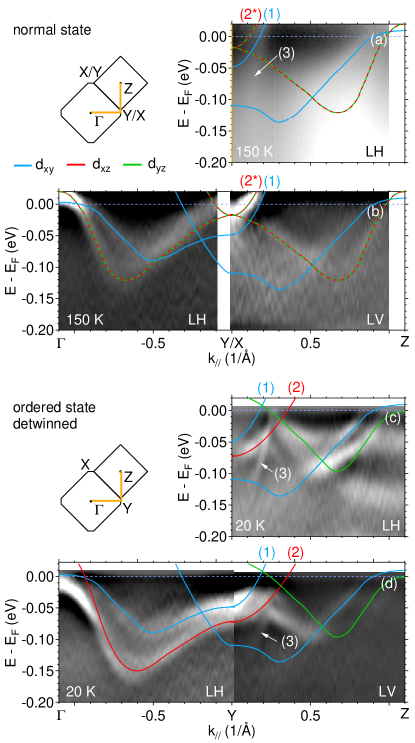
As we mentioned in Sec. III, our assignment of the electron bands differs from previous reports, specifically the bands marked (1, 2, 2*, 3) in Fig. 7Brouet et al. (2012); Fuglsang Jensen et al. (2011); Zhang et al. (2011). All of them have been observed previously Brouet et al. (2012); Yi et al. (2009a); Fuglsang Jensen et al. (2011); Zhang et al. (2011). Band (3) was interpreted either as Brouet et al. (2012); Fuglsang Jensen et al. (2011) or Zhang et al. (2011). Band (2) was assigned to the orbital Fuglsang Jensen et al. (2011). At low temperatures, the appearance of band (1) was interpreted as a surface effect Fuglsang Jensen et al. (2011), while at high temperatures, bands (1) and (2*) could not be separated and were together interpreted as . A detailed analysis of the electron bands in the ordered state on detwinned crystals was not reported previously. Its result indicates a band assignment as shown in Fig. 7 and a surface-related origin of band (3). The following arguments (i)-(vi) lead us to this assignment.
(i) In the spectra on detwinned crystals in Fig. 7(c,d), we observe three electron bands (1,2,3) at Y where we expect only two. One of these bands is therefore likely a surface band.
(ii) In principle, the binding energy of the and electron bands at Y is the same as the binding energy of the hole bands from the cut along –Y. The lower hole band in Fig. 7(d) has been identified as Yi et al. (2011). The upper hole band was observed before as well Yi et al. (2011); Kim et al. (2011b) but never specifically assigned. Around it has a dispersion similar to that of the band in the normal state. At low temperature, we can now follow it all the way to Y and assign it to the band. The comparison in Fig. 7(d) shows excellent alignment of these two hole bands with electron bands (1) and (2).
(iii) Since the hole band shows no detectable change across the nematic transition, we assume that band (1) also has the same dispersion at low and high temperatures. Its band bottom agrees with the maximum in the EDC of Fig. 2(d1). Band (2*), highlighted by the second derivative in Fig. 7(b), in turn must be the band. The remaining band (3) has to originate from a surface state.
(iv) Another indication is the narrower line width of band (3) compared to those of bands (1) and (2), which is expected for a surface band.
(v) Indeed, slab calculations predict a deep electron-like surface band at the zone corner van Heumen et al. (2011).
(vi) The orbital assignment agrees with the ARPES matrix elements for different light polarization considering effects due to folding from the 1Fe BZ to the 2Fe BZ Brouet et al. (2012); Lin et al. (2011) in addition to the momentum dependence of the matrix elements Yi et al. (2011). Specifically, the and electron bands both appear in LV polarization along Z–Y (Fig. 7(b,d)).
Previously, the binding energy of band (1) in the ordered state was found to be sensitive to temperature cycling and to be cleave dependent Fuglsang Jensen et al. (2011). It was therefore assigned to a surface band. The cleaving surface of BaFe2As2 consists of half the Ba layer and is very sensitive to temperature cycling both by surface contamination and possible reconstructions. Since ARPES is a surface sensitive probe, such changes can influence the measured spectra, very often in unpredictable ways. Our assignment is mainly based on the symmetry argument that the hole and electron bands need to match at Y.
The low-temperature data on detwinned crystals also help us to observe the electron band along –Y. It has been rather diffuse in the normal state, but can be clearly observed in Fig. 5(d2) as a folded band at .
VI Conclusion
In summary, we were able to find a complete band assignment for the band structure of BaFe2As2 in the normal and ordered states. The key to this assignment is the measurement of four momentum directions, –X, –Y, Z–X and Z–Y, for both twinned and detwinned crystals to obtain the band splitting in the nematic phase and the complete folding pattern of the magnetic phase.
We observed a momentum-dependent band splitting between the and bands due to nematic order. The largest splitting between the and bands of approximately 100 meV was found around the BZ corner. Our data are consistent with a sign change of the nematic splitting but the influence of SDW folding and spin-orbit coupling with subsequent gap openings make it challenging to precisely determine the momentum dependence. Beginning from the normal state dispersion and applying i) a nematic band splitting and ii) a SDW folding along the folding vector , we obtained a band structure that fits our observed spectra very well. Our discussion of the folded band structure does not include effects of spin-orbit coupling and of band gaps due to magnetic folding. These effects can explain the slight discrepancies between the band model and ARPES spectra in cases where binding energies of different bands are very close. We discuss in detail the electron bands near the BZ corner and demonstrate that the combination of measurements along different momentum directions is vital for their assignment.
Acknowledgements.
We thank B. Moritz for stimulating discussions. H.P. acknowledges support from the Alexander von Humboldt Foundation. J.C.P. is supported by a Gabilan Stanford Graduate Fellowship and a NSF Graduate Research Fellowship (Grant No. DGE-114747). This work was supported by the Department of Energy, Office of Basic Energy Sciences, under Contract No. DE-AC02-76SF00515. Use of the Stanford Synchrotron Radiation Lightsource, SLAC National Accelerator Laboratory, is supported by the U.S. Department of Energy, Office of Science, Office of Basic Energy Sciences under Contract No. DE-AC02-76SF00515.References
- Paglione and Greene (2010) J. Paglione and R. L. Greene, Nat. Phys. 6, 645 (2010).
- Shibauchi et al. (2014) T. Shibauchi, A. Carrington, and Y. Matsuda, Annu. Rev. Condens. Matter Phys. 5, 113 (2014).
- Fernandes et al. (2014) R. M. Fernandes, A. V. Chubukov, and J. Schmalian, Nat. Phys. 10, 97 (2014).
- Chu et al. (2012) J.-H. Chu, H.-H. Kuo, J. G. Analytis, and I. R. Fisher, Science 337, 710 (2012).
- Fisher et al. (2011) I. R. Fisher, L. Degiorgi, and Z. X. Shen, Rep. Prog. Phys. 74, 124506 (2011).
- Huang et al. (2008) Q. Huang, Y. Qiu, W. Bao, M. A. Green, J. W. Lynn, Y. C. Gasparovic, T. Wu, G. Wu, and X. H. Chen, Phys. Rev. Lett. 101, 257003 (2008).
- Kim et al. (2011a) M. G. Kim, R. M. Fernandes, A. Kreyssig, J. W. Kim, A. Thaler, S. L. Bud’ko, P. C. Canfield, R. J. McQueeney, J. Schmalian, and A. I. Goldman, Phys. Rev. B 83, 134522 (2011a).
- Tan et al. (2013) S. Tan, Y. Zhang, M. Xia, Z. Ye, F. Chen, X. Xie, R. Peng, D. Xu, Q. Fan, H. Xu, J. Jiang, T. Zhang, X. Lai, T. Xiang, J. Hu, B. Xie, and D. Feng, Nat. Mater. 12, 634 (2013).
- Shimojima et al. (2014) T. Shimojima, Y. Suzuki, T. Sonobe, A. Nakamura, M. Sakano, J. Omachi, K. Yoshioka, M. Kuwata-Gonokami, K. Ono, H. Kumigashira, A. E. Böhmer, F. Hardy, T. Wolf, C. Meingast, H. v. Löhneysen, H. Ikeda, and K. Ishizaka, Phys. Rev. B 90, 121111 (2014).
- Nakayama et al. (2014) K. Nakayama, Y. Miyata, G. N. Phan, T. Sato, Y. Tanabe, T. Urata, K. Tanigaki, and T. Takahashi, Phys. Rev. Lett. 113, 237001 (2014).
- Watson et al. (2015) M. D. Watson, T. K. Kim, A. A. Haghighirad, N. R. Davies, A. McCollam, A. Narayanan, S. F. Blake, Y. L. Chen, S. Ghannadzadeh, A. J. Schofield, M. Hoesch, C. Meingast, T. Wolf, and A. I. Coldea, Phys. Rev. B 91, 155106 (2015).
- Zhang et al. (2015) P. Zhang, T. Qian, P. Richard, X. P. Wang, H. Miao, B. Q. Lv, B. B. Fu, T. Wolf, C. Meingast, X. X. Wu, Z. Q. Wang, J. P. Hu, and H. Ding, Phys. Rev. B 91, 214503 (2015).
- Suzuki et al. (2015) Y. Suzuki, T. Shimojima, T. Sonobe, A. Nakamura, M. Sakano, H. Tsuji, J. Omachi, K. Yoshioka, M. Kuwata-Gonokami, T. Watashige, R. Kobayashi, S. Kasahara, T. Shibauchi, Y. Matsuda, Y. Yamakawa, H. Kontani, and K. Ishizaka, Phys. Rev. B 92, 205117 (2015).
- Zhang et al. (2016) Y. Zhang, M. Yi, Z.-K. Liu, W. Li, J. J. Lee, R. G. Moore, M. Hashimoto, M. Nakajima, H. Eisaki, S.-K. Mo, Z. Hussain, T. P. Devereaux, Z.-X. Shen, and D. H. Lu, Phys. Rev. B 94, 115153 (2016).
- Fanfarillo et al. (2016) L. Fanfarillo, J. Mansart, P. Toulemonde, H. Cercellier, P. Le Fèvre, F. Bertran, B. Valenzuela, L. Benfatto, and V. Brouet, Phys. Rev. B 94, 155138 (2016).
- Watson et al. (2016) M. D. Watson, T. K. Kim, L. C. Rhodes, M. Eschrig, M. Hoesch, A. A. Haghighirad, and A. I. Coldea, Phys. Rev. B 94, 201107 (2016).
- Fedorov et al. (2016) A. Fedorov, A. Yaresko, T. K. Kim, Y. Kushnirenko, E. Haubold, T. Wolf, M. Hoesch, A. Grüneis, B. Büchner, and S. V. Borisenko, Sci. Rep. 6, 36834 (2016).
- Watson et al. (2017) M. D. Watson, A. A. Haghighirad, L. C. Rhodes, M. Hoesch, and T. K. Kim, New J. Phys. 19, 103021 (2017).
- (19) D. Hsieh, Y. Xia, L. Wray, D. Qian, K. Gomes, A. Yazdani, G. F. Chen, J. L. Luo, N. L. Wang, and M. Z. Hasan, 0812.2289v1 .
- Yang et al. (2009) L. X. Yang, Y. Zhang, H. W. Ou, J. F. Zhao, D. W. Shen, B. Zhou, J. Wei, F. Chen, M. Xu, C. He, Y. Chen, Z. D. Wang, X. F. Wang, T. Wu, G. Wu, X. H. Chen, M. Arita, K. Shimada, M. Taniguchi, Z. Y. Lu, T. Xiang, and D. L. Feng, Phys. Rev. Lett. 102, 107002 (2009).
- Yi et al. (2011) M. Yi, D. Lu, J.-H. Chu, J. G. Analytis, A. P. Sorini, A. F. Kemper, B. Moritz, S.-K. Mo, R. G. Moore, M. Hashimoto, W.-S. Lee, Z. Hussain, T. P. Devereaux, I. R. Fisher, and Z.-X. Shen, Proc. Natl. Acad. Sci. U.S.A. 108, 6878 (2011).
- Kim et al. (2011b) Y. Kim, H. Oh, C. Kim, D. Song, W. Jung, B. Kim, H. J. Choi, C. Kim, B. Lee, S. Khim, H. Kim, K. Kim, J. Hong, and Y. Kwon, Phys. Rev. B 83, 064509 (2011b).
- Wang et al. (2013) Q. Wang, Z. Sun, E. Rotenberg, F. Ronning, E. D. Bauer, H. Lin, R. S. Markiewicz, M. Lindroos, B. Barbiellini, A. Bansil, and D. S. Dessau, Phys. Rev. B 88, 235125 (2013).
- Kondo et al. (2010) T. Kondo, R. M. Fernandes, R. Khasanov, C. Liu, A. D. Palczewski, N. Ni, M. Shi, A. Bostwick, E. Rotenberg, J. Schmalian, S. L. Bud’ko, P. C. Canfield, and A. Kaminski, Phys. Rev. B 81, 060507 (2010).
- Liu et al. (2009) G. Liu, H. Liu, L. Zhao, W. Zhang, X. Jia, J. Meng, X. Dong, J. Zhang, G. F. Chen, G. Wang, Y. Zhou, Y. Zhu, X. Wang, Z. Xu, C. Chen, and X. J. Zhou, Phys. Rev. B 80, 134519 (2009).
- Fuglsang Jensen et al. (2011) M. Fuglsang Jensen, V. Brouet, E. Papalazarou, A. Nicolaou, A. Taleb-Ibrahimi, P. Le Fèvre, F. Bertran, A. Forget, and D. Colson, Phys. Rev. B 84, 014509 (2011).
- Yi et al. (2009a) M. Yi, D. H. Lu, J. G. Analytis, J.-H. Chu, S.-K. Mo, R.-H. He, M. Hashimoto, R. G. Moore, I. I. Mazin, D. J. Singh, Z. Hussain, I. R. Fisher, and Z.-X. Shen, Phys. Rev. B 80, 174510 (2009a).
- de Jong et al. (2010) S. de Jong, E. van Heumen, S. Thirupathaiah, R. Huisman, F. Massee, J. B. Goedkoop, R. Ovsyannikov, J. Fink, H. A. Dürr, A. Gloskovskii, H. S. Jeevan, P. Gegenwart, A. Erb, L. Patthey, M. Shi, R. Follath, A. Varykhalov, and M. S. Golden, EPL (Europhysics Letters) 89, 27007 (2010).
- Liu et al. (2010) C. Liu, T. Kondo, R. M. Fernandes, A. D. Palczewski, E. D. Mun, N. Ni, A. N. Thaler, A. Bostwick, E. Rotenberg, J. Schmalian, S. L. Budko, P. C. Canfield, and A. Kaminski, Nat. Phys. 6, 419 (2010).
- Richard et al. (2010) P. Richard, K. Nakayama, T. Sato, M. Neupane, Y.-M. Xu, J. H. Bowen, G. F. Chen, J. L. Luo, N. L. Wang, X. Dai, Z. Fang, H. Ding, and T. Takahashi, Phys. Rev. Lett. 104, 137001 (2010).
- Shimojima et al. (2010) T. Shimojima, K. Ishizaka, Y. Ishida, N. Katayama, K. Ohgushi, T. Kiss, M. Okawa, T. Togashi, X.-Y. Wang, C.-T. Chen, S. Watanabe, R. Kadota, T. Oguchi, A. Chainani, and S. Shin, Phys. Rev. Lett. 104, 057002 (2010).
- Zabolotnyy et al. (2009) V. B. Zabolotnyy, D. S. Inosov, D. V. Evtushinsky, A. Koitzsch, A. A. Kordyuk, G. L. Sun, J. T. Park, D. Haug, V. Hinkov, A. V. Boris, C. T. Lin, M. Knupfer, A. N. Yaresko, B. Büchner, A. Varykhalov, R. Follath, and S. V. Borisenko, Nature 457, 569 (2009).
- Chu et al. (2009) J.-H. Chu, J. G. Analytis, C. Kucharczyk, and I. R. Fisher, Phys. Rev. B 79, 014506 (2009).
- Wang et al. (2009) X. F. Wang, T. Wu, G. Wu, H. Chen, Y. L. Xie, J. J. Ying, Y. J. Yan, R. H. Liu, and X. H. Chen, Phys. Rev. Lett. 102, 117005 (2009).
- Rotundu et al. (2010) C. R. Rotundu, B. Freelon, T. R. Forrest, S. D. Wilson, P. N. Valdivia, G. Pinuellas, A. Kim, J.-W. Kim, Z. Islam, E. Bourret-Courchesne, N. E. Phillips, and R. J. Birgeneau, Phys. Rev. B 82, 144525 (2010).
- Zhang et al. (2011) Y. Zhang, F. Chen, C. He, B. Zhou, B. P. Xie, C. Fang, W. F. Tsai, X. H. Chen, H. Hayashi, J. Jiang, H. Iwasawa, K. Shimada, H. Namatame, M. Taniguchi, J. P. Hu, and D. L. Feng, Phys. Rev. B 83, 054510 (2011).
- Brouet et al. (2012) V. Brouet, M. F. Jensen, P.-H. Lin, A. Taleb-Ibrahimi, P. Le Fèvre, F. Bertran, C.-H. Lin, W. Ku, A. Forget, and D. Colson, Phys. Rev. B 86, 075123 (2012).
- Brouet et al. (2009) V. Brouet, M. Marsi, B. Mansart, A. Nicolaou, A. Taleb-Ibrahimi, P. Le Fèvre, F. Bertran, F. Rullier-Albenque, A. Forget, and D. Colson, Phys. Rev. B 80, 165115 (2009).
- Chu et al. (2010) J.-H. Chu, J. G. Analytis, D. Press, K. De Greve, T. D. Ladd, Y. Yamamoto, and I. R. Fisher, Phys. Rev. B 81, 214502 (2010).
- Hicks et al. (2014) C. W. Hicks, M. E. Barber, S. D. Edkins, D. O. Brodsky, and A. P. Mackenzie, Rev. Sci. Instrum. 85, 065003 (2014).
- Avci et al. (2012) S. Avci, O. Chmaissem, D. Y. Chung, S. Rosenkranz, E. A. Goremychkin, J. P. Castellan, I. S. Todorov, J. A. Schlueter, H. Claus, A. Daoud-Aladine, D. D. Khalyavin, M. G. Kanatzidis, and R. Osborn, Phys. Rev. B 85, 184507 (2012).
- Mansart et al. (2011) B. Mansart, V. Brouet, E. Papalazarou, M. Fuglsang Jensen, L. Petaccia, S. Gorovikov, A. N. Grum-Grzhimailo, F. Rullier-Albenque, A. Forget, D. Colson, and M. Marsi, Phys. Rev. B 83, 064516 (2011).
- Thirupathaiah et al. (2010) S. Thirupathaiah, S. de Jong, R. Ovsyannikov, H. A. Dürr, A. Varykhalov, R. Follath, Y. Huang, R. Huisman, M. S. Golden, Y.-Z. Zhang, H. O. Jeschke, R. Valentí, A. Erb, A. Gloskovskii, and J. Fink, Phys. Rev. B 81, 104512 (2010).
- Yi et al. (2009b) M. Yi, D. H. Lu, J. G. Analytis, J.-H. Chu, S.-K. Mo, R.-H. He, R. G. Moore, X. J. Zhou, G. F. Chen, J. L. Luo, N. L. Wang, Z. Hussain, D. J. Singh, I. R. Fisher, and Z.-X. Shen, Phys. Rev. B 80, 024515 (2009b).
- Yi et al. (2017) M. Yi, Y. Zhang, Z.-X. Shen, and D. Lu, npj Quantum Materials 2, 57 (2017).
- Lu et al. (2008) D. H. Lu, M. Yi, S.-K. Mo, A. S. Erickson, J. Analytis, J.-H. Chu, D. J. Singh, Z. Hussain, T. H. Geballe, I. R. Fisher, and Z.-X. Shen, Nature 455, 81 (2008).
- Charnukha et al. (2015) A. Charnukha, S. Thirupathaiah, V. B. Zabolotnyy, B. Büchner, N. D. Zhigadlo, B. Batlogg, A. N. Yaresko, and S. V. Borisenko, Scientific Reports 5, 10392 (2015).
- Lee et al. (2012) G. Lee, H. S. Ji, Y. Kim, C. Kim, K. Haule, G. Kotliar, B. Lee, S. Khim, K. H. Kim, K. S. Kim, K.-S. Kim, and J. H. Shim, Phys. Rev. Lett. 109, 177001 (2012).
- Brouet et al. (2013) V. Brouet, P.-H. Lin, Y. Texier, J. Bobroff, A. Taleb-Ibrahimi, P. Le Fèvre, F. Bertran, M. Casula, P. Werner, S. Biermann, F. Rullier-Albenque, A. Forget, and D. Colson, Phys. Rev. Lett. 110, 167002 (2013).
- Yin et al. (2011) Z. P. Yin, K. Haule, and G. Kotliar, Nature Materials 10, 932 (2011).
- Nishi et al. (2011) I. Nishi, M. Ishikado, S. Ideta, W. Malaeb, T. Yoshida, A. Fujimori, Y. Kotani, M. Kubota, K. Ono, M. Yi, D. H. Lu, R. Moore, Z.-X. Shen, A. Iyo, K. Kihou, H. Kito, H. Eisaki, S. Shamoto, and R. Arita, Phys. Rev. B 84, 014504 (2011).
- Richard et al. (2011) P. Richard, T. Sato, K. Nakayama, T. Takahashi, and H. Ding, Reports on Progress in Physics 74, 124512 (2011).
- Haule and Kotliar (2009) K. Haule and G. Kotliar, New Journal of Physics 11, 025021 (2009).
- de’ Medici et al. (2014) L. de’ Medici, G. Giovannetti, and M. Capone, Phys. Rev. Lett. 112, 177001 (2014).
- Yu and Si (2013) R. Yu and Q. Si, Phys. Rev. Lett. 110, 146402 (2013).
- Ortenzi et al. (2009) L. Ortenzi, E. Cappelluti, L. Benfatto, and L. Pietronero, Phys. Rev. Lett. 103, 046404 (2009).
- Rotundu and Birgeneau (2011) C. R. Rotundu and R. J. Birgeneau, Phys. Rev. B 84, 092501 (2011).
- (58) H. Pfau, Unpublished.
- Plonka et al. (2013) N. Plonka, A. F. Kemper, S. Graser, A. P. Kampf, and T. P. Devereaux, Phys. Rev. B 88, 174518 (2013).
- van Heumen et al. (2011) E. van Heumen, J. Vuorinen, K. Koepernik, F. Massee, Y. Huang, M. Shi, J. Klei, J. Goedkoop, M. Lindroos, J. van den Brink, and M. S. Golden, Phys. Rev. Lett. 106, 027002 (2011).
- Lin et al. (2011) C.-H. Lin, T. Berlijn, L. Wang, C.-C. Lee, W.-G. Yin, and W. Ku, Phys. Rev. Lett. 107, 257001 (2011).