Disentangling the spatial substructure of Cygnus OB2 from Gaia DR2
Abstract
For the first time, we have explored the spatial substructure of the Cygnus OB2 association using parallaxes from the recent second Gaia data release. We find significant line-of-sight substructure within the association, which we quantify using a parameterised model that reproduces the observed parallax distribution. This inference approach is necessary due to the non-linearity of the parallax-distance transformation and the asymmetry of the resulting probability distribution. By using a Markov Chain Monte Carlo ensemble sampler and an unbinned maximum likelihood test we identify two different stellar groups superposed on the association. We find the main Cygnus OB2 group at 1760 pc, further away than recent estimates have envisaged, and a foreground group at 1350 pc. We also calculate individual membership probabilities and identify outliers as possible non-members of the association.
keywords:
astrometry – parallaxes – stars: massive – stars: distances – stars: early-type – open clusters and associations : individual: Cygnus OB21 Introduction
A key difficulty in the study of Milky Way massive stars and OB associations has been the large uncertainty in their distances, hindering the comparison with theories of stellar and cluster evolution. They are needed to place the stars in the Hertzsprung-Russell Diagram (HRD), obtaining a better comparison of stellar masses and radii derived from the spectroscopic analyses and the evolutionary codes (a persistent problem in the field of massive stars, see Herrero et al. (1992); Repolust, Puls, & Herrero (2004); Massey et al. (2012); Markova & Puls (2015)).
The recent second data release (DR2) from the Gaia satellite (Gaia Collaboration et al., 2016, 2018) has provided unprecedented high quality astrometry for more than 1.3 billion objects, all with measured parallaxes. Parallax uncertainties (excluding a conservative systematic error up to 0.1 mas, see Luri et al. (2018)) are around 0.04 milliarcseconds (mas) for bright sources (G 14 mag), around 0.1 mas for sources with a G magnitude 17, and around 0.7 mas for the faintest (G 20 mag). This scenario provides a unique opportunity to inspect the internal structure of Galactic young open clusters and relatively nearby massive OB associations.
The Cygnus OB2 association is one of the most massive OB associations at less than 2 kpc from the Sun (Knödlseder, 2003; Rygl et al., 2012). Hosting hundreds of OB stars, it is the most obvious example of recent star formation in the massive Cygnus-X complex. Its massive star population has been widely studied, including membership (Massey & Thompson, 1991; Knödlseder, 2000; Comerón et al., 2002; Hanson, 2003; Negueruela et al., 2008; Comerón & Pasquali, 2012; Berlanas et al., 2018a), mass function (Kiminki et al., 2007; Wright, Drew, & Mohr-Smith, 2015), extinction (Hanson, 2003; Guarcello et al., 2012; Comerón & Pasquali, 2012; Wright, Drew, & Mohr-Smith, 2015) and chemical composition (Berlanas et al., 2018b) studies. The distribution of stellar ages extends beyond 20 Myr (Comerón et al., 2016) and a correlation between age and Galactic longitude exists, suggesting that massive-star formation has proceeded from lower to higher Galactic longitudes (Comerón & Pasquali, 2012; Berlanas et al., 2018a). The significant spatial (Wright et al., 2014) and kinematic substructure found by Wright et al. (2016) could indicate that Cygnus OB2 is made up of different individual subgroups. However, an uncertainty over whether all its OB stellar content are at the same distance persists. The high-precision Gaia DR2 parallaxes could therefore be used to properly study and unravel the spatial substructure of this association. Differentiating internal subgroups will help to understand the star formation process, origin, and evolution of the association, as well better characterize the stellar content in the region.
This paper is organized as follows. In Section 2 we present the data and selection criteria. In Section 3 the modelling approach used in this work is detailed. In Section 4 we show the results of the best-fitting model and membership probabilities. A discussion of these results is provided in Section 5. Finally, we summarize the work in Section 6.
2 Data
2.1 Stellar sample
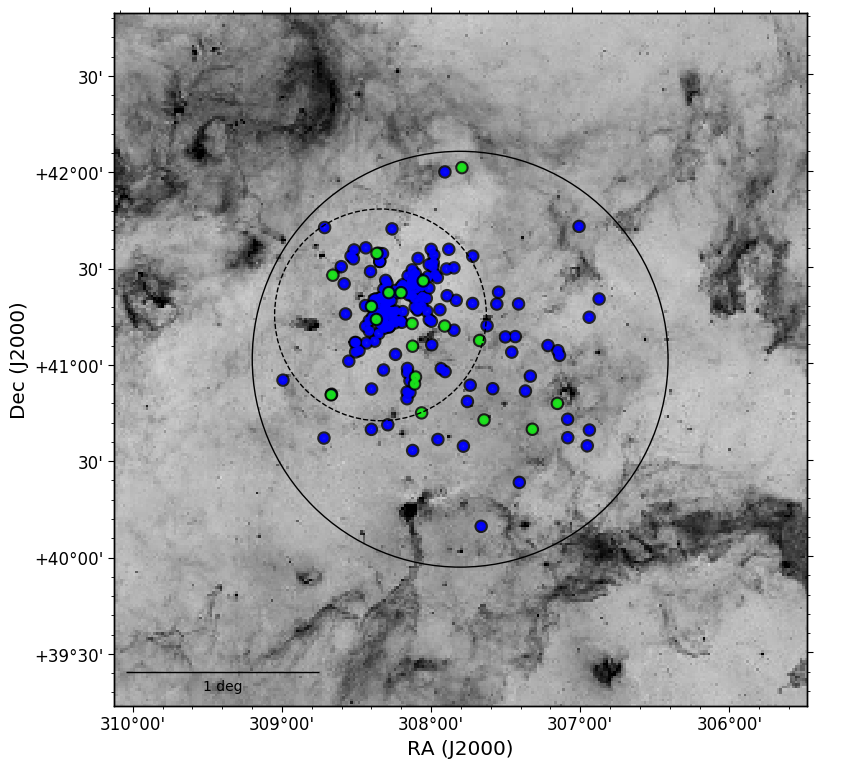
The sample of stars used for this study is comprised of known OB members of Cygnus OB2 within a radius of 1 deg. of the coordinates 79.8∘ and +0.8∘. We gathered stars from the samples of Wright, Drew, & Mohr-Smith (2015) and Berlanas et al. (2018a), the former of which is a census of spectroscopic members gathered from the literature (e.g., Massey & Thompson, 1991; Comerón et al., 2002; Hanson, 2003; Kiminki et al., 2007) while the latter expands this work to include more stars over a wider area. This produced a sample of 229 members of Cygnus OB2, 167 of which are located in the core of the region (see Fig. 1).
2.2 Gaia DR2 parallaxes
Astrometry for this work was taken from Gaia DR2 (Gaia Collaboration et al., 2018). We included stars that have astrometry that passed the selection criteria recommended by L. Lindegren based on the re-normalised unit weight error (or RUWE), defined as where and is a smooth function in magnitude () and colour ()111See technical note GAIA-C3-TN-LU-LL-124-01 available at https://www.cosmos.esa.int/web/gaia/public-dpac-documents. We adopted RUWE 1.4 as the selection criterion for good astrometric solutions, as recommended in the above cited technical note. This cut caused us to discard 29 stars, resulting in a sample of 200 targets with reliable Gaia astrometry. We also note that all the targets of our sample meet with the visibility_periods_used 8 criterion, which is a key recommendation from the data release papers (Lindegren et al., 2018; Arenou et al., 2018). The final stellar sample used for this work and those stars discarded by the selection criteria are available in electronic form at the CDS and at MNRASL online.

Gaia DR2 parallax uncertainties are derived from the formal errors computed in the astrometric processing. Additional systematic uncertainties of up to 0.1 mas exist and depend on factors such as the position on the sky, magnitude, and colour of the targets (Lindegren et al., 2018). Since our goal is not to obtain absolute distances for individual sources but to resolve internal substructure of the association we only consider the relative parallaxes of sources in the association. We do not expect the systematic error to vary across our sample since our field of view is relatively small (1 degree) and our sample has similar magnitudes and colours. Therefore, systematic parallax uncertainties are not included in our analysis, but are added when absolute distances are calculated (as will the parallax zero point offset of -0.03 mas, Lindegren et al., 2018).
3 Modelling method
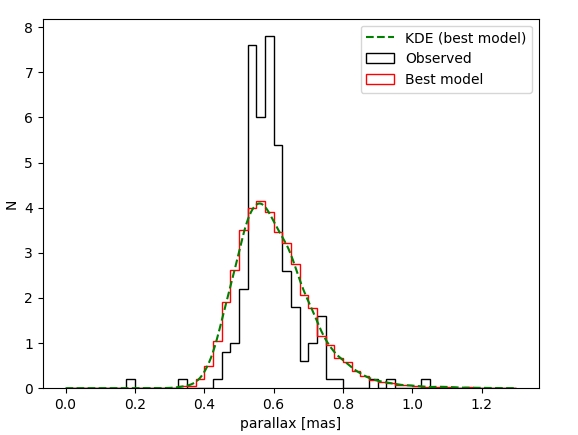
The observed parallax distribution of our sample (see Fig. 2, in black) peaks at about 0.6 mas, but is wider than would be expected if it’s width was entirely due to parallax uncertainties. The distribution also shows evidence for multiple groups along the line-of-sight. Therefore, instead of estimating the distance to the association based on the average parallax we model the parallax distribution as a series of groups, each with an inherent width and different distance.
To infer the distance to the Cygnus OB2 association we use a parameterised model of the distance to the association to reproduce the observed parallax distribution of the massive stars. The model predicts a distribution of parallaxes that is then compared to the observed distribution in parallax space. This Bayesian inference process is critical when using parallaxes because of the non-linearity of the transformation between these quantities and the asymmetry of the resulting probability distribution (Bailer-Jones, 2015).
We model the stellar population assuming it is composed of components, each of which contains a fraction of the total stellar content, , and have distances that follow a Gaussian distribution. Each component therefore has free parameters for the centre, , and standard deviation, , of each Gaussian, as well as an additional parameters to represent the fraction of stars in each component. Thus the model has a total of parameters. We use wide and linear priors, allowing the central distances for each component of the association to vary in the range of 1–2 kpc and the standard deviations to vary from 0–1 kpc.
| Model 1 | Model 2 | Model 3 | ||||
| 1 | 1 | 2 | 1 | 2 | 3 | |
| [pc] | 1706 | 1350 | 1755 | 1328 | 1676 | 1872 |
| +33 | +45 | +23 | +42 | +34 | +36 | |
| -32 | -59 | -19 | -42 | -39 | -40 | |
| [pc] | 268 | 33 | 31 | 32 | 34 | 24 |
| +41 | +23 | +26 | +18 | +13 | +11 | |
| -39 | -16 | -17 | -16 | -13 | -11 | |
| Fraction [%] | 100 | 19 | 81 | 11 | 50 | 39 |
The posterior distribution was sampled using the Markov Chain Monte Carlo (MCMC) affine-invariant ensemble sampler emcee (Foreman-Mackey et al., 2013) with 500 walkers and 10,000 iterations. The model was compared to the observations using an unbinned maximum likelihood test. The posterior distributions were found to follow a normal distribution, and thus the median value of each parameter was used as the best fit, with the 16th and 84th percentiles used for the 1 uncertainties.
4 Results
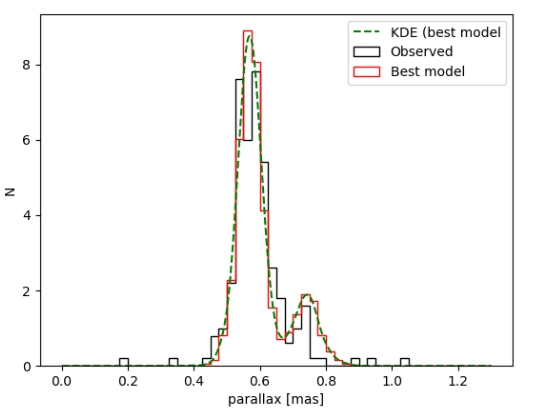
We applied the Shapiro-Wilk test (Shapiro & Wilk, 1965) to the observed parallax distribution, which evidences that it does not follow a single normal distribution. The p-value returned () rejects the null hypothesis that the data come from a single normally distributed population. We then fit the observed distribution with both 2- and 3- component models (see Fig. 2 and Table 1) and determine which model provides the best fit using the Bayesian information criterion (BIC, see Schwarz, 1978), which applies a penalty to the likelihood of more complex models so that models with different numbers of parameters can be compared.
We find that the 2-component model provides the lowest BIC and, therefore, the best fit to the data. Fig. 2 corroborates that the observed parallax distribution does not fit well with a single component, and the 3-component one does not offer enough improvement. Hence we do not investigate more complex models and choose the 2-component model as representative of the observed distribution. Two different groups can be clearly distinguished, with approximate central distances of (rand) (syst.) pc and (rand) (syst.) pc (systematic uncertainties take into account the 0.1 mas systematic parallax uncertainty in Gaia DR2), showing a significant distance separation between the two groups.
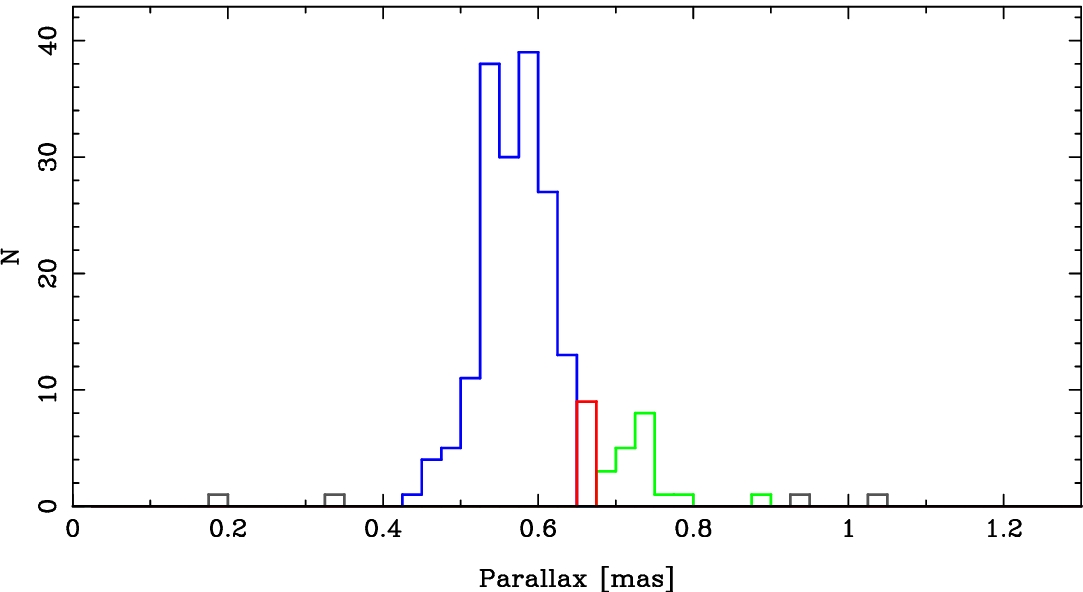
Based on our 2-component model fit we calculated, for each star, membership probabilities for each of the populations: the foreground group (at 1350 pc, henceforth Group 1), the main group (at 1760 pc, henceforth Group 2), and whether they are foreground or background contaminants (Group 3). We then assign stars to each of these classes based upon their membership probabilities. If a star has a 75% probability of belonging to group 1 or 2 then it is assigned to that group. For a star to be flagged as a foreground or background contaminant we require a higher probability (or effectively a lower probability that it is not a member of the other groups) of 99%. And finally, there is a group of objects which we can not reliably place in any group (Group 0). Figure 3 shows the parallax distribution of the sources in each group, coloured green (Group 1), blue (Group 2), grey (Group 3) or red (Group 0). Membership groups of the final stellar sample are available in electronic form at the CDS and at MNRASL online.
While Gaia DR2 data is not as well characterised in the Galactic Plane as out of it, for the observed substructure to originate from errors or biases in the data would require systematic offsets of at least 0.2 mas in parallax, significantly larger than any quoted uncertainties or systematics in the data (Gaia Collaboration et al., 2018). We can also find no difference in the distributions of RUWE values or parallax uncertainties between the stars in the two main groups.
5 Discussion
5.1 Spatial structure
We have modelled the parallax distribution of Cygnus OB2, resolving for the first time its spatial structure along the line-of-sight. Although our analysis is restricted to the OB population, Wright et al. (2014) showed that low- and high-mass stars are distributed in the same way, without evidence of mass segregation. We have distinguished between two clusterings, distributed on the sky as shown in Fig. 1. The centres of the two groups projected on the sky are not very different. Given the low density and extended nature of the foreground population it is possible that it extends beyond our field of view. The statistical parameters obtained for each group distribution ( and of Model 2, see Table 1) suggest that the two groups are spatially separate. We consider the larger population to be the main Cygnus OB2 association (Group 2) and consider the foreground population to be a separate group approximately 400 pc in the foreground (Group 1).
The distance of the foreground group of 1350 pc puts it at a similar distance to Cygnus-X as a whole (see Rygl et al., 2012) suggesting that the main part of Cygnus OB2 is actually behind Cygnus-X by several hundred parsecs (though the line-of-sight depth of Cygnus-X is not well constrained). Consequently the main group is more distant than previously thought, and therefore its stellar content will both be more luminous (approximately 1.5 times more luminous compared to the estimates in Wright, Drew, & Mohr-Smith (2015)) and more massive. Interestingly this puts the distance to the main part of Cygnus OB2 closer to that originally derived by Massey & Thompson (1991).
5.2 The foreground group
We have identified 19 stars in the foreground group (10 of the sample), seven of them classified as O-type stars. The bright BD+40 4212 double system ( mag) is included in this group, as well as the star HD 195213 ( mag). This group includes approximately 10 of the total population of O-type stars in Cygnus OB2 and thus its total mass can be estimated as a similar fraction of the total mass of 16500 M⊙ estimated by Wright, Drew, & Mohr-Smith (2015), i.e., 1650 M⊙, similar to that of the Orion Nebula Cluster (although according to our results, the estimation by Wright, Drew, & Mohr-Smith (2015) will have to be corrected upwards). We note that the foreground group is appreciably more dispersed on the sky than the main group. The proper motions also suggest it to be more diffuse and less likely to be a bound group. This could suggest that it is part of older foreground population that extends further outside our field of view. However, a detailed study of the physical properties of its stellar content is needed to establish the most probable scenario.
5.3 Potential contaminants
Here we discuss the sources identified as probable foreground or background contaminants (Group 3) and not part of either the main Cyg OB2 population or the foreground group.
-
•
Foreground contaminants: HD 196305 is a very luminous star and has a parallax that places it at a distance of pc, in agreement with previous studies that suggest it to be a foreground contaminant (Chentsov et al., 2013). CCDMJ20323+4152AB has been reported as a visual double star by Gili & Bonneau (2001) and, therefore, its binary nature could be affecting the parallax. MT91-426 and MT-170 also appear as foreground sources, despite the fact that Wright, Drew, & Mohr-Smith (2015) proposed them as background sources based on their position in the Hertzsprung-Russell diagram. This could suggest either erroneous photometry of spectral classification, particularly in the luminosity class (e.g., a subdwarf nature).
-
•
Background contaminants: J20272428+4115458 was classified as a B0IV star by Berlanas et al. (2018b) for which Gaia DR2 provides a parallax value of 0.35 0.03 mas. It has a G magnitude of 11.4 mag, so the parallax uncertainty could be underestimated by up to 30. If we also add in possible systematic errors, this star is compatible with the main Cygnus OB2 population but tentatively we suggest it as a background contaminant. For MT91-459 (J20331433+4119331) Gaia DR2 provides a parallax of 0.19 0.04 mas, clearly indicating a background contaminant.
Although the highly massive, reddened and luminous Cyg OB2 #12 hypergiant has been discarded by the astrometric selection criteria (RUWE 1.56 for this star) we highlight that Gaia DR2 places it significantly in the foreground at a distance of pc (Bailer-Jones et al., 2018). There are good reasons to doubt such a small inferred distance: the star has a peculiar spectrum suggesting very high luminosity and a large extinction (e.g. Clark et al., 2012); the astrometry could reflect light centre variations in what is potentially a large angular-diameter object (see Salas et al., 2015). Given these issues it is appropriate that it has been excluded here.
6 Conclusions
The structure of young star clusters and associations is fundamental to our understanding of their formation and dynamical evolution, as well as of their stellar content. In this work we have used Gaia DR2 parallaxes to study the 3-dimensional structure of the Cygnus OB2 association, finding significant spatial substructure along the line-of-sight.
We fitted the observed parallax distribution with both 1-, 2- and 3- component Gaussian models and find that the best fit to the data was provided by the 2-component model, obtaining median distances to the two components of (rand) (syst.) pc and (rand) (syst.) pc. The main Cygnus OB2 group appears to be at a greater distance than has recently been thought (implying its stellar content is therefore brighter and more massive). Furthermore the parallax distribution observed suggests there may be further substructure within the association, though this is not well resolved by the available parallaxes. The foreground group, constituting approximately 10% of the stellar content, is several hundred parsecs in the foreground and appears more extended than the main group. A further six stars have also been found as possible background or foreground contaminants, unrelated to either group.
Gaia DR2 has provided a new view of the Cygnus OB2 association. The distance spread and substructure found within the association have shown previous concerns over the line-of-sight extent of the region were warranted. The better vision we now have moves us closer to a complete understanding of the origin and evolution of Cygnus OB2, Cygnus-X and OB associations.
Acknowledgements
We thank J.H.J. de Bruijne, X. Luri and J. Maíz-Apellaniz for helpful discussions and comments that helped improve this work. SRB and AHD acknowledge financial support from the Spanish Ministry of Science, Innovation and Universities (MCIU) under the grants AYA2015-68012-C2-01 and SEV-2015-0548, and the Gobierno de Canarias under the grant ProID-2017010115. NJW acknowledges an STFC Ernest Rutherford Fellowship (grant number ST/M005569/1). JED’s research is supported via STFC grant ST/M001008/1.
References
- Arenou et al. (2018) Arenou F., et al., 2018, arXiv, arXiv:1804.09375
- Bailer-Jones et al. (2018) Bailer-Jones C. A. L., Rybizki J., Fouesneau M., Mantelet G., Andrae R., 2018, arXiv, arXiv:1804.10121
- Bailer-Jones (2015) Bailer-Jones C. A. L., 2015, PASP, 127, 994
- Berlanas et al. (2018b) Berlanas S. R., Herrero A., Comerón F., Simón-Díaz S., Cerviño M., Pasquali A., 2018, A&A, 620, A56
- Berlanas et al. (2018a) Berlanas S. R., Herrero A., Comerón F., Pasquali A., Bertelli Motta C., Sota A., 2018, A&A, 612, A50
- Chentsov et al. (2013) Chentsov E. L., Klochkova V. G., Panchuk V. E., Yushkin M. V., Nasonov D. S., 2013, ARep, 57, 527
- Clark et al. (2012) Clark J. S., Najarro F., Negueruela I., Ritchie B. W., Urbaneja M. A., Howarth I. D., 2012, A&A, 541, A145
- Comerón et al. (2016) Comerón, F., Djupvik, A. A., Schneider, N., & Pasquali, A. 2016, A&A, 586, A46
- Comerón & Pasquali (2012) Comerón F., Pasquali A., 2012, A&A, 543, A101
- Comerón et al. (2002) Comerón, F., Pasquali, A., Rodighiero, G., et al. 2002, A&A, 389, 874
- Foreman-Mackey et al. (2013) Foreman-Mackey D., et al., 2013, ascl.soft, ascl:1303.002
- Gaia Collaboration et al. (2018) Gaia Collaboration, Brown A. G. A., Vallenari A., Prusti T., de Bruijne J. H. J., Babusiaux C., Bailer-Jones C. A. L., 2018, arXiv, arXiv:1804.09365
- Gaia Collaboration et al. (2016) Gaia Collaboration, Prusti, T., de Bruijne, J. H. J., et al. 2016, A&A, 595, A1
- Gili & Bonneau (2001) Gili R., Bonneau D., 2001, A&A, 378, 954
- Guarcello et al. (2012) Guarcello M. G., Wright N. J., Drake J. J., García-Alvarez D., Drew J. E., Aldcroft T., Kashyap V. L., 2012, ApJS, 202, 19
- Herrero et al. (1992) Herrero A., Kudritzki R. P., Vilchez J. M., Kunze D., Butler K., Haser S., 1992, LNP, 401, 21
- Hanson (2003) Hanson M. M., 2003, ApJ, 597, 957
- Kiminki et al. (2007) Kiminki, D. C., Kobulnicky, H. A., Kinemuchi, K., et al. 2007, ApJ, 664, 1102
- Knödlseder (2003) Knödlseder J., 2003, IAUS, 212, 505
- Knödlseder (2000) Knödlseder, J. 2000, A&A, 360, 539
- Lindegren et al. (2018) Lindegren L., et al., 2018, arXiv, arXiv:1804.09366
- Luri et al. (2018) Luri X., et al., 2018, arXiv, arXiv:1804.09376
- Markova & Puls (2015) Markova N., Puls J., 2015, IAUS, 307, 117
- Massey et al. (2012) Massey P., Morrell N. I., Neugent K. F., Penny L. R., DeGioia-Eastwood K., Gies D. R., 2012, ApJ, 748, 96
- Massey & Thompson (1991) Massey P., Thompson A. B., 1991, AJ, 101, 1408
- Negueruela et al. (2008) Negueruela, I., Marco, A., Herrero, A., & Clark, J. S. 2008, A&A, 487, 575
- Repolust, Puls, & Herrero (2004) Repolust T., Puls J., Herrero A., 2004, A&A, 415, 349
- Rygl et al. (2012) Rygl K. L. J., et al., 2012, A&A, 539, A79
- Salas et al. (2015) Salas, J., Maíz Apellániz, J., & Barbá, R. H. 2015, Highlights of Spanish Astrophysics VIII, 615
- Schwarz (1978) Schwarz, G., 1978, Ann. Stat., 6, 461
- Shapiro & Wilk (1965) Shapiro, S. S., & Wilk, M. B., 1965, Biometrika, 52, 591-611
- Wright et al. (2016) Wright N. J., Bouy H., Drew J. E., Sarro L. M., Bertin E., Cuillandre J.-C., Barrado D., 2016, MNRAS, 460, 2593
- Wright, Drew, & Mohr-Smith (2015) Wright N. J., Drew J. E., Mohr-Smith M., 2015, MNRAS, 449, 741
- Wright et al. (2014) Wright, N. J., Parker, R. J., Goodwin, S. P., & Drake, J. J. 2014, MNRAS, 438, 639
Supporting information
The list of Cygnus OB2 sources used for this work, derived membership and those stars that have not passed the selection criteria are available in electronic form at the CDS and at MNRAS online.