IC 361:- Near-infrared and Photometric Analysis
Abstract
The detailed optical and infra-red photometric analysis of the open star cluster IC 361 have shown in the present manuscript. On studying the radial density profile, radial extent of the cluster is found to be arcmin. The basic physical parameters of the cluster such as = mag, mag, log(Age)=9.100.05, and mag are obtained using the colour-colour and colour-magnitude diagrams. IC 361 is found to be located at a distance of kpc. Using the archival proper motion catalogues, we are estimated the mean proper motions of IC 361 as 4.970.17 mas yr-1 and -5.800.18 mas yr-1 in the direction of RA and DEC, respectively. We have not found steeper slop of stellar mass functions of cluster’s main sequence. However, the mass function slope of coronal region is found to be which is too low compare than Salpeter value. Our study is further showing dynamically relax behaviour of the cluster IC 361.
keywords:
(Galaxy): Open star cluster; individual: IC 361; variable: pulsation; method-data analysis1 Introduction
IC 361 is an open cluster (OC) in the constellation Camelopardus (Piccirillo & Stein, 1978). This cluster is well detached from the field, but it is very poorly studied due to its faintness (Zdanavicius et al., 2009). IC 361 lies in the second Galactic quadrant, in the immediate vicinity of the Camelopardalis dark clouds; as a result, it demonstrates a considerable interstellar reddening (Zdanavicius et al., 2010).Piccirillo & Stein (1978) were adopted a distance of 2.5 kpc, a high value of reddening, , and suggested the age in the range 0.5 to 1 Gyr. On this background, the comprehensive analysis of and photometric data is carried out in the present manuscript.
This paper is organized as follows. The photometric calibration of the clusters is described in Section 2. The existence of clusters is discussed in the Section 3. The results of parameters through colour-magnitude diagrams (CMDs) and two colour diagrams (TCDs) are given in the Section 4. Section 5 is devoted to identify the probable members of IC 361 and its mean proper motions. Dynamical study of the cluster has been carried out in the Section 6. The final conclusions and discussion are stated in Section 7.
| Photomet- | No. of | Time of Observation | Exposure | Air-mass | Zero | Colour | Extinction |
|---|---|---|---|---|---|---|---|
| -ric Band | frames | (JD=2456651+) | Time (Sec) | point | Coefficient | Coefficient | |
| U | 1 | 0.27968 | 300 | 1.227 | |||
| B | 2 | 0.26235, 0.26404 | 30, 150 | 1.189, 1.194 | |||
| V | 2 | 0.26810, 0.27126 | 120,30 | 1.200, 1.204 | |||
| R | 1 | 0.27322 | 40 | 1.208 | |||
| I | 2 | 0.27513, 0.27690 | 25, 100 | 1.211, 1.216 |
2 Photometric calibration and comparison with previous study
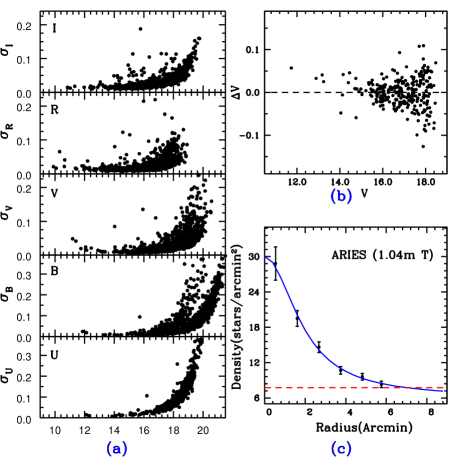
Johnson-Cousins photometry of stars in the field of IC 361 was obtained on 2013, December 24 using the 1.04-m Sampurnanand telescope at Nainital, India. The observation detail of this cluster is given in the Table 1. On the same night we also observed Landolt’s standard field: SA92 (Landolt, 1992). The usual image processing procedures (bias subtraction, flat fielding, and cosmic ray removal) were performed through IRAF111Image Reduction and Analysis Facility (IRAF) is distributed by the National Optical Astronomy Observatories, which are operated by the Association of Universities for Research in Astronomy, Inc., under cooperative agreement with the National Science Foundation. software package. Photometry of the frames were performed using the DAOPHOT II profile fitting software (Stetson, 1987). The resultant transformation coefficients for the standard stars are also listed in the Table 1 and photometric error with magnitude are depicted in Figure 1a. We have found 1883 stars in the observed field of view (FOV) of the cluster.
In order to transform CCD pixel coordinates to celestial coordinates, we used the on-line digitized ESO catalogue included in the skycat software as an absolute astrometric reference frame. A linear astrometric solution was derived for the V filter reference frame by matching positions of 170 well isolated bright stars. The and routines are utilized for this purpose. We have been found 276 common stars between present photometry and Vilnious photometry (Zdanavicius et al., 2010) and V-magnitude difference of both photometry is shown in the Figure 1b.
| Radius | Core-radius | Max. Model | Av. Field |
|---|---|---|---|
| (in arcmin) | (in arcmin) | Density | Density |
2MASS Catalogue
| 8.0 0.4 | 1.83 0.34 | 11.08 2.15 | 1.21 0.19 |
|---|
1.04-m telescope of ARIES
| 7.0 0.2 | 1.91 0.20 | 23.89 1.76 | 6.11 0.55 |
|---|
PPMXL Catalogue
| 8.2 0.2 | 2.10 0.24 | 20.48 2.12 | 7.52 0.29 |
|---|
WISE Catalogue
| 8.0 0.4 | 3.99 1.42 | 3.21 0.51 | 5.97 0.45 |
|---|
Catalogue of VILNIOUS Observatory
| 10.0 0.4 | 1.85 0.19 | 15.87 1.74 | 1.63 0.15 |
|---|
3 Center and Radius of the cluster
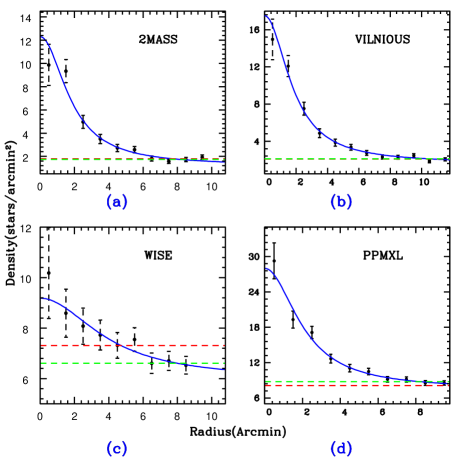
The center coordinate () of cluster is found to be . Similarly, the equivalent pixel coordinate of center of observed reference of IC, 361 frame is given as (x,y)=(465, 545). The radial density profile (RDP) of open cluster is used to determine the cluster radius. The RDP is constructed by determining the stellar density in concentric rings of equal width around the cluster center. We choose a thickness of about 1 arcmin ( 80 pixels) for each ring in order to have statistically significant number of stars in each radial zone. The stellar density ( ) at the distance from the cluster center is defined by the following empirical formula (Kaluzny & Udalski, 1992):
| (1) |
where is the peak stellar density and is the background density. The is core radius of the cluster defined as a distance from the center at which the density becomes half of the . The cluster radius is determined where RDP intercepts to background density. The prescribed background density is estimated as the average of first three approximate value of field densities and estimated background stellar densities of utilized data-sets of each catalogue have depicted by green line in each panel of Figure 2, whereas the model stellar densities have depicted by the red lines. The different seller number of different catalogue provide the different value of radius through the above said empirical formula. All obtained results are listed in the Table 2. To see obtained results, we conclude the size of radius and core radius of IC 361 as arcmin ( 645 pixels) and arcmin, respectively.
4 Analysis through the CMD and TCD
4.1 () vs () TCD
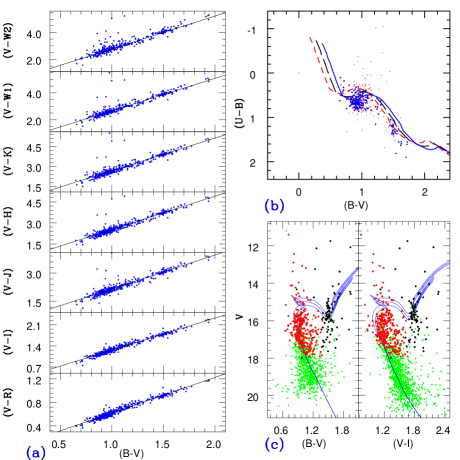
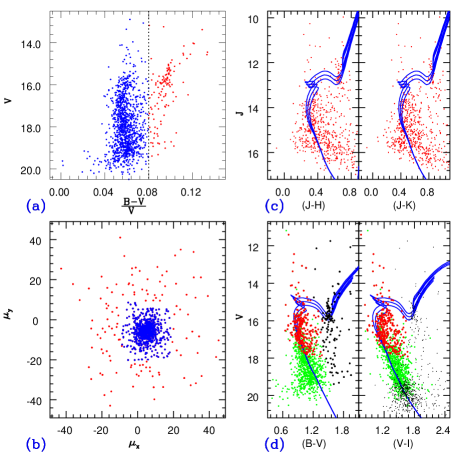
The reddening, , in the cluster region is estimated using the vs TCD. In Fig. 5-b, we plot TCD for the members found in our study. We also draw zero age-main sequence [ZAMS (Schmidt-Kalar, 1982)] for observed MS stars on () vs () diagram. Here, we assume a solar metallicity for the cluster and a reddening vector of (Dean et al. 1978, 1978). The error in reddening is calculated using the following relation as given by (Phelps & Janes, 1994).
| (2) |
The derived reddening E(B-V) from our study is , which is close to 0.55 estimated by Zdanavicius et al. (2010). The colour-excess and are estimated by the relations and respectively. From the relations, we estimated colour excesses of and as and mag, respectively.
4.2 Age and Distance by CMDs
For the determination of age and distance of the cluster, we draw the and CMDs for members of cluster as illustrated in Fig 5-c which show a well populated but broad main sequence (MS) stars that may be due to photometric errors and/or presence of binary stars within the cluster. The variable reddening across the cluster region could also be the cause of the broad MS. We overplot Marigo’s theoretical isochrones (Marigo et al., 2008) on the CMDs by varying the distance modulus and age simultaneously in both and CMDs while keeping reddening mag and mag fixed as determined in the previous sub-section and assuming . From the best visual isochrone fit to the varying age and distance combinations on the MS stars, we obtained a distance modulus mag and (yr) for the cluster IC 361. Employing the correction for the reddening and assuming a normal reddening law (see, Sect. 4.4), this corresponds to a true distance modulus mag or a distance of 3.220.07 kpc for the cluster. Our estimated distance is close to the distance of kpc obtained by Zdanavicius et al. (2010).
Though isochrone fitting is often used to estimate the age of the cluster in the absence of more valuable but lesser available spectroscopic observations but it should be kept in mind that determining precise age through isochrone fitting in clusters, where no evolved stars are found, is very difficult as it contains a large uncertainty on this value.
4.3 Nature of extinction law
As the light emitted from the star cluster, it passes through the interstellar dust and gas, hence the scattering and absorption of light takes place. Since the absorption and scattering of the blue light is more compared to the red light, the stars appear reddened. Generally, normal reddening law is applicable when dust and intermediate stellar gases are absent in the line of sight of the cluster (Snedden et al., 1978). However, the reddening law is expected to be different in the presence of dust and gas. We have investigated the nature of reddening law using TCDs (Chini & Wargue, 1990), where is any broad band filter, namely , , , , , , and . Here, and are mid-IR pass-bands used for Wide-field IR Survey Explorer (WISE) by Wright et al. (2010). The TCDs have been widely used to separate the influence of the extinction produced by the diffuse interstellar material from that of the intra-cluster medium (Chini & Wargue, 1990). Therefore, we constructed the resultant diagram in different wavelength bands, as shown in Fig. 5-a. A best linear fit in the TCD of cluster gives the value of slope () for the corresponding TCD. The resultant values of the for seven colours are listed in Table 3 along with their normal values. Our slopes are quite comparable with those obtained for the diffuse interstellar material.
A total-to-selective extinction is determined using the relation given by Neckel & Chini (1981) as
| (3) |
Assuming the value of for the diffuse interstellar material as 3.1, we determined in first five colours and given in Table 3. The mean value of is estimated as for the cluster IC 361 through the last four computed values of ; moreover, this mean value of is low with compared to the normal reddening law. This prescribed Table indicates that the value is found to be high for the shorter effective wavelength with reference of optical band; whereas the values of are low for bands, having the high effective wavelength compare than the optical band.
| Color | Normal | Estimated | Total-to-Selective |
|---|---|---|---|
| Value | Value | Extinction Value | |
| 0.55 | 0.60 0.01 | 3.38 | |
| 1.10 | 1.06 0.01 | 2.99 | |
| 1.96 | 1.79 0.05 | 2.83 | |
| 2.42 | 2.37 0.05 | 3.03 | |
| 2.60 | 2.44 0.05 | 2.91 | |
| —- | 2.45 0.07 | —- | |
| —- | 2.41 0.07 | —- |
4.4 Reddening in near-infrared bands
The two-colour diagrams (TCDs) plots of various sets of two colours (magnitude difference of two bands) are important tools for investigating the nature of extinction law, dependency with each other and their variation from normal values (Joshi & Tyagi 2016). We are prescribing about two TCDs as below,
4.4.1 (V-K) vs (J-K) TCD
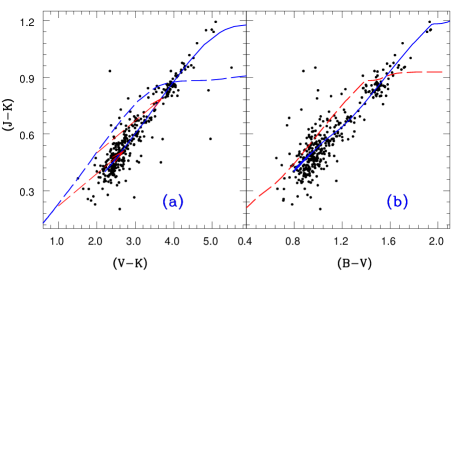
A vs diagram is used to determine the interstellar extinction in the near-IR (NIR) range. In Fig. 4-a, we plot vs diagram where we also overplot Marigo isochrones of solar metallicity by shifting the line in the direction of reddening vector . In this way, we obtained colour excesses of mag and mag. The relation given by Whittel & van Breda (1980) was used to estimate the corresponding value of reddening. In Fig. 4-a, we draw reddening vectors by shifting for the reddening values in the NIR bands (continuous line) and optical bands (long-dashed line). We yield mag in the direction of the cluster which is slightly higher than that was determined in the optical band. It clearly suggests a small IR excess for stars in the cluster IC 361. However, excess emission in the cluster IC 361 is not consistent with many relatively young clusters. Thus, IC 361 is an old age cluster with low IR-excess.
4.4.2 (B-V) vs (J-K) TCD
This prescribed TCD for present studied cluster is shown in the right panel of Fig. 4. The Marigo isochrone is used to know relationship between E(B-V) and E(J-K). The colour excess E(B-V) and E(J-K) of IC 361 are found to be 0.56 and 0.30 mag respectively. As a result, the E(J-K)/E(B-V) ratio for IC 361 is computed to be 0.54, which is close to the literature value, i.e. 0.56 (Joshi & Tyagi, 2016 and references therein). This variation is possible due to the different value of total-to-selective-extinction from normal value. The red line of Fig 4-b is representing Marigos isochrone without any shift, whereas the blue line is showing the best fitted line after shift of 0.56 mag in x-direction and 0.30 mag in y-direction respectively.
5 Mean Proper Motion and Probable members
The mean proper-motion value of the cluster is the mean value of proper-motion values of its probable members. Probables members of IC 361 are found through the field star decontamination. For this purpose, we have applied CMRD (Joshi & Tyagi, 2016 and references therein) approach to find clear stellar sequence of studied cluster. The CMR value of is 0.08 for brighter stars of cluster and this value is used to separate cluster’s stellar sequence from the field sequence as depicted in Figure 5 (a). The cluster radius is found to be 8 arcmin in present analysis leads the value of cluster’s diameter is arcmin. Since, estimated diameter is greater than the size of observed optical frame as well as other available optical catalogues, therefore, we can not utilized these catalogues for statistical colour-magnitude cleaning (Joshi et al., 2015) due to observations of limited region of cluster. The available data of field region of IC 361 is fulfilled criteria of our need. As a result, NIR data of cluster is used to further decontamination of filed stars. Since, required area of selected field region is equivalent to the enclosed area of cluster periphery, therefore, the disc size of field region for IC 361 is taken to be .
After iterating the cleaning procedure for each field region star, we found 850 probable members on the statistically cleaned CMDs (detail of cleaning procedure is published by Joshi et al., 2015). The location of these probable members around best fitted isochrones of and CMDs confirms the main sequence of IC 361. The resultant probable members are further utilized to estimate the mean proper motion of IC 361 through 3 clipping approach. In this approach, the stars which do not fall within 3 value of the mean are rejected for estimation. After 3 clipping, the mean proper motion values of IC 361 are found to be and in RA and DEC directions, respectively.
6 Dynamical study of the cluster
6.1 Luminosity and Mass functions
The luminosity function (LF) is the total number of cluster members in different magnitude bins. The estimated number of stars in each magnitude bin for the cluster are given in Table 4. One can see that number of stars reduced significantly after the 19 mag which is due to incompleteness factor. Here, we note that generally data incompleteness increases with the increasing magnitude and in the present catalogue, it is better than 90% upto 19 mag (Sharma et al., 2008). It is noted fact that the red dots are not appeared after 18 V-mag (See Figure 3-c), wherease the green dots are found uniformly with red dots and also appear after 18 V-mag. The turn point of best fitted isochrone finds below 15 V-mag and . We, therefore, have not applied any correction to the luminosity and mass functions between V-mag range 15-18 derived in the present study.
| V range | Mass range | |||||
|---|---|---|---|---|---|---|
| (mag) | ||||||
| 13-14 | 2.160-2.345 | 2.252 | 0.353 | 045 | 3.103 | 0.149 |
| 14-15 | 2.149-2.160 | 2.155 | 0.333 | 110 | 4.696 | 0.095 |
| 15-16 | 1.878-2.149 | 2.014 | 0.304 | 203 | 3.540 | 0.070 |
| 16-17 | 1.573-1.878 | 1.726 | 0.237 | 305 | 3.598 | 0.057 |
| 17-18 | 1.312-1.573 | 1.443 | 0.159 | 386 | 3.690 | 0.051 |
| 18-19 | 1.104-1.312 | 1.208 | 0.082 | 283 | 3.578 | 0.059 |
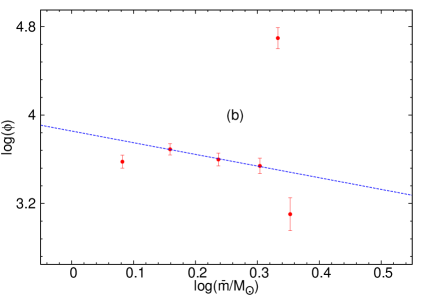
The initial mass function (IMF) is defined as the distribution of stellar masses per unit volume in a star formation event and knowledge of IMF is very effective to determine the subsequent evolution of cluster. The direct measurement of IMF is not possible due to the dynamical evolution of stellar systems though we can estimate the present mass function (MF) of cluster. The MF is defined as the relative numbers of stars per unit mass and can be expressed by a power law . The slope, , of the MF can be determined from
| (4) |
where is the number of stars per unit logarithmic mass. The masses of probable members can be determined by comparing observed magnitudes with those predicted by a stellar evolutionary model if the age, reddening, distance and metallicity are known. The MF determined for the cluster is given in Table 4. The effect of field star contamination is negligible for estimation of MF due to fact that MPMs are used for this purpose in the present study. Fig. 6 shows the MF in the cluster fitted for the MS stars with masses . The error bars have computed assuming Poisson Statistics. The MF slope () for cluster comes out to be which is low compare to Salpeter MF slope of -2.35 (Salpeter, 1955) within the given uncertainty.
6.2 Mass Segregation
Through the process of mass segregation, the stellar encounters of the cluster members are gradually increased. In the processes of mass segregation, the higher-mass cluster members gradually sink towards the cluster center by transferring their kinetic energy to the more numerous lower-mass stellar members of the cluster (Mathieu & Lathen, 1986). With the dynamical evolution of the cluster, the spatial mass distribution in the cluster changes with time. To investigate the dynamical evolution and mass segregation process in the cluster IC 361, the cumulative radial stellar distribution of the probable members for various mass ranges are shown in the Figure 7 and also given in the Table 5. It is seen that MS slope does not become steeper as the radial distance from the cluster increases. This clearly suggests that the mass segregation is not taking place in the cluster. To further study the mass segregation in more detail, we plot the variation of mean mass along the radial distance for the probable members in Fig. 8. The average mass of center is low as expected but satisfy the condition of stellar enhancement.
| Zone Size | Number | Cum. | Norm. cum. |
|---|---|---|---|
| (in pixels) | of stars | stellar No. | Distribution |
14 16
| 000-080 | 001 | 001 | 0.05 |
| 080-160 | 004 | 005 | 0.26 |
| 160-240 | 003 | 008 | 0.42 |
| 240-320 | 004 | 012 | 0.63 |
| 320-400 | 002 | 014 | 0.72 |
| 400-480 | 005 | 019 | 1.00 |
16 18
| 000-080 | 029 | 029 | 0.08 |
| 080-160 | 071 | 100 | 0.26 |
| 160-240 | 047 | 147 | 0.39 |
| 240-320 | 048 | 295 | 0.78 |
| 320-400 | 051 | 346 | 0.91 |
| 400-480 | 032 | 378 | 1.00 |
18 19 Catalogue
| 000-080 | 012 | 012 | 0.05 |
| 080-160 | 042 | 054 | 0.25 |
| 160-240 | 047 | 101 | 0.46 |
| 240-320 | 040 | 141 | 0.64 |
| 320-400 | 042 | 183 | 0.84 |
| 400-480 | 036 | 219 | 1.00 |
19 20
| 000-080 | 019 | 019 | 0.08 |
| 080-160 | 026 | 045 | 0.18 |
| 160-240 | 052 | 097 | 0.39 |
| 240-320 | 060 | 157 | 0.64 |
| 320-400 | 063 | 220 | 0.89 |
| 400-480 | 027 | 247 | 1.00 |
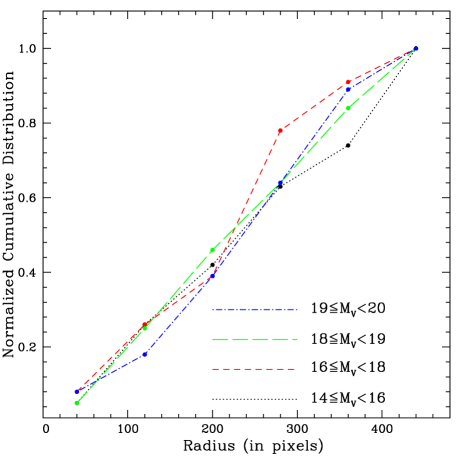

Our study indicate that the higher and lower mass stars are uniformly distributed in the cluster region. To understand whether it is an imprint of star formation process in the clusters and/or result of dynamical evolution, we determined dynamical relaxation time, , which is the time in which individual stars in the cluster exchange energies and their velocity distribution approaches Maxwellian equilibrium. It can be expressed as
| (5) |
where is in Myr, is the total number of cluster members, is the radius (in parsecs) containing half of the cluster mass and is mean mass of the cluster members in solar units (cf. Spitzer & Hart, 1971). We estimated a total of 1362 member stars in the mass range . The total mass of the cluster is found to be for IC 361, which gives an average mass of per star. The contribution of the low-mass stellar population is critical for constraining the total cluster mass, which is crucial in understanding the dynamical evolution and the long-term survival of a cluster (e.g., de Grijs & Parmentier 2007, and references therein). It can be seen that the half-radius of the cluster, , plays an important role in the determination of the dynamical relaxation time, . We obtained a half-mass radius for the cluster as 1.00 pc which is of the cluster radius. A half-mass radius larger than half of the cluster radius suggests that inner region still has a deficiency of massive stars in the core region of the cluster. We estimated the dynamical relaxation time = 9.46 Myr for the cluster. determined in the present study is very lower than the present age of about 1258.92 Myr which suggests that cluster IC 361 is dynamically relaxed.
7 Discussion and Conclusion
Open clusters are important tools for the understanding of the evolution phenomenon in galaxies because they provide information on star formation history. In the present study, we have constructed a complete catalogue for the cluster IC 361 by supplementing our photometric data with the 2MASS and WISE mid- surveys. Using a -band data of the present catalogue for the stars brighter than = 18 mag, we found that the core and cluster radius are arcmin and arcmin, respectively. Using probable members, we derived the reddening in optical band using diagram and in NIR band using diagram. The values of reddening were obtained as mag and mag in optical and NIR, respectively. Since IC 361 shows a differential extinction across the cluster region as well as IR colour excess, it indicates that the stars are still embedded in the parent molecular gas and dust.
Based on the and CMDs and a visual fitting of isochrones for solar metallicity given by Marigo et al. (2008) to the blue sequence on the CMD, we determined a distance of kpc and log(age) of for the cluster IC 361. At this distance, we estimated a respective core and cluster radii of pc and pc for this cluster. We estimated the average total-to- selective extinction value as that is low compare to the normal value. The mean proper motion of the cluster was determined using the PPMXL catalogue and found to be and in the direction of RA and DEC, respectively. The MF slope of probable stars of the cluster is found to be in the mass range . We do not have any evidence of stepper MF slope with the radial distance which suggests that the mass segregation does not take place in the cluster. The relaxation time of the cluster has found to be much lower than its age which implies that the cluster has yet dynamically relaxed.
Acknowdege
GCJ is acknowledged to ARIES, Nainital for providing observing facility duration Oct, 2012 to April 2015. GCJ is thankful to Dr. A.K. Pandey, Director, ARIES (Nainital) to permit to him to use to gathered raw data of candidate through the letter No. AO/2018/41 on date 12 April 2018. This publication made use of data products from the Two Micron All Sky Survey, which is a joint project of the University of Massachusetts and the Infrared Processing and Analysis Center/California Institute of Technology, funded by the National Aeronautics and Space Administration and the National Science Foundation. This publication is also makes use of data products from the Wide-field Infrared Survey Explorer, which is a joint project of the University of California, Los Angeles, and the Jet Propulsion Laboratory/California Institute of Technology, funded by the National Aeronautics and Space Administration.
References
- Chini & Wargue (1990) Chini R. & Wargue W. F., 1990, A&A, 227, 5
- de Grijs & Parmentier (2007) de Grijs, R., & Parmentier, G., 2007, ChJAA, 7, 155
- Dean et al. 1978 (1978) Dean J. F., Warren P. R., Cousins A. W. J., 1978, MNRAS, 183, 569
- Landolt (1992) Landolt A. U., 1992, AJ, 104, 340
- Joshi & Tyagi (2016 and references therein) Joshi, Gireesh, C. & Tyagi, R. K., 2016, MNRAS, 455, 785
- Joshi et al. (2015) Joshi, Gireeesh C., Joshi, Y. C., Joshi, S., Chowdhury, S. & Tyagi, R. K., 2015, PASA, 32, 22
- Kaluzny & Udalski (1992) Kaluzny J. & Udalski A., 1992, Acta Astron., 42, 49
- Marigo et al. (2008) Marigo P., Girdardi L., Bressan A., et al., 2008, A&A, 482, 883
- Mathieu & Lathen (1986) Mathieu R. D., Lathen D. W., 1986, AJ, 92, 1364
- Neckel & Chini (1981) Neckel T. & Chini R., 1981, A&A, 45, 451
- Piccirillo & Stein (1978) Piccirillo, J. & Stein, W. L.; 1978, AJ, 83, 931
- Phelps & Janes (1994) Phelps R. L. & Janes K. A., 1994, AJ, 90, 31
- Salpeter (1955) Salpeter, E. E., 1955, ApJ, 121, 161
- Schmidt-Kalar (1982) Schmidt-Kalar Th; 1982, In: Landolt/Bornestein, Numerical Data and functional Relationship in Science and Technology, New Series, Group VI, vol 26, Scaifers K., & Voigt H. H.(eds.) Springer-Verlog, Berlin, p.14
- Sharma et al. (2008) Sharma S., Pandey A. K., Ogura K., Aoki T., Pandey K., Sandhu T. S. & Sager R., 2008, AJ, 135, 1934
- Snedden et al. (1978) Snedden C., Gehrz R. D., Hackwell J. A., York D. G. & Snow T. P., 1978, ApJ, 223, 168
- Spitzer & Hart (1971) Spitzer, L. Jr., & Hart, M. H., 1971, ApJ, 164, 399
- Stetson (1987) Stetson P. B., 1987, PASP, 99, 191
- Whittel & van Breda (1980) Whittel D. C. B. & van Breda I. G., 1980, MNRAS, 192, 467
- Wright et al. (2010) Wright E. L., Eisenhardt P. R. M., Mainzer A. K., et al., 2010, AJ, 140, 1868
- Zdanavicius et al. (2009) Zdanavicius, J.; Boyle, R. P.; Vrba, F. J.; Zdanavicius, K. & Bartasiute, R.; 2009,Star clusters: basic galactic building blocks Proceedings IAU Symposium No. 266, 557
- Zdanavicius et al. (2010) Zdanavicius, J.; Bartasiute, R.; Boyle, R. P.; Vrba, F. J. & Zdanavicius, K.; 2010, Baltic Astronomy, 19, 63