Ongoing star formation at the outskirts of Sextans A:
Spectroscopic detection of early-O type stars.
Abstract
With both nebular- and stellar-derived abundances of 1/10 and low foreground extinction, Sextans A is a prime candidate to replace the Small Magellanic Cloud as reservoir of metal-poor massive stars and reference to study the metal-poor Universe. We report the discovery of two early-O type stars in Sextans A, the earliest O-stars with metallicity 1/7 known to date, and two additional O9 stars. Colour–excess estimates towards individual targets, enabled by spectral typing, manifest that internal reddening is neither uniform nor negligible. The four targets define a new region of star formation far from the optically-brightest centre of the galaxy and from its conspicuous H ii shells, but not devoid of neutral hydrogen. In fact, we detect a spatial correlation between OB-stars and H i in Sextans A and other dIrr’s that leads us to propose that the neutral phase may be fundamental to star formation in low-density environments. According to the existing evidence at least two of the targets formed in isolation, thus suggestive of an stochastic sampling of the initial mass function that would enable low-mass galaxies like Sextans A to form very massive stars. The discovery of these four stars provide spatially-resolved, spectroscopic confirmation of recent findings suggesting that dwarf galaxies can sustain star formation despite the low density of the gas phase.
keywords:
stars: massive – stars: early-type – galaxies: individual: Sextans A – galaxies: stellar content – galaxies: star formation1 Introduction
In a Universe of ever-growing chemical complexity local, metal-poor massive stars represent a strong link to the past. They hold the key to interpret medium to high redshift starburst galaxies, supernovae and –ray bursts, and make fundamental ingredients to simulate the evolution of galaxies. They are likely involved in the formation of stellar-size black hole binaries whose collapse we are now able to detect via gravitational waves. And finally, they set a proxy to the physics of the very massive, metal-free first stars.
The dwarf irregular galaxy Sextans A (, dIrr, aka DDO 75 McConnachie, 2012) is interesting in this context because of its very poor metal content. The abundances derived from young H ii regions range 12+log(O/H)= 7.49–7.71 (Skillman et al., 1989; Pilyugin, 2001; Kniazev et al., 2005; Magrini et al., 2005) and the stellar abundances of and Fe–group elements are similarly low ( , Kaufer et al. (2004)). Its poor metal content is also supported by the rather flat UV–continuum of OB-type stars (Garcia et al., 2017). Sextans A is hence remarkable because its population is within the grasp of 8-m telescopes (1.33 Mpc, Tammann et al., 2011) and its 1/10 metallicity is lower than all other Local Group dwarf galaxies targeted by studies of massive stars: IC 1613, WLM, NGC 3109, NGC 6822, IC 10 and the Magellanic Clouds.
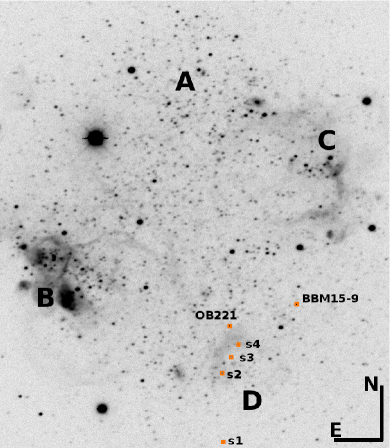
Sextans A has an intriguing squared shape with spectacular bubbles and structures of ionized hydrogen that evince the presence of hot massive stars. Ongoing star formation has been detected in the regions A, B and C marked in Fig. 1 (van Dyk et al., 1998; Dohm-Palmer et al., 2002). Region–A would be the oldest one with 400 million years (Myr), and about to exhaust the local gas content and halt star formation. Region–B overlaps with a vast mass of H i and region–C seems to follow the ridge of another over-density of H i. They have been forming stars for the past 200 Myr and 20 Myr respectively.
Our team confirmed, for the first time, the presence of blue massive stars in Sextans A with long-slit spectroscopic observations (Camacho et al., 2016). In parallel, Britavskiy et al. (2014, 2015) conducted a successful search of red supergiant (RSG) candidates from Spitzer photometry that were subsequently confimed by spectroscopy. Massive stars in both OB-type and RSG flavours were found in the three regions of star formation, and Camacho et al. (2016) reported stars as young as 4 Myr in regions–B and –C. We concluded that even though region–C may have been activated later on in galactic history, region–B had been more prolific forming stars and has sustained star formation until the present day.
This example illustrates the potential of synergies between spectroscopic surveys to unveil and characterize massive stars in star-forming galaxies, with studies of the galaxies themselves. O-stars and B-supergiants are H- and very early He-burning massive stars, younger than 30 Myr (e.g. Massey, 2013). They pinpoint star formation in both space and time and can inform current efforts to understand the nature and fuel of star formation in dwarf galaxies. On the one hand, studies based on resolved colour–magnitude diagrams and FUV knots indicate that star formation can proceed despite the low-density of the neutral-gas phase (McQuinn et al., 2012b; Hunter et al., 2016). On the other hand, an important part of the puzzle is missing because the combination of far distance and low metallicity prevents the detection of molecular gas in many of these systems. As a consequence, fundamental questions remain open such as the apparently more prominent role of H i over H2 on star formation in this regime (e.g. Holwerda et al., 2013), whether the mechanisms to form stars differ from higher density environments, and whether these would translate into a different sampling or slope of the initial mass function.
This paper presents first results of our multi-object spectroscopic programme in Sextans A, designed to produce the first large sample of resolved, sub-SMC metallicity massive stars. We focus on a group of very young O-stars that the observations unveiled at the outskirts, far from the previously considered sites of star formation. Data and reduction are described in Sect. 2. The new stars and their spectral types are discussed in Sect. 3, and the colour–magnitude diagram of the new star formation region in Sect. 4. Sect. 5 explores the implications of the detected stars in the context of the initial mass function and star formation studies. Finally, summary and conclusions are provided in Sect. 6.
2 Observations, data reduction and preliminary analysis
Data were taken as part of our guaranteed time programme GTC3-14AGOS, PI A. Herrero. The observations consisted on mask multi-object spectroscopy (MOS) with the Optical System for Imaging and low-Intermediate-Resolution Integrated Spectroscopy (OSIRIS) installed at the 10.4-m Gran Telescopio Canarias (GTC). The combination of 1.2 arcsec wide slits and the R2000B VPH granted resolution in the 4000–5500Å range, although the actual spectral coverage depends on the slit location within the mask. The programme was granted 13 hours of gray sky, 1.2 arcsec seeing conditions, broken into 1 hour long observing blocks to accumulate exposure time.
Targets were selected from their optical and = colours, and ultraviolet GALEX photometry, following the criteria described in Garcia & Herrero (2013); Camacho et al. (2016). UV sources with and –0.8 in Massey et al. (2007)’s catalogue were assigned top priority.
The data were reduced with the gtcmos iraf111 iraf is distributed by the National Optical Astronomy Observatory, operated by the Association of Universities for Research in Astronomy (AURA) under agreement with the National Science Foundation. pipeline developed by Divakara Mayya (Gómez-González et al., 2016). The script transforms the raw CCD images into mosaics, performs the bias correction and wavelength calibration. It delivered 13 sky-subtracted, wavelength calibrated 2-dimensional spectral images, one per observing block. The spectra were then extracted with our semi-automatic iraf script (Garcia & Herrero, 2013) that also performed a second sky subtraction, and set the spectra to the heliocentric standard of rest. The observations did not capture any spectroscopic binary, as no radial velocity variations were detected among the 13 individual spectra extracted for a given star. Finally, the individual contributions were coadded weighing by their signal to noise ratio (SNR), and normalized.
We assigned spectral types following classical criteria, namely the relative strength of the lines of different ionization stages of helium (He i vs He ii) and silicon (mostly Si iii vs Si iv). Luminosity class was constrained both by the width of the Balmer lines and whether He ii4686 is in absorption/emission, although we note that the latter may be affected by the low-metallicity of the targets and their weaker winds.
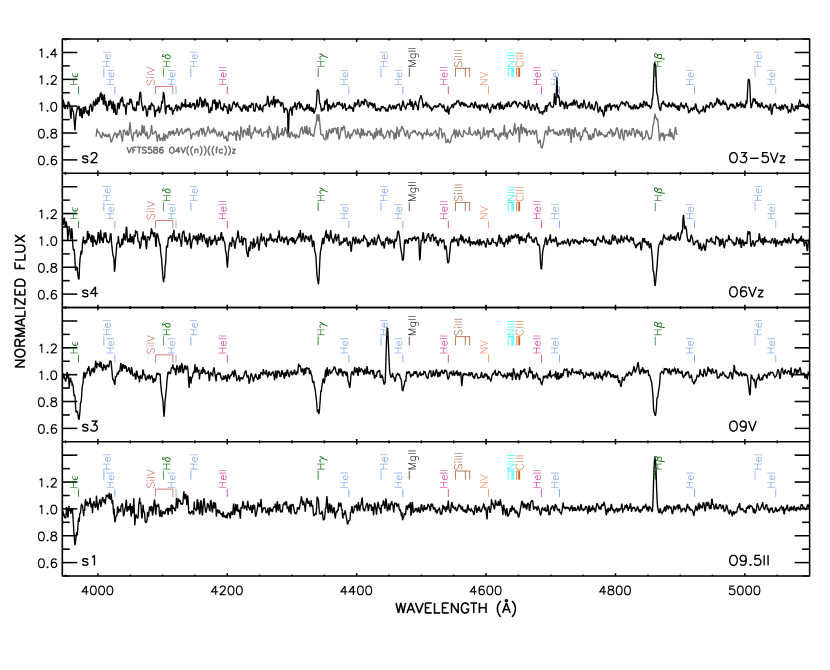
The spectra of the targets subject to this paper are shown in Fig. 2 and a detailed discussion of their classification is provided in the next Section.
3 A new region of star formation in the South: region–D
The spectral classification of the MOS observations revealed the presence of three young O-type dwarf stars and one O-type bright giant in the South of the galaxy (see Fig. 1). Two of them have the earliest, youngest, spectral types reported in Sextans A and it was striking to find them far from the seemingly more active regions B and C. None the less, three of the O–stars are located near a faint rim of ionized hydrogen, a B2.5 supergiant detected by our previous long-slit programme, OB221, and RSG number #9 from Britavskiy et al. (2015, BBM15-9). The area, that we will name region–D from now on, had been unnoticed by previous studies targeting the youngest population (e.g. Bianchi et al., 2012).
This is not surprising since region–D is more sparsely populated than regions B and C, and lacks the classical signs of active star formation: intense UV emission and complex structures. Region–D’s unconspicuous appearance could either evince a different star formation regime (Sect. 5.2) or reflect an incomplete accounting of a heavily reddened population. In fact, Herschel has detected significant amounts of dust in several locations of the galaxy, some of them close to region–D (Shi et al., 2014). Our own results indicate a non-neglible amount of patchy reddening in the area (Sect. 4).
The membership of the newly discovered region–D O–stars to the galaxy is supported by the absolute magnitudes estimated from spectral types and observed photometry. Their radial velocities are also consistent with Skillman et al. (1988)’s radial velocity curve (contrast against e.g. Fig. 3 from Camacho et al., 2016), and with the central H i velocity =324.8km/s (Ott et al., 2012). These data are listed in Table 1, together with identification tags and photometry by Massey et al. (2007).
| This work | Massey et al. (2007) | |||||||||
|---|---|---|---|---|---|---|---|---|---|---|
| ID | SpT | ID | RA(J2000.0) | DEC(J200.0) | ||||||
| s1 | O9.5 II | 362 10 | J101058.53-044414.4 | 10:10:58.53 | -04:44:14.4 | 20.877 | -0.029 | -1.071 | -0.28 | -5.53 |
| s2 | O3-5 Vz | 356 13 | J101058.59-044328.9 | 10:10:58.59 | -04:43:28.9 | 20.804 | -0.095 | -1.120 | -0.32 | -5.52 |
| s3 | O9 V | 331 9 | J101058.19-044318.4 | 10:10:58.19 | -04:43:18.4 | 20.803 | -0.247 | -1.005 | -0.31 | -5.02 |
| s4 | O6 Vz | 323 14 | J101057.89-044310.2 | 10:10:57.89 | -04:43:10.2 | 20.917 | -0.277 | -1.006 | -0.32 | -4.85 |
3.1 Comments on targets
s1 (O9.5 II): The spectrum lacks strong Balmer lines due to nebular contamination, and the most clearly detected features belong to He i. It shows He ii 4686 but no He ii 4542, and the presence of the Si iv 4089 and Si iv 4116 lines cannot be assessed because of the extremely poor SNR at 4100Å. The Si iii 4552 triplet is present but no Mg ii 4481 is observed, suggesting O9.5 type. The weak He ii 4686 absorption and the He ii 4686/He i 4713 ratio indicate luminosity class II.
s1 is the farthest sample star from the centre of the galaxy and it is located in a poorly populated region. It is puzzling that it shows strong nebular contamination considering that no extended structure is seen in imaging, hence ionization must be local and could be circumstellar. We note that it experiences enhanced reddening compared to the other sample stars (compare e.g. against s3: both have similar spectral type and V–mag20.8, but different colours and luminosity class). Both pieces of evidence are consistent with s1 located well within the H i cloud (see Sect. 5.2) which, in turn, is additional proof of its Sextans A membership. In fact, the neutral hydrogen column–density that would be inferred from s1’s colour excess =0.251 using Bohlin et al. (1978)’s relations is =, of the order of the values indicated at its location by the H i maps (Ott et al., 2012). The presence of s1 is also suggestive that star formation is ongoing in this region but is undetected because of enhanced extinction. Spitzer does detect additional sources in the surroundings of s1 but without a thorough analysis no conclusion can be drawn on their ages.
s2 (O3–O5 Vz) shows wide He ii 4542 and He ii 4686 lines, and high ionization transitions of silicon, Si iv 4089 and Si iv 4116, whereas the Si iii 4552 triplet is absent. The lack of He i 4471 suggests very early spectral type O3 but the combination of nebular contamination, clearly present on the Balmer series, and poor SNR may be preventing the detection of this line. A conservative O3–O5 spectral type is assigned. Because He ii 4542 is weaker than He ii 4686 we assigned Vz luminosity class (e.g. Sabín-Sanjulián et al., 2014).
The spectrum of s2 is reminiscent of star VFTS-586 (O4 V((n))((fc))z) from the Large Magellanic Cloud (LMC), which supports its O3–O5 Vz classification. VFTS-586’s high resolution, high SNR VLT–FLAMES spectrum shows strong He ii absorptions, but only narrow nebular emissions at the He i transitions (see e.g. Sabín-Sanjulián et al., 2017). In order to match the spectral quality of our observing run, we degraded the FLAMES data to R=1000 and SNR=40. The overall spectral morphology of VFTS-586 now resembles s2, both showing He ii 4542 and He ii 4686 as the most prominent stellar features (Fig. 2).
s3 (O9 V) shows weak spectral lines of He ii. The He ii 4542/He i 4471 ratio is compatible with spectral type O9–O9.7 and, because the Si iii 4552 triplet is not detected, O9 spectral type is assigned. The He ii 4686 absorption is more intense than He ii 4542 and He i 4713, which indicates luminosity class III–V. Since Balmer lines are broad, luminosity class V is adopted. However, we note that the absolute magnitude =–5.02 is closer to the calibrated values for O9 III stars (=–5.1) than O9 V (=–4.4).
s4 (O6 Vz): The He ii lines are strong in absorption, with He ii 4542 slightly stronger than He i 4471, indicating O6 type. The He ii 4200/He i+ii 4026 ratio is concurrent. Because He ii 4686 is stronger than He ii 4542 and He i 4471 the assigned luminosity class is Vz. The absolute magnitude is slightly under-luminous compared with the calibrated value from Milky Way stars =–5.2. However, we note that Evans et al. (submitted) have reported that massive stars in very metal-poor environments may be up to 0.5 mag fainter than Galactic analogues with the same spectral type.
Two out of the three O dwarfs reported by this paper have the Vz qualifier, in line with the trend of increased Vz/V ratios expected in metal-poorer environments. Sabín-Sanjulián et al. (2014) used an extensive grid of synthetic models to study the combination of stellar parameters that could produce the Vz morphological signature (He ii 4686 absorption stronger than both He ii 4542 and He i 4471). They concluded that weak winds are needed to reproduce the Vz characteristics at 35000 K, whereas at lower temperatures no combination of stellar parameters would produce them. The fact that the earliest O dwarfs of our sample have the qualifier Vz is consistent with this result and also suggests that the O Vz stars reflect the weak winds expected at the low-metallicity of Sextans A.
4 Colour–magnitude diagram
The colour–magnitude diagram (CMD) of Sextans A has been previously analysed in the literature to decipher the galactic star formation history (see e.g. Introduction section). We focus now on the new region of star formation defined by s1–s4, that also includes the B2.5 supergiant OB221 and the RSG BBM15-9. To guide the discussion we will use as reference region–B, that exhibits more conspicuous signs of star formation, and has been previously reported to host young stars.
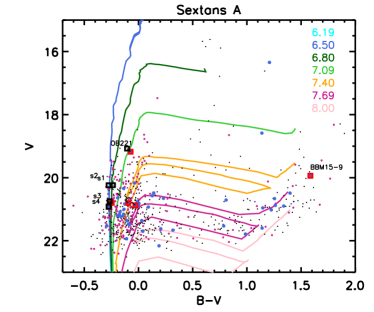
Fig. 3 shows Sextans A’s full CMD built with Massey et al. (2007)’s catalogue, with region–D stars highlighted in blue and region–B stars in violet. Most of the stars of both region–B and –D are located in Sextans A blue plume, with additional stars with intermediate colours and in the area of red giants/supergiants. Region–B hosts a comparatively larger number of blue stars that form a blue envelope to the bulk of the galaxy in the CMD. Because of the smaller number of stars in region–D, its CMD is scarcely populated and patchy. None the less, it also hosts very blue stars and once their relative numbers are taken into account, regions–B and –D roughly overlap. The spectral types of our zone–D sample stars also suggest that both regions may be similarly young.
The programme stars s1–s4 are found in the bulk of the blue plume of region–D (Fig. 3). BBM15-9 is found in the area of low-mass RSG (9), but its location is not reproduced by any of the isochrones. The discrepancy between evolutionary models and observations of RSG is a known problem of the field (e.g. Davies et al., 2013). s3 and s4 are among the bluest stars of the galaxy, but s1 and s2 are located at the red edge of the blue-plume. In sight of this diagram only OB221, and perhaps s3 and s4, would have been selected as candidate blue massive stars.
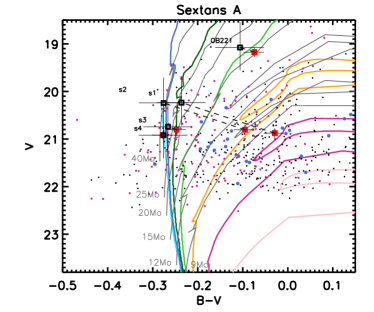
The interpretation of the CMD radically changes when reddening is calculated towards each individual line of sight. We estimated extinction ( and ) using the observed photometry and intrinsic colours calibrated for the target’s spectral type (listed in Table 1) and =3.1. The so-called spectroscopic reddening inherits the uncertainty of the spectral classification (2 spectral sub-types) and the tabulated photometry, but the degenerate colors of O-stars in the optical range minimize the intrinsic error associated to . The unknown value of , that varies with dust composition, may play a more prominent role. A close-up of the CMD is shown in Fig. 4 that now includes error bars accounting for photometric errors, uncertainty in the distance modulus, a conservative error for (=2), and =0.1 or =0.05 depending on whether foreground or spectroscopic reddening is considered.
Targets s1 and s2 experienced the largest reddening correction and are now located at the bluest extent of the blue plume. Even when the error bars are considered, the new reddening estimate results in a distinct location in the CMD. In particular, the updated locus of s2 better matches its spectral type O3–5 Vz. s1 seems to be much hotter than its assigned O9.5 II spectral type, although a misclassification seems unlikely in sight of the He ii features.
Reddening would have severely impacted the derived ages for the sample stars. We have included Lejeune & Schaerer (2001)’s isochrones for Z=0.001 stars ( 0.05) in Figs. 3 and 4. Without any further information on spectral type or reddening, the inferred age of s3 and s4 would have been =6.19–6.80 dex, and 7.40–7.69 dex for s1 and s2.
After the spectroscopic reddening correction s1 overlaps with the 6.80 dex isochrone ( 6.3 Myr), rendering a much younger age. s2, s3 and s4 align around the =6.19–6.5 dex isochrones (1.5–3.2 Myr) and it would be tempting to consider them a coeval OB-association. However, the population would subtend 25 arcsec (162 pc), one order of magnitude too loose compared to, e.g., the 17.5 pc typical sizes of associations in IC 1613 with 3 OB members (Fig.7 from Garcia et al., 2010). In sight of Fig. 3 all stars of region–D, including OB221, are younger than the 7.09dex isochrone (12.3 Myr).
The large colour excess of both s1 and s2 also evinces that internal reddening in Sextans A is significant and non-uniform, contrary to what is usually assumed for dwarf irregular galaxies. Whether this is caused by a patchy distribution of extinction working at the cluster scale, or by circumstellar structures surrounding s1 and s2, cannot be discerned with current evidence. Spitzer imaging does not reveal clear point-sources at the location of the stars, although this may be a sensitivity issue, and Herschel data lack the required spatial resolution.
Both s1 and s2 would have been missed by classical CMD cuts looking for young, massive stars (but not by colour–cuts based on the reddening-free Q parameter). The CMD analysis would have yielded masses under 12 for both stars, while evolutionary tracks assign 25 and 4015 for the unreddened locii of s1 and s2, taking into account the error bars (Fig. 4). Likewise, the width of region–D’s blue plume could be caused by extinction rather than differences in stellar masses or ages, rendering the mass of this population heavily underestimated if internal reddening is neglected. Integral field spectroscopy covering completely region–D would at the same time provide stellar masses of all the stars in the region, and a measure of extinction towards their line of sight.
5 Discussion
With ages 10 Myr, the stars reported in this paper provide both spatially and temporally resolved information on Sextans A’s present day star formation. In this section we explore what can be learnt from the location and ages of the stars.
5.1 Are s1–s4 isolated massive stars? Implications on the initial mass function
How massive stars form is a long-standing debate with two main scenarios: competitive accretion, in which massive stars are formed in the same gravitational well of the whole cluster (e.g. Bonnell et al., 1997) and possibly leading to mergers (Sana et al., 2012), and monolithic collapse, in which one single star is formed from the collapse of one single cloud (e.g. Krumholz et al., 2009). The occurrence of massive stars in isolation is a natural consequence of the latter, and some examples have been reported in the SMC (Lamb et al., 2010) and in the nearby starburst 30 Doradus (Bressert et al., 2012).
Besides the lack of nearby stars, Bressert et al. (2012) set a number of conditions for the stars to be considered isolated, including, constraints to minimize the chances that the stars are runaway or binaries, and the presence of gaseous filaments that could host star formation and minimize the incidence of runaways in the plane of the sky. The lack of a host cluster or OB-association was enforced in a length-scale of 5 pc, since the gravitational perturbation of star formation at longer distances would be negligible to the forming star.
Lacking multi-epoch observations and high-resolution spectroscopy the possibility that s1–s4 are binaries or runaway stars cannot be fully discarded, but their radial velocities are consistent with the -curve of the galaxy (Skillman et al., 1988; Camacho et al., 2016) reducing that possibility. We note that the stars are too faint as to have reliable proper motions registered in GAIA-DR2. Likewise, at the distance of Sextans A it is not possible to identify local filaments of gas although there is a reservoir of neutral hydrogen at their location (see next Section) and a faint H ii structure encloses s2, s3 and s4.
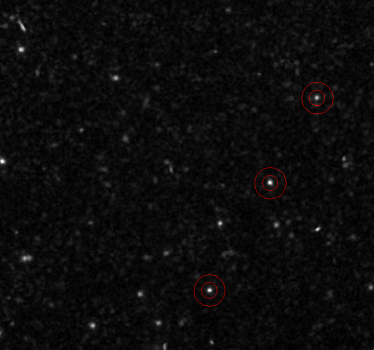
Nevertheless, we can check whether the stars are spatially isolated or are part of a cluster of fainter stars. We first checked their coordinates against Bellazzini et al. (2014)’s list of compact clusters in Sextans A. We then examined the archive of the Hubble Space Telescope (HST), looking for observations that would cover them. Fig. 5 shows a WFPC2-F555W image with s2–s4 enclosed in a r=5 pc (0.77 arcsec) circle each to look for a host population, and circumscribed by a r=10 pc (1.54 arcsec) circle as a control field. At the depth of the HST observations, none of the stars has a similarly bright nearby source within r=5 pc. There are very faint nearby stars, but none of the them bright enough to be registered even in Bellazzini et al. (2014)’s deep photometric catalogue. No sources are detected near OB221, and BBM15-9 seems to have a faint, very near target at the North. s1 is at the outskirts of the galaxy and has not been covered by any HST observations. It looks isolated in the ground-based optical and IR images, but both lack spatial resolution to provide meaningful information for this discussion.
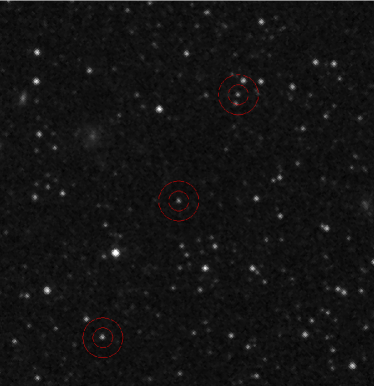
We argue in Sects. 3 and 5.2 that at least 2 of the sample stars are embedded in neutral hydrogen, and that internal reddening is significant in Sextans A, hence it is plausible that the lack of detection of additional stars could be caused by extinction. Spitzer imaging does not reveal a significant dust-enshrouded population in the area although this could be a matter of sensitivity. Finally, we examined HST near-IR observations taken with WFC3-F127M (Boyer et al., 2017). In this image there is evidence of a small size cluster around OB221 and there is no detection of the star close to BBM15-9, which otherwise seems isolated. s2–s4 are shown in Fig. 6: there are two IR sources near s4 but no embedded cluster is detected near the target stars and, most importantly, s3 and the very early s2 are isolated.
Following Lamb et al. (2010) and Bressert et al. (2012), we used the relation between the mass of the cluster and the highest stellar mass from Weidner et al. (2010, 2013) to estimate the size that a hypothetical cluster hosting s2 (the most massive star of the sample) would have. Martins et al. (2005)’s calibration assigns 47 to its spectral type O3–5 Vz. According to Weidner et al. (2013)’s analytical relation the host cluster should have a total mass of 3900 and it should have been detected (e.g. compare against the typical sizes of OB-associations in IC 1613, Garcia et al., 2010). If instead we used the lower-limit we derived for s2 mass from the CMD analysis (Sect. 4), the host cluster would be much smaller (725) but still detectable.
We considered the final possibility that s2 was the product of a stellar merger within a cluster that then would become an outlier from the relation (Oh & Kroupa, 2018). In the most favourable case, this would require 2 stars of 23 each (), for which a cluster of at least 600 is needed. Such a cluster should have also been detected. Morever, the occurrence of the merger is very unlikely if we consider that only 8 per cent of the clusters simulated by Oh & Kroupa (2018) are capable of producing stars with mass via this mechanism.
Current evidence thus indicates that at least s2, s3 and perhaps BBM15-9 have formed in isolation and suggests that monolithic collapse is at work. In this scenario, star formation does not need to meet the relation and the initial mass function (IMF) can be populated randomly (see discussion by Bressert et al., 2012). The stochastic sampling of the IMF has already been proposed to explain that the linear correlation between star formation rate (SFR) measured from the UV and breaks down in low-mass, low-density galaxies similar to Sextans A (Teich et al., 2016).
If low-mass environments can stochastically populate the initial mass function, then we could find very massive stars in Sextans A and other metal-poor, non-starbursty dwarf irregular galaxies of the Local Group. Spectroscopically confirmed massive stars have the advantage of providing precise masses to build the IMF. A systematic spectroscopic search of massive stars, targeting galaxies of decreasing metallicity and varying gas masses could shed important light on to the gas fragmentation properties and the IMF sampling of these systems.
5.2 The mechanisms driving star formation in dwarf galaxies
The fact that the earliest O-stars reported to date in Sextans A have been found in the outskirts of the galaxy, far from its giant H ii shells and without a supporting cluster, was unexpected. This section discusses whether it is extraordinary that Sextans A sustains star formation in the outer regions and what mechanisms could be driving it.
The first radio observations of Sextans A showed that the main stellar body is enclosed within an H i cavity, with the youngest regions–B and –C located just at the cavity rim or its inner edge. van Dyk et al. (1998) proposed that 50 Myr ago star formation began at the centre of the galaxy and the cavity was produced by the ensuing supernova explosions which in turn would induce new star formation at the shocked outer boundary. Dohm-Palmer et al. (2002) found older stars in the H i rim, hence arguing against the outwards propagation of star formation, but proposed that star formation was confined in the cavity edge.
Higher sensitivity VLA data (Hunter et al., 2012; Ott et al., 2012) showed that the central part of the galaxy is not totally devoid of gas (), and that H i rotates as a solid body with no clear signature of inside–out motion (Ott et al., 2012; Bellazzini et al., 2014). These observations not only refute the multiple SNe scenario but also open the possibility of star formation occurring at additional sites other than the over-densities that delimited the alleged cavity.
Unfortunately, star formation cannot be traced through molecular gas in Sextans A and most of the sub-SMC metallicity dwarf galaxies of the Local Group. They are too far to provide a direct measurement of the weak signature of cold H2, and their low metallicity prevents using the CO molecule as a proxy. The situation may improve with ALMA, but at the moment there is only a marginal detection of CO in Sextans A with IRAM (Shi et al., 2015). A tantalizing alternative is that star formation could proceed directly from H i as it has been shown possible at extremely low-metallicities from a theoretical perspective (Krumholz, 2012). This mechanism has also been proposed to explain that a fraction of 0.12 GRBs are hosted by low-metallicity, H i-rich but H2-deficient dwarf galaxies: the galaxy would accrete pristine, cold neutral gas that could directly feed star formation (Michałowski et al., 2015).
Whether acting as fuel or as proxy of molecular gas, neutral hydrogen seems a good tracer of star formation in low-density galaxies. We are finding that the location of massive stars and H i is always related. In IC 1613, as in Sextans A, O-stars and OB-associations are either found overlapping the highest concentrations of H i, or on the ridges of H i clouds (Garcia et al., 2010). A similar link has also been found by H i surveys on a significant fraction of star-forming dwarf galaxies (e.g. Teich et al., 2016; Hunter et al., 2018) and Holwerda et al. (2013) proposed that H i is the dominant phase that regulates star formation in these systems.
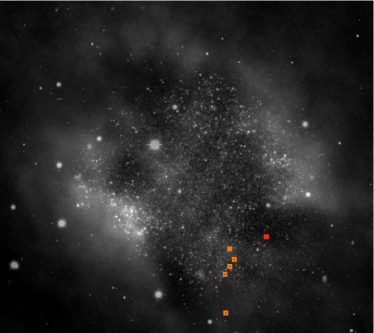
Our sample stars are located in a region that contains H i (see Fig. 7). The column density is low (Ott et al., 2012) but close to Skillman (1987)’s threshold for star formation, and of the order of the specific value for low-density regions of metal-poor dIrr galaxies proposed by Hunter et al. (2016, 1/) . The detection of the O–stars s1–s4 proves that Sextans A is forming stars in a region with a very low concentration of gas, and provides spectroscopic confirmation to similar findings in the dwarf galaxies targeted by the LITTLE THINGS and SHIELD H i surveys (Hunter et al., 2016; Teich et al., 2016).
McQuinn et al. (2012b) found that star formation does not seem spatially concentrated in dwarf galaxies and that the degree of concentration does not correlate with the peak SFR. In this context it is plausible that different mechanisms of star formation work incoherently at a number of galactic locations, including the low gas density areas. In particular, we suggest that star formation in Sextans A is not driven by molecular cloud collapse or SNe collect and collapse only. These mechanisms could be at work in regions–B and –C, where the H ii shells hint wind or SN expansion (Fig. 1) and localized intense Far-IR emission evinces dust and high concentrations of molecular gas (Shi et al., 2014).
At low density H i reservoirs like region–D, or at the ridges of H i distributions, we propose that internal instabilities or turbulence will break down the neutral gas clouds and proceed directly to star formation bypassing the molecular gas phase (Krumholz, 2012). This scenario would be favoured by an irregular or clumpy H i geometry, which is indeed detected in the automatic morphological study of the LITTLE THINGS and VLA–ANGST sample by Holwerda et al. (2013).
A similar star formation mechanism could also act at the outskirts of extended UV–disc galaxies, a class defined by GALEX FUV emission beyond that signals star formation in the extremely low-density outer disc (Gil de Paz et al., 2005; Thilker et al., 2005). In fact, the location of s1 at (=2.9 arcmin, McConnachie, 2012) and other more remote UV sources make Sextans A reminiscent of this type of galaxies. Similarly to what we have detected in Sextans A, extended UV–disc galaxies are embedded in large H i reservoirs, and IR observations do not reveal an underlying population of low mass or old stars at the sites of the FUV complexes (see review by Bouquin, 2018).
Finally, an interesting follow-up question is whether star formation at different gas density environments populates the IMF distinctly, or impingnes a different slope. We will be able to provide some information on this point once our spectroscopic survey in Sextans A is complete.
6 Summary and concluding remarks
This paper reports the spectroscopic confirmation of massive stars at the outskirts of Sextans A. s2 and s4 are the earliest, most massive, resolved stars confirmed by spectroscopy in a galaxy with metal content 1/10. Massive stars have been found in the metal-poorer galaxies SagDIG (Garcia, 2018) and Leo P (Evans et al., submitted), but their comparatively poor data quality prevented fine spectral typing resulting in poorly constrained masses and ages. Our sample of stars in Sextans A is of interest to the community of massive stars, as new subjects to confront observations with the theoretical predictions of stellar evolution and wind physics in the metal-poor regime (Kudritzki, 2002; Szécsi et al., 2015).
s1–s4 are only few million year old, thus demonstrating that star formation is ongoing in a region of comparatively decreased stellar and gas density ( vs the galactic maximum =, Ott et al., 2012). However, no direct or indirect signature of molecular gas has been detected in the area (Shi et al., 2014, 2015). Together with the spatial correlation we are finding between H i and OB-stars in dwarf irregular galaxies, this suggests that the neutral phase may be playing a fundamental role in the process of star formation in low-density environments.
Considering the evidence at hand, two programme stars are isolated and at least one of them lacks the required supporting cluster to fully construct the IMF up to its 47. Similar isolated massive stars have been found in the Magellanic Clouds (Lamb et al., 2010; Bressert et al., 2012). Our results proof that low-mass dwarf galaxies can not only sustain star formation but also form very massive stars and, pending deeper IR observations, they may do so through stochastic sampling of the IMF. Whether this episode of star formation is inherent to the galaxy (McQuinn et al., 2015) or environment-induced (Dohm-Palmer et al., 2002; Bellazzini et al., 2014) is left for future work.
This work puts forward new synergies between the communities studying massive stars and dwarf galaxies. Direct spectroscopic observations of massive stars, now at reach in nearby (out to 1.4 Mpc) dwarf galaxies with 8–10-m telescopes, provide ideal means to study the mechanisms of star formation in these systems. The joint study of complete, spectroscopic censuses of resolved massive stars, together with detailed maps of neutral and molecular gas, will help to establish the connection of star formation and H i, unravel the relative role played by molecular and neutral gas, the mechanisms triggering star formation, whether different mechanisms are at work in different sites of the galaxy, and whether each of them can populate the IMF distinctly. At the same time the censuses will enlarge the scarcely populated list of confirmed massive stars with metallicity 1/10 or poorer.
The spectroscopic census should be unbiased and complete for two reasons. Firstly, this paper has demonstrated that massive stars can occur far from the smoking-gun diagnostics of star formation: ionized gas shells, intense UV emission and intense Far-IR dust emission. McQuinn et al. (2012b) arrived at a similar conclusion after studying the galaxy-wide star formation histories of 20 starburst dwarf galaxies. Secondly, we have also shown that internal extinction is significant and uneven in Sextans A, similarly to IC 1613 (Garcia et al., 2009) and SagDIG (Garcia, 2018). The ensuing variable reddening severely hampers the pre-identification of blue massive stars from classical colour–cuts in the CMD. In this respect, we would like to remark that an unknown amount of massive stars may be missing when galactic mass is calculated from photometry, and/or their masses underestimated because of reddening. As a consequence, the total galactic stellar mass may be substantially underestimated with implications on the computation of the barionic to dark matter ratios.
Our team is already embarked on a vast observational effort to expose and study the population of massive stars in Sextans A using the multi-object spectrographs at the 10-m Gran Telescopio Canarias. However, the project would greatly benefit from a wide-field integral-field spectrometer that could comb the whole galaxy, thus avoiding selection biases, while providing medium resolution spectroscopy at 4000–5000Å to constrain stellar properties. In this respect, Sextans A is an ideal target for BlueMUSE, an analogue of the powerful VLT–MUSE instrument with blue spectral coverage, currently at concept stage (Bacon et al. 2018, BlueMUSE Science Case, Proposal submitted to ESO).
7 Acknowledgements
We would like to thank support from MINECO by means of grants ESP2015-65597-C4-1-R, ESP2017-86582-C4-1-R, AYA2015-68012-C2-1 and SEV2015-0548, and from the Gobierno de Canarias under project ProID2017010115.
This paper is based on observations made with the Gran Telescopio Canarias (programme ID GTC3-14AGOS) installed in the Spanish Observatorio del Roque de los Muchachos of the Instituto de Astrofísica de Canarias, on the island of La Palma. The work has made use of the gtcmos pipeline for the reduction of the GTC–OSIRIS spectroscopic data for which we thank its author Divakara Mayya. NASA’s Astrophysics Data System, the SIMBAD database (Wenger et al., 2000), and the Aladin Sky Atlas (Bonnarel et al., 2000; Boch & Fernique, 2014) were also extensively used. P. Massey and his team are warmly thanked for publicly sharing their photometric observations and data of Local Group galaxies. Finally, we would like to thank our anonymous referee for very constructive comments and suggestions.
References
- Bellazzini et al. (2014) Bellazzini, M., Beccari, G., Fraternali, F., et al. 2014, A&A, 566, A44
- Bianchi et al. (2012) Bianchi, L., Efremova, B., Hodge, P., Massey, P., & Olsen, K. A. G. 2012, AJ, 143, 74
- Boch & Fernique (2014) Boch, T., & Fernique, P. 2014, Astronomical Data Analysis Software and Systems XXIII, 485, 277
- Bohlin et al. (1978) Bohlin, R. C., Savage, B. D., & Drake, J. F. 1978, ApJ, 224, 132
- Bonnarel et al. (2000) Bonnarel, F., Fernique, P., Bienaymé, O., et al. 2000, A&AS, 143, 33
- Bonnell et al. (1997) Bonnell, I. A., Bate, M. R., Clarke, C. J., & Pringle, J. E. 1997, MNRAS, 285, 201
- Bouquin (2018) Bouquin, A. 2018, PhD dissertation. Universidad Complutense de Madrid
- Boyer et al. (2017) Boyer, M. L., McQuinn, K. B. W., Groenewegen, M. A. T., et al. 2017, ApJ, 851, 152
- Bressert et al. (2012) Bressert, E., Bastian, N., Evans, C. J., et al. 2012, A&A, 542, A49
- Britavskiy et al. (2014) Britavskiy, N. E., Bonanos, A. Z., Mehner, A., et al. 2014, A&A, 562, A75
- Britavskiy et al. (2015) Britavskiy, N. E., Bonanos, A. Z., Mehner, A., Boyer, M. L., & McQuinn, K. B. W. 2015, A&A, 584, A33
- Camacho et al. (2016) Camacho, I., Garcia, M., Herrero, A., & Simón-Díaz, S. 2016, A&A, 585, A82
- Dalcanton et al. (2009) Dalcanton, J. J., Williams, B. F., Seth, A. C., et al. 2009, ApJS, 183, 67
- Davies et al. (2013) Davies, B., Kudritzki, R.-P., Plez, B., et al. 2013, ApJ, 767, 3
- Dohm-Palmer et al. (2002) Dohm-Palmer, R. C., Skillman, E. D., Mateo, M., et al. 2002, AJ, 123, 813
- Evans et al. (2011) Evans, C. J., Taylor, W. D., Hénault-Brunet, V., et al. 2011, A&A, 530, A108
- Garcia (2018) Garcia, M. 2018, MNRAS, 474, L66
- Garcia & Herrero (2013) Garcia, M., & Herrero, A. 2013, A&A, 551, A74
- Garcia et al. (2009) Garcia, M., Herrero, A., Vicente, B., et al. 2009, A&A, 502, 1015
- Garcia et al. (2010) Garcia, M., Herrero, A., Castro, N., Corral, L., & Rosenberg, A. 2010, A&A, 523, A23
- Garcia et al. (2017) Garcia, M., Herrero, A., Najarro, F., et al. 2017, The Lives and Death-Throes of Massive Stars, 329, 313
- Gil de Paz et al. (2005) Gil de Paz, A., Madore, B. F., Boissier, S., et al. 2005, ApJ, 627, L29
- Gómez-González et al. (2016) Gómez-González, V. M. A., Mayya, Y. D., & Rosa-González, D. 2016, MNRAS, 460, 1555
- Holwerda et al. (2013) Holwerda, B. W., Pirzkal, N., de Blok, W. J. G., & Blyth, S.-L. 2013, MNRAS, 435, 1020
- Hunter et al. (2012) Hunter, D. A., Ficut-Vicas, D., Ashley, T., et al. 2012, AJ, 144, 134
- Hunter et al. (2016) Hunter, D. A., Elmegreen, B. G., & Gehret, E. 2016, AJ, 151, 136
- Hunter et al. (2018) Hunter, D. A., Adamo, A., Elmegreen, B. G., et al. 2018, AJ, 156, 21
- Jones et al. (2018) Jones, O. C., Maclay, M. T., Boyer, M. L., et al. 2018, ApJ, 854, 117
- Kaufer et al. (2004) Kaufer, A., Venn, K. A., Tolstoy, E., Pinte, C., & Kudritzki, R.-P. 2004, AJ, 127, 2723
- Kniazev et al. (2005) Kniazev, A. Y., Grebel, E. K., Pustilnik, S. A., Pramskij, A. G., & Zucker, D. B. 2005, AJ, 130, 1558
- Krumholz (2012) Krumholz, M. R. 2012, ApJ, 759, 9
- Krumholz et al. (2009) Krumholz, M. R., Klein, R. I., McKee, C. F., Offner, S. S. R., & Cunningham, A. J. 2009, Science, 323, 754
- Kudritzki (2002) Kudritzki, R. P. 2002, ApJ, 577, 389
- Lamb et al. (2010) Lamb, J. B., Oey, M. S., Werk, J. K., & Ingleby, L. D. 2010, ApJ, 725, 1886
- Lejeune & Schaerer (2001) Lejeune, T., & Schaerer, D. 2001, A&A, 366, 538
- Lozinskaya et al. (2003) Lozinskaya, T. A., Moiseev, A. V., & Podorvanyuk, N. Y. 2003, Astronomy Letters, 29, 77
- Magrini et al. (2005) Magrini, L., Leisy, P., Corradi, R. L. M., et al. 2005, A&A, 443, 115
- Martins et al. (2005) Martins, F., Schaerer, D., & Hillier, D. J. 2005, A&A, 436, 1049
- Massey (1998) Massey, P. 1998, Stellar astrophysics for the local group: VIII Canary Islands Winter School of Astrophysics, 95
- Massey (2013) Massey, P. 2013, New Astron. Rev., 57, 14
- Massey et al. (2007) Massey, P., Olsen, K. A. G., Hodge, P. W., et al. 2007, AJ, 133, 2393
- McConnachie (2012) McConnachie, A. W. 2012, AJ, 144, 4
- McQuinn et al. (2012b) McQuinn, K. B. W., Skillman, E. D., Dalcanton, J. J., et al. 2012, ApJ, 759, 77
- McQuinn et al. (2015) McQuinn, K. B. W., Cannon, J. M., Dolphin, A. E., et al. 2015, ApJ, 802, 66
- Michałowski et al. (2015) Michałowski, M. J., Gentile, G., Hjorth, J., et al. 2015, A&A, 582, A78
- Oh & Kroupa (2018) Oh, S., & Kroupa, P. 2018, MNRAS, 481, 153
- Ott et al. (2012) Ott, J., Stilp, A. M., Warren, S. R., et al. 2012, AJ, 144, 123
- Pilyugin (2001) Pilyugin, L. S. 2001, A&A, 374, 412
- Sabín-Sanjulián et al. (2014) Sabín-Sanjulián, C., Simón-Díaz, S., Herrero, A., et al. 2014, A&A, 564, A39
- Sabín-Sanjulián et al. (2017) Sabín-Sanjulián, C., Simón-Díaz, S., Herrero, A., et al. 2017, A&A, 601, A79
- Sana et al. (2012) Sana, H., de Mink, S. E., de Koter, A., et al. 2012, Science, 337, 444
- Shi et al. (2014) Shi, Y., Armus, L., Helou, G., et al. 2014, Nature, 514, 335
- Shi et al. (2015) Shi, Y., Wang, J., Zhang, Z.-Y., et al. 2015, ApJ, 804, L11
- Skillman (1987) Skillman, E. D. 1987, NASA Conference Publication, 2466,263
- Skillman et al. (1988) Skillman, E. D., Terlevich, R., Teuben, P. J., & van Woerden, H. 1988, A&A, 198, 33
- Skillman et al. (1989) Skillman, E. D., Kennicutt, R. C., & Hodge, P. W. 1989, ApJ, 347, 875
- Szécsi et al. (2015) Szécsi, D., Langer, N., Yoon, S.-C., et al. 2015, A&A, 581, A15
- Tammann et al. (2011) Tammann, G. A., Reindl, B., & Sandage, A. 2011, A&A, 531, A134
- Teich et al. (2016) Teich, Y. G., McNichols, A. T., Nims, E., et al. 2016, ApJ, 832, 85
- Thilker et al. (2005) Thilker, D. A., Bianchi, L., Boissier, S., et al. 2005, ApJ, 619, L79
- van Dyk et al. (1998) van Dyk, S. D., Puche, D., & Wong, T. 1998, AJ, 116, 2341
- Weidner et al. (2010) Weidner, C., Kroupa, P., & Bonnell, I. A. D. 2010, MNRAS, 401, 275
- Weidner et al. (2013) Weidner, C., Kroupa, P., & Pflamm-Altenburg, J. 2013, MNRAS, 434, 84
- Wenger et al. (2000) Wenger, M., Ochsenbein, F., Egret, D., et al. 2000, A&AS, 143, 9