A possible relic star cluster in the Sextans dwarf galaxy111Based on data collected at the Subaru Telescope, which is operated by the National Astronomical Observatory of Japan.
Abstract
We report a possible discovery of a relic star cluster in the Sextans dwarf spheroidal galaxy. Using the hk index ( () ()) as a photometric metallicity indicator, we discriminate the metal-poor and metal-rich stars in the galaxy and find unexpected number density excess of metal-poor stars located 7.7 ( 190 pc in projected distance) away from the known galactic center. The colormagnitude diagram (CMD) for stars around the density excess reveals that both the main sequence and the giant branch are considerably narrower and redder than the bulk of field stars in Sextans. Our stellar population models show (a) that the narrow CMD is best reproduced by a simple stellar population with an age of 13 Gyr and [Fe/H] of 2.3 dex, and (b) that the redder color of the -weak population is explained if it is 2 Gyr older than the field stars. The results lead us to conclude that the off-centered density peak is likely associated with an old, metal-poor globular cluster. The larger spatial extent ( 80 pc in radius) and the smaller number of stars ( 1000) than typical globular clusters point to a star cluster that is in the process of dissolution. The finding serves as the first detection of a surviving star cluster in Sextans, supporting previous suggestions of the presence of star cluster remnants in the galaxy. If confirmed, the survival of a relic star cluster until now implies a dark matter halo profile for this dwarf galaxy.
2019 January 3
1 Introduction
In the cold dark matter paradigm, giant galaxies grow by repeated mergers of smaller systems. Dwarf galaxies, the most common type of galaxies in the universe, are probably the closest approximation to the building blocks of larger galaxies. In particular, dwarf spheroidal (dSph) galaxies around the Milky Way provide important clues to understand formation and evolution of galaxies, because their proximity enables us to spatially resolve the galaxies into individual stars.
The Sextans dSph at a distance of 86 kpc is one of the recently discovered satellite galaxies of the Milky Way (Irwin et al., 1990) with a very low surface brightness ( = 28.17 mag arcsec-2; Muñoz et al. 2018) and unusually large extent on the sky ( = 16.9; Muñoz et al. 2018). Previous studies have suggested that it possesses kinematic substructure in the central region. Kleyna et al. (2004) suggested the presence of a kinematically cold core in the inner five arcmin of the galaxy. Walker et al. (2006), however, did not confirm the presence of such a core but instead detected another kinematically cold substructure north of the center at the core radius. Battaglia et al. (2011) detected similar cold kinematic substructure composed of metal-poor stars presumably belonging to a star cluster. Karlsson et al. (2012) argued that the chemical properties of the six most metal-poor stars observed by Aoki et al. (2009) indicate the presence of a dissolved star cluster within this galaxy. Roderick et al. (2016) found an overdense region near the galaxy center as well as an extended halolike stellar substructure in the outskirts of Sextans. Cicuéndez & Battaglia (2018) detected shell-like stellar overdensity in the spatial distribution of red stars in . They also found a ringlike kinematic substructure suggesting a past accretion event.
The survival of stellar clusters in dwarf galaxies provides an important constraint on the well-known corecusp problem of the inner dark matter (DM) halo profiles (for a review, see de Blok, 2010). Kleyna et al. (2003) argued that the two stellar clumps discovered in the Ursa Minor dSph (Olszewski & Aaronson, 1985; Irwin & Hatzidimitriou, 1995; Bellazzini et al., 2002; Palma et al., 2003) in conjunction with a kinematically cold signature are not compatible with a cuspy DM halo but are consistent with a cored DM halo. Lora et al. (2013) showed using -body simulations that a stellar clump such as a star cluster in Sextans can last for a Hubble time preferably in a cored DM halo rather than in a cuspy Navarro-Frenk-White (Navarro et al., 1996, 1997) DM halo.
In this Letter, we investigate the chemostructural properties of stellar populations in Sextans using a photometric metallicity indicator, the hk index. We discover a spatial overdensity of metal-poor stars slightly away from the center of the galaxy. By comparing the stellar population models with the observations, we suggest that the overdensity is associated with an old, metal-poor globular cluster in the process of dissolution. We discuss the implications of our results for the shape of DM halo profiles.
2 Observations and Data reduction
We observed the Sextans dSph galaxy with Suprime-Cam on SUBARU 8.2 m telescope through -, -, and -band filters. We also reanalyzed - and -band archival data (Okamoto et al., 2017). The standard data reduction procedures were performed with the SDFRED/SDFRED2 packages (Yagi et al., 2002; Ouchi et al., 2004), and the photometry was carried out with the DAOPHOT II/ALLFRAME packages (Stetson, 1987, 1994). Galactic reddening was corrected with the IRAS dust map (Schlafly & Finkbeiner, 2011), and astrometry was done with respect to the USNO-B 1.0 catalog (Monet et al., 2003). Photometric calibration for , , and bands was performed using the M5 and M15 globular clusters, and - and -band photometry was calibrated against the standard star catalog provided by Stetson (2000). Details of data reduction and photometry are described in S.-I. Han et al. (2019, in preparation) that present the detailed chemostructural study on the Draco, Sextans, and Canes Venatici I dSph galaxies.
3 Analysis and Results
3.1 The hk index as a photometric metallicity indicator
The hk index, defined as () (), is a photometric metallicity indicator using the filter centered on the ionized calcium and lines, combined with the strömgren - and -photometric system. The index was first developed by Anthony-Twarog et al. (1991) by replacing the filter with the filter from the strömgren index to overcome the low sensitivity of the index for metal-poor dwarfs and giants. The calcium and lines remain strong even at very low stellar metallicity for which other metal lines are quite weak. Hence, the hk index is an optimal photometric metallicity indicator for individual stars in dSph galaxies that are normally of low metallicities.
3.2 Member star selection
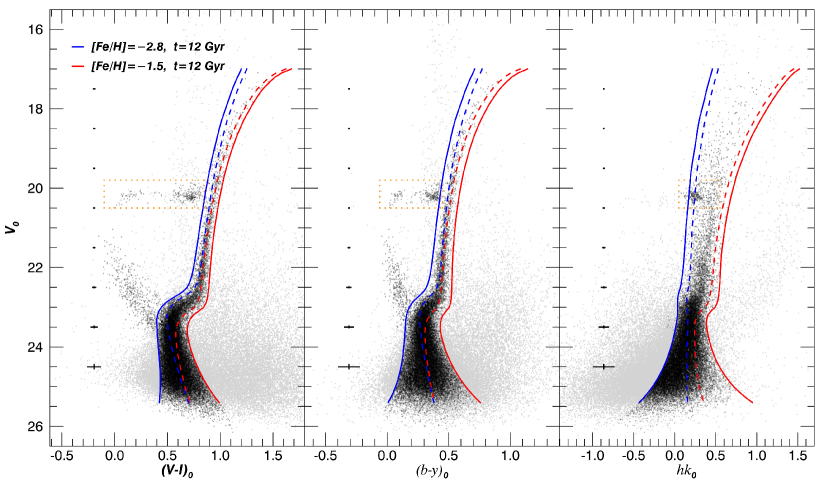
Figure 1 shows the colormagnitude diagrams (CMDs) of point sources in the area of Sextans. We select point sources using the ALLFRAME parameters CHI and SHARPNESS and apply an error cut of 0.2 mag in all bands. Among the sources (gray dots), we select candidate member stars (black dots) using theoretical isochrone lines for main-sequence (MS) to red-giant-branch (RGB) stars. The blue and red dashed lines are the YonseiYale (Y2) isochrones (Yi et al., 2008) of 12 Gyr for [Fe/H] = 2.8 and 1.5, respectively.222We use the synthetic model atmospheres of Castelli & Kurucz (2003) for the , , and filters (see Section 2.1 in Joo & Lee 2013). The metallicity range of the isochrones is determined considering the spectroscopic metallicity distributions of RGB stars by Kirby et al. (2010). We modify the isochrones (solid lines) taking into account the observational uncertainties in order not to miss stars with relatively large errors. We select the sources located between the two modified loci in all three CMDs as the member stars of Sextans. The horizontal-branch (HB) stars are selected within the regions denoted by orange dotted line boxes in all three CMDs. Note that we exploit the MS, sub-giant-branch (SGB), RGB, and HB stars in our analysis (see Section 3.5), but we do not use variable stars (e.g., RR Lyrae variable) and blue-straggler (BS) stars.
The use of three colors (i.e., , , and hk) at the same time in the selection of members significantly reduces contamination by the foreground stars and background galaxies. In particular, using the hk index efficiently reduces the contamination by foreground stars. The RGB stars in the hk CMD are detached from the Galactic disk stars that show a strong hk index (i.e., metal-rich), while they are indistinguishable in optical CMDs. The faint member stars ( 24.0 mag) are marginally separated from the background galaxies, which have relatively redder colors in and , but have weaker hk indices.
3.3 Dividing stars into two metallicity groups
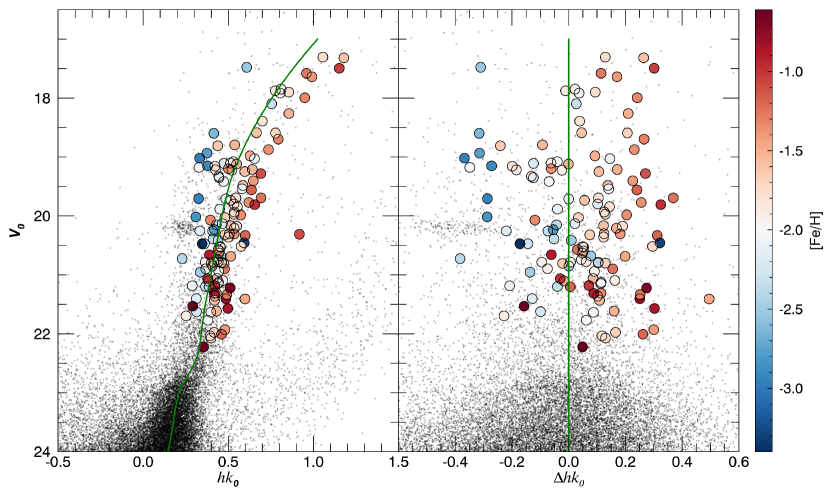
Figure 2 shows the hk (left) and verticalized hk (right) CMDs along with a spectroscopic sample from Kirby et al. (2010). The cross-matched objects are color-coded by the spectroscopic metallicities shown as the color bar. The green solid line in the left panel represents the fiducial line to the MS-to-RGB stars obtained by LOESS regression, a nonparametric locally weighted regression (Cleveland, 1994). The hk in the right panel is defined as
| (1) |
where the width is the hk difference at the same magnitude of a star between the two modified isochrones used in the member selection. This figure verifies that the hk index is a good metallicity discriminator.
We divide the MS, SGB, and RGB stars into metal-poor and metal-rich groups at hk = 0. For the MS stars, we use the upper part ( 24.0 mag) only because the two groups are mixed in lower MS due to the observational errors.
3.4 Spatial distributions
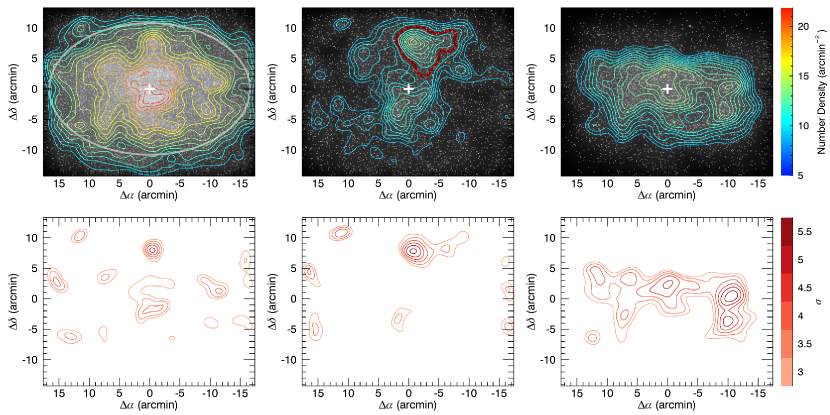
Figure 3 (upper row) shows the spatial distributions of all member stars (left), metal-poor stars (center), and metal-rich stars (right) in Sextans. We construct a surface density map for each group shown as a grayscale image and a set of contours using the two-dimensional kernel density estimation (KDE) technique (Silverman, 1986; Gouliermis et al., 2014; Seleznev, 2016) implemented in the statistical package R333https://www.r-project.org. The KDE technique is a nonparametric density estimation method, which smoothes points using a kernel function to infer the underlying probability density distribution of the data. We use the bivariate normal kernel with the bandwidth estimated by the method of Sheather & Jones (1991).
Comparing the distributions of the two groups shows that the metal-rich stars (upper right) are more centrally concentrated, with an elongation along the major axis of the galaxy. Overdense regions are visible on the both sides of the densest region, which seems consistent with the ’shell-like’ feature reported by Cicuéndez & Battaglia (2018). On the other hand, the metal-poor stars (upper middle) are relatively dispersed, with an elongation rather perpendicular to the major axis direction.
Remarkably, we find an unexpected feature in the spatial distribution of metal-poor stars (a thick red contour in the upper central panel). Besides a peak at the galaxy center, there is another peak at 7.7 arcmin ( 190 pc) northwest from the center. The off-center peak is quite separated from the galactic central density peak. The strong concentration of the off-center peak with a roundish shape may point to gravitational boundness. The number density at the off-center peak is even higher than the galactic central peak among the metal-poor stars. We stress that the off-center peak is only prominent among the metal-poor stars, and when considering the entire populations (upper left), the peak is less conspicuous. This may be the reason why the structure has not been discovered so far.
Figure 3 (lower row) shows the statistical significance contours of the number excess for each group. To quantify the significance of the off-center peak of metal-poor stars, we first construct a smoothed surface density map using the KDE technique with five-times larger bandwidth than that used for constructing the original surface density map, and then subtract it from the original map to obtain a residual map. We estimate the 68 % confidence level (1) of the residual map from the bootstrap tests with 1000 replicate resamplings444 Pseudo data sets are generated by sampling the same number of the observed data with replacement from the original data set. for each group. The significance contours show that our off-center peak of metal-poor stars is detected with a over 5 significance. The off-center peak is statistically outstanding so that it is the most distinct feature in the contour plot of all members (lower left).
3.5 Properties of the stars around the off-center peak: A possible relic star cluster
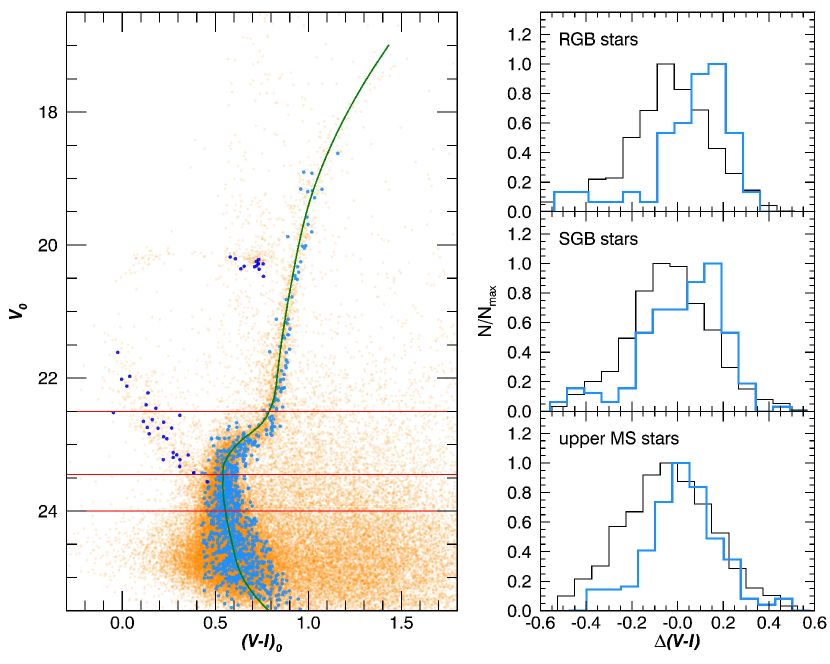
Figure 4 shows the CMD (left) and the color distributions (right) of the metal-poor stars around the off-centered density peak, compared with those of the bulk of field stars in Sextans. In the CMD, a total of 1035 metal-poor stars selected in the off-center peak region are overlaid with all point sources. We also plot the all of the HB and BS stars detected in this region. For HB stars, the -based metallicities cannot be determined in this study.
The narrow sequence defined by the stars of the off-center peak region in the left panel suggests a possible association with a single star cluster. In the right panel, we compare the color distributions of RGB, SGB, and upper MS between the selected stars around the off-center peak and all member stars in Sextans. The value is the difference between a star’s color and the LOESS regression fit (green solid line). The histogram shows that the stars exhibit redder colors than those of the bulk stars in Sextans. This phenomenon is very puzzling, given that the stars around the off-center peak are -weak, metal-poor stars and thus expected to have bluer colors.
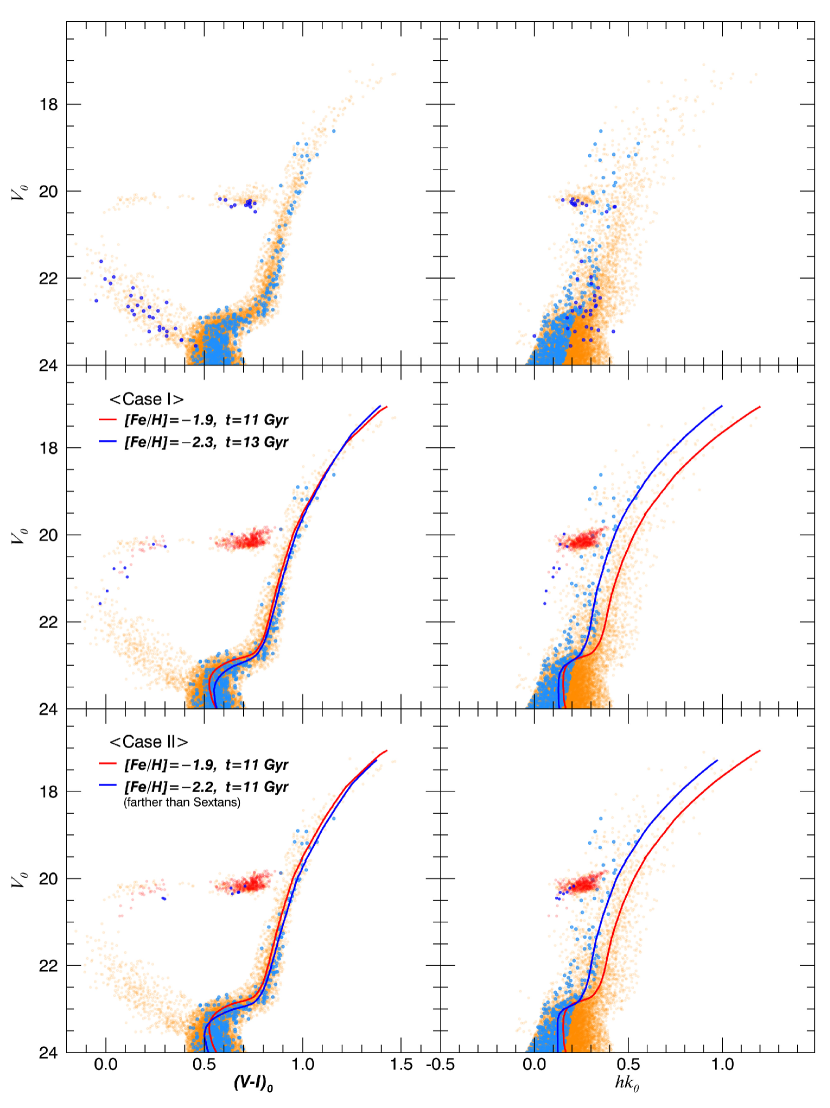
To address this puzzling phenomenon, we attempt to reproduce the observations with theoretical population models following the technique developed by Yoon et al. (2008) and Joo & Lee (2013). We use the Y2 isochrone and HB evolutionary tracks (Yi et al. 2008; Han et al. 2009). In the top panels of Figure 5, we present the observed and hk CMDs, where the sky blue dots are the stars around the off-center peak and the orange dots are all the member stars in Sextans. Blue dots represent all the HB and BS stars detected around the off-center peak. We first assume that, despite the internal metallicity and age spread of the galaxy, Sextans’s CMD can be roughly represented by a simple stellar population. We adopt a metallicity of [Fe/H] = 1.9 and an age of 11 Gyr555Recent determination of Sextans star formation history (Bettinelli et al. 2018) shows that over 80 % of stars are older than 12 Gyr. But we note that a careful approach is required to compare the absolute age values derived from CMDs because they depend fairly on the population model used. in our model. The metallicity is from the spectroscopic metallicity distribution of RGB stars (Battaglia et al., 2011; Kirby et al., 2011) and the age is adjusted until we obtain the best match with the observations (red solid lines in the middle and bottom panels). We then seek a population representing the off-center peak stars, which have weaker hk strength but redder color than the bulk of stars in Sextans. We test two possible scenarios for the reversal of the color.
In the first case, we assume an old, metal-poor star cluster population for the off-center peak (blue solid lines in the middle panels). Compared to the main body of Sextans, the lower metallicity can explain the weak strength while the younger age by 2 Gyr can naturally bring about the redder color of metal-poor stars in : the median difference between the two groups in the observations is 0.080 and the reproduced value is 0.067. The metallicity and age differences are reasonable, considering a wide metallicity spread (Battaglia et al., 2011; Kirby et al., 2011) and a large age range ( 3 Gyr; Lee et al. 2009; Okamoto et al. 2017) in this galaxy. This “age” model, however, predicts several blue HB stars (blue dots) for the star cluster population. Such blue HB stars are not observed within the off-center peak region but rather some red HB stars are present. Given that the small number of RGB stars ( 65) of the star cluster population, the expected number of HB stars are as small as 3. Recall that we cannot determine HB stars’ metallicities based on the index. We thus suspect that many of 13 red HB stars observed around the off-center peak actually belong to the metal-rich population of Sextans. We hence propose that the off-centered metal-poor peak is associated with a relic star cluster.
In the second case, we alternatively assume a metal-poor star cluster that is farther than the observed stars in the vicinity of Sextans’s center (blue solid lines in the lower panels). An observational hint for the distance difference comes from the magnitude distributions of HB stars, where the HB stars around the off-center peak appear to be slightly fainter than the rest of the stars. The “distance” model, with a younger age of 11 Gyr, is able to reproduce observed red HB stars. The larger distance ( 10 kpc farther than Sextans) makes the RGB and SGB sequence fainter than those of Sextans’s stars, resulting in the redder colors. However, the large galactocentric distance of the star cluster from Sextans casts doubt on the cluster being bound to Sextans. Rather it could be an extended globular cluster in the Milky Way’s outer halo ( 100 kpc) like Palomar 14 (Sollima et al., 2011), which is placed in the direction of Sextans by chance. Although this is an interesting possibility, the model, nevertheless, inevitably predicts a bluer color of the star cluster at the MS compared to that of Sextans’s stars, in contrast to the observation. It also seems difficult to explain the distorted feature observed near the off-center peak. Hence, it seems that the “distance” scenario is implausible, although it awaits further investigation.
4 Summary and Discussion
We examined the chemostructural properties of the Sextans dSph by dividing the member stars into metal-poor and metal-rich groups using the photometric metallicity indicator, hk index. From the spatial distribution of metal-poor stars, we found an unexpected number density peak at about 7.7 arcmin ( 190 pc) northwest from the center of the galaxy. We proposed based on the CMD analysis that the off-centered metal-poor peak is associated with a metal-poor star cluster, which is older than the rest of observed stars in Sextans. The large size of the roundish overdense region ( 80 pc in radius) and the smaller number of stars ( 1000) compared to typical globular clusters may imply that the cluster is under dissolution but not completely dissolved yet. This is consistent with previous studies suggesting the presence of star cluster remnants in this galaxy on the basis of kinematically cold substructures (Kleyna et al., 2004; Walker et al., 2006; Battaglia et al., 2011) or chemical coherence of several stars (Karlsson et al., 2012), although our star cluster does not coincide in position with them.
The survival of a star cluster within Sextans provides an important clue for the corecusp problem. Several numerical simulations (e.g., Kleyna et al., 2003; Lora et al., 2013) suggest that star clusters can persist for a Hubble time preferentially in the cored DM halo than in the cuspy DM halo. Assmann et al. (2013a, b) predicted, in their dwarf galaxy formation model, that, in a cored DM halo, some of star clusters can survive through the Hubble time if their apocentric distance is close enough ( 300 pc; see also Alarcón Jara et al. 2018) to reside in the core region where little potential gradient is present. The star cluster we identified has a projected distance of 190 pc from the galaxy center, and this could explain the reason why the old cluster was not completely dissolved yet. Our results thus provide a piece of evidence in favor of the cored DM halo profile of this dwarf galaxy.
Finally, it is worth to mentioning that while we interpret the off-centered overdensity of the metal-poor stars as a dissolving globular cluster, other interpretations are possible; it may be, for instance, an ultra-faint dwarf galaxy. There are three large spectroscopic datasets covering the RGB stars in Sextans by Walker et al. (2009), Kirby et al. (2010), and Battaglia et al. (2011). We have tried to cross-match the stars around the off-centered peak with these datasets. Unfortunately, the number of cross-matched stars is too small ( 9) for a statistically significant study. Further spectroscopic study is required to clarify the nature of the off-centered metal-poor overdensity.
References
- Alarcón Jara et al. (2018) Alarcón Jara, A. G., Fellhauer, M., Matus Carrillo, D. R., et al. 2018, MNRAS, 473, 5015
- Anthony-Twarog et al. (1991) Anthony-Twarog, B. J., Laird, J. B., Payne, D., & Twarog, B. A. 1991, AJ, 101, 1902
- Aoki et al. (2009) Aoki, W., Arimoto, N., Sadakane, K., et al. 2009, A&A, 502, 569
- Assmann et al. (2013a) Assmann, P., Fellhauer, M., Wilkinson, M. I., & Smith, R. 2013, MNRAS, 432, 274
- Assmann et al. (2013b) Assmann, P., Fellhauer, M., Wilkinson, M. I., Smith, R., & Blaña, M. 2013, MNRAS, 435, 2391
- Battaglia et al. (2011) Battaglia, G., Tolstoy, E., Helmi, A., et al. 2011, MNRAS, 411, 1013
- Bellazzini et al. (2002) Bellazzini, M., Ferraro, F. R., Origlia, L., et al. 2002, AJ, 124, 3222
- Bettinelli et al. (2018) Bettinelli, M., Hidalgo, S. L., Cassisi, S., Aparicio, A., & Piotto, G. 2018, MNRAS, 476, 71
- Castelli & Kurucz (2003) Castelli, F., & Kurucz, R. L. 2003, in IAU Symp. 210, Modelling of Stellar Atmospheres, ed. N. Piskunov, W. W. Weiss, & D. F. Gray (San Francisco, CA: ASP), 20
- Cicuéndez & Battaglia (2018) Cicuéndez, L., & Battaglia, G. 2018, MNRAS, 480, 251
- Cleveland (1994) Cleveland, W. S. 1994, The Elements of Graphing Data (2nd ed.; Summit: Hobart Press)
- de Blok (2010) de Blok, W. J. G. 2010, Advances in Astronomy, 2010, 789293
- Gouliermis et al. (2014) Gouliermis, D. A., Hony, S., & Klessen, R. S. 2014, MNRAS, 439, 3775
- Han et al. (2009) Han, S.-I., Lee, Y.-W., Joo, S.-J., et al. 2009, ApJ, 707, L190
- Irwin et al. (1990) Irwin, M. J., Bunclark, P. S., Bridgeland, M. T., & McMahon, R. G. 1990, MNRAS, 244, 16P
- Irwin & Hatzidimitriou (1995) Irwin, M., & Hatzidimitriou, D. 1995, MNRAS, 277, 1354
- Joo & Lee (2013) Joo, S.-J., & Lee, Y.-W. 2013, ApJ, 762, 36
- Karlsson et al. (2012) Karlsson, T., Bland-Hawthorn, J., Freeman, K. C., & Silk, J. 2012, ApJ, 759, 111
- Kirby et al. (2010) Kirby, E. N., Guhathakurta, P., Simon, J. D., et al. 2010, ApJS, 191, 352
- Kirby et al. (2011) Kirby, E. N., Lanfranchi, G. A., Simon, J. D., Cohen, J. G., & Guhathakurta, P. 2011, ApJ, 727, 78
- Kleyna et al. (2004) Kleyna, J. T., Wilkinson, M. I., Evans, N. W., & Gilmore, G. 2004, MNRAS, 354, L66
- Kleyna et al. (2003) Kleyna, J. T., Wilkinson, M. I., Gilmore, G., & Evans, N. W. 2003, ApJ, 588, L21
- Lee et al. (2009) Lee, M. G., Yuk, I.-S., Park, H. S., Harris, J., & Zaritsky, D. 2009, ApJ, 703, 692
- Lora et al. (2013) Lora, V., Grebel, E. K., Sánchez-Salcedo, F. J., & Just, A. 2013, ApJ, 777, 65
- Navarro et al. (1996) Navarro, J. F., Frenk, C. S., & White, S. D. M. 1996, ApJ, 462, 563
- Navarro et al. (1997) Navarro, J. F., Frenk, C. S., & White, S. D. M. 1997, ApJ, 490, 493
- Monet et al. (2003) Monet, D. G., Levine, S. E., Canzian, B., et al. 2003, AJ, 125, 984
- Muñoz et al. (2018) Muñoz, R. R., Côté, P., Santana, F. A., et al. 2018, ApJ, 860, 66
- Okamoto et al. (2017) Okamoto, S., Arimoto, N., Tolstoy, E., et al. 2017, MNRAS, 467, 208
- Olszewski & Aaronson (1985) Olszewski, E. W., & Aaronson, M. 1985, AJ, 90, 2221
- Ouchi et al. (2004) Ouchi, M., Shimasaku, K., Okamura, S., et al. 2004, ApJ, 611, 660
- Palma et al. (2003) Palma, C., Majewski, S. R., Siegel, M. H., et al. 2003, AJ, 125, 1352
- Roderick et al. (2016) Roderick, T. A., Jerjen, H., Da Costa, G. S., & Mackey, A. D. 2016, MNRAS, 460, 30
- Silverman (1986) Silverman, B. W. 1986, Monographs on Statistics and Applied Probability, London: Chapman and Hall, 1986, p.48
- Schlafly & Finkbeiner (2011) Schlafly, E. F., & Finkbeiner, D. P. 2011, ApJ, 737, 103
- Seleznev (2016) Seleznev, A. F. 2016, MNRAS, 456, 3757
- Sheather & Jones (1991) Sheather, S. J. & Jones, M. C. 1991, Journal of the Royal Statistical Society: series B, 53, 683
- Sollima et al. (2011) Sollima, A., Martínez-Delgado, D., Valls-Gabaud, D., & Peñarrubia, J. 2011, ApJ, 726, 47
- Stetson (1987) Stetson, P. B. 1987, PASP, 99, 191
- Stetson (1994) Stetson, P. B. 1994, PASP, 106, 250
- Stetson (2000) Stetson, P. B. 2000, PASP, 112, 925
- Walker et al. (2009) Walker, M. G., Mateo, M., & Olszewski, E. W. 2009, AJ, 137, 3100
- Walker et al. (2006) Walker, M. G., Mateo, M., Olszewski, E. W., et al. 2006, ApJ, 642, L41
- Yagi et al. (2002) Yagi, M., Kashikawa, N., Sekiguchi, M., et al. 2002, AJ, 123, 87
- Yi et al. (2008) Yi, S. K., Kim, Y.-C., Demarque, P., et al. 2008, in IAU Symp. 252, The Art of Modeling Stars in the 21st Century, ed. L. Deng & K.-L. Chan (Cambridge: Cambridge Univ. Press), 413
- Yoon et al. (2008) Yoon, S.-J., Joo, S.-J., Ree, C. H., et al. 2008, ApJ, 677, 1080