Fullerenes in the IC 348 star cluster of the Perseus Molecular Cloud
Abstract
We present the detection of fullerenes C60 and C70 in the star-forming region IC 348 of the Perseus molecular cloud. Mid-IR vibrational transitions of C60 and C70 in emission are found in Spitzer IRS spectra of individual stars (LRLL 1, 2, 58), in the averaged spectrum of three other cluster stars (LRLL 21, 31 and 67) and in spectra obtained at four interstellar locations distributed across the IC 348 region. Fullerene bands appear widely distributed in this region with higher strength in the lines-of-sight of stars at the core of the cluster. Emission features consistent with three most intense bands of the C and with one of C are also found in several spectra, and if ascribed to these ionized species it would imply ionization fractions at 20 and 10 , respectively. The stars under consideration host protoplanetary disks, however the spatial resolution of the spectra is not sufficient to disentangle the presence of fullerenes in them. If fullerene abundances in the cloud were representative of IC 348 protoplanetary disks, C60, the most abundant of the two species, could host 0.1 of the total available carbon in the disks. This should encourage dedicated searches in young disks with upcoming facilities as JWST. Fullerenes provide a reservoir of pentagonal and hexagonal carbon rings which could be important as building blocks of prebiotic molecules. Accretion of these robust molecules in early phases of planet formation may contribute to the formation of complex organic molecules in young planets.
keywords:
molecules – young stars - stellar clusters1 Introduction
Since the discovery of fullerenes C60 and C70 by Cami et al. (2010) in the young planetary nebula Tc1 using spectra from Spitzer Space Telescope, mid-IR bands of C60 have been identified in various astrophysical environments including reflection nebulae (Sellgren et al., 2010), planetary nebulae (García-Hernández et al., 2011), protoplanetary nebulae (Zhang & Kwok, 2011) and post-AGB stars (Gielen et al., 2011). The C cation has also been detected in many lines-of-sight of the diffuse interstellar medium (Foing & Ehrenfreund, 1994, 1997; Walker et al., 2015; Campbell et al., 2016), in one reflection nebulae (Berné et al., 2013) and, in one protoplanetary nebulae (Iglesias-Groth & Esposito, 2013). The relative band intensities of C60 in various sources appear better described by a thermal distribution than by a single-photon heating and fluorescent cooling model, but a successful explanation of band ratios and ionization balance of fullerenes in the various environments is still lacking. For instance, contributions from chemically bonded fullerenes in the solid state resulting from co-deposition of C60 and C on the surface of refractory grains or from the energetic processing of amorphous carbon may have to be considered for a proper explanation of the observational data (Krasnokutski et al., 2019). C70 bands are very rarely reported in the literature, thus there is far less insight on its relative abundance to C60.
Fullerenes are efficiently formed in vaporization experiments of graphite (Krätschmer et al., 1990) and could also be formed in asymptotic giant branch stars (AGB) where circumstellar molecular synthesis is very rich. These stable molecules are able to survive under the harsh conditions of the ISM as suggested by observations in several young stellar objects (Roberts et al., 2012) and by the ubiquitous presence of the diffuse interstellar bands at 957.7 and 963.2 nm which are associated to the cation C (Walker et al., 2015; Campbell et al., 2016). A significant fraction of interstellar carbon could be located in the C60 cation, although original estimates of order 0.9 have been recently revised to values down to 0.1 by Berné et al. (2017) who used the new oscillator strengths measured by Campbell et al. (2016). These cation bands were also detected in one protoplanetary nebula by Iglesias-Groth & Esposito (2013) who inferred that 0.86 of the carbon abundance in the nebula was in the form of the C60 cation using the old oscillator strengths. Such abundances are consistent with fullerene concentration values of order 0.05-0.1 ppm which are similar to some controversial claims in meteorites (Becker & Bunch, 1997; Becker et al., 1994), as debated by (Heymann, 1997; Hammond & Zare, 2008), and to the values inferred from the UV bump at 217.5 nm under the assumption that this prominent feature of extinction is caused by fullerenes (Iglesias-Groth, 2004). At such abundances, fullerenes can play an important role in interstellar chemistry (Omont, 2016).
The main driver for the formation of fullerenes is temperature see e.g. Jäger et al. (2009). The presence of fullerenes in some planetary nebulae where bands of polycyclic aromatic hydrocarbons (PAHs) are absent appears also consistent with laboratory studies showing that the efficiency of fullerene formation is favoured in hydrogen-poor environments (Cami et al., 2010). However, observations also show the coexistence of fullerenes and PAHs in planetary nebulae of the Magellanic clouds and other nebulae (Sellgren et al., 2010). It is therefore important to extend fullerene studies to other hydrogen-rich astrophysical contexts. The material near very young stars is particularly interesting in this respect, as numerous spectroscopic studies in the near, mid/far infrared and millimeter range (see Henning & Semenov, 2013) reveal a rich chemistry that may lead to the formation of a large variety of complex organic molecules in the disks of these stars. Among the various chemical ingredients detected are: silicates, H2, CO, ices and organic molecules like PAHs which are common and remarkably abundant. In the inner disk regions, Spitzer has detected a rich organic chemistry with species in the warm gas (T=200-1000 K) including CO, CO2, C2H2, CN and HCN (Teske et al., 2011). It is important to investigate the presence of fullerenes in young star forming regions and reveal any potential contribution of these molecules to the observed organic chemistry.
In this work, we report the detection of C60 and C70 in material of the molecular cloud intervening in several lines-of-sight of the young stellar cluster IC 348. This stellar system with an age 2 Myr, and distance to the Sun 316 pc (Herbig et al., 1998), is located at the eastern end of the well known Perseus molecular cloud complex (Cernis et al., 1993; Snow, 1994; Herbig et al., 1998; Luhman et al., 2003). Spitzer MIPS maps of 24 and 70 m emission show that the IC 348 region contains a diffuse distribution of warm dust most likely heated by soft-UV radiation (Bally et al., 2008).
| Object | RA | Dec | Sp.T | Teff (K) | M∗(M⊙) | L∗(L⊙) | R∗(R⊙) | AV | Age(Myr) | AORKey | dist. to LRLL 1 |
| LRLL 1 | 03:44:34.20 | +32:09:46.3 | B5V | 15400h | 6.15l | 1660j | 3.1g | 0.4l | 25310464a | 0.04” | |
| LRLL 2 | 03:44:35.36 | +32:10:04.6 | A2 | 8970 | 3.5i | 137f | 5f | 3.2g | 3m | 22847744n | 23.5” |
| 22968320b | 23.5” | ||||||||||
| 22968064b | 23.4” | ||||||||||
| 16269056c | 23.6” | ||||||||||
| 22967808b | 21.8” | ||||||||||
| 22961664b | 21.8” | ||||||||||
| LRLL 21 | 03:44:56.15 | +32:09:15.5 | K0 | 5240 | 1.8e | 2.52-3.66g | 4.g | 22848768n | 280.4” | ||
| LRLL 31 | 03:44:18.18 | +32:04:57.1 | G6 | 5700 | 1.5g | 4.3g | 2.1 | 8.8g | 22849280n | 353.9” | |
| LRLL 58 | 03:44:38.56 | +32:08:00.7 | M1.3 | 3800 | 0.7e | 0.72g | 2.1f | 3.4g | 3m | 22966016b | 119.2” |
| 16755456d | 120.6” | ||||||||||
| 22964224b | 119.4” | ||||||||||
| 22966272b | 119.2” | ||||||||||
| 22966528b | 119.6” | ||||||||||
| LRLL 67 | 03:43:44.62 | +32:08:17.9 | M0 | 3720 | 0.6i | 0.48g | 1.6f | 2.4f | 22850816n | 635.8” |
a Program ID 50043 (K. Misselt). b Program ID 40372 (J. Muzerolle). c Program ID 2 (J. R. Houck). d Program ID 179 (N. Evans). e Siess et al.,2000. f Luhman et al.,2003. g Flaherty et al., 2012,h Merin et al. 2004, Kalas et al. 1997, i Siess et al. 2000,j Olofsson et al. 2012, k Preibisch et al. 2001,l Montesinos et al 2009, m Cohen et al.2004, n Program ID 40247 (N. Calvet), o Program ID 50560 (D. Watson).
| Interstellar Pointing | AR | Dec | AORKey | dist. from LRLL 1 |
| p1 | 03:44:41.66 | +32:06:45.4 | 22848512n | 4” |
| p2 | 03:44:36.08 | +32:00:14.7 | 22850560n | 572” |
| p3 | 03:43:50.10 | +32:08:17.9 | 22851072n | 567” |
| p4 | 03:44:33.23 | +31:59:54.1 | 22851584n | 592” |
n Program ID 40247 (N. Calvet).
2 Observations
2.1 Stars, circumstellar and interstellar material
Spitzer IRS spectra of several IC 348 stars obtained in various programmes originally aimed to characterize the properties of protoplanetary disks in stars of this young cluster and spectra of various interstellar locations distributed across the cluster have been examined with the goal to identify fullerene emission bands. All the spectra under consideration in this work were taken at a distance less than 10 arcmin from the center of the cluster (at physical distance of less than 1 pc in the projected sky). The main sample includes the central star and most luminous member of IC 348 (LRLL 1, Luhman et al. 1998) and another two stars with evolved disks LRLL 2 and LRLL 58 selected because of the availability of multiple observations by Flaherty et al. (2012). Their parameters are listed in Table 1. Spitzer maps reveal that the IR emission surface brightness peak of the Perseus cloud coincides with the location of the B5 V star LRLL 1 (HD 281159), a binary star (separation 0.6 arcsec) with an extended disk structure mapped by Olofsson et al. (2012) using polarimetry. The polarimetric measurements reported by these authors and the ISO measurements at 16 m show a disk structure extending more than 20 arcsec in the SE-NW direction (with less emission in the NW part). This structure was first identified by Kalas et al. (1997) who proposed that it could be due to a protoplanetary disk. This hypothesis was questioned by Rebull et al. (2007), but observations by Olofsson et al. (2012) suggest that the structure is indeed linked to circumstellar material near the star, which could be due to a protoplanetary disk or to the disruption of an accretion disk.
The star LRLL 2 is an A2-type with stable photospheric flux and near/mid IR excess consistent with an optically thick dust at T 1000 K. LRLL 2 is a pre-main-sequence star with a bolometric luminosity of 137 L⊙, a radius of 5 R⊙ and a mass of 3.5 M⊙ based on the Siess et al. (2000) 3 Myr isochrones. Espaillat et al. (2012) find that the infrared SED can be fit with optically thick material that extends inward to the dust destruction radius 1.7 AU. Flaherty et al. (2012) propose the existence of an evolved protoplanetary disk in LRLL 2 (see their Fig. 2). Evolved disks are believed to lie between fully optically thick disks and debris disks. Object LRLL 58 is a M1.3 star (Siess et al., 2000) which shows H emission clearly indicative of an ongoing accretion process.Details on its infrared variability gas and disk properties are provided by Flaherty et al. (2012).
In addition to these three stars, we also discuss spectroscopic observations of several other IC 348 stars (LRLL 21, 31 and 67) less intensively observed than the previous two and of several interstellar locations distributed across the cluster. The individual spectra of these three stellar targets have modest S/N for detection of weak fullerene bands but we will show that averaging these spectra provides sufficient S/N to reveal the presence of many fullerene bands with high confidence. Similarly for the average of the four interstellar spectra.
2.2 Data
The observations of the IC 348 targets reported here were obtained with the InfraRed Spectrograph (IRS) Houck et al. (2004) onboard the Spitzer Space Telescope (Werner et al., 2004). Targets were selected by visual inspection of the CASSIS atlas of spectra (Lebouteiller et al., 2011) which provides reduced and flux calibrated background subtracted data (see details at http://cassis.sirtf.com/), particularly in the spectral region 17-20 m where the strongest C60 vibrational bands are located. The spectra were obtained with the low resolution module-short wavelength (SL; 5-20 m) and with the high-resolution short wavelength module (SH; 9.5-19.5 m) as part of various independent programs. Details of the observational parameters, AORs and the distance of the extracted slit position with respect to star LRLL 1 can be found in Tables 1 and 2.
The data processing is described elsewhere (see http://cassis.sirtf.com/). The CASSIS extracted spectra performs the background subtraction using the Adopt (Advanced Optimal Extraction) method described in detail by Lebouteiller et al. (2010). The particularity of this method is that the background profile is estimated for each row independently. Adopt makes use of a polynomial background whose parameters are determined for each row solving a set of n linear equations via a multilinear regression algorithm. Two procedures are used (subtraction by order and by nod) to correct for the background, both provide similar results for our targets. The column integrated spectra at the position of the stars finally adopted here show the contribution of the emission lines in the intervening material toward the stars superposed to the stellar continuum. Spatially extended emission lines are seen at scales beyond the spatial profile of each of the stellar targets. The spatial scale of the IRS (approximately 5 arcsec per pixel) does not allow to disentangle emission lines originating in the disk material from emission lines produced in the molecular cloud. The spectrum extracted at the position of the star includes the contribution of the stellar photosphere, the protoplanetary disk and any emission of the intervening cloud material. For the low resolution data the orientation of the SL and LL slits are different, but the slits overlap on the target position and the extraction of the spectrum at this position minimize relative flux differences that may arise between the two observing modes due to a slightly different spatial location of the stellar profiles.
3 Results and discussion
3.1 Low resolution spectra
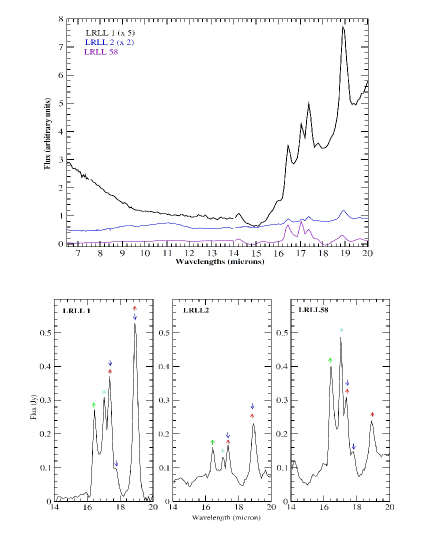
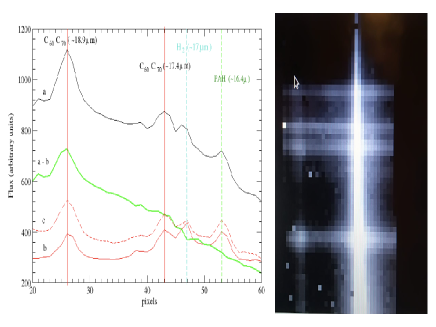
Figure 1 (top panel) shows the low resolution Spitzer/IRS spectrum (7-20 m) for three of the targets. Note that in LRLL 1 the spectrum is dominated by a thermal dust continuum. A most prominent emission band system is present in each star in the range 16-20 m showing a remarkable band at 18.9 m of C60 (with potential contribution of C70) and a mixture of PAHs at 16.4 m, H2 (17 m) and fullerenes C60 and C70 at 17.4 m, see details in Fig. 1 (bottom panel) where the bands are marked and the dust continuum was subtracted to LRLL 1. The relative strength of the fullerene and PAH bands changes notably from the hottest B5 V star (LRLL 1, bottom-left panel) and the A2 V star (LRLL 2) where the fullerene bands are the dominant features, to the coolest star M1.3 (LRLL 58, bottom-right panel of Fig. 1), where the PAH band is dominant. The spatial behaviour of the emission bands in the intervening material in the line of sight of each star varies notably. While the bands are rather stable spatially in LRLL 2 and LRLL 58, in LRLL 1 inspection of the spatial evolution of the C60 band at 18.9 m shows a stronger band closer to the spatial location of the star. In Fig. 2 we plot the LRLL 1 spectrum extracted from various positions along the slit, the spectrum corresponding to the position of the star is labeled with a , we also plot average spectra extracted from nearby columns, left and right from the star location, labeled b,c , respectively. The difference spectrum a-b shows that at the position of the star the strength of the 18.9 m is significantly higher than in more distant regions. This could be interpreted as evidence for a higher excitation of the C60 molecules because of the higher UV radiation field near the star.
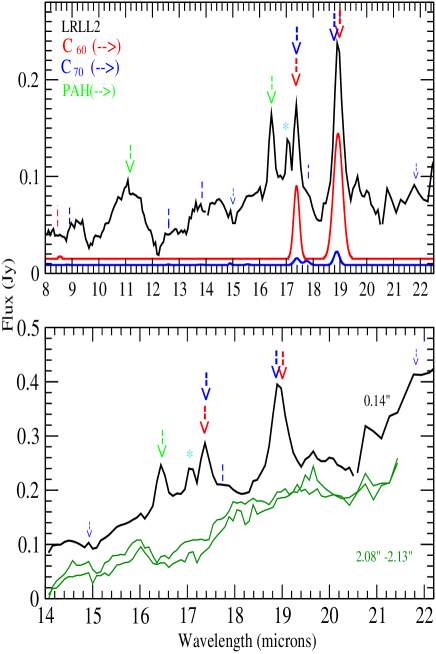
In Fig. 3 we present details of the bands and the continuum emission of the A2-type star LRLL 2. At the bottom panel we compare spectra where the bands of fullerenes and PAHs are clearly detected taken at the nominal position of the star (less than 0.14 arcsec) with spectra taken at separation of 2 arcsec where these bands are not detectable. The continuum emission remains similar at the two positions. In the upper panel of Fig. 3, the spectrum has been subtracted for the continuum emission. The positions of known bands of C60 (8.5, 17.4 and 18.9 m) and C70 (17.4, 17.8, 18.9 and 21.8 m) are marked. The solid red and blue lines in this panel represent computed simulations of the relative strengths of the bands of C60 and C70 which best fit the observed spectrum. The 8.5 m band is too weak and blended with PAHs for a reliable detection. Weak features of C70 could be present in the spectrum at 17.8 and 21.8 m, but their detection is marginal and require confirmation with higher resolution measurements. These bands are important to ascertain the relative contribution of this molecule to the strong and broad bands at 17.4 and 18.9 m.
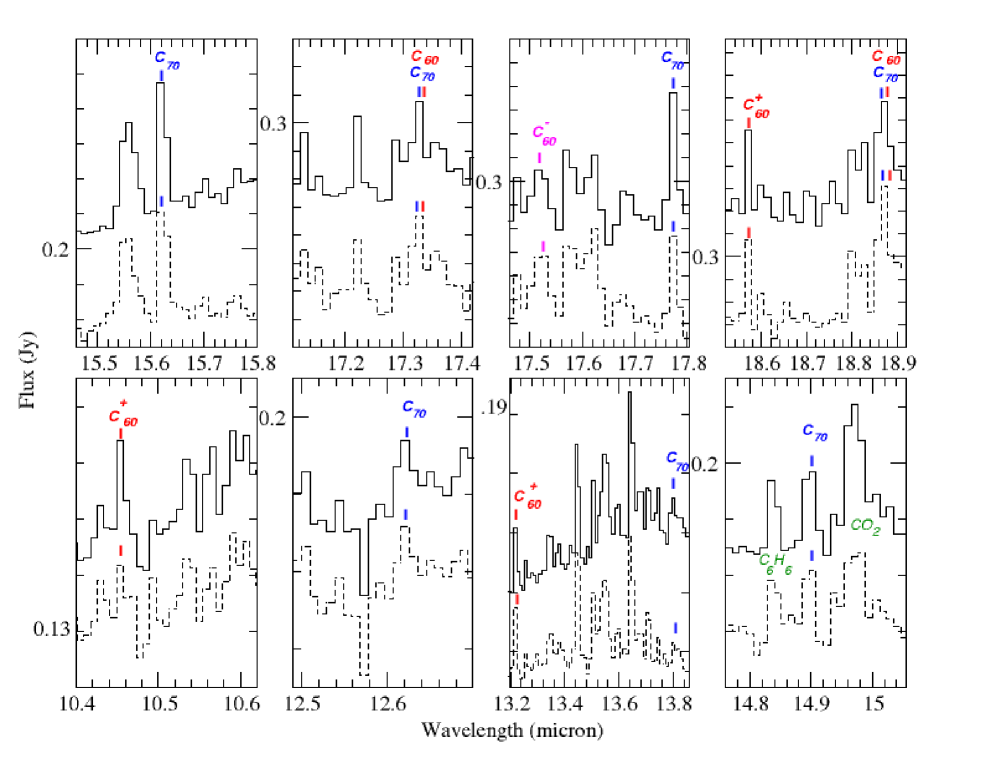
3.2 High-resolution spectra
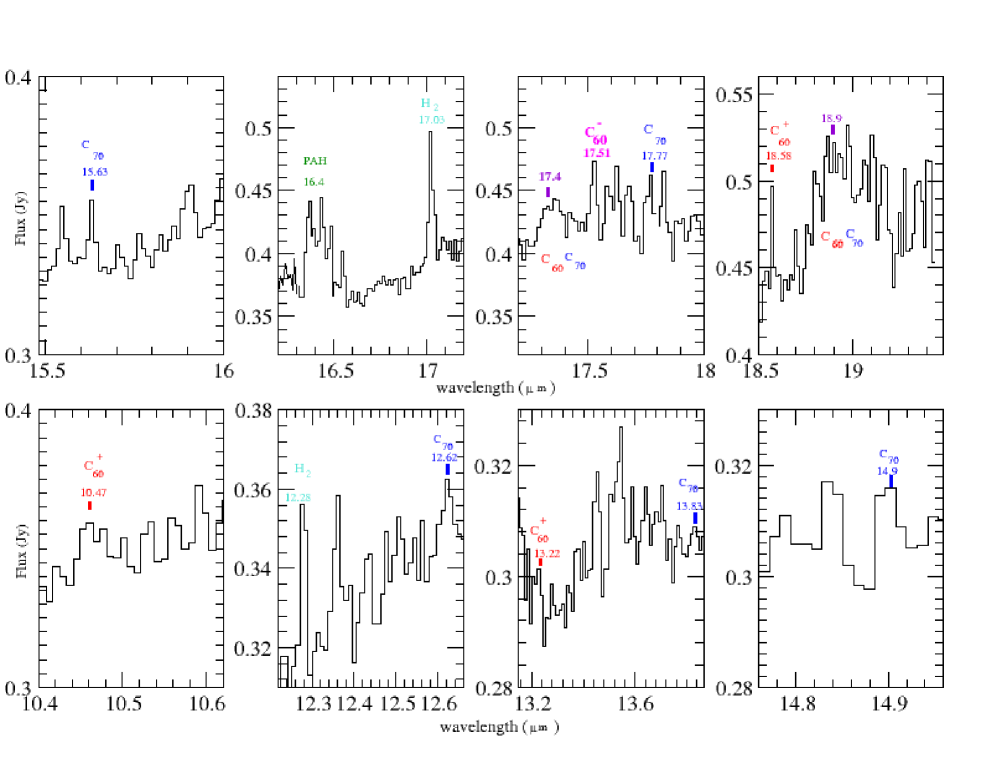
In Fig. 4 we plot spectra of LRLL 2 obtained with the IRS high spectral dispersion module (R=600). The various panels of this figure display zooms of several spectral regions with the position of known individual bands of C60, C, C and C70 marked and the observed wavelength of the peak emission for each band indicated. In addition to the bands at 18.9 and 17.4 m mentioned above, the high-resolution spectrum shows evidence for bands at 12.63, 13.83, 14.90, 15.63 and 17.77 m which can be attributed to C70 vibrational bands based on a comparison with published spectroscopic laboratory measurements. Iglesias-Groth et al. (2011) measured laboratory wavelengths and FWHMs for bands of C60 and C70 at different temperatures and found evidence for wavelength shifts of these bands depending on the temperature and the adopted matrix. Table 3 lists for each band of C70 the range of wavelengths measured at different laboratory conditions. The table also lists wavelengths for the bands detected in the IRS high dispersion spectrum of LRLL 2 (typical measurement errors 0.01 m). Only bands in the range 10-20 m covered by the IRS spectrum are given in the Table. The agreement between laboratory wavelengths of C70 and observed wavelengths for the five cleanest potential bands of C70 is very good and provides strong support for the identification of C70 in LRLL 2. Other bands of C70 are also present in the spectrum, for instance, those measured at 17.4 m and 18.7-18.9 m but are blended with bands of C60 at very similar wavelengths. Complex broad features are detected in LRLL 2 at these wavelengths which could be contributed in principle by the two fullerene species. The wavelengths of the bands at 17.4 and 18.9 m are the most sensitive to temperature and matrix conditions according to laboratory work. This makes more difficult to disentangle the contribution of each fullerene specie to these features.
The typical widths of individual, clean C70 bands measured in the high dispersion spectrum of LRLL2 are 0.02-0.03 which is in contrast wth the ten times broader features observed at 17.4 and 18.9 m, however these features receive contributions from C60 and C70 and possibly also from bands of the ionized species, in particular C is known to have a relatively strong band at 18.6 m, these features are therefore intrinsically complex. In addition, as noted in the laboratory work by Iglesias-Groth et al. (2011), the widths of C60 bands are found to be very sensitive to the temperature and the matrix conditions. In particular the 18.9 m band which, depending on the matrix and temperature conditions set at laboratory, displays a large range of widths spanning from 0.04-0.4 m and also wavelength shifts of up to 0.1 m. The high dispersion spectrum of LRLL2 in the top right panel illustrates the rather complex structure of the 18.6-19.0 m feature, the weaker 17.4 m feature is also complex.
In the high dispersion spectrum of LRLL 2 displayed in Fig. 4 there are also features at 10.47, 13.22 and 18.58 m which are fully consistent with wavelengths computed for the IR-active bands of C by Berné et al. (2013) and therefore could be attributed to this cation. The bands at 10.47 and 18.58 m are the strongest predicted for the spectral range covered by our observations with intensities 2-3 times higher than the 13.22 m band (see Table 2 in the previous paper) and in fact, this intensity ratio is consistent with the spectrum. The other predicted lines are too weak and cannot be detected. These three bands are the only ones which could be detected in the high dispersion spectrum of LRLL 2. However in the low resolution spectrum it is possible to find features at 6.4 and 7.2 m which according to predictions are the strongest of the IR active modes of the C. In summary, the presence of C in the spectrum of LRLL 2 is claimed based on identification of its five strongest IR active bands.
In Fig. 4 we also show the detection of a clear band at 17.51 m which is consistent with one of the two strongest vibrionic bands (Kupser et al., 2008) of the anion C. In the low resolution spectrum of this star there is also a feature at 7.3 m which could be due to the other strongest band of the anion. This second feature is only marginally detected and therefore the presence of the anion should be taken with caution.
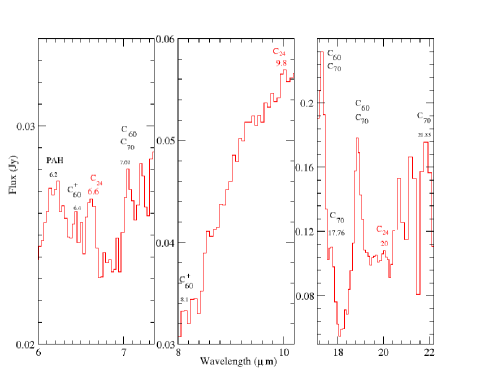
Other IRS high dispersion spectra of stars and interstellar locations from IC 348 are displayed in Fig. 5 and 6 for comparison. The spectrum at the top is the average of individual spectra of three IC 348 stars and the spectrum at the bottom is the average of individual spectra acquired at four interstellar positions in the region of the cluster. Features like the PAH band at 11 m and the H2 band at 17.4 m band appear significantly different in the two spectra. The fullerene bands previously reported in LRLL 2 are also present in these two spectra. The bands of C60 at 17.4 and 18.9 m; C70 at 12.63, 13.83, 14.90, 15.63 and 17.77 m; C at 10.47, 13.22 and 18.58 m and C at 17.51 m are all clearly seen and marked in the plots. Fig. 6 provides a zoom in the relevant spectral ranges to facilitate the identification and subsequent comparison. The strength of the fullerene bands appear very similar in both the average stellar and interstellar spectra indicating that the emission bands are mainly produced in molecular gas widely distributed in the interstellar medium of the cluster and therefore cannot be ascribed to the material in the disks of the selected stars.
| Laboratory measurements | LRLL 2 obs. spectrum | Background | |
|---|---|---|---|
| (m) | (m) | ||
| 12.61-12.62 | 12.62 | 12.63 | |
| 13.80-13.81 | 13.83 | 13.81 | |
| 14.90-14.91 | 14.90 | 14.90 | |
| 15.64-15.67 | 15.63 | 15.63 | |
| 17.62-18.07 | 17.77 | 17.78 |
| Band | LRLL 1 | LRLL 2 | LRLL 58 | ||||||
|---|---|---|---|---|---|---|---|---|---|
| Flux | FWHM | Flux | FWHM | Flux | FWHM | ||||
| 21.8 m band | |||||||||
| C70 | 21.78 | 21.85 | |||||||
| 18.9m band | |||||||||
| Total | 18.93 | 0.33 | 18.93 | 0.3 | 18.87 | 0.35 | |||
| C60 | |||||||||
| C70 | |||||||||
| 17.4 m band | |||||||||
| Total | 17.36 | 0.3 | 17.39 | 0.3 | 17.36 | 0.3 | |||
| C60 | |||||||||
| C70 | |||||||||
| 17.76 m band | |||||||||
| C70 | 17.76 | 17.77 | 0.2 | 17.76 | 0.3 | ||||
| 15.6 m band | |||||||||
| C70 | 15.64 | 15.56 | |||||||
| 14.9 m band | |||||||||
| C70 | 14.95 | 14.90 | 14.94 | ||||||
| 12.6 m band | |||||||||
| C70 | 12.62 | ||||||||
| 7.0 m band | |||||||||
| C60+ C70 | 7.1 | 7.04 | 7.07 |
| Band | Average Discs | Background | ||||
|---|---|---|---|---|---|---|
| Flux | FWHM | Flux | FWHM | |||
| 18.9m band | ||||||
| Total | 18.88 | 0.3 | 18.88 | 0.3 | ||
| 17.4 m band | ||||||
| Total | 17.33 | 0.08 | 17.34 | 0.07 | ||
| 17.76 m band | ||||||
| C70 | 17.78 | 0.014 | 17.78 | 0.011 | ||
| 15.6 m band | ||||||
| C70 | 15.63 | 0.02 | 15.63 | 0.03 | ||
| 14.9 m band | ||||||
| C70 | 14.90 | 0.02 | 14.90 | 0.02 | ||
| 12.6 m band | ||||||
| C70 | 12.63 | 0.02 | 12.63 | 0.02 |
| LRLL 2 | LRLL 58 | Average (LRLL 21, 31 and 67) | Interstellar avg. | ||||
|---|---|---|---|---|---|---|---|
| Flux | Flux | Flux | Flux | ||||
| 6.4 | 6.45 | ||||||
| 7.22 | 7.22 | ||||||
| 10.47 | 10.46 | 10.46 | |||||
| 13.22 | 13.23 | 13.22 | 13.22 | ||||
| 18.56 | 18.58 | 18.58 |
3.3 Measurements. Abundance estimates
The S/N of the high dispersion spectra of LRLL 2 and the two averaged spectra of stars and interstellar locations are similar. The detection of individual bands mentioned in the previous subsection are at least with 5 confidence, many with a much higher confidence level as the measurement of the rms of the continuum in various locations free of bands (13.3, 14.5, 15.6 and 16.7 m) gives values around 0.003 Jy.
In Table 4 and 5 we provide wavelengths, fluxes in Wm-2 and full width half maximum (FWHM) measurements for the relevant neutral fullerene C60 and C70 bands in the 7-22 m regions. In Table 6 we provide measurements for the bands (6.4, 7.2, 10.5, 13.2 and 18.6 m) of the C. All the measurements have been performed using the SPLOT routine of IRAF and its de-blending option was used wherever it was required to disentangle multiple components, particularly in the region 16-18 m. Gaussian profiles were assumed for all the fits. Errors in the line fluxes were estimated by propagating pixel error through the line integrals and are typically of order 20 . The minimum flux we can detect in the high-resolution spectra corresponds to unresolved lines with a peak flux 3 times higher than the rms and it corresponds to 1 x 10-18 Wm-2.
The C60 features in the range 17-19 m have a typical width of 0.3-0.4 m, wider than the spectral resolution of the instrument and similar to the widths observed in planetary nebulae (like Tc 1). The total flux of the feature at 18.9 m varies by a factor 10, from values close to 1 x 10-16 up to 1 x 10-15 W m-2. The contribution of C70 to the total emission of the bands observed at 18.9 m and 17.4 m has been established using the information provided by other bands of this molecule assuming a simple model to describe band ratios, we find C70 contributions in the range 10-30 of the total band strengths.
As discussed e.g. by Bernard-Salas et al. (2012) the excitation of fullerenes in interstellar gas may be understood via thermal models or IR fluorescence models. The latter predict nearly constant F(17.4 m)/F(18.9 m) ratios in a broad range of excitation energies and also fairly strong bands at 7 and 8.5 m. Thermal models where the emitted power in each of the fullerene bands is proportional to the corresponding excited vibrational state can naturally explain observed flux ratios F(17.4 m)/F(18.9 m) in the range 0.5-0.6 and the 50 times weaker fluxes of the 7 and 8.5 m bands w.r.t. the 18.9 m band in our spectra (see the diagnostic diagram of Fig.5 in Bernard-Salas et al. (2012)).
From the fluxes in Table 4, it is possible to estimate abundances of the fullerenes C60 and C70 by using thermal models and adopting the temperature dependence of the absorptivity for each fullerene transition Iglesias-Groth et al. (2011). This approach has been followed for instance by García-Hernández et al. (2011) in their study of fullerene abundances in planetary nebulae. It is assumed errors of 10 in the flux determinations of C60 and of order 20 for the weaker lines of C70. In the case of LRLL 2, where both the low and high spectral resolution data are available, a good number of C70 bands are detected (12.6, 14.9 and 15.6 m) which are essentially uncontaminated in the high dispersion spectrum. These bands are the basis for an initial thermal model solution for this molecule. Then, an iterative process is followed to obtain an estimation of the C70 fluxes at 18.9, 17.4 and 7.0 m from a best-fit solution providing both the temperature of the emitting region (T 200 K) and the total number of emitting molecules, which is found at N(C70)=1.5 x 1044. The fit also provides an estimate of the fluxes for each of the three blended bands. The values are listed in Table 4 where total fluxes measured for these bands and the best estimate of the C70 and C60 contributions to the total fluxes are given. As a result only 30 of the flux at 18.9 m is contributed by C70. The resulting thermal model for C60 band fluxes gives N(C60)= 3.2 x 1044 molecules, a factor 2 more abundant than C70 and equilibrium temperature of 250 K. In addition, the five measured bands of C (fluxes listed in Table 3) albeit weak and close to the sensitivity limit of the spectra, also provide a reliable model solution, resulting in N (C) = 2.6 x 1043 molecules. According to the thermal model, this implies that about 10 of the C60 would be in the cation form.
The upper limits on the fluxes of the 7 and 8.5 m bands limit our capacity to determine accurate equilibrium temperatures and abundances in the other two stars, but in the case of LRLL 58 where at least three bands of each neutral fullerene type are also detected in low resolution spectra, the preferred model solutions lead to N(C60)= 1 x 1045 molecules with a vibrational temperature of T=150 K and N(C70)= 1 x 1045 molecules with vibrational temperature of 300 K. Very similar abundances of both species. It was also possible to measure some weak bands of C in this star (see Table 6) from which it is inferred N(C)=2 x 1042 molecules and T=350 K. Indicating a much lower ionization fraction than in the previous star.
For LRLL 1 where only upper limits can be imposed to the flux of the 7 m band, for C60 it is found equilibrium temperatures below 250 K and abundance values of 4 x 1046 molecules with uncertainties of order 50 . This star, which is the most luminous of the three under study, is by far the one with the strongest bands and the highest value of N(C60) according to these models.
An alternative way to estimate fullerene abundances in our sources is via the assumption that all the UV energy absorbed by fullerenes is released in the IR, which would be correct if there were no other relaxation channels. This is valid for C60 internal energies (see Berné et al. (2017)). If we also assume that the UV absorption cross section of the neutral and the cation are similar, we can obtain a quick estimate of the ionization fraction by adding the fluxes measured for IR bands of these species in our targets. In the case of LRLL2 the total flux measured in bands of C is 5 x 10-17 W m-2 and for neutral C60 is 2.3 x 10⁻¹⁶, therefore the ionization fraction of C60 is 21, higher than the value given above from thermal models. In Fig. 4 (see also Fig. 6) we also show the detection of a clear band at 17.51 m with a flux of 1.8 x 10⁻¹⁷ W m-2 which we attribute to the anion C. In the low resolution spectrum of this star there is also a feature at 7.3 m with flux 3 x 10 -17 W m-2 which can also be due to the anion. These two bands are the strongest vibrionic bands known of the anion Kupser et al. (2008). Taking the sum of the fluxes emitted in these bands as an estimate of the total emitted IR flux by the cation, we infer an ionization fraction of 21 , which should be strictly taken as a lower limit.
Following e.g. Berné et al. (2017), the total IR intensity (W m-2 sr-1) emitted by C60 molecules is Itot=n(C60) x x G0 x 1.2 x 10-7 where n(C60) is the column density of C60, = 4.2 x 10⁻¹⁶ cm2, G0 is the radiation field. For the Perseus molecular complex is generally adopted a value of G0=1, see e.g. the low spatial resolution studies of AME (Anomalous Microwave Emission) in Perseus Genova-Santos et al. (2015). However as shown in the study by Sun et al. (2008) large variations in the far UV (FUV) radiation field can exist in the Perseus star-forming region IC 348 where the stars of this work are located. In Table 3 of the latter paper the variations of the intensity of the FUV radiation field are quantified using different approaches. Depending on the adopted method, the center of the cluster where star LRLL 1 (HD 281159) is located has a factor 10-80 higher intensity field than the less intense regions of the star-forming region which are comparable to the general interstellar field. I will adopt here an intermediate value of G0= 45 for the radiation field in the vicinity of LRLL 1 and G0=20 for stars LRLL 2 and 58.
The total fluxes of C60 IR bands obtained from Table 4 are divided by the area subtended (in sr) by the spatial extension of each extracted spectrum in order to provide a determination of Itot. The values obtained for LRLL 1, LRLL2 and LRLL 58 are 4 x 10⁻⁷, 2 x 10⁻⁷ and 0.5 x 10⁻⁷ W m-2 sr-1, respectively, giving C60 column densities of 2, 1 and 0.5 x 1014 cm-2 for each target. Using the expression f= n(C60) x 60 / (N(H) x [C]) where [C] is the carbon to hydrogen ratio adopted as 1.6 x 10⁻⁴ by Sofia et al. (2004), and taking N(H)= 4.8 x 10 22 from Sun et al. (2008) for the central part of the IC 348 cluster, it yields abundances of the gas phase carbon locked in C60 of 1.6 x 10 -3, 0.8 x 10⁻³ and 0.4 x 10⁻³, for stars LRLL 1, 2 and 58, respectively. These values of 0.16-0.04 compare well with previously reported values in star-forming regions (Castellanos et al., 2014; Berné et al., 2017). This value is of order of those found in planetary nebulae (García-Hernández et al., 2011) suggesting that a significant fraction of fullerenes formed in proto and planetary nebulae can survive the harsh conditions of the interstellar medium and become incorporated into the material of young star-forming regions like IC 348.
The typical total disk masses in IC 348 stars as measured from millimeter fluxes (Lee et al, 2011) are in the range 0.002-0.006 M⊙. Assuming for the disks of our stars a typical mass of 0.004 M⊙ and solar metallicity, we can estimate the total mass of carbon in the disks to be of order 6-2 x 10⁻⁷ M⊙. Applying the derived percentage of carbon locked in fullerenes, we estimate that the disks in our stars contain between 8 and 2 x 10⁻⁹ M⊙ in the form of C60, corresponding to a number of C60 molecules in the range 1046 - 1045.
4 Conclusions
We present the detection of fullerenes in interstellar matter of the star-forming region IC 348 using spectroscopic data obtained by the Spitzer Space Telescope. Detection of bands of C60 at 7.04, 17.4 and 18.9 m in low resolution spectra and bands of C70 at 12.6, 13.8, 14.9, 15.6, 17.8, 18.9 and 21.8 m in high and low resolution spectra are reported. The bands of PAHs (16.4 m) and H2 (17 m) coexist with fullerene bands in the spectra of the targets under study. Contrary to PAHs, fullerenes appear to be little sensitive to the physical conditions of the intervening material. We also detect several bands at wavelengths consistent with those of the ionized species C (10.47, 13.22 and 18.58 m) and C (7.3 and 17.51 m) from which we estimate ionization fractions of 20 and 10 , respectively for the best measured spectrum. Fullerenes present in the gas of the IC 348 star-forming region could be incorporated into protoplanetary disks and ultimately into planets during their early stages of formation. If the derived percentage of gas-phase carbon locked in fullerenes were also representative of the material conforming the protoplanetary disks in IC 348 stars, a large reservoir of fullerenes may exist in disks and could be revealed by observations with upcoming facilities such as JWST. Fullerenes are robust molecules consisting of pentagonal and hexagonal carbon structures that may supply building blocks for the formation of complex organic molecules (Iglesias-Groth et al., 2013) in young planetary environments.
Acknowledgements
Based on observations made with the Spitzer Space Telescope. I thank CASSIS for access to the spectroscopic database, the MINECO project ESP2015-69020-C2-1-R for financial support and Rafael Rebolo for a critical reading of the manuscript, valuable suggestions and comments on its contents.
References
- Bally et al. (2008) Bally, J., Wallawender, J., Johnstone, D., Kirk, H. & Goodman, A. 2008, in Handbook of Star Forming Regions Vol. I Astronomical Society of the Pacific, ed. B. Reipurth
- Bast et al. (2013) Bast, J.E., Lahuis, F., van Dishoeck, E.F. & Tielens, A.G.G.M. 2013, A&A, 551, 118
- Becker & Bunch (1997) Becker, L. & Bunch, T.E. 1997, Meteoritics & Planetary Science, 32, 479
- Becker et al. (1994) Becker, L., Bada, J.L., Winans, R. E. & Bunch, T.E. 1994, Nature, 372, 507
- Bernard-Salas et al. (2012) Bernard-Salas, J., Cami, J., Peeters, E., Jones, A.P., Micelotta, E.R. & Groenewegen, M.A.T. 2012, ApJ, 757, 41
- Berné et al. (2013) Berné, O., Mulas, G. & Joblin, C. 2013, A&A, 550, L4
- Berné et al. (2017) Berné, O., Cox, N. L. J., Mulas, G. & Joblin, C. 2017, A&A, 605, L1
- Blevins et al. (2016) Blevins, M., Pontoppidan, K. M., Banzatti, A., Zhang, K., Najita, J.R., Carr, J.S., Salyk, C. & Blake, G.A. 2016, ApJ, 818, 22
- Cami et al. (2010) Cami, J., Bernard-Salas, J., Peeters, E. & Malek, S. E. 2010, Science, 329, 1180
- Campbell et al. (2016) Campbell, E. K., Holz, M. & Maier, J. P. 2016, ApJ, 826, L4
- Castellanos et al. (2014) Castellanos, P., Berné, O., Sheffer, Y., Wolfire, M. G. & Tielens, A. G. G. M. 2014, ApJ, 794, 83
- Cernis et al. (1993) Cernis, 1993, BaltA, 2, 214
- Cieza et al. (2006) Cieza, L. & Baliber, N. 2006, ApJ, 649, 862
- Espaillat et al. (2012) Espaillat, C., Ingleby, L., Hernández, J., et al. 2012, ApJ, 737, 103
- Flaherty et al. (2012) Flaherty K.M., Muzerolle J., Rieke G., Gutermuth R., Balog Z., Herbst, W., Megeath, S. T. & Kun, M. 2012, ApJ, 748, 71
- Foing & Ehrenfreund (1994) Foing, B. H.& Ehrenfreund, P. 1994, Nature, 369, 296
- Foing & Ehrenfreund (1997) Foing, B. H. & Ehrenfreund, P. 1997, A&A, 317, L59
- García-Hernández et al. (2011) García-Hernández, D.A., Iglesias-Groth, S., Acosta-Pulido, J. A. et al. 2011, ApJ, 737, L30
- Genova-Santos et al. (2015) Génova-Santos, R., Rubiño-Martin, J.A., Rebolo R. et al. 2015, MNRAS, 452, 4169
- Gielen et al. (2011) Gielen, C., Cami, J., Bouwman, J., Peeters, E.& Min, 2011, A&A, 536, A54
- Kupser et al. (2008) Kupser, P., Steill, J. D., Oomens, J., Meijer, G. & von Helden, G. 2008, Phys.Chem. Chem. Phys., 10, 6862
- Hammond & Zare (2008) Hammond, M.R., Zare, R. N., 2008, GeCoA, 72, 22, 5521
- Herbig et al. (1998) Herbig, G. H. 1998, ApJ, 497, 736
- Henning & Semenov (2013) Henning,T. & Semenov, D. 2013, ChRv., 113, 9016
- Heymann (1997) Heymann, D. 1997, ApJ, 489, L111
- Houck et al. (2004) Houck, J. R et al. 2004, AAS, 204, 3304
- Iglesias-Groth (2004) Iglesias-Groth 2004, ApJ, 608, 37
- Iglesias-Groth et al. (2011) Iglesias-Groth, S., Cataldo, F. & Manchado, A. 2011, MNRAS, 413, 213
- Iglesias-Groth & Esposito (2013) Iglesias-Groth, S. & Esposito, M. 2013, ApJ, 776, L21
- Iglesias-Groth et al. (2013) Iglesias-Groth, S., Hafez, Y., Angelini, G. & Cataldo, F. 2013, J. Rad. Nuc. Chem., 298, 1073
- Jäger et al. (2009) Jäger, C., Huisken, F., Mutschke, H., Jansa, I., Ll., Henning, T. 2009, ApJ, 696, 706
- Kalas et al. (1997) Kalas, P. & Jewitt, D. 1997, Nature, 386, 52
- Krasnokutski et al. (2019) Krasnokutski, S. A., Gruenewald, M., C. Jäger, C., Otto, F., Forker, R., Fritz, T. & Henning, T. 2019, ApJ, 874, 149
- Krätschmer et al. (1990) Krätschmer, W., Lamb, L. D., Fostiropoulos, K. & Huffman, D. R. 1990, Nature, 347, 354
- Kupser et al. (2008) Kupser, P., Steill, J. D., Oomens, J., Meijer, G. & von Helden, G. 2008, Phys. Chem. Chem. Phys., 10, 6862
- Kuzmin & Duley (2011) Kuzmin, S. & Duley, W.W 2012, arXiv:1103.2989
- Lebouteiller et al. (2011) Lebouteiller, V., Barry, D.J., Spoon H. W. W., Bernard-Salas, J., Sloan G. C. & Houck, J. R. 2011, ApJS, 196, 8
- Lebouteiller et al. (2010) Lebouteiller, V., Bernard-Salas, J., Sloan G. C & Barry, D.J., 2010, PASP, 122, 231
- Lee et al (2011) Lee N., Williams, J.P. & Cieza, L. 2011, 736, 135
- Luhman et al. (1998) Luhman, K. L., Rieke, G.H., Lada C.J. & Lada E.A. 1998, ApJ, 508, 347
- Luhman et al. (2003) Luhman, K.L., et al. 2003. ApJ, 593, 1093
- Merin et al. (2004) Merín, B., Montesinos, B. & Eiroa, C. 2004, A&A, 419, 301
- Montesinos et al. (2009) Montesinos, B., Eiroa, C., Mora, A., Merin, B. 2009, A&A, 495, 901
- Omont (2016) Omont, A. 2016, A&A, 590, A52
- Olofsson et al. (2012) Olofsson, G., Nilsson, R., Florén, H-G, Djupvik, A. & Aberasturi, M.. 2012, A&A, 544, 43
- Preibisch et al. (2001) Preibisch, T. , Stanke, T & Zinnecker, H. 2001, ASPC, 223, 1556
- Rebull et al. (2007) Rebull, L.M., Stapelfeldt, K.R., Evans, N.J.H. et al. 2007, ApJS, 171, 447
- Roberts et al. (2012) Roberts, K.R.G., Smith, K.T. & Sarre, P.J. 2012, MNRAS, 421, 3277-3285
- Sellgren et al. (2010) Sellgren, K. et al. 2010, ApJ, 722, L54
- Siess et al. (2000) Siess, L. Dufour, E. & Forestini, M., 2000, A&A, 358, 593
- Snow (1994) Snow, T. P., 2004, ASPC, 309, 93
- Sofia et al. (2004) Sofia, U.J, Lauroesch, J.T., Meyer, D. M., & Cartledge, S.I.B. 2004, ApJ, 605, 272
- Sun et al. (2008) Sun, K., Ossenkopf, V., Kramer, C., Mookerjea, B., Rllig,B., Cubick, M. & Stutzki J. 2008, ApJ, 489, 207
- Teske et al. (2011) Teske, J. K., Najita, J.R., Carr, J.S., Pascucci L., Apai, D. & Henning T. 2011, ApJ, 734, 27
- Walker et al. (2015) Walker, G. A. H., Campbell, E. K. Maier, J. P. & Bohlende, D. 2015, ApJ, 843, 56
- Werner et al. (2004) Werner, M. W. et al. 2004, ApJS, 154, 1
- Zhang & Kwok (2011) Zhang, Y & Kwok, S. 2011, ApJ, 730, 126