Dark Matter Response to Galaxy Assembly History
Abstract
Aims. It is well known that the presence of baryons affects the dark matter host haloes. Exploring the galaxy assembly history together with the dark matter haloes properties through time can provide a way to measure these effects.
Methods. We study the properties of four Milky Way mass dark matter haloes from the Aquarius project during their assembly history, between . In this work, we use the SPH run from Scannapieco et al. (2009) and the dark matter only counterpart as case studies. To asses the robustness of our findings, we compare them with one of the haloes run using a moving-mesh technique and different sub-grid scheme.
Results. Our results show that the cosmic evolution of the dark matter halo profiles depends on the assembly history of the baryons. We find that the dark matter profiles do not significantly change with time, hence they become stable, when the fraction of baryons accumulated in the central regions reaches 80 percent of its present mass within the virial radius. Furthermore, the mass accretion history shows that the haloes that assembled earlier are those that contain a larger amount of baryonic mass aforetime, which in turn allows the dark matter halo profiles to reach a stable configuration earlier. For the SPH haloes, we find that the specific angular momentum of the dark matter particles within the five percent of the virial radius at z = 0, remains approximately constant from the time at which 60 percent of the stellar mass is gathered. We explore different theoretical and empirical models for the contraction of the haloes through redshift. A model to better describe the contraction of the haloes through redshift evolution must depend on the stellar mass content in the inner regions.
Key Words.:
galaxies: haloes – galaxies: evolution – galaxies: formation1 Introduction
Within the current standard cosmological model -CDM, the dark matter together with the dark energy are the main ingredients that shape the formation and evolution of cosmic structures. In this scenario, galaxies assemble and evolve within dark matter haloes formed via hierarchical growth (White & Rees, 1978).
In the past decades, N-body simulations that account only for the dynamics of the cold dark matter, have been carried out to investigate the properties of the haloes. Their results show that dark matter haloes follow a universal radial density profile (NFW, Navarro et al., 1997; Diemand et al., 2005), and tend to be triaxial in shape, and prolate in the inner regions (Frenk et al., 1988; Jing & Suto, 2002; Allgood et al., 2006; Stadel et al., 2009). However, these simulations do not take into account the effects of galaxy formation and the presence of baryons on the evolution of the dark matter haloes. Observational results based on rotational curves from spiral galaxies show that dark matter haloes might have a central density core (e.g., Salucci & Burkert, 2000; Oh et al., 2008; Donato et al., 2009), contrary to the cuspy universal profiles obtained from simulations that only consider cold dark matter.
Current cosmological hydrodynamical simulations that account for the dark matter halo assembly together with galaxy formation have proven to be useful to investigate the impact of baryons on different properties of the dark matter haloes. For instance, baryons can transform the shape of dark matter haloes into more spherical or axisymmetric configurations (Tissera & Dominguez-Tenreiro, 1998; Kazantzidis et al., 2004; Tissera et al., 2010; Bryan et al., 2012; Zemp et al., 2012; Bryan et al., 2013; Ceverino et al., 2015; Zhu et al., 2017), change the distribution of dark matter in the inner regions (Governato et al., 2012; Macciò et al., 2012; Di Cintio et al., 2014b, a; Zhu et al., 2016), and modify their specific angular momentum (Zavala et al., 2016).
It is well established that within galaxy formation models there are many physical processes that can modify the properties of dark matter haloes. The inflow of baryons onto the central galaxy contracts the dark matter mass to the inner regions. This effect has been often modelled assuming adiabatic contraction models (Blumenthal et al., 1986; Gnedin et al., 2004), based on that the gravitational potential of the system is spherically symmetric and changes slowly. However, this simplified model does not reproduce the results obtained from different cosmological hydrodynamical simulations and other empirical models have been considered (e.g., Abadi et al., 2010; Pedrosa et al., 2010; Chan et al., 2015). Additionally, the outflows produced by stellar feedback can prevent gas cooling by removing it from the central regions and in turn, expanding the haloes (Read & Gilmore, 2005; Macciò et al., 2012; Governato et al., 2012; Brook & Di Cintio, 2015; El-Zant et al., 2016). Other processes might also modify the dark matter haloes such as the presence of galactic discs and/or bars (Debattista & Sellwood, 1998; Errani et al., 2017), dynamical friction from in-falling clumps (El-Zant et al., 2001), and mergers of substructures within or close to the halo (Dekel et al., 2003).
Although there is strong evidence that baryons have an impact on the dark matter haloes, it is still under debate how the halo properties evolve with galaxy assembly history. Furthermore, most of the reports focus only on the properties at . Thus, the investigation of the cosmic evolution of the dark matter haloes together with the galaxy formation can help to disentangle the influence of baryons onto the dark matter haloes.
There are previous works that recently discuss this aspect. Chan et al. (2015) explore the dark matter profiles in the mass range of from the FIRE suite hydrodynamical simulations between . Their results suggest that the inner part of the dark matter density profiles change according to the halo mass. Haloes with masses in the range of have shallow profiles, while the baryonic contraction is significant for the haloes with masses above . Furthermore, they show that the inner regions of the dark matter haloes are governed by stellar mass and dark matter, and cores form typically close to . Also Zemp et al. (2012), using hydrodynamical simulations with different prescriptions for the sub-grid physics of baryons, investigate the properties of haloes with masses above 10 at . They find that dark matter haloes contract in response to baryon dissipation, producing approximately isothermal profiles in the inner 10% of the virial radius. Moreover, they find that the specific angular momentum of dark matter is conserved in time in the region dominated by baryons, since the stellar content stabilises the gravitational potential. Tollet et al. (2016) using a sample of dark matter haloes in the range of , find that the inner dark matter density profile slope depends on the stellar to halo mass ratio at all redshifts. This result is in agreement with Di Cintio et al. (2014b) which investigate this dependence at .
While previous reports explore the evolution of dark matter profiles in a variety of halo masses, in this work we focus on how the physics of baryons affects the evolution of Milky Way mass-sized dark matter haloes. This work extends the analysis performed by Tissera et al. (2010) at . We analyse four haloes from the Aquarius Project (Springel et al., 2008; Vogelsberger et al., 2009) between =0–4, and compare the cold dark matter only run with one of the galaxy formation models implemented in these haloes (the hydrodynamical model from Scannapieco et al., 2009). Understanding the effect of baryons on the dark matter density profile, and in particular in the inner regions of Milky Way mass-sized haloes, is essential for making predictions of indirect dark matter detection such as the gamma-ray signal from dark matter self-annihilation (Abazajian et al., 2014; Schaller et al., 2016b). We acknowledge the fact that the Aquarius haloes of Scannapieco et al. (2009) overproduced stars, resulting in galaxies with large bulges and small discs. Nevertheless, these haloes can provide information on the physical processes intervening. To assess if our conclusions might be affected by this aspect, we also analysed a version of one of the haloes run using AREPO code (Marinacci et al., 2014). We show that the main results remain valid.
This paper is organised as follows. We describe briefly the numerical simulations and discuss the convergence of the results in § 2. In § 3 we investigate the evolution of different properties such as the dark matter density profiles, the mass accretion history, the halo shape, and the specific angular momentum. We contrast our findings between the dark matter only run of each halo and the simulation containing baryons. We summarise our main results in § 4.
2 Simulation
The haloes of Aquarius project (Springel et al., 2008; Vogelsberger et al., 2009) were run originally with dark matter particles only (DMO run), but subsequently, different methods were implemented to model the physics of baryons (Scannapieco et al., 2009; Cooper et al., 2010; Marinacci et al., 2014). In this work we compare the results from the DMO with those from the hydrodynamical run of Scannapieco et al. (2009, SPH run). Both DMO and SPH simulations were run from to using versions of GADGET-3, an update of GADGET-2 (Springel et al., 2001; Springel, 2005) optimised for massively parallel simulation of highly in homogeneous systems. The initial conditions were settled depending on the mass resolution, and for the SPH runs the mass of dark matter particles was reduced accordingly to the cosmological parameters adopted (for further details see, Springel et al., 2008; Scannapieco et al., 2009). The cosmological parameters adopted for SPH and DMO runs are , , , , , with . These cosmological parameters are the same adopted in the Millennium Simulation (Springel et al., 2005), which within the uncertainties, are consistent with the constraints derived from WMAP 1- and 5-year data analyses (Spergel et al., 2003; Komatsu et al., 2009). The evolution of the structure at galactic scales are not significantly affected by small variations in the cosmological parameters.
The DMO haloes were run with different resolutions as part of the Aquarius Project. Navarro et al. (2010) analyse the properties of the DMO haloes, showing that they converge numerically in all the resolution levels studied, between level 1 to 5. So, it is possible to reliably use level-2 of the DMO to compare with the SPH runs at level-5 as also explained in Tissera et al. (2010). The haloes that include baryonic processes were run at a lower resolution approximately 200 times lower than the DMO, named as level-5. We also analyse the results of a lower resolution run of level-6 for one of the haloes to evaluate resolution effects. In general, the convention adopted to label each halo is with a letter and the resolution level.
From the set of six haloes analysed by Tissera et al. (2010) at , we studied the evolution of four of them selected to not to have any major event which left distinct features in the dark matter distribution. This is the case for Aq-B-5 and Aq-F-5. Therefore the haloes from the hydrodynamical simulation analysed are Aq-A-5, Aq-C-5, Aq-D-5, Aq-E-5. We also analysed a lower resolution run Aq-E-6 to assess numerical issues. The gravitational softening of SPH runs are in the range of . The dark matter particles in the SPH simulation are , while gas particles have initially masses of . The main properties of the dark matter haloes including the number of dark matter particles within the virial radius are presented in Table 3. Following the same convention, and according to the resolution, the DMO haloes are generally named as Aq-A-2, Aq-C-2, Aq-D-2 and Aq-E-2. The gravitational softening of the DMO runs is , while the mass of dark matter particles are . All the results of the DMO haloes presented are scaled by the cosmic baryon fraction, f.
In order to avoid confusion and make the nomenclature simpler for the reader, in this work we name the haloes of the SPH run as Aq-A-SPH, Aq-C-SPH, Aq-D-SPH and Aq-E-SPH, while those from the DMO run are refereed as Aq-A-DMO, Aq-C-DMO, Aq-D-DMO and Aq-E-DMO.
We study the evolution of the dark matter haloes in the range of to in both DMO and hydro simulations. In the following section, we describe briefly the main properties of the baryonic model implemented in the hydrodynamical simulation.
The hydrodynamical model
The simulations were run by Scannapieco et al. (2009) using a version of P-GADGET-3 that include a multiphase model for the gas component with metal-dependent cooling, star formation and phase-dependent treatments of supernova (SN) feedback and chemical enrichment (see Scannapieco et al., 2005, 2006, for further details).
Gas particles are eligible to form stars according to their density (must be denser than ) and if they lie in a convergent flow. Stellar particles are created stochastically from those gas particles that fulfil the aforementioned conditions, and a maximum of two stellar particles are allow to form from each gas particle (for further details see Scannapieco et al., 2006, 2009). The chemical model implemented follows the chemical enrichment by supernovae type II (SNII) and type Ia (SNIa) from Mosconi et al. (2001). The SN feedback model has been proven to be effective at reproducing the observed phenomenology of star formation and wind generation in quiescent and starburst galaxies. Hence, the algorithm implemented in the SPH runs have shown to be a powerful tool to investigate galaxy formation within a cosmological context (Scannapieco et al., 2009).
Haloes are identified at their virial radius , defined as the radius which encloses a density equal to 200 times the critical density at certain redshift . The halo mass M200,z, is defined as the mass enclosed within . We summarise the main properties of the haloes in Table 3.
The dark matter haloes from the SPH run were previously studied in Tissera et al. (2010) at . It is already established that Aquarius haloes have diverse assembly histories which produce a variety of star formation histories and structures. The properties of the central galaxies within the Aquarius haloes are analysed in Scannapieco et al. (2009), finding that most of them present centrifugally supported discs composed of approximately a fifth of the total stellar mass (with exception of Aq-F-5 which is not studied in the present work). The star formation rate has shown to be different for each central galaxy, as well as for spheroidal and disc components. Therefore, we expect that the different assembly histories will produce different evolution for the dark matter halo shapes. The present work is an extension of that of Tissera et al. (2010) in order to investigate the cosmic evolution of dark matter haloes and the role that baryons played on them.
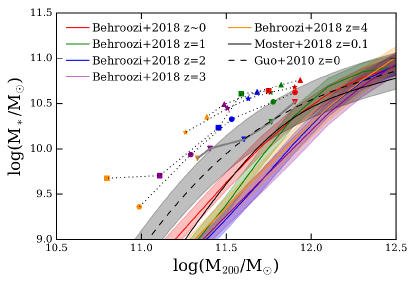
We acknowledge the fact that these Aquarius haloes have overproduced stars at compared with abundance matching results (e.g., Guo et al., 2010; Behroozi et al., 2018; Moster et al., 2018) as already discussed by Aumer et al. (2013). To assess the robustness of our analysis with respect to this issue, we also analyse a version of Aq-C performed with the moving mesh code arepo (Marinacci et al., 2014, Aq-C-M14, run at resolution level-4). The sub-grid model accounts for star formation, chemical enrichment, stellar feedback using a kinetic wind scheme, metal-line cooling, and quasar- and radio- mode feedback from AGN.
This run has produced galaxies with disc-dominated systems and stellar mass to halo mass ratio in agreement with the results from abundance matching techniques at . Additionally, the comparison of Aq-C-SPH with Aq-C-M14 will allow us to assess effects of numerical resolution.
In Fig. 1 we show the cosmic evolution from to of the stellar mass to halo mass relation for the five haloes compared with abundance matching results (Guo et al., 2010; Behroozi et al., 2018; Moster et al., 2018). At , three of the galaxies are in agreement with the results from Guo et al. (2010, within error): Aq-A-SPH, Aq-D-SPH and Aq-C-M14. The remaining two haloes contain an excess of stellar mass although they are within error (Aq-C-SPH and Aq-E-SPH). At higher redshifts, the all simulated haloes have a higher discrepancy compared with abundance matching techniques, showing they form a higher fraction of stars. As can be seen from Fig. 1 all haloes show a similar increase of the stellar mass to halo mass with redsfhit. Interestingly, Aq-C-M14 that is well consistent with the abundance matching predictions at does not reproduce the cosmic evolution of predicted values. Hence, there are still unclear aspects regarding the regulation of the star formation activity as a function of redshift and hence, on the impact of the baryons on the dark matter distribution. We will use these set of simulated haloes to analyse the response of the dark matter to galaxy formation as the they are assembled baring in mind the caveats. The comparison of haloes with different history of assembly run with the same subgrid physics as well as the comparison between runs with the same initial conditions and different subgrid physics provide a route to contribute to understand this problem.
Spatial resolution and convergence considerations
In order to study the inner region of the dark matter haloes, it is important to analyse the minimum radius above which the results obtained are robust. This radius is named as the convergence radius. For DMO simulations, Power et al. (2003) find that the converge radius RP03 should not exceed the radius where the two body relaxation time is shorter than the age of the Universe. However, there is no a straightforward definition for hydrodynamical simulations. Nonetheless, the converge criterion of Power et al. (2003) might be used as reference in hydrodynamical simulations, considering it is a conservative representation of the convergence radius when baryons are included in simulations (Di Cintio et al., 2014b, a; Schaller et al., 2015). Adopting the RP03 estimation for SPH runs, we find that the values are around 1.50–2.50 kpc at which represent roughly one percent of the virial radius. This value represents approximately three times the gravitational softening implemented in the SPH haloes at . This result is similar at high redshift, finding that the convergence radius is below to 5 percent of the virial radius at each redshift. For the dark matter haloes of the DMO runs, the convergence radius is lower since the resolution is much higher than that of the SPH runs.
Therefore, in order to study the evolution of the dark matter profiles and the changes in the inner region, we consider the convergence radius of Power et al. (2003) (i.e., 1 percent) as the minimum radius where we can analyse the SPH haloes. In this work, we adopt different limits according to the halo properties we want to study and considering the convergence radius obtained for these simulations. For instance, we fit the dark matter halo profiles between three times the gravitational softening and the virial radius at each redshift in order to fulfil this condition. It is also important to be careful with the number of particles on each radius bin for the dark matter profile. We describe the adopted criterion for SPH and DMO haloes in § 3.1.
Considering the convergence radius, and in order to make a robust analysis, we define the inner region of the haloes as the region within 5 percent of .
3 Results
3.1 Dark matter density profiles at
We analyse the dark matter profiles of the SPH runs at . For this, we implement two different models, the one proposed by Di Cintio et al. (2014a), and the Einasto profile (Einasto, 1965) also shown in Tissera et al. (2010).
The profile proposed by Di Cintio et al. (2014a, DC14), is based on a double power-law model with three parameters (, , ) fitted depending on the star formation efficiency of the galaxy (i.e., the relation between stellar mass and dark matter halo mass). The model also includes the scale density, and the scale radius, which depend on the concentration parameter of the DMO halo (see Di Cintio et al., 2014a, for further details). Hence, the functional form of Di Cintio et al. (2014a) profile is:
| (1) |
In DC14, the parameters that depend on the star formation efficiency are modelled by two functions. The outer slope is fitted with a quadratic function, while the inner slope and the transition parameter are fitted by power-law functions (see Di Cintio et al., 2014a, eq. 3). Since , , and parameters are constrained trough the star formation efficiency, the DC14 profile is left with 2 free-parameters, alike the NFW one. In order to get the free parameters of the functional form, DC14 select a sample of ten galaxies with different stellar masses and five different initial conditions, with efficiencies in the range of . This profile turns towards NFW profile for star formation efficiencies around and above, since outflows are not efficient enough to pull out the mass from the inner regions, getting values similar to a NFW profile in this case (, and ).
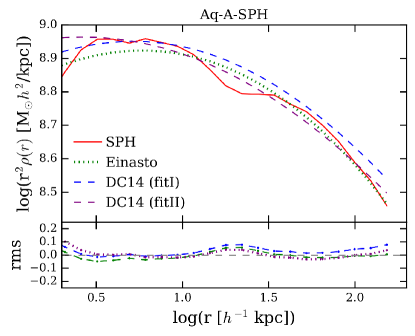
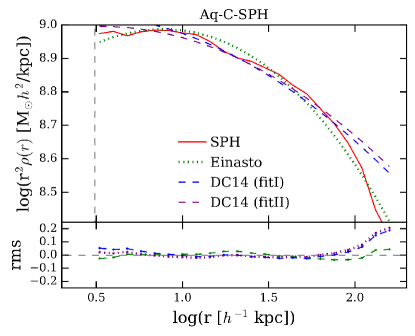
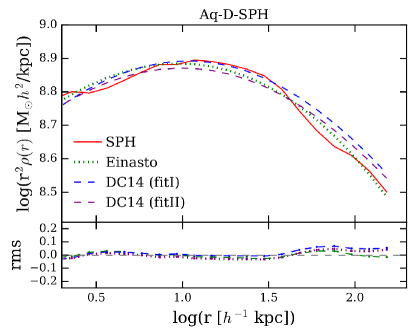
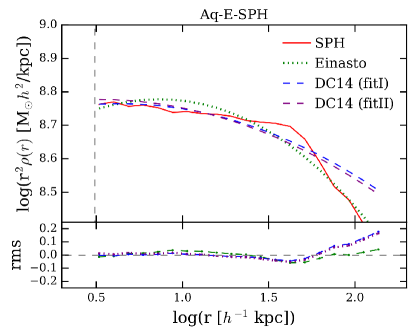
The star formation efficiency of the central galaxies from the SPH haloes are -1.22 (Aq-A-SPH), -1.18 (Aq-C-SPH), -1.28 (Aq-D-SPH) and -1.11 (Aq-E-SPH). If we compare the efficiencies from the SPH run with the range studied by DC14, we find that the Aquarius haloes are slightly in excess the range studied by around . Hence, we implement the expressions from DC14 for , , and , and leave the concentration and halo mass as free parameters to be determined through fitting procedures (see also Katz et al., 2017). We fit Eq. 1 to each halo between three times the gravitational softening to the virial radius adopting: the concentration as the free parameter (DC14 fitI); and also adopting the concentration and halo mass as free parameters (DC14 fitII). We present the parameters from DC14 fitI and fitII in Table 1, and the profiles obtained in Fig. 2. For each SPH halo we compute the root-mean-square deviation (rms), presented in the lower panel of each halo.
The concentration parameters from DC14 (see Table 1) can be directly compared to Ludlow et al. (2014), since the scale radius has been converted into using Eq. 2 in Di Cintio et al. (2014a). We find that the concentration parameters obtained present values in agreement with those from Ludlow et al. (2014).
| Aq-A-SPH | Aq-C-SPH | Aq-D-SPH | Aq-E-SPH | |
| Fit I | ||||
| 0.40 | 0.30 | 0.53 | 0.24 | |
| 2.98 | 3.01 | 2.94 | 3.03 | |
| 1.28 | 1.33 | 1.22 | 1.35 | |
| cDM | 10.59 | 21.72 | 5.86 | 9.61 |
| 0.008 | 0.017 | 0.004 | 0.015 | |
| Fit II | ||||
| 0.32 | 0.31 | 0.49 | 0.22 | |
| 3.00 | 3.01 | 2.95 | 3.04 | |
| 1.32 | 1.32 | 1.24 | 1.36 | |
| cDM | 19.13 | 15.39 | 6.09 | 12.57 |
| M | 1.0 | 1.20 | 1.05 | 0.78 |
| 0.007 | 0.020 | 0.002 | 0.013 |
We find that both fitI and fitII provide good agreement in the inner regions of the haloes, which is represented by a steep inner slope of (see Table 1) indicating contracted haloes at the centre.
However the model seems to show some discrepancies in the outskirts of the SPH haloes. These discrepancies might be due to different aspects, such as the merger history of some Aquarius haloes. Indeed, the outer slope of some of the Aquarius haloes might be still affected at by some of the late mergers, as a result of their outer slope being steeper than the canonical slope of -3 usually found in DM haloes. This is in particular the case of Aq-E-SPH which presents a peculiar dark matter density profile (see also Navarro et al., 2010, for a discussion regarding Aq-E-DMO). Another aspect is that the dark matter haloes implemented in DC14 are mainly in the range of - M⊙, while Aquarius are more massive haloes, although this should not be an issue when the outskirts of dark matter halos is studied.
We also fit the dark matter profiles with Einasto profile function at between three times the gravitational softening and the virial radius (also shown in Tissera et al., 2010, but fitted in a different range). This profile describes the dark matter density using three free parameters , and , where the second and third parameters are the isothermal radius and density, when the logarithmic slope is -2. The Einasto profile functional form is:
| (2) |
In Fig. 2 we show the result obtained for the SPH haloes at , and the values obtained for the parameters are presented in Table 3. We find that Einasto provides a good fit for all the analysed haloes in agreement with previous results (Tissera et al., 2010). From the comparison of the values, we find that Einasto profile reproduces slightly better the SPH dark matter haloes profiles than DC14. This result is also expected since the Einasto contains an extra free parameter.
In Table 2 we show the comparison of the halo mass of each SPH halo with the masses inferred from the fits of Einasto and DC14 fitII at . We find that the masses computed are in good agreement with the simulated haloes, with deviations between one to ten percent the original halo mass.
| Name | M | M | M |
|---|---|---|---|
| Aq-A-SPH | 1.10 | 0.99 | 1.00 |
| Aq-C-SPH | 1.18 | 1.07 | 1.20 |
| Aq-D-SPH | 1.09 | 1.01 | 1.05 |
| Aq-E-SPH | 0.77 | 0.69 | 0.78 |
3.2 Evolution of dark matter density profiles with redshift
In this section, we follow the evolution of the dark matter halo profiles and compare the results obtained from DMO and SPH runs. We show that the evolution is different between DMO and SPH haloes, suggesting that these differences lie on the impact that baryons have onto the SPH dark matter haloes. Furthermore, the different SPH haloes studied also show particular trends.
We do not implement the model from DC14 at higher redshifts into the SPH haloes since the parameters that depend on the star formation efficiency were adjusted to reproduce the halo population at . Only the evolution of the inner slope has been modelled in the past (Chan et al., 2015; Tollet et al., 2016). Different reports have shown that the star formation efficiency depend on redshift according to different processes such as star formation and merger history of the haloes (e.g., Behroozi et al., 2013). Hence, an alternative model that accounts for the evolution of the star formation efficiency with redshift would be essential to develop in the future.
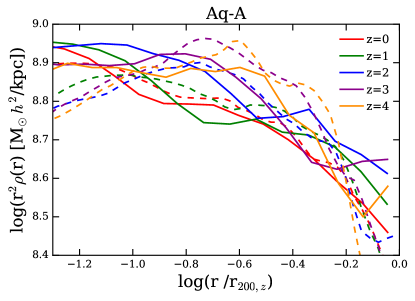
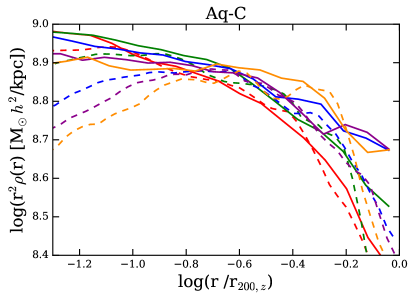
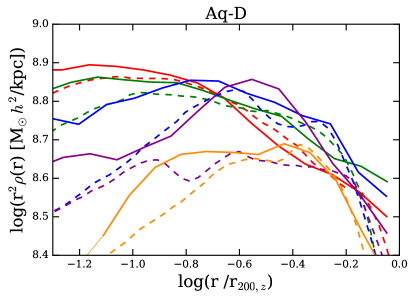
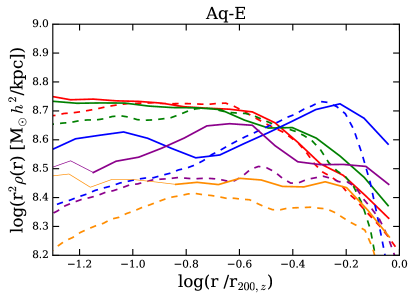
We use the Einasto profile to model the dark matter haloes at and 4, to quantify the differences as a function of redshift. We fit the free parameters between three times the gravitational softening and the virial radius at each redshift, R200,z. In Fig. 3 we present the dark matter density profiles for both DMO and SPH runs at redshift and 4. We compute the dark matter density profiles of DMO haloes between three times the gravitational softening to , using 100 bins. For the SPH haloes the resolution is lower, hence we use 22 bins in order to have more than 2000 particles in each radial bin. When the bin does not fulfil this condition the line of the profile is shown with a thin line.
All the DMO haloes show that the amplitude of the density profile increases as redshift decrease in the inner region below ten percent of the R200,z, turning from a NFW profile at high redshift () to isothermal profile (). We find that the DMO profiles present similar characteristics in the outskirts. For the SPH runs, the DM halo profiles do not show the same evolution. In particular, haloes Aq-A-SPH and Aq-C-SPH appear to be roughly stable and do not show critical evolution with redshift in the inner parts. More precisely, Aq-A-SPH present some slight variations while Aq-C-SPH is more stable in time. This is not the case for Aq-D-SPH and Aq-E-SPH which show an increase in the inner region, similar to what we find in the DMO haloes. We note that the inner region of Aq-E-SPH at contain less than 2000 particles per bin. Hence the analysis of Aq-E-SPH must be taken with caution above .
The comparison of the inner radii of SPH and their counterparts DMO show that SPH haloes are more concentrated as found in other several works (e.g., Tissera et al., 2010; Schaller et al., 2016a; Zhu et al., 2016). Furthermore, we find that the SPH dark matter profiles in the inner region below ten percent of and between , are described by isothermal profiles. This trend is more clear for Aq-A-SPH, Aq-C-SPH, and Aq-E-SPH.
It is also interesting to point out that both, Aq-A-SPH and Aq-C-SPH, end up being more concentrated in the inner regions at . In Table 3 we present the concentration parameters for the redshifts studied, defined as where is obtained from fitting Einasto profile. At we find that the concentration parameter is higher for Aq-A-SPH and Aq-C-SPH compared with Aq-D-SPH and Aq-E-SPH. This difference might be due to different halo assembly histories together with baryon accretion in the haloes. The concentration parameter shows to be dependent on the redshift and halo mass as expected (Ludlow et al., 2014), showing a tendency to decrease as redshift increase.
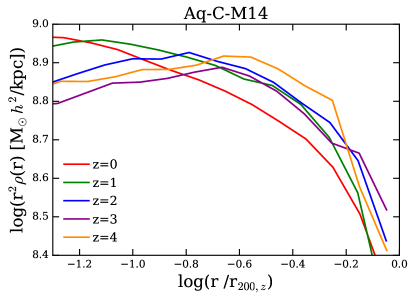
In Fig. 4, we present the dark matter density profile of Aq-C-M14 between . Aq-C-M14 show a mild evolution in the inner region, and a stable density profile between , in contrast with Aq-C-SPH which presents a stable profile in almost all the redshift range studied. The differences found between these two runs can be explained mainly due to the differences of sub-grid physics. Also the impact of the moving-mesh technique might improve the mixing between cold and hot gas (see e.g., Schaller et al., 2015).
In the following sections we discuss the principal differences we find in the evolution of the dark matter haloes and the effect that galaxy formation has on them through cosmic time.
| Name | ) | cSPH | R200,z | M200,z | N | |||
|---|---|---|---|---|---|---|---|---|
| M/kpc3 | kpc | kpc | ||||||
| Aq-A-SPH | ||||||||
| 0.09 | 7.39 | 5.87 | 0.003 | 28.86 | 169.42 | 1.10 | 527620 | |
| 0.06 | 8.13 | 2.53 | 0.003 | 43.25 | 109.43 | 0.79 | 372467 | |
| 0.08 | 7.95 | 3.16 | 0.002 | 22.20 | 70.15 | 0.55 | 267611 | |
| 0.12 | 7.88 | 3.32 | 0.007 | 13.47 | 44.74 | 0.36 | 164520 | |
| 0.15 | 7.99 | 2.88 | 0.005 | 11.39 | 32.81 | 0.25 | 114884 | |
| Aq-C-SPH | ||||||||
| 0.13 | 7.21 | 7.73 | 0.002 | 22.40 | 173.19 | 1.18 | 680301 | |
| 0.10 | 7.54 | 5.29 | 0.001 | 21.47 | 113.59 | 0.91 | 512148 | |
| 0.07 | 7.96 | 3.14 | 0.001 | 23.28 | 73.10 | 0.66 | 365642 | |
| 0.06 | 8.35 | 1.94 | 0.001 | 24.24 | 47.03 | 0.42 | 229907 | |
| 0.08 | 8.01 | 2.81 | 0.002 | 12.96 | 36.42 | 0.33 | 181789 | |
| Aq-D-SPH | ||||||||
| 0.11 | 6.91 | 9.62 | 0.001 | 17.74 | 170.63 | 1.09 | 602250 | |
| 0.08 | 7.13 | 7.19 | 0.001 | 15.82 | 113.70 | 0.82 | 437386 | |
| 0.05 | 7.48 | 4.62 | 0.007 | 14.65 | 67.69 | 0.45 | 265752 | |
| 0.07 | 7.14 | 6.14 | 0.021 | 6.70 | 41.12 | 0.24 | 142447 | |
| 0.18 | 6.88 | 7.32 | 0.022 | 3.73 | 27.29 | 0.13 | 72326 | |
| Aq-E-SPH | ||||||||
| 0.10 | 7.04 | 7.39 | 0.003 | 20.29 | 149.94 | 0.77 | 538991 | |
| 0.07 | 7.55 | 4.02 | 0.007 | 23.63 | 95.00 | 0.53 | 359610 | |
| 0.01 | 6.58 | 10.57 | 0.022 | 6.08 | 64.24 | 0.40 | 275840 | |
| 0.11 | 6.92 | 6.83 | 0.008 | 5.36 | 36.64 | 0.18 | 122193 | |
| 0.05 | 7.93 | 1.87 | 0.007 | 12.53 | 23.44 | 0.09 | 590921 |
(1) We note that Aq-D-SPH and Aq-E-SPH contain more than 100000 particles above .
3.3 The evolution of mass distribution
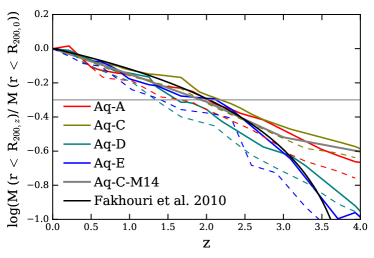
In order to gain insight into the influence of the assembly history on the halo properties, we compare the mass accretion history (MAH) of dark matter haloes within the virial radius in Fig. 5. We include the model proposed by Fakhouri et al. (2010) as a reference (see eq. 2 in the aforementioned work), who investigate the MAH from Millennium and Millennium-II simulations. Our results show that the mass is accreted earlier in the SPH haloes.
We define the formation time of each dark matter halo as the redshift at which for the first time the halo reach half of its present mass (see the grey horizontal line in Fig. 5). Our findings show that SPH haloes are assembled earlier than their DMO counterparts. This difference may be due to the impact of baryons. The SPH haloes got more concentrated earlier and in turn accrete more mass earlier than the DMO haloes. Interestingly, haloes Aq-A-SPH and Aq-C-SPH assemble before, between , than the haloes Aq-D-SPH and Aq-E-SPH which assemble at . A similar trend for the mass assembly histories can also be seen in the DMO haloes, thus Aq-A-DMO and Aq-C-DMO assemble before than Aq-D-DMO and Aq-E-DMO (see also Wang et al., 2011). We also find that the halo Aq-C-M14 assemble later than Aq-C-SPH, as a consequence of the regulation of the star formation activity (see ahead in this section). The MAH of Aq-C-M14 compared with its DMO counterpart show only slight differences in time.
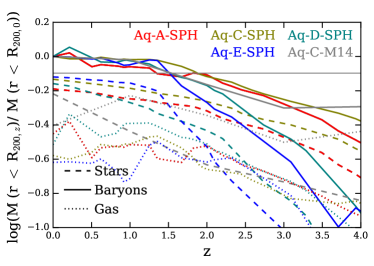
To get further insight into this process, in Fig. 6 we analyse the mass accretion history of baryons from the SPH runs for the stellar and gas components. At these galaxies have baryonic mass relative to halo mass in the range of to . At , the halos Aq-A-SPH and Aq-C-SPH present a larger fraction of stellar mass compared to Aq-D-SPH and Aq-E-SPH, while at lower redshifts () the trend flattens. This is more clear for the total baryonic content, revealing that it remains roughly constant between . Combining this result with those from Fig. 3, we find that there is a remarkable connection between the baryonic mass content and the stability of the inner dark matter halo profile in time.
For instance, we find that at the 80% of the present baryonic mass is assembled for Aq-A-SPH and Aq-C-SPH which in turn are the ones that assemble earlier and get a steady dark matter density profile at this stage. These haloes reach a stellar mass which represent % of the total baryonic mass at present. The haloes Aq-D-SPH and Aq-E-SPH reach the 80% of the present baryonic mass and % of stellar mass with respect to the present baryonic mass at . Moreover, all the haloes show that at the redshift they reach the 80% of the present baryonic mass. This redshift is also related to the time at which these haloes reach a stable dark matter density profile in the inner regions. Our findings suggest that the baryons and in particular the stellar mass in these haloes, play a key role in the evolution of the dark matter haloes. When the galaxy reaches a stellar mass compatible with % of the total baryonic mass at , the halo get a more stable and concentrated dark matter density profile. These findings are in agreement with previous results showing that stellar mass is the main ingredient that affects the dark matter distribution within the haloes (Duffy et al., 2010; Pedrosa et al., 2010; Tissera et al., 2010; Zemp et al., 2012; Di Cintio et al., 2014b; Ceverino et al., 2015; Dutton et al., 2016; Tollet et al., 2016).
The halo Aq-C-M14 shows a similar dependence with respect to the baryonic mass content and the evolution of the dark matter density profile. We find that at , 80% of the present baryonic mass is assembled, and the halo presents a steady dark matter density profile between . Furthermore, at Aq-C-M14 shows a larger fraction of gas than stars. This result is expected considering that the central galaxy is more disc-dominated than the central galaxies in the SPH haloes. We note that at Aq-C-M14 reach % gas mass of the total baryonic mass at present. This result is connected with our findings for the SPH haloes and the stellar mass component of the galaxies. Baryons appear to be fundamental for the evolution of the dark matter density profile for haloes with to at z=0.
Another important ingredient that affects the mass distribution and evolution of the dark matter haloes is the merger history. Scannapieco et al. (2009) investigate the merger history of the SPH haloes between (see Fig. 9 of the aforementioned work) and identify those satellites that enter either to the virial radius or the central 27 kpc. Their results show that any of the SPH haloes studied in this work experience major mergers, and only intermediate or minor mergers occur in all the haloes111Scannapieco et al. (2009) define as intermediate mergers when the mass ratio is , and minor mergers , where and are the stellar masses of the satellite and the central galaxy.. In particular, Aq-D-SPH experiences a larger amount of minor mergers in time, while from visual inspection we find that Aq-E-SPH experiences intermediate mergers between –4. Furthermore, all the haloes endure minor and/or intermediate mergers within the 27 kpc between . Hence, our findings suggest that the differences in the formation times and distribution of the dark matter haloes might also be affected by their different merger histories.
We also compare our findings with the stellar disc components of the central galaxies in each SPH halo presented in Scannapieco et al. (2009), in order to discuss other factors that might explain the evolution in the dark matter halo profiles. However, we do not find a dependency on this property. According to the definition adopted by Scannapieco et al. (2009), all the haloes present a stellar disc component which is more prominent for Aq-C-SPH, Aq-D-SPH and Aq-E-SPH. We note that the halo Aq-C-M14 has a much more prominent disc component than Aq-C-SPH (Marinacci et al., 2014).
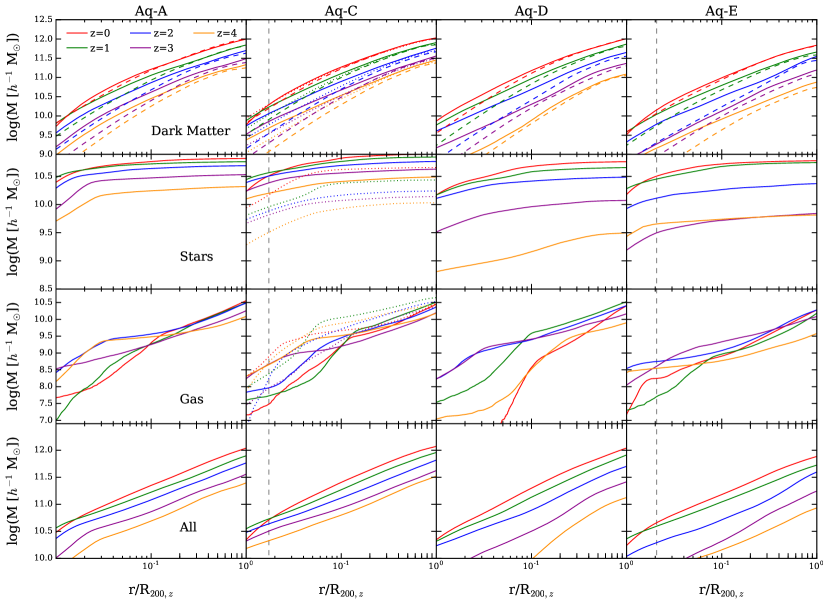
In Fig. 7 we present the cumulative mass distribution of the different components (stars, gas, dark matter and all) as a function of distance at and 4 for the SPH haloes and Aq-C-M14. The galactocentric distance is normalized by the virial radius at each redshift R200,z to compare the mass distribution in time. We also include the cumulative mass from DMO haloes. We find that dark matter concentrates and increases in the inner region of the haloes as redshift decrease for SPH and DMO haloes, as we stated previously in Fig. 5. Furthermore, the dark matter mass in the inner region is higher for the SPH haloes than for their DMO counterparts. This difference is also present in Aq-C-M14.
For the SPH runs, we find that each halo present different trends for the stellar and gas distribution, but in agreement with our findings from Fig. 6. We find that all the SPH haloes and also Aq-C-M14, have higher stellar mass content within 5%R200,z compared to the gas content.
As we stated previously, the evolution of the stellar content within the inner parts of the halo might play a role in the dark matter density profiles. Furthermore, Aq-A-SPH and Aq-C-SPH show that the stellar mass in the inner part of the haloes (within 5%R200,z) is higher than the dark matter mass in the same region, while Aq-D-SPH and Aq-E-SPH present opposite relation. This finding reinforces our assumption on the role that the stellar component has in the inner regions of the haloes. Hence, Aq-A-SPH and Aq-C-SPH assembled earlier and concentrate a significant amount of stellar mass in the inner regions which in turn determines the inner profile of the dark matter haloes, in agreement with previous results (Duffy et al., 2010; Zemp et al., 2012).
The cumulative distribution of gas in Fig. 7 do not show a definite trend for the SPH haloes. Three of them have more gas in the inner region at and moving outwards at low redshift. These variations in the gas mass can be explained due to the contribution of star formation events together with outflows produced by supernovae feedback. Also the gas accreted during merger processes affecting each halo can be relevant.
3.4 Dark matter haloes shape
N-body simulations have shown that within a CDM scenario, dark matter haloes are typically triaxial (e.g., Frenk et al., 1988; Jing & Suto, 2002; Allgood et al., 2006), with prolate shapes in the inner regions and more oblate in the outskirts. Their original morphology would be due to the haloes assemble along a preferred direction dominated by the cosmic-web environment (Avila-Reese et al., 2005; Patiri et al., 2006; Vera-Ciro et al., 2011). However, as baryons condense within the inner regions of the dark matter haloes, they dominate the potential at the centre and may affect the DM-haloes shape making them more oblate systems (Tissera & Dominguez-Tenreiro, 1998; Kazantzidis et al., 2004; Tissera et al., 2010; Butsky et al., 2016).
We investigate the shape evolution of the dark matter haloes from the SPH and DMO runs, employing the same methodology than in Tissera et al. (2010), based on the one proposed in Dubinski & Carlberg (1991). Hence, we compute the eigenvalues of the tensor of inertia and obtain the semi-axes of the triaxial ellipsoids (abc). The triaxiality of the dark matter haloes is defined as T. We adopt the following definition: the shape is oblate if , prolate if , and triaxial if . The morphology and the evolution with redshift of the DMO haloes of Aquarius project is also studied by Vera-Ciro et al. (2011) and Zhu et al. (2017) using different methodologies.
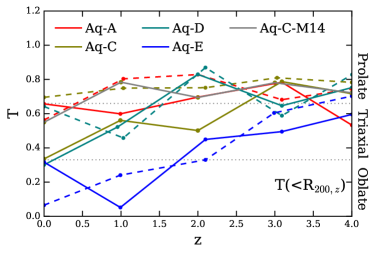
We analyse the evolution of the triaxiality within the virial radius at each redshift R200,z and within 5%R200,z, in order to investigate the inner and global shape of the haloes. We show our results at and 4 for the SPH haloes and their DMO counterparts.
On the left panel of Fig. 8, we present the triaxiality within R200,z. In agreement with Vera-Ciro et al. (2011), the shape of DMO haloes show to be prolate at high redshifts and more triaxial at low redshifts. We find that Aq-E-DMO presents a much remarkable change with redshift, compared with the rest of DMO haloes, reaching more oblate shape at . The differences between the DMO shapes and their evolution is discussed in Vera-Ciro et al. (2011) who claims that at high redshift the haloes are mainly influenced by the mass assembly and environment, with accretion of matter through filaments. At low redshift, the accretion is isotropic and the haloes evolve to oblate configuration. The mass accretion in Aq-E-DMO is more isotropic during cosmic time, which would be the reason this halo presents a more oblate shape than the others.
For the SPH haloes, we find that Aq-C-SPH, Aq-D-SPH and Aq-E-SPH are prolate at high redshift, becoming more oblate at low redshifts. This trend is slightly stronger than in the DMO counterparts for Aq-C-SPH and Aq-D-SPH. Aq-E-SPH is more triaxial than Aq-E-DMO, showing that baryons might modify the global shape in a way opposite than expected. Aq-A-SPH tend to be in general more prolate than the others.
From the comparison between Aq-C-SPH and Aq-C-M14, we find that the later is more prolate in the redshift range studied. It is interesting to note that the two haloes that contain the most prominent stellar disc (Aq-A-SPH and Aq-C-M14) have also a more prolate shape in time. Interestingly as the central galaxy is confined to the very central region of the halo, their effect into the global shape of the halo should be negligible.
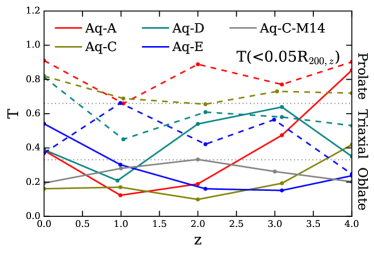
On the right panel of Fig. 8 we show the triaxiality in the inner regions of the haloes, within 5%R200,z. We find that the SPH haloes are more oblate, including also Aq-C-M14, while the DMO counterparts are more prolate in all the redshifts studied. This result is expected and in agreement with previous findings (Tissera et al., 2010; Zemp et al., 2012; Ceverino et al., 2015; Butsky et al., 2016), due to the impact of baryons in the central regions. As stellar mass condense in inner parts of the SPH haloes, the shape of the dark matter haloes tend to be more rounder and oblate. Previous works have investigated how the orbital properties of dark matter haloes change due to the baryon contraction in the central regions (Debattista et al., 2008; Zhu et al., 2017). In particular, Zhu et al. (2017) use the halo Aq-C to explore this aspect, finding different behaviour for the dark matter particle orbits when baryons are included. The presence of baryons in the inner regions as galaxy collapse to the centre, modify the dark matter trajectory from box orbits into tube or rounder orbits turning the inner shape of the halo more oblate.
We also compare our findings considering the differences and similarities of the dark matter halo profiles. Our results show that Aq-A-SPH and Aq-C-SPH present only partial similarities. These haloes show that the triaxiality reduces between and becoming more oblate, while at the trend reverts for Aq-A-SPH turning to triaxial. We find that Aq-C-M14 is more oblate in all the redshift range studied. Although Aq-C-M14 contains a much more prominent disc than Aq-C-SPH, this does not seem to affect the inner shape.
3.5 Angular momentum of dark matter
The evolution of specific angular momentum of the dark matter haloes is also influenced by the baryon collapse in the central galaxy (Pedrosa et al., 2010). We define the specific angular momentum as , where is the radial distance of the particle to the centre of mass of the halo, is their peculiar velocity and is the mass of the particle .
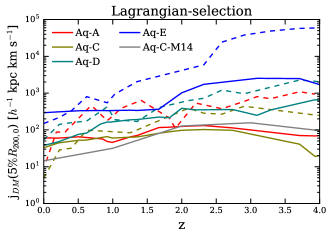
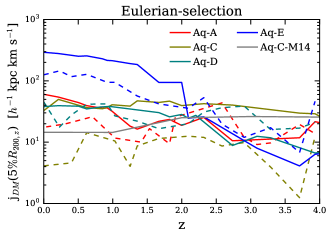
The specific angular momentum can be measured through Lagrangian-selection or Eulerian-selection. In Lagrangian-selection, we identify the particles within a selected region at and track them back in time. For the Eulerian-selection, we select a region in space or radial bin of the halo and explore how the specific angular momentum evolves as a function of time. In order to contrast the differences in the inner region of the haloes, we explore the specific angular momentum using a Lagrangian-selection that track the dark matter particles within 5%R200,0 (at ) in time, and using an Eulerian-selection within 5%R200,z (at redshift ).
We present our findings for the dark matter particles from the SPH and DMO runs in Fig. 9, using the Lagrangian-selection (top panel) and Eulerian-selection (bottom panel). For all the DMO haloes, the Lagrangian-selection shows that the specific angular momentum decreases as redshift decrease, reducing it around % between . This trend indicates that the dark matter halo particles loss angular momentum in the inner regions, as haloes concentrate in agreement with our findings from the dark matter halo profiles. In the case of the SPH haloes, we find two different behaviours in the Lagrangian-selection. The specific angular momentum of Aq-A-SPH and Aq-C-SPH is approximately constant, while for Aq-D-SPH and Aq-E-SPH decreases with redshift. The differences can be explained since Aq-A-SPH and Aq-C-SPH assemble earlier and the stellar mass within the inner regions is large enough to stabilize the halo. To get more insight about this trend, we also compute the percentage of particles from the Lagrangian-selection that are within 5%R200,0 as a function of redshift. We find that for Aq-A-SPH and Aq-C-SPH around of the dark matter particles tracked in the Lagrangian-selection are already within 5%R200,0 at higher redshifts. This explains why the specific angular momentum of these haloes is preserved in time. For the halo Aq-D-SPH we find that the percentage of particles within the 5%R200,0 increase as redshift decrease, as halo concentrates to the inner region of the halo. The halo Aq-E-SPH show also a similar trend than Aq-D-SPH between mainly due to the impact of an intermediate merger that occur between . For this halo, at redshifts we find that the specific angular momentum is preserved, and the number of dark matter particles from the Lagrangian-selection that are within the 5%R200,0 is roughly %. These results are in agreement with the evolution of dark matter halo profiles and the cumulative mass distribution presented in Fig. 3 and Fig. 7, respectively. In general terms for the Lagrangian-selection, we find that the DMO haloes present a higher specific angular momentum than their SPH counterparts. These differences might be explained since the SPH haloes assembled earlier than the DMO haloes, as a consequence of their interaction with the baryonic matter in the central region of the SPH haloes (Pedrosa et al., 2010). We also show the specific angular momentum for the halo Aq-C-M14. For the Lagrangian-selection, our results present slight variations but a roughly constant specific angular momentum.
Recently, Zavala et al. (2016) investigate the evolution of the specific angular momentum and their connection with the morphology of the galaxies, following a Lagrangian-selection of particles within 10% the virial radius at . Their results indicate that after turnaround (), the inner dark matter haloes lose 90% of its specific angular momentum. This reduction might be due to the transference of angular momentum to the outskirts of the halo during its assembly history, dominated by substructures merging onto the halo (see also, Frenk et al., 1985; Zavala et al., 2008). These results are in agreement with our findings for Aq-D-SPH and Aq-E-SPH which in turn are the haloes that have a much more significant merger history.
The Eulerian-selection shows that the specific angular momentum slightly increases as redshift decreases for Aq-A-SPH, Aq-C-SPH and Aq-D-SPH, while the halo Aq-E-SPH show a more significant change possibly due to the intermediate mergers it experiences between . The halo Aq-C-M14 show a similar trend than the Lagrangian-selection method. For the DMO counterparts, we do not find a clear trend for the specific angular momentum. Hence, the results from the Eulerian-selection method are much difficult to interpret since different number of dark matter particles are mapped as a function of redshift.
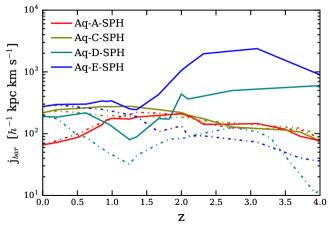
In Fig. 10 we show the specific angular momentum for the baryons following the two same methods implemented for dark matter particles. From the Lagrangian-selection, we find that the baryons within Aq-D-SPH and Aq-E-SPH lose % of their specific angular momentum between , while Aq-A-SPH and Aq-C-SPH do not present significant variations. Zavala et al. (2016) discuss the differences of the specific angular momentum of baryons according to the morphology of the galaxy, finding that bulge-dominated galaxies loss in average 80% of its angular momentum, while disc-dominated galaxies loss 50%. According to the definition adopted by Zavala et al. (2016), the four central galaxies in the SPH haloes are bulge-dominated (galaxies with are bulge-dominated, where is total stellar mass in the bulge, and is the total stellar mass; otherwise, the galaxies are disc-dominated). The results obtained from Aq-D-SPH and Aq-E-SPH are in agreement with these findings considering the errors, while Aq-A-SPH and Aq-C-SPH do not follow this trend. The Eulerian-selection present a slight increase of the specific angular momentum for Aq-D-SPH and Aq-E-SPH, showing that baryons collapse to the centre in agreement with the results from Lagrangian-selection. The haloes Aq-A-SPH and Aq-C-SPH show slight variations, and similar results between Eulerian and Lagrangian selection.
3.6 The role of outflows and inflows
Mixed processes behind the galaxy formation and evolution such as gas inflow and outflows can impact the inner region of the dark matter haloes (Pedrosa et al., 2009, 2010; Governato et al., 2012; Pontzen & Governato, 2014; Dutton et al., 2016; Tollet et al., 2016; Zhu et al., 2016). Furthermore, different reports show that their impact depends on the mass of the dark matter haloes and the star formation rate of the galaxies within them. For instance, dwarf galaxies present cores due to starbursts and subsequent supernovae feedback may harshly impact in the inner regions producing an irreversible effect (Pontzen & Governato, 2014). On the other hand, many reports suggest that there is no core in Milky-Way type haloes, mainly due to the fact that the outflows may not be strong enough to modify the potential wells of such dark matter haloes. Nonetheless, high-resolution simulations are needed to study this feature in detail (Macciò et al., 2012; Mollitor et al., 2015).
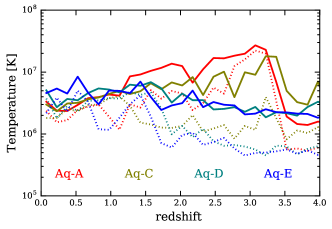
In this section we discuss the impact of baryons on the dark matter haloes, by analysing two aspects: the galactic outflows produced by supernovae feedback, and the baryonic contraction within the SPH haloes. The cosmic star formation rate of the SPH runs implemented in this work are analysed in Scannapieco et al. (2009) (see Fig. 5). Scannapieco et al. (2009) show that Aq-A-SPH and Aq-C-SPH have a peak of star formation before while Aq-D-SPH and Aq-E-SPH show this peak at a later time. The star-forming bursts produce an increase of the SNe feedback sources which in turn modify the temperature of the surrounding gas and produce outflows. The sub-grid multiphase model implemented in the SPH runs considers two different phases for the gas particles named cold and hot. According to the SNe energy that a cold gas particle receives and accumulates, it can be promoted to a hot gas phase particle where the energy received is converted into internal energy that at the same time, can produce mass-loaded galactic winds (see, Scannapieco et al., 2005, 2006, for further details). Therefore, the promoted gas particles can give us information about the galactic outflows and at the same time, the star-forming evolution of the galaxy. In Fig. 11 we show the temperature of the promoted gas particles dumped to the hot phase, for the central galaxies within the SPH haloes, as a function of redshift. We present our results from the four haloes for the full sample of promoted particles (dotted lines), and for the promoted gas particles with temperatures above T K (filled lines). In agreement with the results from Scannapieco et al. (2009), we find that the promoted gas particles from the galaxies in Aq-A-SPH and Aq-C-SPH have a main burst between , as consequence of the prior star formation in these haloes. The haloes Aq-D-SPH and Aq-E-SPH show an increase of the mean temperature at lower redshifts, around which is not significantly important compared with the star-forming bursts in Aq-A-SPH and Aq-C-SPH. These findings are in agreement with the different stellar mass evolution found in Fig.6 and Fig. 7.
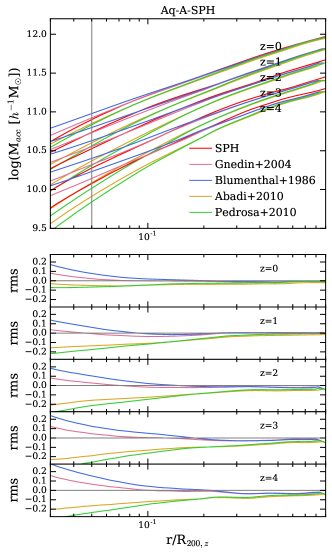
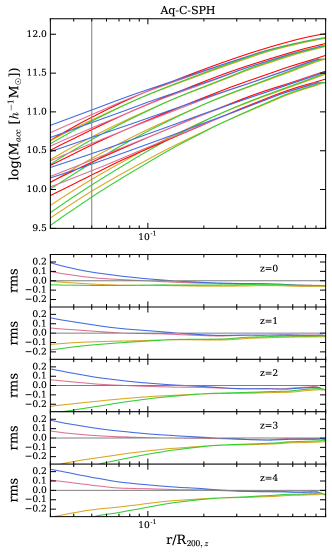
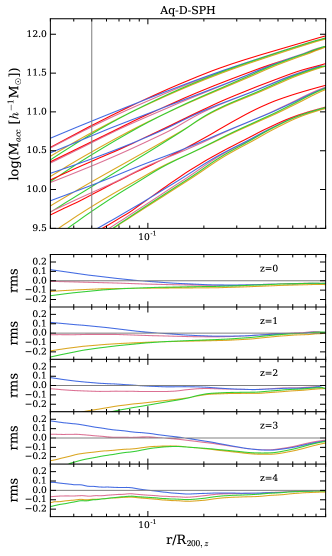
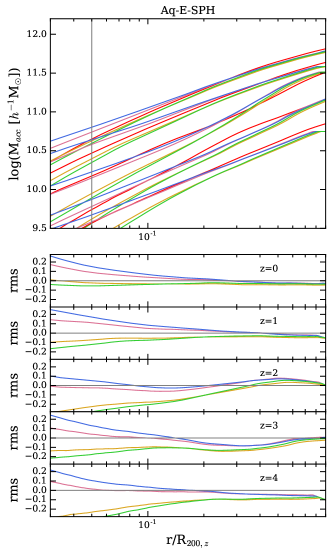
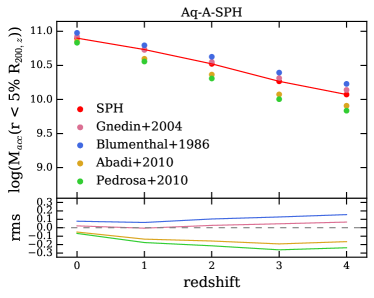
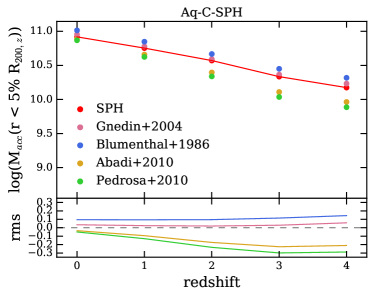
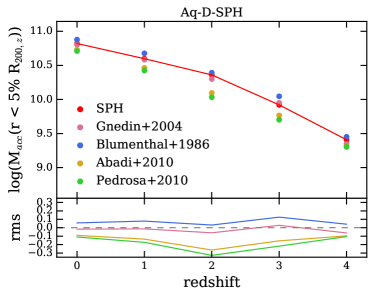
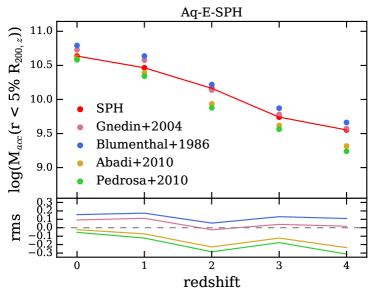
To investigate the contraction of the dark matter haloes due to galaxy assembly, we implement the fiducial adiabatic contraction (AC) model developed by Blumenthal et al. (1986), the alternative proposed by Gnedin et al. (2004) and two empirical models presented in Abadi et al. (2010), and Pedrosa et al. (2010). The adiabatic contraction (AC) model is based on the fact that the condensation of baryons during galaxy assembly affects the mass profile of the dark matter halo. The AC assume that the system changes its gravitational potential slowly which in turn can be approximated as adiabatic. In the fiducial model, the gravitational potential is symmetric, the orbits are circular and the angular momentum of the particles is conserved. Hence, the fiducial AC from Blumenthal et al. (1986) assumes that the quantity is conserved. Gnedin et al. (2004) propose a modified AC model based on conservation of the quantity , where is the mass enclosed within the orbit-averaged radius. Other alternative (empirical) models are those proposed by Abadi et al. (2010) and Pedrosa et al. (2010), following empirical formulas to reproduce the results from different cosmological simulations at . In Fig. 12 we implement the aforementioned AC models to the Aquarius haloes at redshifts 1, 2, 3 and 4, by computing the dark matter mass in the inner region, within 5 percent the virial radius at each redshift (5%R200,z). We find that between , the haloes Aq-A-SPH and Aq-C-SPH show a smaller contraction than Aq-D-SPH and Aq-E-SPH. This effect might be due to the outflows produced in Aq-A-SPH and Aq-C-SPH as we show in Fig. 11.
In Fig. 12 we find that the model proposed by Gnedin et al. (2004) is the one that best match the dark matter mass in the inner regions of the SPH haloes in all the redshift range studied. The fiducial model from Blumenthal et al. (1986) shows an excess of the dark matter mass in the inner regions, suggesting that this model overpredicts the effect of the baryons. The models proposed by Abadi et al. (2010) and Pedrosa et al. (2010) have a good agreement at but deviates and underpredicts the dark matter mass within the inner regions as redshift increases. Hence, our findings suggest that the model from Gnedin et al. (2004) is the one that best reproduces the impact of baryons in the inner regions of the SPH Aquarius haloes between .
Recently, Dutton et al. (2016) investigate a sample of 100 haloes at between M- M⊙, finding that the halo response is correlated with the star formation efficiency and the compactness of the stellar system (see also Pedrosa et al., 2009, 2010). In particular, their results suggest that galaxies with high star formation efficiencies () ), which is the case of our SPH sample, follow a contraction that is well described by Gnedin et al. (2004). This result is in agreement with our findings.
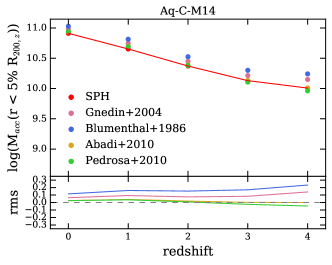
The halo Aq-C-M14 shows a better agreement with the empirical models of Abadi et al. (2010) and Pedrosa et al. (2010) for all the redshift range studied. We also compare the mass distribution of the four AC models implemented, between 3%R200,z–R200,z finding similar results than those obtained for the inner regions (see Appendix A).
4 Summary and conclusions
We have investigated the impact of baryons onto four Milky Way-type dark matter haloes from the Aquarius project, between . In order to disentangle the effect of baryons, we compare the SPH runs of Scannapieco et al. (2009) with the corresponding DMO runs. The SPH run includes star formation, a multiphase model for the gas component with metal-dependent cooling, and phase-dependent treatments of SNe feedback and chemical enrichment. We note here, that some of the SPH haloes have a higher stellar mass to halo mass content than the values typically reported by abundance matching techniques (see Fig. 1). Hence the galaxies within these haloes are likely representing a particular subset of real galaxies. Hence, in order to check the effect of sub-grid physics and numerical artefacts, we also analyse a version of Aq-C run by (Marinacci et al., 2014) using the arepo code. This version properly reproduce the results reported by abundance matching techniques at .
As expected, we find that the evolution of the dark matter haloes is affected by the presence of baryons. For the SPH haloes, we fit the dark matter halo profiles at with the model proposed by Di Cintio et al. (2014a) which accounts for the impact of baryons considering that three of the parameters of the functional form depend on the star formation efficiency. Since the star formation efficiencies of the SPH haloes are higher than the ranges analysed by Di Cintio et al. (2014a), we relax the constrains that the model has on the concentration and the halo mass. We propose two methods to implement this profile, first by fitting the concentration, and second by fitting the concentration and the halo mass. Our results show that the model proposed by Di Cintio et al. (2014a) present good agreement in the inner parts, but overpredicts the density in the outskirts of some Aquarius haloes (see Fig. 2). This might be due to the impact of recent mergers in the outer regions of the haloes.
We also fit the SPH haloes at and 4 using the Einasto profile. Our results show that all the SPH haloes are slightly better fitted by the Einasto model than Di Cintio et al. (2014a). However it is important to bear in mind that Einasto contains an extra free parameter. Regardless, both the DC14 and the Einasto models provide a very good agreement on recovering the correct halo mass, with 1-10 percent differences between the true mass and the fit mass.
We find differences in the evolution on the dark matter halo profiles for the SPH haloes. Two of the haloes present weak evolution in the range studied (Aq-A-SPH and Aq-C-SPH), while the other two show a significant evolution with redshift between (Aq-D-SPH and Aq-E-SPH, see Fig. 3). The halo run with a different code and subgrid scheme (Aq-C-M14) shows similar evolution than Aq-C-SPH.
The mass accretion history (MAH) of the dark matter haloes shows that SPH haloes assemble earlier than their DMO counterparts. This can be explained since baryons make the haloes more concentrated and in turn more massive. From the MAH of dark matter and baryons in the SPH haloes, we find that there is a connection between the mass assembly and the evolution of the dark matter profiles. Hence, the SPH haloes reach stable dark matter profiles in time when they attain the 80% of their present baryonic mass. The SPH haloes also show that % of the baryonic mass at present is composed by stars at this stage (see Fig. 5 and 6). This amount of baryonic mass is achieved earlier for the SPH haloes that show slight evolution of the dark matter density profiles. This is also evidenced in the cumulative stellar mass distribution which is different between these two set of haloes. Hence, our findings suggest that the stellar mass content is a key ingredient that shapes and makes the internal region of the haloes more stable. Furthermore, our results confirm that the stellar mass content depends on the halo assembly history. For the halo Aq-C-M14 we also find a close connection between the MAH, the amount of baryons, and the evolution of the dark matter density profiles. This halo reaches a stable dark matter profile at the time it attains the 80% of the present baryonic mass. This is in agreement with the findings for the SPH runs although the time at which this fraction is attained vary with the systems, for different assembly histories and different subgrid physics. The main difference with respect to the SPH haloes is that Aq-C-M14 is composed mainly by gas at high redshift, reaching 60% gas mass of the present baryonic mass at . This is the expected behaviour because of the more efficient feedback which contribute to the regulation of the star formation activity, delaying it towards lower redshifts. Nonetheless at high redshift most of the current models overpredicts the amount of stellar mass within the haloes. This aspect should be tackled in the future (Aumer et al., 2013; Artale et al., 2015; Grand et al., 2017, see).
The global shape of the dark matter haloes show that both DMO and SPH counterparts are more prolate at high redshift and turn to triaxial/oblate at low redshift. The inner shape of the haloes present a clear different behaviour, finding that SPH haloes are more oblate than their DMO counterparts. This trend is also present in Aq-C-M14. This result is expected due to the impact of baryons in the inner region (see Fig. 8).
We also investigate the specific angular momentum in the inner region of these haloes within five percent the virial radius through Lagrangian and Eulerian selection. In particular, for the Lagrangian-selection, the DMO haloes loss % of its angular momentum between to . This result indicates that dark matter halo particles loss angular momentum and concentrate in the central region of the haloes, in agreement with our findings for the halo profiles. The SPH haloes that reach stable dark matter profiles earlier show that the specific angular momentum is conserved in time in the Lagrangian-selection. The haloes that show a contraction of the dark matter profile present a loss of the specific angular momentum in time. However, this loss is lower than what we find for their DMO counterparts. The specific angular momentum for baryons from Lagrangian-selection show similar trends than those obtained from the dark matter particles, showing that the specific angular momentum is roughly conserved when the SPH haloes present stable dark matter density profiles. The halo Aq-C-M14 show also that the specific angular momentum in the inner region is roughly constant, with a slight drop at low redshift.
To quantify the impact of baryons onto the contraction of the dark matter haloes, we implement four adiabatic contraction models. The fiducial one from Blumenthal et al. (1986) and the empirical models from Gnedin et al. (2004), Pedrosa et al. (2010) and Abadi et al. (2010). Our findings show that the model proposed by Gnedin et al. (2004) is the best representation of the inner mass (5%R200,z) content of the SPH haloes between . However, this is not the case for Aq-C-M14 which is in better agreement with Pedrosa et al. (2010) and Abadi et al. (2010) in all the redshift range studied. This is due to the different evolution of the stellar mass content in the Aq-C-M14 compared with the SPH haloes, since the star formation activity is more strongly regulated and delayed to lower redshifts.
We have shown that the baryonic mass content within the central region of the dark matter haloes is a key ingredient in determining the stability and concentration of the haloes. We find that how these baryons are put together is also an important aspect. In the future, a statistical sample should be used to quantify in detail these differences.
Acknowledgement
We would like to thank Aaron Ludlow and Julio Navarro for providing access to the dark matter only runs of the Aquarius project, and to Facundo Gomez, Volker Springel and Federico Marinacci for providing the snapshots of the run of Aq-C-4 corresponding to Marinacci et al. (2014). We would also like to thank Cecilia Scannapieco for useful discussions. The project was partially supported by Fondecyt Regular 1153305 and Nucleo Milky Way Project of UNAB, and by PICT 2011-0959 and PIP 2012-0396 (Mincyt, Argentina). The authors acknowledge the Southern Astrophysics Network Proyecto Redes 150078 (Conicyt-Chile) for partial financial support. MCA acknowledges financial support from the Austrian National Science Foundation through FWF stand-alone grant P31154-N27. ADC acknowledges financial support from a Marie-Skłodowska-Curie Individual Fellowship grant, H2020-MSCA-IF-2016 Grant agreement 748213 DIGESTIVO.
References
- Abadi et al. (2010) Abadi, M. G., Navarro, J. F., Fardal, M., Babul, A., & Steinmetz, M. 2010, MNRAS, 407, 435
- Abazajian et al. (2014) Abazajian, K. N., Canac, N., Horiuchi, S., & Kaplinghat, M. 2014, Phys. Rev. D, 90, 023526
- Allgood et al. (2006) Allgood, B., Flores, R. A., Primack, J. R., et al. 2006, MNRAS, 367, 1781
- Artale et al. (2015) Artale, M. C., Tissera, P. B., & Pellizza, L. J. 2015, MNRAS, 448, 3071
- Aumer et al. (2013) Aumer, M., White, S. D. M., Naab, T., & Scannapieco, C. 2013, MNRAS, 434, 3142
- Avila-Reese et al. (2005) Avila-Reese, V., Colín, P., Gottlöber, S., Firmani, C., & Maulbetsch, C. 2005, ApJ, 634, 51
- Behroozi et al. (2018) Behroozi, P., Wechsler, R., Hearin, A., & Conroy, C. 2018, ArXiv e-prints [arXiv:1806.07893]
- Behroozi et al. (2013) Behroozi, P. S., Wechsler, R. H., & Conroy, C. 2013, ApJ, 770, 57
- Blumenthal et al. (1986) Blumenthal, G. R., Faber, S. M., Flores, R., & Primack, J. R. 1986, ApJ, 301, 27
- Brook & Di Cintio (2015) Brook, C. B. & Di Cintio, A. 2015, MNRAS, 453, 2133
- Bryan et al. (2013) Bryan, S. E., Kay, S. T., Duffy, A. R., et al. 2013, MNRAS, 429, 3316
- Bryan et al. (2012) Bryan, S. E., Mao, S., Kay, S. T., et al. 2012, MNRAS, 422, 1863
- Butsky et al. (2016) Butsky, I., Macciò, A. V., Dutton, A. A., et al. 2016, MNRAS, 462, 663
- Ceverino et al. (2015) Ceverino, D., Primack, J., & Dekel, A. 2015, MNRAS, 453, 408
- Chan et al. (2015) Chan, T. K., Kereš, D., Oñorbe, J., et al. 2015, MNRAS, 454, 2981
- Cooper et al. (2010) Cooper, A. P., Cole, S., Frenk, C. S., et al. 2010, MNRAS, 406, 744
- Debattista et al. (2008) Debattista, V. P., Moore, B., Quinn, T., et al. 2008, ApJ, 681, 1076
- Debattista & Sellwood (1998) Debattista, V. P. & Sellwood, J. A. 1998, ApJ, 493, L5
- Dekel et al. (2003) Dekel, A., Devor, J., & Hetzroni, G. 2003, MNRAS, 341, 326
- Di Cintio et al. (2014a) Di Cintio, A., Brook, C. B., Dutton, A. A., et al. 2014a, MNRAS, 441, 2986
- Di Cintio et al. (2014b) Di Cintio, A., Brook, C. B., Macciò, A. V., et al. 2014b, MNRAS, 437, 415
- Diemand et al. (2005) Diemand, J., Zemp, M., Moore, B., Stadel, J., & Carollo, C. M. 2005, MNRAS, 364, 665
- Donato et al. (2009) Donato, F., Gentile, G., Salucci, P., et al. 2009, MNRAS, 397, 1169
- Dubinski & Carlberg (1991) Dubinski, J. & Carlberg, R. G. 1991, ApJ, 378, 496
- Duffy et al. (2010) Duffy, A. R., Schaye, J., Kay, S. T., et al. 2010, MNRAS, 405, 2161
- Dutton et al. (2016) Dutton, A. A., Macciò, A. V., Dekel, A., et al. 2016, MNRAS, 461, 2658
- Einasto (1965) Einasto, J. 1965, Trudy Astrofizicheskogo Instituta Alma-Ata, 5, 87
- El-Zant et al. (2001) El-Zant, A., Shlosman, I., & Hoffman, Y. 2001, ApJ, 560, 636
- El-Zant et al. (2016) El-Zant, A. A., Freundlich, J., & Combes, F. 2016, MNRAS, 461, 1745
- Errani et al. (2017) Errani, R., Peñarrubia, J., Laporte, C. F. P., & Gómez, F. A. 2017, MNRAS, 465, L59
- Fakhouri et al. (2010) Fakhouri, O., Ma, C.-P., & Boylan-Kolchin, M. 2010, MNRAS, 406, 2267
- Frenk et al. (1988) Frenk, C. S., White, S. D. M., Davis, M., & Efstathiou, G. 1988, ApJ, 327, 507
- Frenk et al. (1985) Frenk, C. S., White, S. D. M., Efstathiou, G., & Davis, M. 1985, Nature, 317, 595
- Gnedin et al. (2004) Gnedin, O. Y., Kravtsov, A. V., Klypin, A. A., & Nagai, D. 2004, ApJ, 616, 16
- Governato et al. (2012) Governato, F., Zolotov, A., Pontzen, A., et al. 2012, MNRAS, 422, 1231
- Grand et al. (2017) Grand, R. J. J., Gómez, F. A., Marinacci, F., et al. 2017, MNRAS, 467, 179
- Guo et al. (2010) Guo, Q., White, S., Li, C., & Boylan-Kolchin, M. 2010, MNRAS, 404, 1111
- Jing & Suto (2002) Jing, Y. P. & Suto, Y. 2002, ApJ, 574, 538
- Katz et al. (2017) Katz, H., Lelli, F., McGaugh, S. S., et al. 2017, MNRAS, 466, 1648
- Kazantzidis et al. (2004) Kazantzidis, S., Mayer, L., Mastropietro, C., et al. 2004, ApJ, 608, 663
- Komatsu et al. (2009) Komatsu, E., Dunkley, J., Nolta, M. R., et al. 2009, ApJS, 180, 330
- Ludlow et al. (2014) Ludlow, A. D., Navarro, J. F., Angulo, R. E., et al. 2014, MNRAS, 441, 378
- Macciò et al. (2012) Macciò, A. V., Stinson, G., Brook, C. B., et al. 2012, ApJ, 744, L9
- Marinacci et al. (2014) Marinacci, F., Pakmor, R., & Springel, V. 2014, MNRAS, 437, 1750
- Mollitor et al. (2015) Mollitor, P., Nezri, E., & Teyssier, R. 2015, MNRAS, 447, 1353
- Mosconi et al. (2001) Mosconi, M. B., Tissera, P. B., Lambas, D. G., & Cora, S. A. 2001, MNRAS, 325, 34
- Moster et al. (2018) Moster, B. P., Naab, T., & White, S. D. M. 2018, MNRAS, 477, 1822
- Navarro et al. (1997) Navarro, J. F., Frenk, C. S., & White, S. D. M. 1997, ApJ, 490, 493
- Navarro et al. (2010) Navarro, J. F., Ludlow, A., Springel, V., et al. 2010, MNRAS, 402, 21
- Oh et al. (2008) Oh, S.-H., de Blok, W. J. G., Walter, F., Brinks, E., & Kennicutt, Jr., R. C. 2008, AJ, 136, 2761
- Patiri et al. (2006) Patiri, S. G., Cuesta, A. J., Prada, F., Betancort-Rijo, J., & Klypin, A. 2006, ApJ, 652, L75
- Pedrosa et al. (2009) Pedrosa, S., Tissera, P. B., & Scannapieco, C. 2009, MNRAS, 395, L57
- Pedrosa et al. (2010) Pedrosa, S., Tissera, P. B., & Scannapieco, C. 2010, MNRAS, 402, 776
- Pontzen & Governato (2014) Pontzen, A. & Governato, F. 2014, Nature, 506, 171
- Power et al. (2003) Power, C., Navarro, J. F., Jenkins, A., et al. 2003, MNRAS, 338, 14
- Read & Gilmore (2005) Read, J. I. & Gilmore, G. 2005, MNRAS, 356, 107
- Salucci & Burkert (2000) Salucci, P. & Burkert, A. 2000, ApJ, 537, L9
- Scannapieco et al. (2005) Scannapieco, C., Tissera, P. B., White, S. D. M., & Springel, V. 2005, MNRAS, 364, 552
- Scannapieco et al. (2006) Scannapieco, C., Tissera, P. B., White, S. D. M., & Springel, V. 2006, MNRAS, 371, 1125
- Scannapieco et al. (2009) Scannapieco, C., White, S. D. M., Springel, V., & Tissera, P. B. 2009, MNRAS, 396, 696
- Schaller et al. (2015) Schaller, M., Frenk, C. S., Bower, R. G., et al. 2015, MNRAS, 451, 1247
- Schaller et al. (2016a) Schaller, M., Frenk, C. S., Fattahi, A., et al. 2016a, MNRAS, 461, L56
- Schaller et al. (2016b) Schaller, M., Frenk, C. S., Theuns, T., et al. 2016b, MNRAS, 455, 4442
- Spergel et al. (2003) Spergel, D. N., Verde, L., Peiris, H. V., et al. 2003, ApJS, 148, 175
- Springel (2005) Springel, V. 2005, MNRAS, 364, 1105
- Springel et al. (2008) Springel, V., Wang, J., Vogelsberger, M., et al. 2008, MNRAS, 391, 1685
- Springel et al. (2005) Springel, V., White, S. D. M., Jenkins, A., et al. 2005, Nature, 435, 629
- Springel et al. (2001) Springel, V., Yoshida, N., & White, S. D. M. 2001, New A, 6, 79
- Stadel et al. (2009) Stadel, J., Potter, D., Moore, B., et al. 2009, MNRAS, 398, L21
- Tissera & Dominguez-Tenreiro (1998) Tissera, P. B. & Dominguez-Tenreiro, R. 1998, MNRAS, 297, 177
- Tissera et al. (2010) Tissera, P. B., White, S. D. M., Pedrosa, S., & Scannapieco, C. 2010, MNRAS, 406, 922
- Tollet et al. (2016) Tollet, E., Macciò, A. V., Dutton, A. A., et al. 2016, MNRAS, 456, 3542
- Vera-Ciro et al. (2011) Vera-Ciro, C. A., Sales, L. V., Helmi, A., et al. 2011, MNRAS, 416, 1377
- Vogelsberger et al. (2009) Vogelsberger, M., White, S. D. M., Mohayaee, R., & Springel, V. 2009, MNRAS, 400, 2174
- Wang et al. (2011) Wang, J., Navarro, J. F., Frenk, C. S., et al. 2011, MNRAS, 413, 1373
- White & Rees (1978) White, S. D. M. & Rees, M. J. 1978, MNRAS, 183, 341
- Zavala et al. (2016) Zavala, J., Frenk, C. S., Bower, R., et al. 2016, MNRAS, 460, 4466
- Zavala et al. (2008) Zavala, J., Okamoto, T., & Frenk, C. S. 2008, MNRAS, 387, 364
- Zemp et al. (2012) Zemp, M., Gnedin, O. Y., Gnedin, N. Y., & Kravtsov, A. V. 2012, ApJ, 748, 54
- Zhu et al. (2017) Zhu, Q., Hernquist, L., Marinacci, F., Springel, V., & Li, Y. 2017, MNRAS, 466, 3876
- Zhu et al. (2016) Zhu, Q., Marinacci, F., Maji, M., et al. 2016, MNRAS, 458, 1559
Appendix A Adiabatic contraction
In Fig. 14, we present the mass distribution of the SPH haloes between 3%R200,z–R200,z compared with four halo contraction models (Blumenthal et al. (1986) blue lines, Gnedin et al. (2004) pink lines, and empirical models of Abadi et al. (2010) orange lines, and Pedrosa et al. (2010) green lines) at , 1, 2, 3, and 4. The distances are normalized by the virial radius at each redshift, R200,z. We also include the residuals between the models and the mass distribution obtained from the SPH haloes. Vertical grey indicates the 5%R200,z which is the distance adopted in this work to explore the inner regions of the halo. As we state in Sec. 3.6, at the models proposed by Abadi et al. (2010) and Pedrosa et al. (2010) are in good agreement with the mass distribution of the SPH haloes. However, the model from Gnedin et al. (2004) is the best reproducing the mass distribution in all the redshift range studied.