Crystallographic relationships of T-/S-phase aggregates in an Al–Cu–Mg–Ag alloy
Abstract
T-(Al20Cu2Mn3) phase dispersoids are important for limiting recovery and controlling grain growth in Al-Cu alloys. However, these dispersoids can also reduce precipitation hardening by acting as heterogeneous nucleation sites and may lead to increased susceptibility towards pitting corrosion when galvanically coupled with S-(Al2CuMg) phase precipitates. The interplay between T- and S-phases is therefore important for understanding their effect on the mechanical and electrochemical properties of Al-Cu-Mg alloys. Here, the crystallographic relationships between the T-phase, S-phase, and surrounding Al matrix were investigated in an Al-1.31Cu-1.14Mg-0.13Ag-0.10Fe-0.28Mn (at.%) alloy by combining scanning precession electron diffraction with misorientation analysis in 3-dimensional axis-angle space and correlated high-resolution transmission electron microscopy. Orientation relationships are identified between all three phases, revealing S-T orientation relationships for the first time. Differences in S-Al orientation relationships for precipitates formed at T-phase interfaces compared to their non-interfacial counterparts were also identified. These insights provide a comprehensive assessment of the crystallographic relationships in T-/S-phase aggregates, which may guide future alloy design.
keywords:
Aluminium Alloy , Orientation Relationships , Dispersoid-Precipitate Aggregate , ACOM-TEM , Scanning Precession Electron Diffraction1 Introduction
2xxx series Al alloys are Cu-containing age-hardenable alloys widely used in the aerospace industry due to their high strength-to-weight ratio, good formability, and high damage tolerance [1, 2]. Alloys based on the Al-Cu-Mg system are particularly common owing to their high fracture toughness and fatigue resistance [3, 4]. Al-Cu-Mg alloys obtain most of their strength from a distribution of atomic clusters, Guinier–-Preston-–Bagaryatsky (GPB) zones [5], and precipitates of different metastable phases that are formed throughout the Al matrix during heat treatment. Commercial alloys typically have an atomic ratio Cu:Mg1 which eventually leads to formation of equilibrium S-(AlCuMg) and/or -(AlCu) precipitates preceded by their precursor phases [6, 7, 8, 9]. Ag additions to this alloy system have been found to increase strength by modifying and enhancing the age hardening response [10, 11, 12]. This is achieved by promoting -(AlCu) phase formation over ’(AlCu) [13, 14] leading to a denser distribution of finer precipitates. Mn additions reduce the detrimental effects on mechanical properties from Fe impurities by forming dispersoids during high temperature homogenisation. In Al-Cu-Mg alloys the main dispersoid phase is T (Al20Cu2Mn3, Bbmm, a = 23.98 Å, b = 12.54 Å, c = 7.66 Å [15]) which effectively pins grain boundaries, limits recrystallisation, accumulates dislocations, and resists recovery after forming [16, 17, 18]. The T-phase dispersoid can increase the sensitivity to micro-crack initiation but can on the other hand prevent fast and continuous crack propagation [19]. The T-Al interface can act as a heterogeneous nucleation site for phases such as , (), and S(S′) [20, 21, 22] creating dispersoid aggregates and reducing normal intra-granular precipitation.
Although the contribution of Cu and Mg in precipitation of various phases results in a higher strength and mechanical performance, the phases formed generally lead to a significant drop in corrosion resistance [4]. Extensive research has been devoted to study different aspects of corrosion in these alloys, including localized corrosion, galvanic coupling between phases and stress-corrosion cracking [23, 24, 25, 26, 27]. Several studies point out the S- and T-phase as most important particularly with regards to initiation of pitting corrosion, especially when the two phases are in contact forming a galvanic couple [28].
T-phase dispersoids tend to adopt rod-like morphologies with their long axes along directions. In cross-section, the morphology is typically a lath or a shell-shaped structure [29]. Internal faulting, particularly twinning, is common, and successive twinning transforms the cross-section from a lath to a shell-shaped structure [30].
The crystal structure of the S-phase has been subject to much debate but there is now broad consensus around the Perlitz-Westgren structure (Al2CuMg, Cmcm, a = 4.00 Å, b = 9.23 Å, c = 7.14 Å) [31, 32]. The crystal structures of the T- and S-phase are shown in Fig. 1.

Crystallographic orientation relationships (ORs) between the T-phase, S-phase, and Al matrix, as well as the internal structure of the T-phase, have been been the subject of numerous studies across a range of compositions and thermo-mechanical treatments. Reported ORs are summarised in Table 1 and Table 2. Three ORs have been observed between the T-phase and Al matrix [33], all with the [010] axis aligned along but with different coincident planes. When viewed along the axis, the twinning is seen as a rotation about the axis with {101} as the twin plane, which can yield structures exhibiting pseudo 10-fold symmetry [34].
Different crystallographic relationships between the S-phase and Al matrix have been reported, the most frequent of which is that discovered by Bagaryatsky [35] (OR(I) in Table 2) corresponding to type I S-phase.
However, rotations of several degrees away from this S-Al OR are observed. This has led several authors [9, 36, 37, 38, 39] to distinguish a second OR (e.g. OR(II-IV) in Table 2) rotated by 3∘ to as much as 9∘ about the [100]//[001] axis away from OR(I), and is potentially associated with a second type of S-phase (type II). It has been suggested that the two ORs may be extrema of a continuous or near continuous distribution of rotation angles [37]. The rotation has been rationalized in terms of a competition between elastic strains due to lattice mismatch between coherent interfaces formed at each OR [38]. Some studies found that type II S-phase grows at the expense of type I, and that type II is the more stable phase [9, 40]. Studies conducted by Styles et al. [40, 41] concluded that there are no significant differences in crystal structure between the two types, but that type I has a deficiency of Cu which may explain observed variations in lattice parameters between the two types.
S-phases adopting OR(I) tend to be lath-like with atomically sharp interfaces, whereas precipitates following the second OR tend to be rod-shaped with stepped interfaces [39]. The ratio of type I relative to type II S-phases is among others dependent on ageing times and temperature [40], as well as quenching rate from homogenisation and whether cold work is applied prior to ageing [9, 42]. S-T ORs and S-Al ORs for S-phase precipitates nucleated on T-phase dispersoids have been less studied [20].
In this work, scanning precession electron diffraction (SPED) is applied in combination with misorientation analysis in axis-angle space and high-resolution imaging to understand the structure of dispersoid aggregates comprised of T-phase dispersoids and S-phase precipitates surrounded by the Al matrix. In addition, a comparison is made between S-Al misorientations for S-phase precipitates decorating T-phase dispersoids and those located away from T-phase interfaces. Knowledge of these crystallographic relationships will enhance understanding of the effect of T-/S-phase aggregates on mechanical and electrochemical properties in Al-Cu-Mg alloys.
| OR | Parallelism | Axis-angle |
|---|---|---|
| (I) | // , // (// ) | |
| (II) | // , // | |
| (III) | // , // |
2 Material & Methods
2.1 Material
The nominal composition of the Al alloy studied in this work is shown in Table 3. The as-received material was an extruded rod pre-heated to and extruded at . From the extruded rod a cylinder (Ø = , height = ) was cut and solution heat treated at for before water-quenched to room temperature. The material was then directly set to artificial ageing at conducted in an oil-bath, avoiding any natural ageing effects. The material was studied in an over-aged condition, which was obtained after days of ageing.
| Element | Al | Cu | Mg | Ag | Fe | Mn |
|---|---|---|---|---|---|---|
| at.% | bal. | 1.31 | 1.14 | 0.13 | 0.10 | 0.28 |
| wt.% | bal. | 3.00 | 1.00 | 0.50 | 0.20 | 0.55 |
Electron transparent thin film specimens were prepared from diameter discs of material ground to a thickness of before further thinning by electrolytic polishing. Electro-polishing was performed using a Struers Tenupol-5 operated at a voltage of (current ). The electrolytic solution comprised a 2:1 mixture of methanol:nitric acid and was held at a temperature in the range to . Prior to SPED and high resolution microscopy, the specimens were cleaned using a Fischione 1020 Plasma Cleaner to reduce the risk of carbon contamination build-up during data acquisition.
2.2 Electron microscopy
High-resolution transmission electron microscopy (HRTEM) and SPED were performed using a JEOL 2100F (S)TEM operated at 200 kV and fitted with a NanoMEGAS ASTAR system [43, 44] to enable the simultaneous scan and acquisition of precession electron diffraction patterns at each probe position. SPED was performed with the microscope operated in nanobeam diffraction mode. The probe convergence semi-angle was measured as . The precession angle employed was and the precession frequency was set to 100 Hz. The scan step size was in the range and the exposure time per pixel was . Diffraction patterns were recorded using a Stingray camera photographing the microscope’s fluorescent screen. The double-rocking probe required for PED was aligned following the method detailed by Barnard et al. [45]. High-angle annular dark-field STEM (HAADF-STEM) was performed using a double corrected JEOL ARM 200F microscope operated at using a detector collection angle of .
2.3 Phase & orientation mapping
Phase and orientation maps were formed using the pattern matching approach of Rauch et al. [46] in which the 2-dimensional PED pattern recorded at each probe position in a 2-dimensional area scan is matched against a library of simulated diffraction patterns, for all asymmetric orientations of the expected phases. Prior to this pattern matching, a background subtraction was applied to each PED pattern using a routine implemented in the pyXem Python library [47, 48, 49], and the template matching parameters in the ASTAR software were tuned to obtain good agreement between the matching results and HRTEM images of the same particles, as detailed in Supplementary Information (SI).
Orientation mapping results were analysed using the Matlab toolbox MTEX [50], following procedures described by Krakow et al. [51]. Crystallographic domains in the dispersoid aggregates were typically defined using regions with a common phase and orientation within a threshold of 10∘, which was found to give good agreement with the same phases observed in HRTEM images. Orientation relationships between these crystallographic domains were investigated by calculating the misorientation between neighbouring pixels across all domain boundaries. This misorientation data was then visualised, for each type of phase boundary by plotting the disorientation between adjacent domains as a vector in the appropriate symmetry reduced region (fundamental zone) of a 3-dimensional misorientation space [51]. The vector space chosen was the axis-angle space in which a disorientation is represented by a vector :
| (1) |
where is a unit vector parallel to the axis of rotation and is the angle of rotation [∘]. This representation is preferred over other mappings because the rotation angle is simply read from the plot and it is sufficient for visualisation.
3 Results
3.1 TEM observations
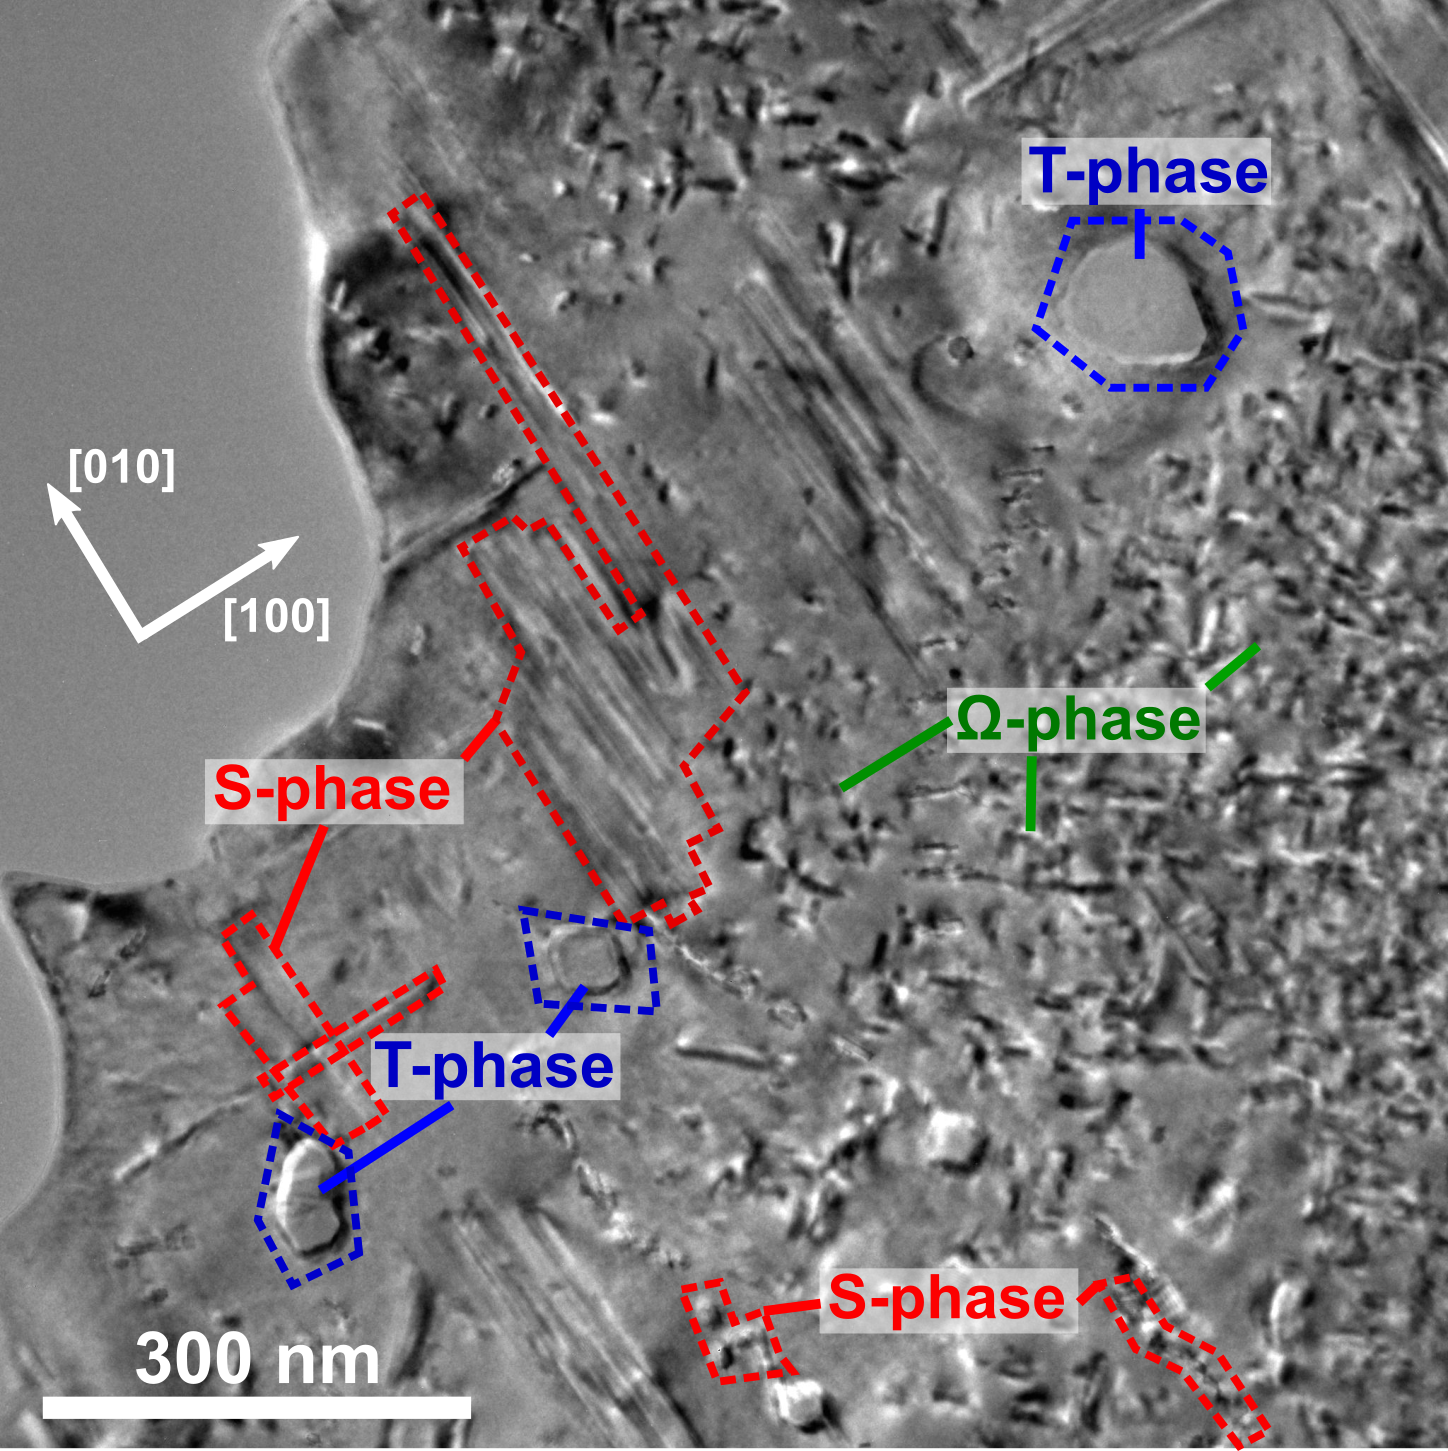
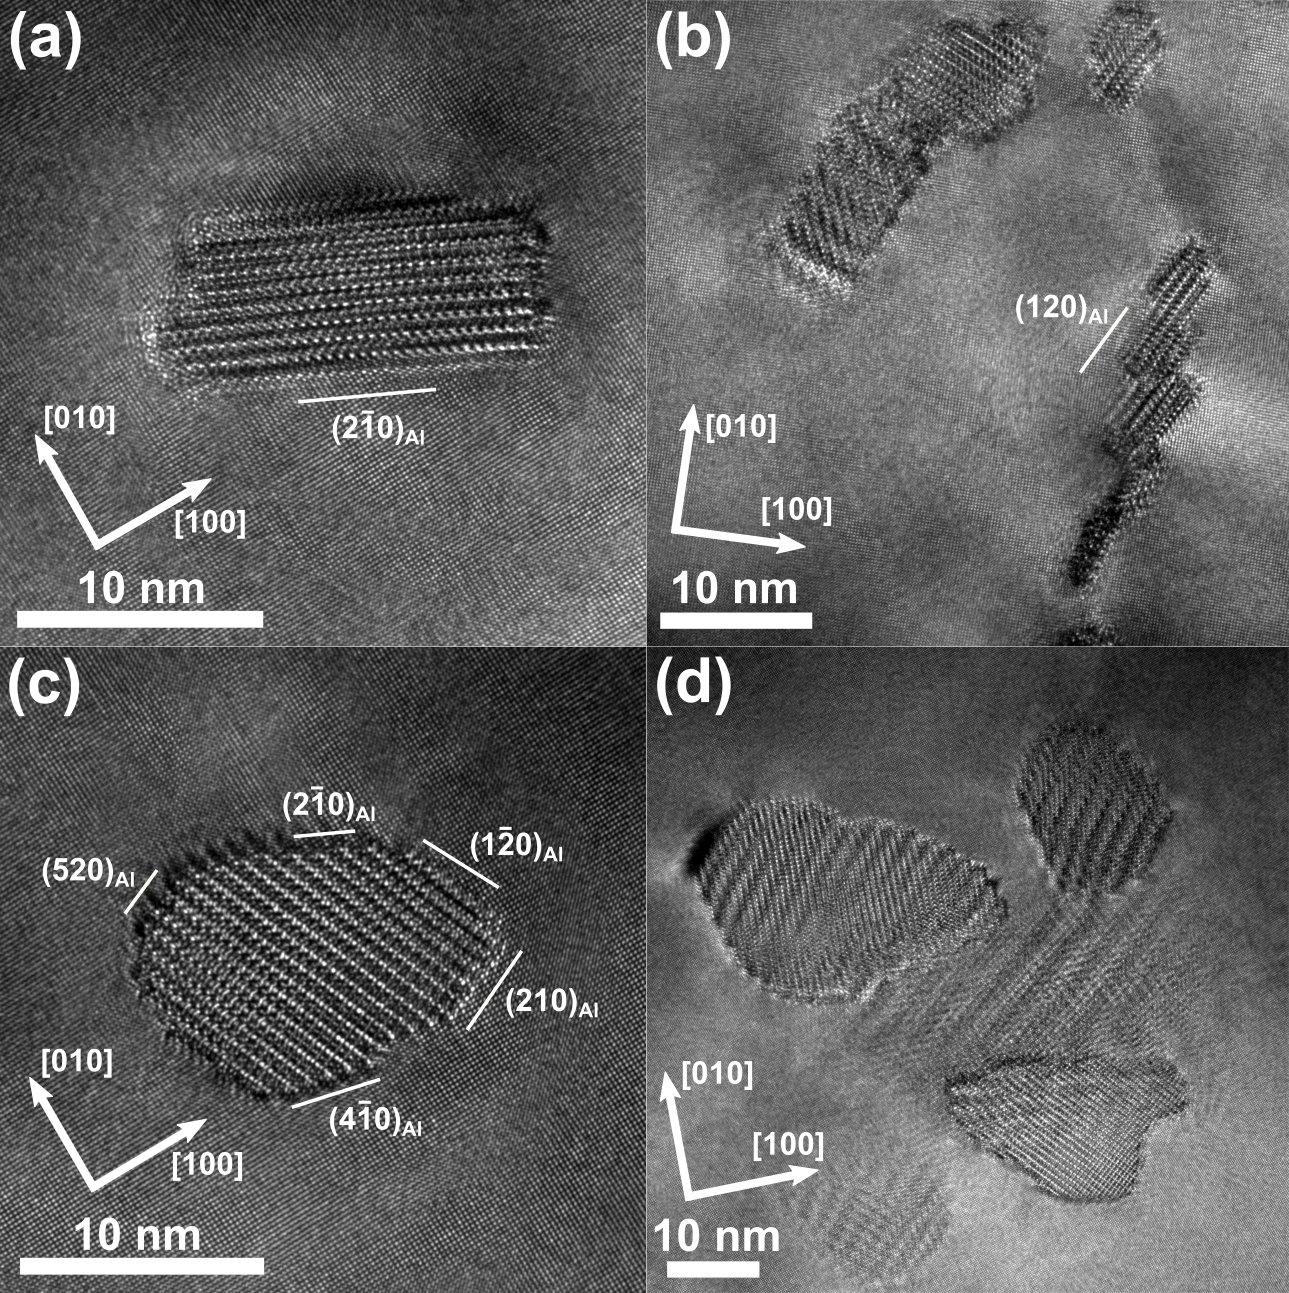
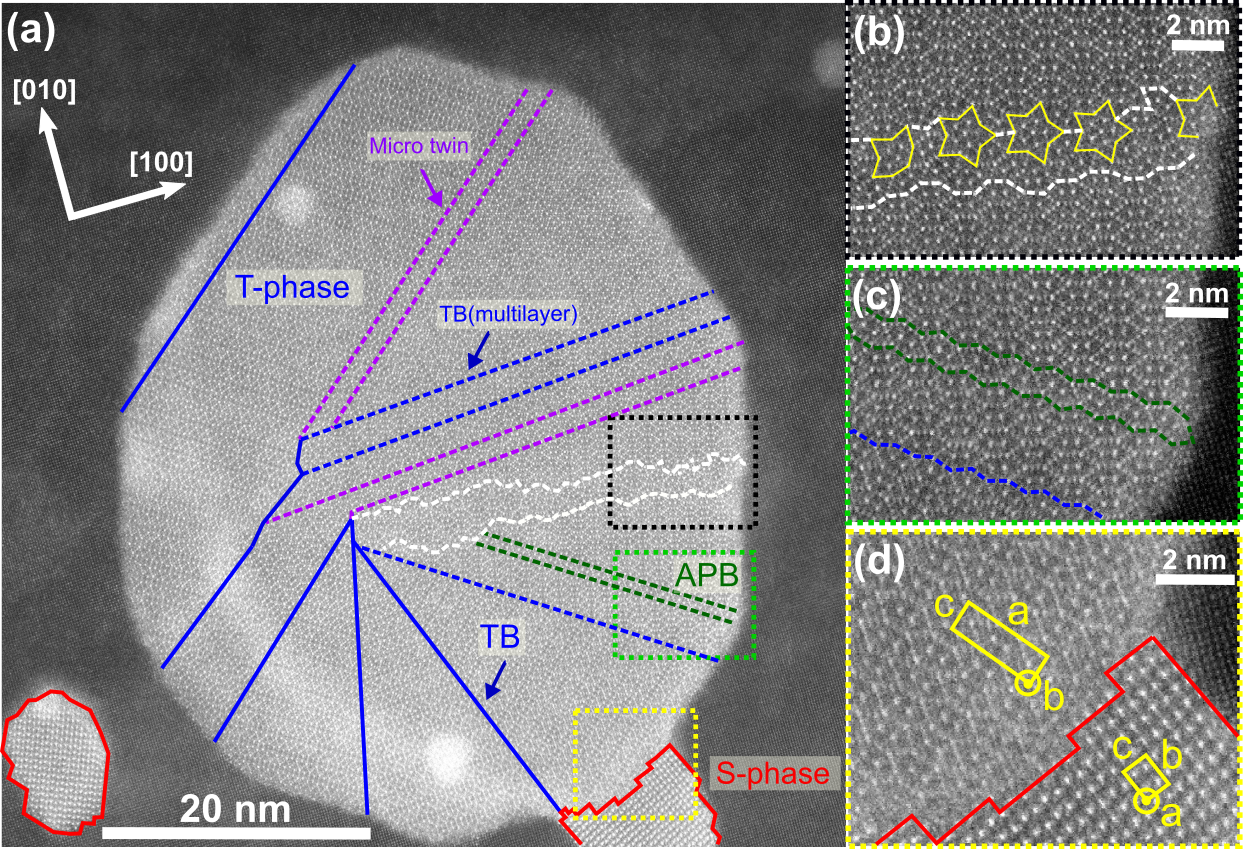
Conventional TEM imaging was performed to obtain an overview of the phases present, which were identified based on characteristic morphology and lattice structure in high-resolution images, as shown in Fig. 2, Fig. 3, and Fig. 4(a,d). A high number density of -phase precipitates were observed throughout the Al matrix, as well as elongated S-phase precipitates and T-phase dispersoids. The -phase exists as thin, hexagonal shaped plates formed on {111}. S-phase precipitates were more inhomogeneously distributed, growing as rods or laths on {021} planes and extending along 100 directions. S-phase precipitates were frequently observed clustered together, having formed heterogeneously on T-phase dispersoids or in wall-structures of adjoining S-phase precipitates on underlying dislocation networks, in agreement with previous reports [20, 52] (see Fig. 3(b,d) and Fig. 4(a,d)). Both lath- and rod-shaped S-phase cross-sections were observed, laths being more frequent. A smaller number of individual S-phase precipitates, likely formed by homogeneous bulk nucleation, were also observed (Fig. 3(a,c)). Moiré fringes can be observed in some images, e.g. Fig. 3(b,d), which are attributed primarily to overlap between the S-phase cross-sections and surrounding Al. Whilst this suggests a more diverse range of precipitate morphologies than is evident from these projection images this does not affect assessment of orientation relationships between phases.
Dispersoids were identified as T-phase and all of these were decorated by S-phase precipitates at prior T-Al interfaces (see Fig. S1-24 in SI). Typically, S-phases were observed at each dispersoid. No -phases were observed at the T-phase interfaces. Morphologically, both shell-shaped (Fig. 4(a)) and lath-shaped (Fig. 4(d)) T-phase dispersoids were observed, and all exhibited some degree of rotation-twinned substructure. T-phase cross-section diameters or diagonals were measured in the range , and cross-section aspect ratios varied between -. S-phase precipitates were observed to grow both parallel and perpendicular to the T-phase elongation axis. S-phase precipitate lengths were measured as and for S-phases at T-phase interfaces (i.e. S-phases with elongation perpendicular to the T-phase axis) and non-interfacial S-phases, respectively. Cross-section areas for the two categories were and , respectively. This indicates a slight coarsening of S-phase precipitates decorating T-phase dispersoids.
3.2 Dispersoid aggregates
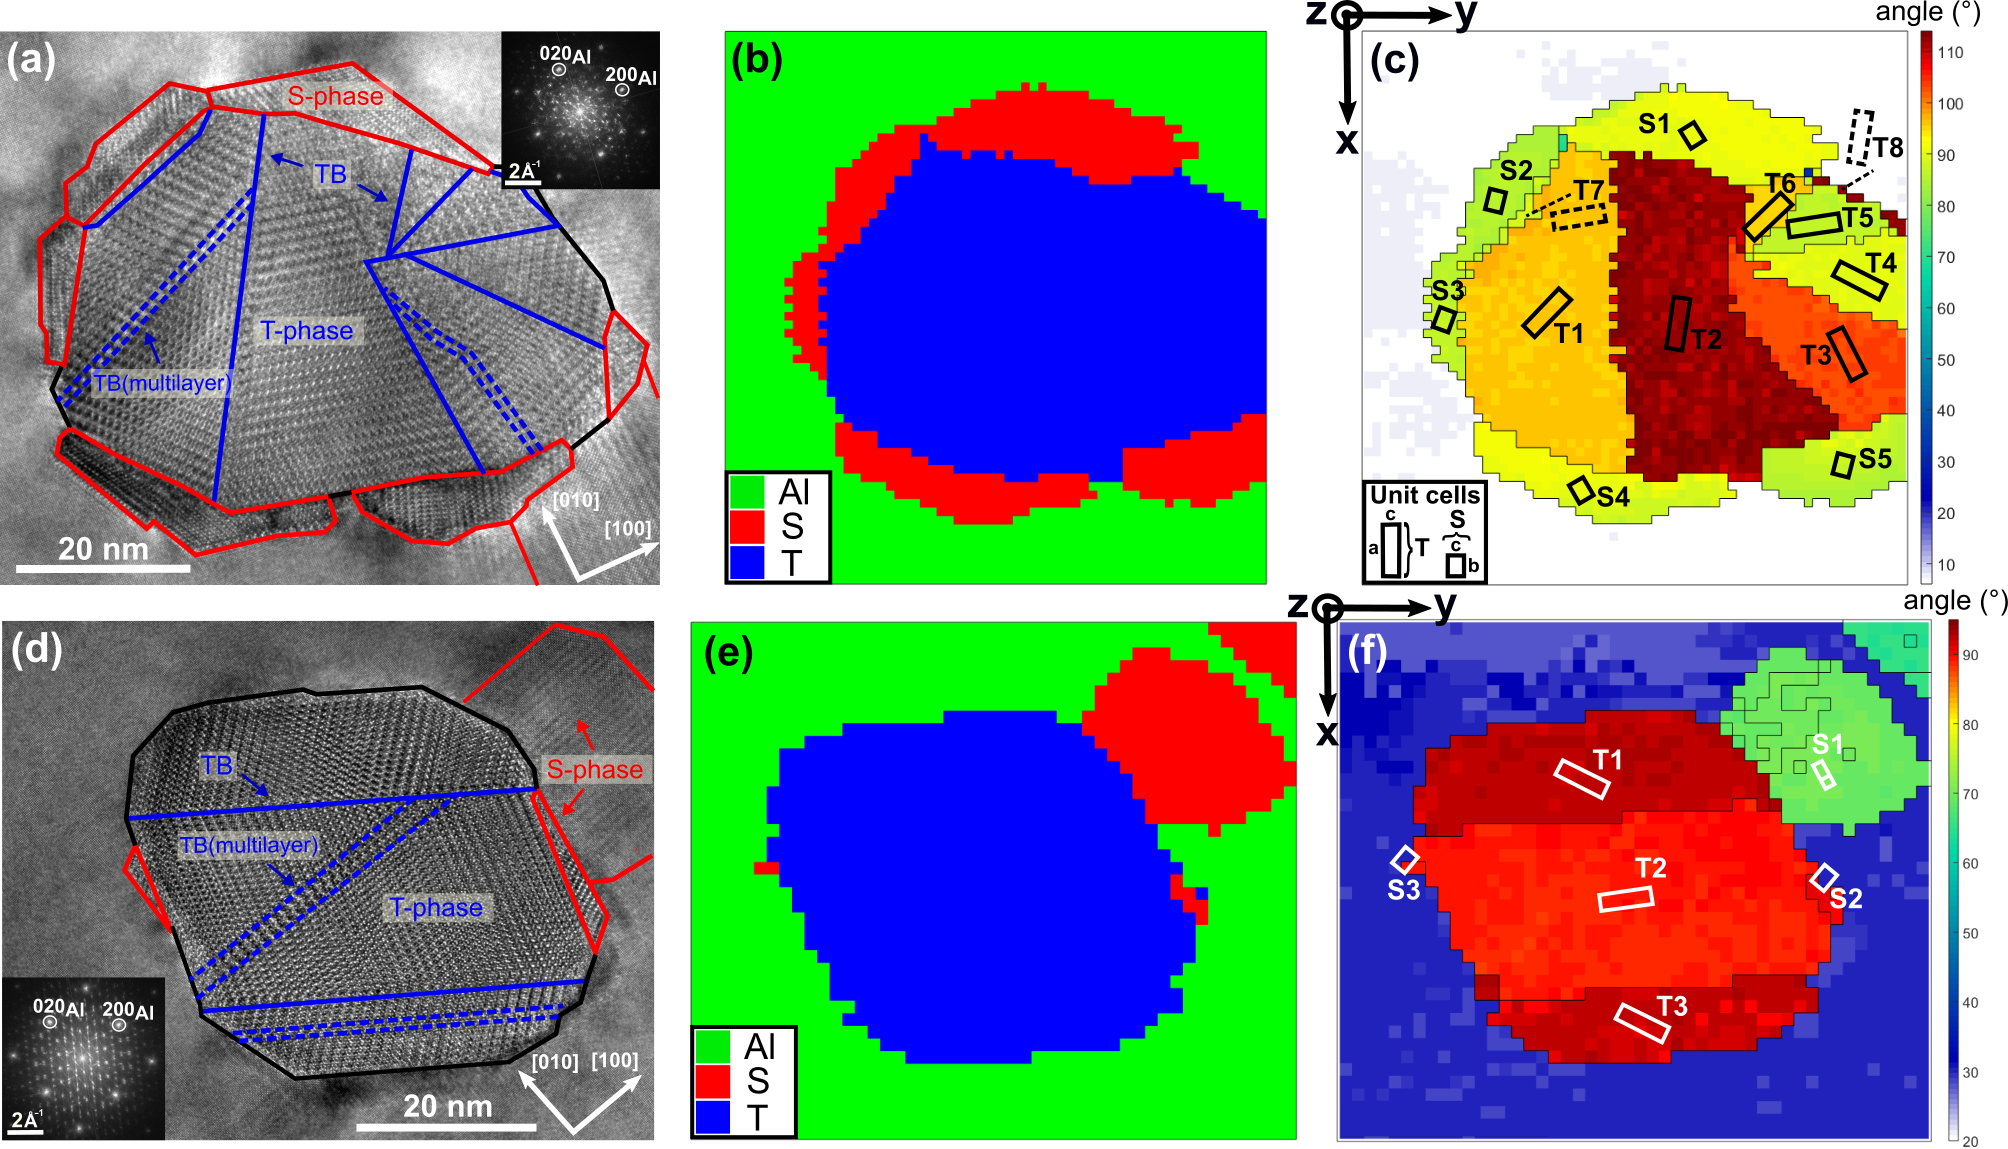
Dispersoid aggregates comprise the T-phase dispersoid, interfacial S-phases, and surrounding Al matrix. The structure of 10 such aggregates was investigated in detail using correlated HRTEM and SPED data, as shown in Fig. S1-20. Two examples are presented in Fig. 4, showing a shell- and lath-shaped T-phase exhibiting pronounced and limited rotation-twinning, respectively. Comparing HRTEM images and SPED mapping results from the same dispersoid aggregates demonstrates that the primary crystallographic features were accurately captured in the SPED data analysis. T-phase substructures such as anti-phase boundaries (APBs), micro twins, and twin boundaries (TBs) confined to a limited number of hexagon subunits in width (multilayers) [34, 53] could not be resolved by SPED, but are often associated with pixels of lower reliability and/or index value in pattern matching (Fig. S1-20). In total, 43 S-phases at the interface of T-phases were mapped by SPED. The disorientation data for each type of phase boundary shown in the following is the combined data extracted from all SPED scans recorded in the present work.
3.2.1 T-phase orientation relationships
Crystallographic relationships between rotated domains of the T-phase (T-T) and across the T-Al interface were assessed by plotting disorientations within the corresponding fundamental zones of axis-angle space as shown in Fig. 5, with previously reported T-Al ORs (Table 1) highlighted. T-T domain boundary disorientations (Fig. 5(a)) are clustered near a 36∘ rotation about corresponding to twinning [34]. Two smaller clusters are also observed at 0∘ and 72∘, the latter corresponding to twice the twinning angle. Both are associated with disorientations across domains in the rotation-twin centres, i.e. the regions from which the twin domains seemingly emanate. In this region, each domain shares a small boundary to other domains that can be rotated relative to it by 0∘, 36∘, or 72∘. Data points away from these disorientation clusters were likely misindexed pixels as a result of local disorder, e.g. the unresolved APBs, micro twins or TB multilayers. The spread in T-T TB disorientations (FWHM of angle distribution) of 1.2∘ is taken as an indication of angular resolution, which is consistent with estimated angular resolution for spot pattern based indexation [54].
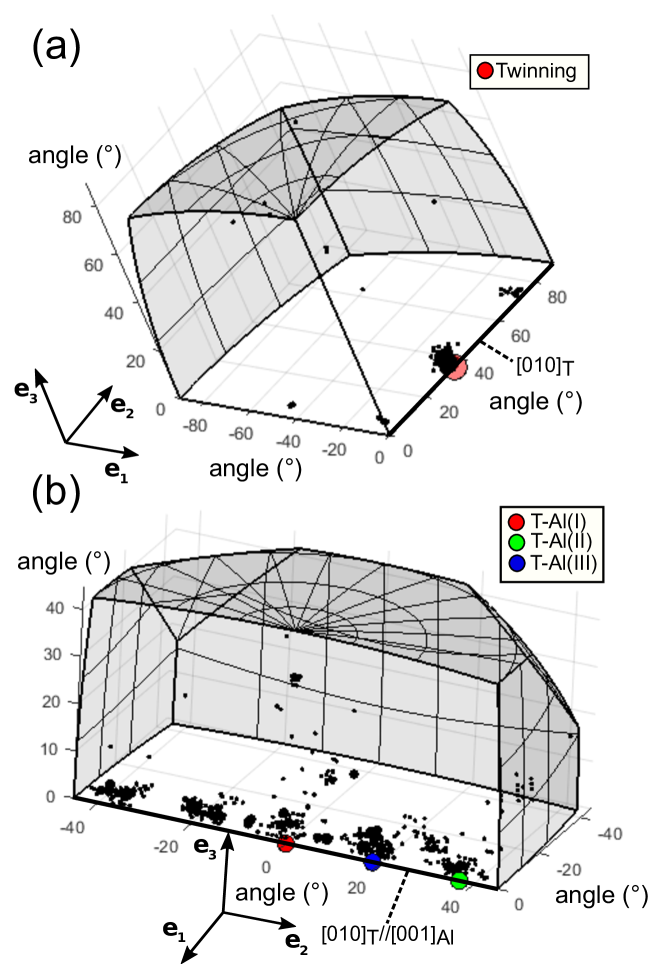
T-Al disorientations (Fig. 5(b)) form 3 main clusters near previously reported T-Al ORs. The 2 clusters situated at negative angles along the [010]//[001] axis correspond, by symmetry, with those at equivalent positive values, i.e. near ORs (II) and (III). There is a spread of rotations away from the exact angles described by the ORs, primarily about the [010]//[001] axis since most data points are distributed parallel to this axis. This implies that there exists a deviation of from exact OR parallelisms across the T-Al interface. The cluster spread is less pronounced perpendicular to the [010]//[001] axis, implying that the [010] elongation axis remains reasonably parallel to the [001] direction. A 5∘ radius sphere of disorientations about OR(I), OR(II), and OR(III) accounts for 7%, 30%, and 50% of all disorientation data points, respectively.
The substructure of T-phase dispersoids are observed in HAADF-STEM, as shown in Fig. 6. APBs (Fig. 6(c)) form where there exists a band one single hexagon subunit in width rotated (by the twinning angle) with respect to the surrounding twin domain. A micro twin forms when a second band rotated with respect to the first appears. A TB multilayer appears as a narrow band, usually hexagon subunits in width. Another more complex feature is transition regions (Fig. 6(b)), which comprise different geometrical structures formed by various hexagon subunit tessellations. The T-phase substructures that extend to the T-Al interface are likely the main explanation for misindexed data points in Fig. 5(b) that are spread at significant distances away from the main observed disorientation clusters. The bright regions in Fig. 6 are primarily due to incorporation of Ag in the S- and T-phase. Additional HAADF-STEM images are presented in Fig. S23 and Fig. S24.
3.2.2 S-Al orientation relationships
S-Al disorientations for S-phase precipitates situated at T-phase interfaces and non-interfacial counterparts are shown in Fig. 7, with previously reported S-Al ORs (Table 2) highlighted. In both cases, the disorientations cluster together near the [100]//[001] axis. The cluster of disorientations for S-phases situated away from T-phase interfaces (Fig. 7(b)) is more clearly placed at the [100]//[001] axis, whereas the disorientations for interfacial S-phases (Fig. 7(a)) show a dense population slightly off axis. This implies that there exists more deviation from exact [100]//[001] parallelism when S-phase precipitates decorate the T-Al interfaces. S-phase precipitates placed away from T-Al interfaces are more strictly confined to in-plane ((001)) rotations about [100]//[001] configuration.
S-Al interfaces for S-phase precipitates not decorating T-phases show a disorientation angle distribution shifted towards OR(I), with a dense population between OR(I) and OR(II) (5∘ spread). For S-phases at T-phase interfaces the disorientations are more evenly spread across a 9∘ range of rotations. A 2∘ radius sphere of disorientations around OR(I-IV) accounts for 48%, 35%, 9%, and 4% of all disorientation data points in the case of S-phases at T-phase interfaces, respectively. Corresponding numbers are 78%, 9%, 3%, and 1% for S-phases located away from T-phase interfaces.

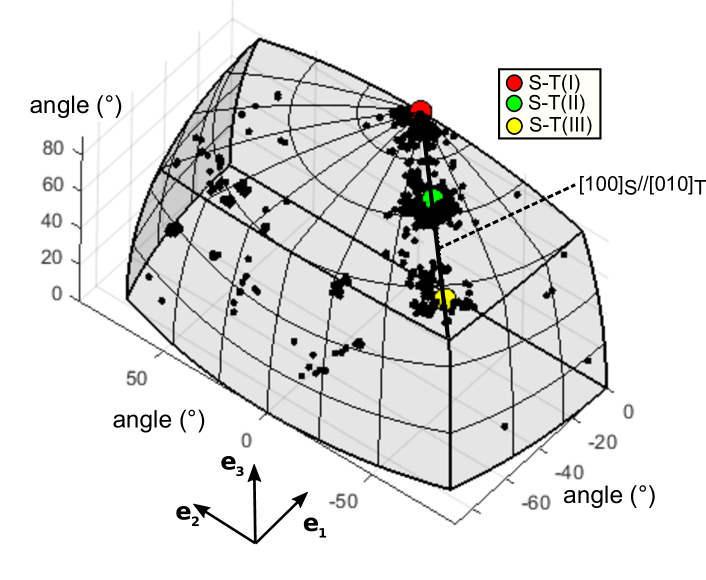
3.2.3 S-T orientation relationships
S-T phase boundary disorientations are shown in Fig. 8. The majority of disorientations fall close to the [100]//[010] axis, and is consistent with HRTEM (Fig. 4(a,d)) and HAADF-STEM (Fig. 6(d)) images, showing that the a- and b-axis of the S- and T-phase respectively, runs near parallel to [001]. Several clear disorientation clusters can be seen, indicating the formation of several definite S-T crystallographic ORs. By sampling potential low index ORs placed along the [100]//[010] axis, corresponding to a range of 90-120∘ in disorientation angles, the most probable crystallographic ORs were determined. The ORs were determined as those candidate ORs which accounted for the largest percentage of disorientations, falling within a [∘] radius sphere of disorientations centred on the exact OR value, being an integer. The analysis yielded 3 ORs highlighted in Fig. 8. These ORs encompassed 26%, 27%, and 9% of all data points, using a 3∘ radius sphere for ORs (I-III), respectively. The corresponding parallelisms and axis-angle representations are shown in Table 4.
| OR | Parallelism | Axis-angle |
|---|---|---|
| (I) | // , // (// ) | |
| (II) | // , // | |
| (III) | // , // |
3.3 Orientation spread
Disorientations between phases in the T-/S-phase aggregates generally showed significant spread about ORs described by plane parallelisms. This was investigated by direct inspection of SPED raw data and mapping results for each dispersoid aggregate, e.g. as shown in Fig. 9. The misorientation angle across S-T boundaries (Fig. 9(a)) varied over the range . The range was not continuously populated, but rather showed clustering about the angles corresponding with S-T ORs(I-III) (Table 4), consistent with the axis-angle representation of the combined S-T disorientations in Fig. 8. Spatially, the misorientation angle changed abruptly where the S-phase crossed T-phase TBs (indicated by arrows in Fig. 9(a)). The misorientation angle across S-Al boundaries spanned the range , again consistent with the combined axis-angle representation of S-Al disorientations for interfacial S-phase precipitates in Fig. 7(a). The population of angles showed a continuous, or near continuous distribution across this range. Particularly for S-phase precipitates crossing T-phase TBs, the full range of rotations was observed.
Taking S1 in Fig. 9(a) as an example, at the S1-T1 boundary the misorientation angles indicate that S-T OR(III) is followed. Moving from left to right crossing the T1-T2 TB, S1 makes a sharp adjustment at the S1-T2 interface to S-T OR(II) in order to accommodate the large changes in interface structure necessary to adjust to the rotation-twinned T2 domain. Crossing the T2-T6 TB, S-T OR(III) is re-established as the T-phase has rotated in the opposite direction back to T1 orientation (see Fig. 4(c)). The transition involves 16∘ rotations of the S1-T interface. Adjustments are also observed at the phase boundary between S1 and the surrounding Al matrix. The S1-Al boundary exhibits a range of misorientation angles, gradually increasing from left to right. Comparing with reported plane parallelisms this nearly corresponds to a continuous or near continuous rotation from S-Al OR(I) to OR(IV).
The misorientation with respect to the mean of each crystallographically distinct domain is shown in Fig. 9(b) and reveals significant variation inside individual S-phase precipitates. The largest deviations are observed where the S-phase crosses T-phase TBs. The deviation from the mean reach 9∘ for the interfacial S-phases, compared with variations below 3∘ within T-phase domains and the surrounding Al matrix.
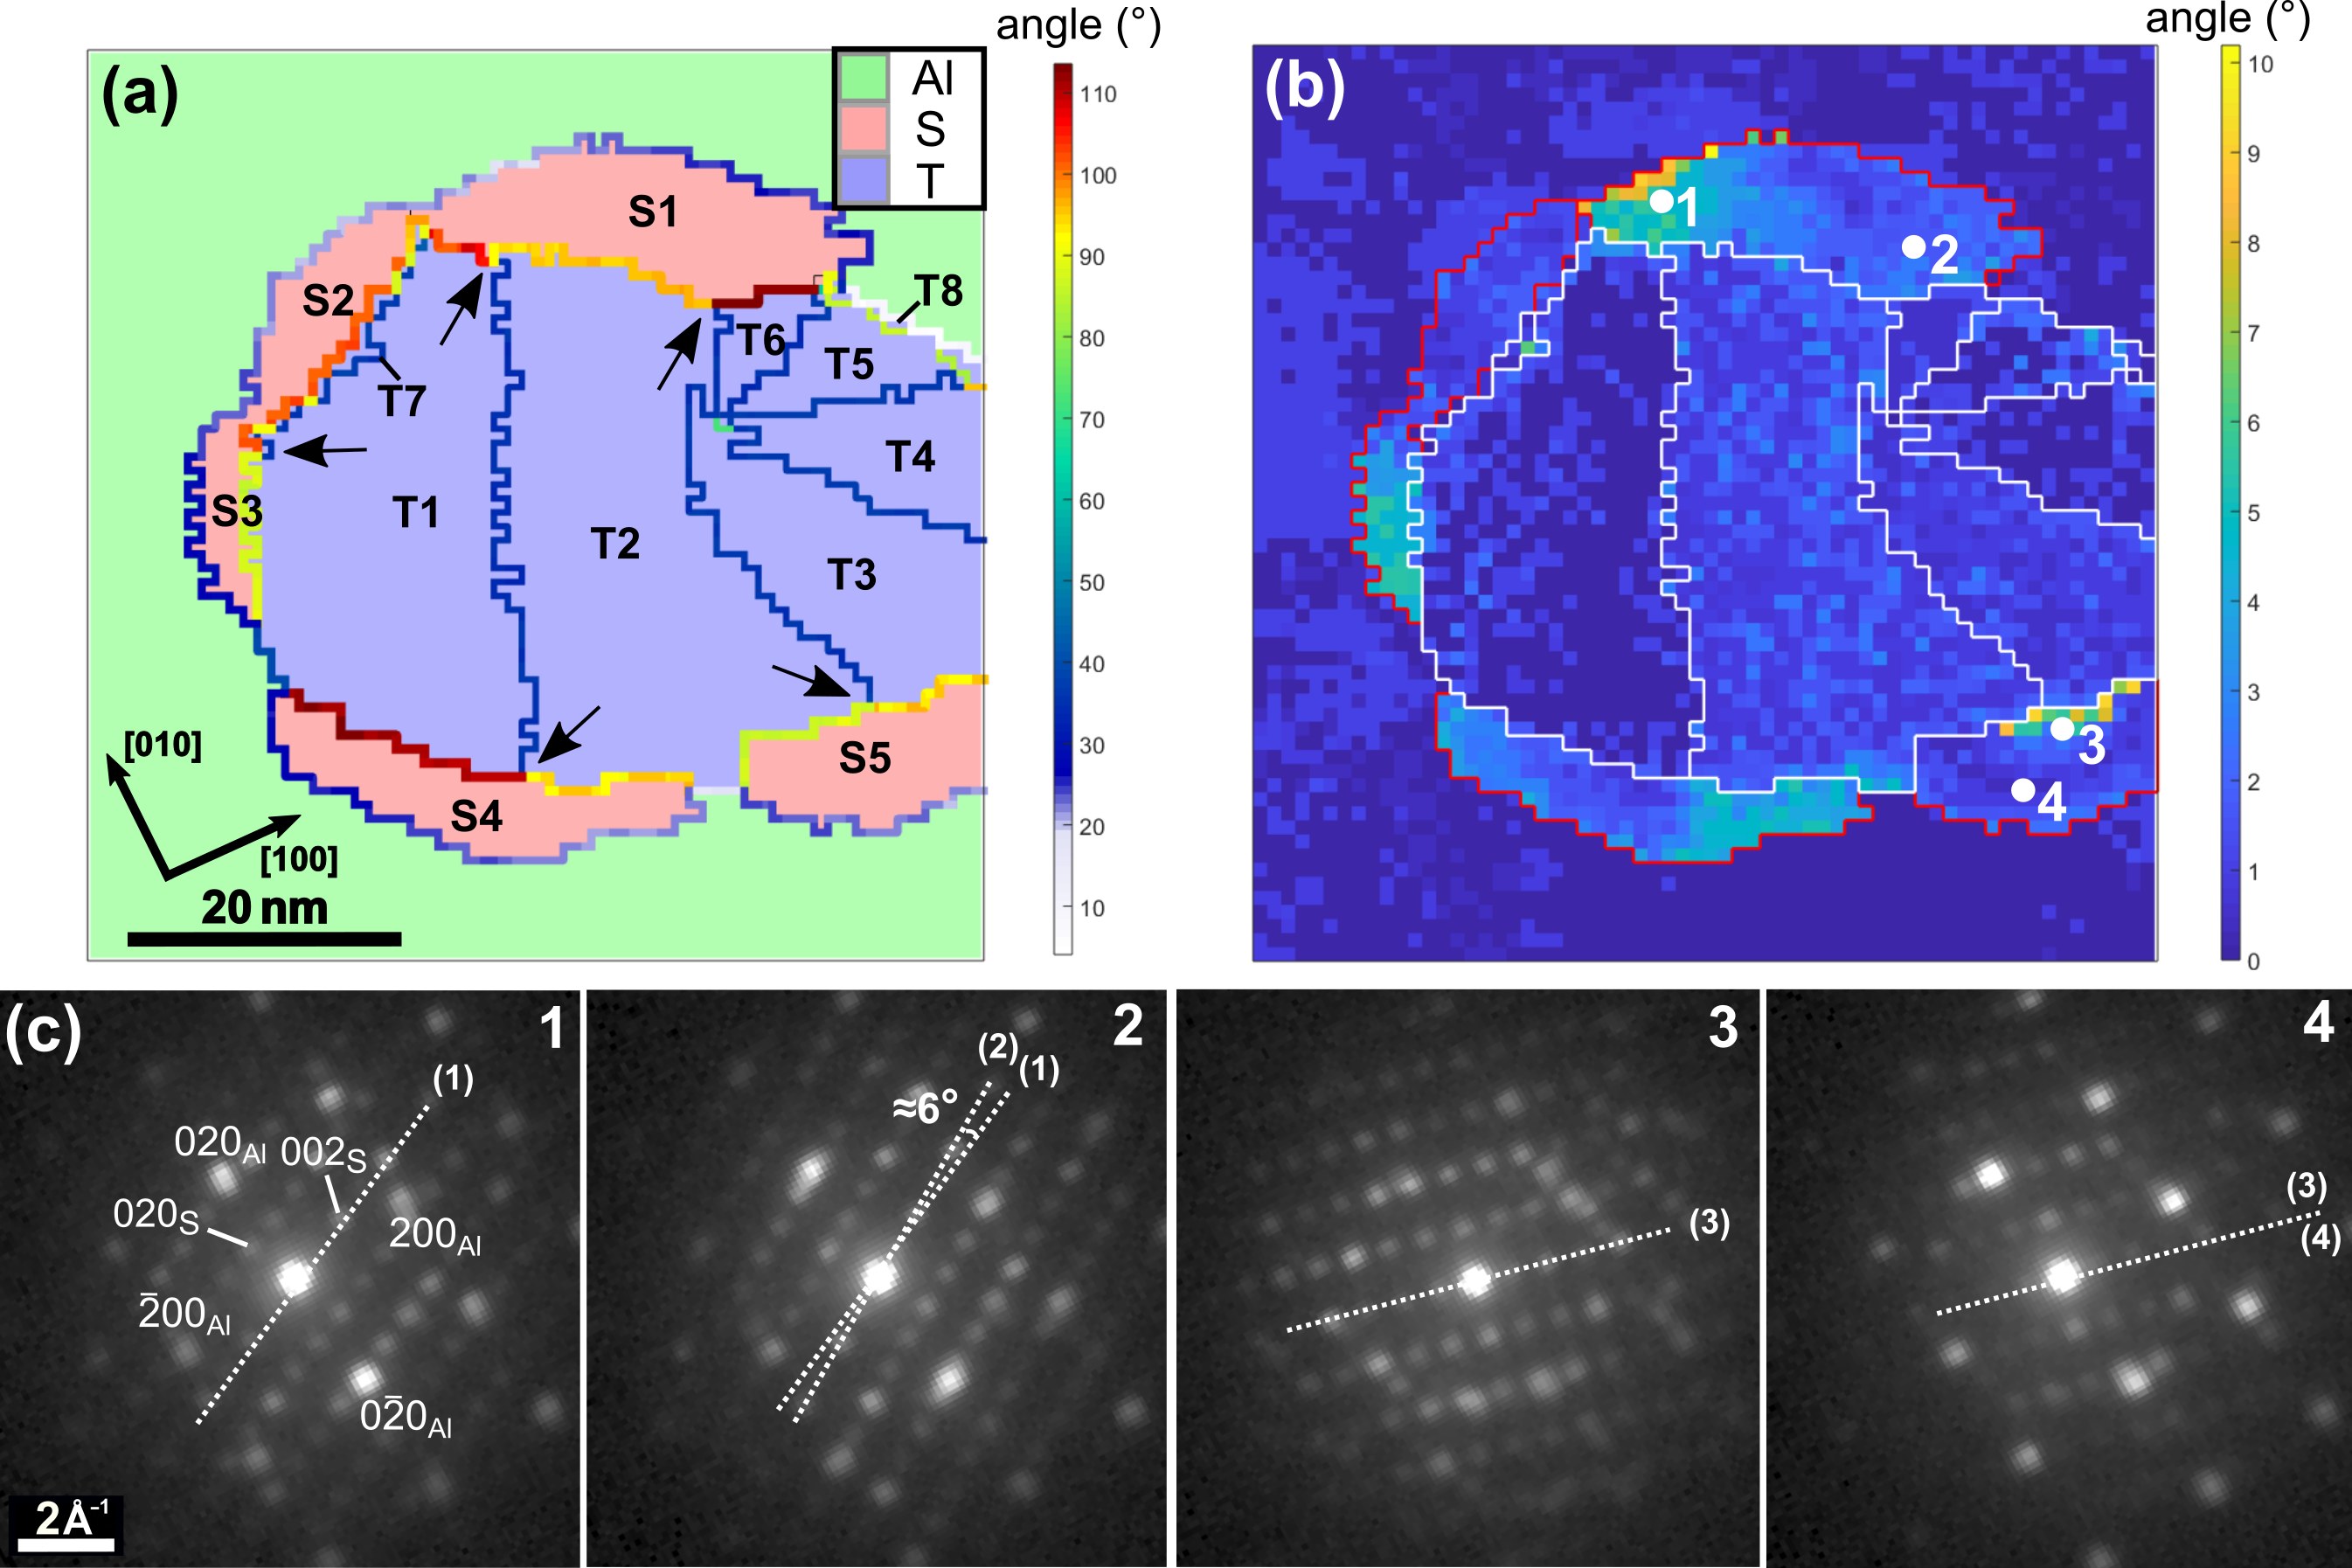
The PED patterns presented in Fig. 9(c) are from marked positions in Fig. 9(b) and verify the discussed orientation variation of the T-/S-phase aggregates. The patterns show a significant in-plane ((001)) rotation about the [100]//[001] axis within S1 (pattern 1-2), and an out-of-plane tilt of the S-phase structure away from this axis within S5 (pattern 3-4), which is apparent from the asymmetric intensity distribution and is consistent with the observation of phase boundary misorientations tilted away from simple parallelisms in addition to significant rotations about the parallel direction. As observed in axis-angle space, the largest tilts (spread of data points perpendicular to main axes) occur for S-phase precipitates in dispersoid aggregates (Fig. 7(a)), an example of which is shown here.
4 Discussion
The combined TEM and SPED study presented here provides new insights to the inter-phase relations of T-/S-phase aggregates. In the following, these findings are interpreted in light of previous reports on the phases studied separately.
The T-phase dispersoid forms during the homogenisation process at temperatures above [55]. Depending on the time and temperature at this stage the T-phase undergoes different degrees of rotation-twinning, which consequently affect the morphology. Long times and higher temperatures favour shell-shaped structures exhibiting pronounced twinning. A pseudo 10-fold symmetry centre can develop from successive twinning of T-twin domains. This symmetry centre is built from five differently oriented T-twin domains, each with a mirrored version, and which has three underlying T-Al ORs (Table 1). A recent study [30] has shown that the reported ORs can continually change as the T-phase undergoes rotation-twinning, requiring as much as 9∘ rotation of T-twin domains about the // axis, which likely results from the increase in interface energy caused by the twinning. The lattice mismatch of the T-phase hexagon subunit with (200) and (002) is largest for T-Al OR(III) (6.7% and 8.6%, respectively), which is only found in T-phases with multiple T-twin domains [29, 30, 33]. Large rotations at the T-Al interface were also observed in the misorientation analysis conducted here, which measured up to 8∘ rotations about previously reported ORs (I-III), seen from Fig. 5(b). OR(III) was found to be the most frequent, which is reasonable as the majority of T-phase dispersoids analysed exhibited pronounced rotation-twinning (see Fig. S1-20).
Similarly, the misorientation analysis of non-interfacial S-phase precipitates showed several degrees variation from reported OR parallelisms. This was found to be approximately confined to a 5∘ range of rotations (Fig. 7(b)), a smaller number of data points reaching larger rotations. Previous reports show similar results, with upper bounds reaching [37, 38, 39] rotation away from OR(I) reported by Bagaryatsky [35]. This attests to the preference for heterogeneous nucleation.
It has hence been shown that both the S- and T-phase individually show in-plane ((001)) rotations of several degrees from reported ORs with the Al matrix. The upper bounds of the range of rotation angles exhibited by S-phase precipitates situated away from T-phase interfaces corresponds well with the noted rotation that occur at the T-Al interface. The similarity may indicate why the T-Al interface is energetically favourable for S-phase nucleation and subsequent growth, and it reasons the finding of crystallographic ORs between the two phases. The correspondence of angles implies that the S-phase has the capability of accommodating the full rotation imposed by the maximum rotation at the T-Al interface. In the present study, S-phase precipitates were observed on all studied T-phase dispersoids, which suggests a good structural match between the two phases. These S-phases were seen to exhibit up to 9∘ rotation about an axis near // configuration (Fig. 7(a)), in close agreement with the magnitude of the range of rotations (8∘) observed at the T-Al interface (Fig. 5(b)). As previously mentioned, the population of orientation angles exhibited by S-phase precipitates decorating T-phase interfaces was more spread towards larger angles than for the non-interfacial S-phases. This is to be expected as the S-phase has to accommodate the large rotations occurring at the T-Al interface.
The majority of S-phase precipitates in dispersoid aggregates seems to have grown preferentially along the T-Al interface. This is indicated by the observation that many S-phase precipitates in projection form caps at the prior T-Al interface, seen from Fig. 4, Fig. S1-20 and Fig. S23-24. This hence maximises the S-T interface area. Interfacial S-phase cross-sections typically have a narrow extension normal to the S-T interface. This implies that the S-T interface is energetically preferable as compared to S-Al interfaces. The interfacial S-phases have to adjust to local changes in both the T-phase structure and the surrounding Al matrix. The interface of the T-phase to which the S-phase has to conform is a complex rotation-twinned structure, often complicated further by regions of geometrical defects (see Fig. 6 and Fig. S23-24). If the S-T interface incorporates a TB, significant adjustments of the S-phase structure must have resulted to maintain a definite crystallographic OR to each of the T-twin domains and the Al matrix, simultaneously. Furthermore, because the S-phase cross-section usually is narrow normal to the S-T interface, the structural adjustment must be a rather sharp transition in orientation in close proximity of the TB at the S-T interface. Misorientation angles across phase boundaries show that this is indeed the case, with the S-T interface shifting to a different OR across the TB (Fig. 9(a)). These changes in configuration involve rotations of several degrees of the S- and T-phase structures. The rotation is mainly about the [100]//[010] axis, but tilts away from this configuration also occur (see Fig. 8).
The T-phase dispersoid often shows less orientation variation compared to the S-phase precipitates near the S-T phase boundaries, as the misorientation-to-mean-plot shows (Fig. 9(b)). This is because the phases are formed at different stages in material heat treatment. The rotations observed at T-Al interfaces must already be in place after quenching from homogenisation, unless the S-phase nucleation and growth can cause the T-phase dispersoid to bend. Due to the comparatively small size of interfacial S-phases relative to the T-phase dispersoid, this is not thought to occur. The S-phase nucleates and grows under artificial ageing (), which is too low in temperature for any significant changes in the T-phase structure to occur [55, 56]. The large local rotation of the S-phase structure near the TB is likely associated with a significant shear strain.
Some of the observed S-phase cross-sections at T-phase interfaces were likely formed by the coalescence of two initially separate S-phases. An example of this case was observed near a T-phase TB (see Fig. S13). The final morphology of S-phase precipitates in dispersoid aggregates can be seen as a balance between S-Al, S-T, and potentially S-S interface energies, reduction of lattice parameter misfits, and resulting shear strain.
The comparison between S-phase precipitates in dispersoid aggregates and S-phase precipitates formed away from T-phase interfaces provides further insight to the phase boundary energetics and the different inter-phase relations. Non-interfacial S-phases do not have to maintain a simultaneous OR with the T-phase in addition to the surrounding Al matrix. There is hence less need for large local adjustments in interface configurations, and the structure rotation that potentially arise from a variation in S- and/or (locally) Al lattice parameters [9, 37, 38] stays more confined about the [100]//[001] axis, as observed from Fig. 7(b). Furthermore, the range of orientation angles exhibited is smaller for non-interfacial S-phases (5∘). Although S-phases at T-phase interfaces exhibit a broader range of disorientation angles with respect to the surrounding Al matrix (9∘), the range is still approximately confined to the crystallographic limits proposed by Winkelman et al. [37] studying S-phases formed away from T-phase interfaces (Fig. 7(a)).
It is noteworthy that, the -phase, which was the most abundant phase in the studied alloy microstructure, exhibits a high resistance to coarsening [57] and remains small and uniformly dispersed. These precipitates are therefore likely the most significant contributors to strengthening in this over-aged condition. No -phase precipitates were observed at T-Al interfaces, which may be explained by S(S′) nucleating more easily and depleting the matrix of the solute supersaturation (mainly Cu) required to support the nucleation and growth of [22].
5 Conclusions
SPED based orientation mapping combined with misorientation analysis in 3-dimensional axis-angle space and correlated HRTEM has been applied to study T-/S-phase aggregates in an Al-Cu-Mg-Ag alloy. The analysis revealed that:
-
1.
T-phase dispersoids show a rotation-twinned substructure characterised by rotation about [010] with {101} as twin boundary planes. Dispersoids with a low number of twin domains (3) tend to be lath-shaped, and T-phases showing more pronounced twinning have up to 10 domains, and exhibit shell-shaped cross-sections.
-
2.
T-Al interfaces follow the previously reported T-Al ORs(I-III), but show significant rotations () about the [010]//[001] axis relative to exact OR parallelisms.
-
3.
S-Al interfaces for S-phases formed away from dispersoids show a disorientation angle distribution clustered about S-Al OR(I), mainly confined within a continuous (or near continuous) spread of rotation towards OR(II). These S-phase precipitates showed a relatively strong confinement to rotations about the [100]//[001] axis.
-
4.
S-Al interfaces for S-phase precipitates in dispersoid aggregates exhibit a continuous (or near continuous) range of disorientation angles between about the [100]//[001] axis. These rotations are roughly confined within the crystallographic limits between S-Al OR(I) and OR(IV) ( rotation). In addition, these S-phases showed more out-of-plane tilts away from [100]//[001] configuration compared to the non-interfacial counterparts.
-
5.
Our work has found the following 3 ORs between S-phase precipitates and T-phase dispersoids:
(I) // , //
(II) // , //
(III) // , // -
6.
Axes-angle representation of S-Al, S-T and T-Al disorientations show several degrees deviation from reported/obtained crystallographic ORs. This is seen as a necessary consequence of changes in interface orientation and structure in maintaining simultaneous crystallographic ORs between S, T and Al.
We have demonstrated a methodology of correlating imaging and scanning diffraction techniques to allow precise analysis of orientation relationships and disorientations at high spatial resolution. The approach has potential for broad applications within multi-phase materials such as metals, semiconductors and minerals, where phase coherency is decisive for macroscopic properties.
Acknowledgements
JKS and RH acknowledge support from the AMPERE project (NFR247783), a Knowledge-building Project for Industry, co-financed by The Research Council of Norway (NFR), and the industrial partners Hydro, Gränges, Neuman Aluminium Raufoss (Raufoss Technology) and Nexans. RH and SW acknowledge funding from the Research Council of Norway NFR221714. PAM acknowledges funding from the ERC 291522-3DIMAGE, and the EPSRC Grant no. EP/R008779/1. DNJ acknowledges the EPSRC NanoDTC Cambridge EP/L015978/1 and the University of Cambridge for funding. The (S)TEM work was carried out on the NORTEM infrastructure (NFR197405) at the TEM Gemini Centre, Trondheim, Norway.
References
References
- [1] E.A. Starke, Jr., J.T. Staley, Application of modern aluminum alloys to aircraft, Prog. Aerosp. Sci. 32 (1996) 131–-172.
- [2] G.E. Totten, D.S. MacKenzie, Handbook of Aluminum, vol. I and II, Marcel Dekker, New York, 2003.
- [3] J.C. Williams, E.A. Starke, Jr., Progress in structural materials for aerospace systems, Acta Mater. 51 (2003) 5775–-5799.
- [4] T. Dursun, C. Soutis, Recent developments in advanced aircraft aluminium alloys, Mater. Des. 56 (2014) 862–871.
- [5] L. Kovarik, S.A. Court, H.L. Fraser, M.J. Mills, GPB zones and composite GPB/GPBII zones in Al–-Cu-–Mg alloys, Acta Mater. 56 (2008) 4804–4815.
- [6] A. Guinier, Heterogeneities in solid solutions, Solid State Phys. 9 (1959) 293-–398.
- [7] S.C. Wang, M. J. Starink, Precipitates and intermetallic phases in precipitation hardening Al–-Cu-–Mg–-(Li) based alloys, Int. Mater. Rev. 50 (2005) 193-–215.
- [8] S.P. Ringer, K. Hono, I.J. Polmear, T. Sakurai, Nucleation of precipitates in aged Al–Cu–Mg–(Ag) alloys with high Cu:Mg ratios, Acta Mater. 44 (1996) 1883–1898.
- [9] S.C. Wang, M.J. Starink, Two types of S phase precipitates in Al–-Cu–-Mg alloys, Acta Mater. 55 (2007) 933–941.
- [10] J.T. Vietz, I.J. Polmear, The influence of small additions of silver on the ageing of aluminium alloys: Observations on Al-–Cu-–Mg alloys, J. Inst. Metals 94 (1966) 410–417.
- [11] J.A. Taylor, B.A. Parker, I.J. Polmear, Precipitation in Al–Cu–Mg–Ag casting alloy, Metal Sci. 12 (1978) 478–482.
- [12] D. Bakavos, P.B. Prangnell, B. Bes, F. Eberl, The effect of silver on microstructural evolution in two 2xxx series Al-alloys with a high Cu:Mg ratio during ageing to a T8 temper, Mater. Sci. Eng. A 491 (2008) 214–223.
- [13] R.N. Lumley, I.J. Polmear, The effect of long term creep exposure on the microstructure and properties of an underaged Al-–Cu-–Mg-–Ag alloy, Scripta Mater. 50 (2004) 1227–-1231.
- [14] N. Sano, K. Hono, T. Sakurai, K. Hirano, Atom-probe analysis of and phases in al Al–Cu–Mg–Ag alloy, Scripta Metall. Mater. 25 (1991) 491–496.
- [15] Z. Shen, C. Liu, Q. Ding, S. Wang, X. Wei, L. Chen, J. Li, Z. Zhang, The structure determination of Al20Cu2Mn3 by near atomic resolution chemical mapping, J. Alloys Compd. 601 (2014) 25–30.
- [16] W.X. Feng, F.S. Lin, E.A. Starke, Jr., The effect of minor alloying elements on the mechanical properties of Al-Cu-Li alloys, Metall. Trans. A 15 (1984) 1209-–1220.
- [17] L.D. Castillo, E.J. Lavernia, Microstructure and mechanical behavior of spray-deposited Al-Cu-Mg(-Ag-Mn) alloys, Metall. Mater. Trans. A 31 (2000) 2287-–2298.
- [18] S. Cheng, Y.H. Zhao, Y.T. Zhu, E. Ma, Optimizing the strength and ductility of fine structured 2024 Al alloy by nano-precipitation, Acta Mater. 55 (2007) 5822-–5832.
- [19] Z.Q. Feng, Y.Q. Yang, Y.X. Chen, B. Huang, M.S. Fu, M.H. Li, J.G. Ru, In-situ TEM investigation of fracture process in an Al–-Cu-–Mg alloy, Mater. Sci. Eng. A 586 (2013) 259-–266.
- [20] Z. Feng, Y. Yang, B. Huang, X. Luo, M. Li, Y. Chen, M. Han, M. Fu, J. Ru, HRTEM and HAADF-STEM tomography investigation of the heterogeneously formed S(Al2CuMg) precipitates in Al–Cu–Mg alloy, Philos. Mag. 93 (2013) 1843–1858.
- [21] A.K. Mukhopadhyay, G. Eggeler, B. Skrotzki, Nucleation of phase in an Al–Cu–Mg–Mn–Ag alloy aged at temperatures below 200 ∘C, Scripta Mater. 44 (2001) 545–551.
- [22] L.M. Wang, H.M. Flower, T.C. Lindley, Precipitation of the phase in 2024 and 2124 aluminium alloys, Scripta Mater. 41 (1999) 391–396.
- [23] K. Urushino, K. Sugimoto, Stress-corrosion cracking of aged Al–Cu–Mg alloys in NaCl solution, Corros. Sci. 19 (1979) 225–236.
- [24] R. Parvizi, R.K.W. Marceau, A.E. Hughes, M.Y. Tan, M. Forsyth, Atom probe tomography study of the nanoscale heterostructure around an Al20Mn3Cu2 dispersoid in aluminium alloy 2024, Langmuir 30 (2014) 14817–14823.
- [25] R. Parvizi, A.E. Hughes, M.Y. Tan, R.K.W. Marceau, M. Forsyth, P. Cizek, A.M. Glenn, Probing corrosion initiation at interfacial nanostructures of AA2024-T3, Corros. Sci. 116 (2017) 98-109.
- [26] J. Wang, B. Zhang, B. Wu, X.L. Ma, Size-dependent role of S phase in pitting initiation of 2024Al alloy, Corros. Sci. 105 (2016) 183-189.
- [27] N. Birbilis, R.G. Buchheit, D.L. Ho, M. Forsyth, Inhibition of AA2024-T3 on a phase-by-phase basis using an environmentally benign inhibitor, cerium dibuthyl phosphate, Electrochem. Solid St. 8 (2005) 180-183.
- [28] J. Wang, B. Zhang, Y.T. Zhou, X.L. Ma, Multiple twins of a decagonal approximant embedded in S-AlCuMg phase resulting in pitting initiation of a 2024Al alloy, Acta Mater. 82 (2015) 22–31.
- [29] Y.Q. Chen, S.P. Pan, W.H. Liu, X. Liu, C.P. Tang, Morphologies, orientation relationships, and evolution of the T-phase in an Al-Cu-Mg-Mn alloy during homogenisation, J. Alloys Compd. 709 (2017) 213–226.
- [30] Y.Q. Chen, S.P. Pan, B.X. Zhu, X. Liu, W.H. Liu, S.W. Tang, The evolution of orientation relationships during the transformation of a twin-free T-particle to tenfold T-twins in an Al alloy during homogenisation, Mater. Charact. (2018) 59–73.
- [31] H. Perlitz, A. Westgren, The crystal structure of Al2CuMg, Ark. Kemi Min. Geol. 16B (1943) 1–5.
- [32] C. Wolverton, Crystal structure and stability of complex precipitate phases in Al-Cu-Mg-(Si) and Al-Zn-Mg alloys, Acta Mater. 49 (2001) 3129–-3142.
- [33] Y.Q. Chen, D.Q. Yi, Y. Jiang, B. Wang, D.Z. Xu, S.C. Li, Twinning and orientation relationships of T-phase precipitates in an Al matrix, J. Mater. Sci. 48 (2013) 3225–3231.
- [34] Z.Q. Feng, Y.Q. Yang, B. Huang, N.H. Li, Y.X. Chen, J.G. Ru, Crystal substructures of the rotation-twinned T (Al20Cu2Mn3) phase in 2024 aluminum alloy, J. Alloys Compd. 583 (2014) 445-–451.
- [35] Y.A. Bagaryatsky, Zhn Tekhn Fiziki 18 (1948) 827.
- [36] J. Majimel, G. Molenat, F. Danoix, D. Blavette, G. Lapasset, M.J. Casanove, A study of the hardening precipitation in a 2650 aluminium alloy for aeronautics, Mater. Sci. Forum 396 (2002) 1025–-1030.
- [37] G.B. Winkelman, K. Raviprasad, B.C. Muddle, Orientation relationships and lattice matching for the S phase in Al-–Cu-–Mg alloys, Acta Mater. 55 (2007) 3213–3228.
- [38] L. Kovarik, M.K. Miller, S.A. Court, M.J. Mills, Origin of the modified orientation relationship for S(S”)-phase in Al–-Mg–Cu alloys, Acta Mater. 54 (2006) 1731–-1740.
- [39] V. Radmilovic, R. Kilaas, U. Dahmen, G.J. Shiflet, Structure and morphology of S-phase precipitates in aluminum, Acta Mater. 47 (1999) 3987–3997.
- [40] M.J. Styles, C.R. Hutchinson, Y. Chen, A. Deschamps, T.J. Bastow, The coexistence of two S (Al2CuMg) phases in Al-–Cu-–Mg alloys, Acta Mater. 60 (2012) 6940–6951.
- [41] M.J. Styles, R.K.W. Marceau, T.J. Bastow, H.E.A. Brand, M.A. Gibson, C.R. Hutchinson, The competition between metastable and equilibrium S (Al2CuMg) phase during the decomposition of Al–Cu–Mg alloys, Acta Mater. 98 (2015) 64–80.
- [42] T.S. Parel, S.C. Wang, M.J. Starink, Hardening of an Al–Cu–Mg alloy containing Types I and II S phase precipitates, Mater. Des. 31 (2010) S2-–S5.
- [43] Nanomegas, ASTAR - Application notes nanoscale TEM orientation imaging analysis, (2016) 1–32. www.nanomegas.com
- [44] P. Moeck, S. Rouvimov, E.F. Rauch, M. Véron, H. Kirmse, I. Häusler, W. Neumann, D. Bultreys, Y. Maniette, S. Nicolopoulos, High spatial resolution semi-automatic crystallite orientation and phase mapping of nanocrystals in transmission electron microscopes, Cryst. Res. Technol. 46 (2011) 589–606.
- [45] J.S. Barnard, D.N. Johnstone, P.A. Midgley, High-resolution scanning precession electron diffraction: Alignment and spatial resolution, Ultramicroscopy 174 (2017) 79–88.
- [46] E.F. Rauch, J. Portillo, S. Nicolopoulos, D. Bultreys, S. Rouvimov, P. Moeck, Automated nanocrystal orientation and phase mapping in the transmission electron microscope on the basis of precession electron diffraction, Z. Kristallogr. 225 (2010) 103–-109.
- [47] pyxem.github.io/pyxem - Version 0.5.1
- [48] F. de la Peña et al., HyperSpy - 1.3.1 (2018), DOI: 10.5281/zenodo.592838.
- [49] F. de la Peña et al., Electron Microscopy (Big and Small) Data Analysis With the Open Source Software Package HyperSpy. Microsc. Microanal. 23(S1) (2017) 214-215.
- [50] F. Bachmann, R. Hielscher, H. Schaeben, Texture Analysis with MTEX – Free and Open Source Software Toolbox, Solid State Phenom. 160 (2010) 63–68.
- [51] R. Krakow, R.J. Bennett, D.N. Johnstone, Z. Vukmanovic, W.S. Alvarez, S.J. Lainé, J.F. Einsle, P.A. Midgley, C.M.F. Rae, R. Hielscher, On three-dimensional misorienation spaces, Proc. Royal Soc. A, 473 (2017) 20170274.
- [52] Z.Q. Feng, Y.Q. Yang, B. Huang, X. Luo, M.H. Li, M. Han, M.S. Fu, Variant selection and the strengthening effect of S precipitates at dislocations in Al-–Cu-–Mg alloy, Acta Mater. 59 (2011) 2412–2422.
- [53] J. Wang, B. Zhang, Z.B. He, B. Wu, X.L. Ma, Atomic-scale mapping of twins and relevant defective structures in Al20Cu2Mn3 decagonal approximant, Philos. Mag. 96 (2016) 2457–2467.
- [54] E.F. Rauch, M. Véyron, Automated crystal orientation and phase mapping in TEM, Mater. Charact. 98 (2014) 1–9.
- [55] F. Zupani, D. Wang, C. Gspan, T. Bonina, Precipitates in a quasicrystal- strengthened Al-Mn-Be-Cu alloy, Mater. Charact. 106 (2015) 93-–99.
- [56] Y.Q. Chen, S.P. Pan, S.W. Tang, W.H. Liu, C.P. Tang, F.Y. Xu, Formation mechanisms and evolution of precipitate-free zones at grain boundaries in an Al-Cu-Mg-Mn alloy during homogenization, J. Mater. Sci. 51 (2016) 7780–-7792.
- [57] C.R. Hutchinson, X. Fan, S.J. Pennycook, G.J. Shiflet, On the origin of the high coarsening resistance of plates in Al–Cu–Mg–Ag alloys, Acta Mater. 49 (2001) 2827–2841.