Pressure-induced densification of vitreous silica: insight from elastic properties
Abstract
In situ high-pressure Brillouin light scattering experiments along loading-unloading paths are used to investigate the compressibility of vitreous silica. Below , the equation of state obtained from the sound velocities corrected for dispersion agrees with volume measurements. Conversely, huge anelastic effects are observed in the range , unveiling the reversible transformation from the fourfold-coordinated structure to the sixfold one. The associated density changes correlate with the average Si coordination number. Decompression curves from above reveal abrupt backward coordination changes around and significant hysteresis. Contrary to common wisdom, the residual densification of the recovered silica samples can be figured out from changes in elastic properties along pressure cycles, ruling out a plastic description of the latter process.
Changes in the structure of network-forming glasses occur in response to applied pressure . Moreover, different amorphous states with distinct short- and/or intermediate-range orders as well as contrasting physical properties can be produced following separate thermo-mechanical paths. Even if these phenomena, termed polyamorphism, have been extensively studied during the last decades, their complete understanding still remain an ongoing challenge. It relates to the difficulty in carrying out conclusive experiments at high . Beyond physics of the amorphous state, a comprehensive knowledge of polyamorphism has significance for the development of new functional glassy materials, particularly if novel high-pressure forms are recoverable to ambient conditions McMillan (2002); Brazhkin (2007).
Vitreous silica (-SiO2) is the archetypal tetrahedral network-forming glass whose behavior under pressure is of long-standing interest due to its primary importance as the analog material of silicates in geophysics Sanloup et al. (2013); Millot et al. (2015). At room temperature, the hydrostatic compression is reversible up to Meade and Jeanloz (1987); Tsiok et al. (1998). When compressed above this limit, the recovered glasses after complete unloading exhibit residual densification. The latter saturates at about 20% for maximum pressures around Polian and Grimsditch (1993). In situ experiments above show that the density of the squeezed silica glass further increases gradually and becomes comparable to that of stishovite, the sixfold coordinated crystalline polymorph, above Sato and Funamori (2008). The basic mechanisms of the SiO2 network collapse upon compression have been early identified as i) the reduction of the SiOSi bond angle between SiO4 tetrahedra below , ii) the change in the ring size distribution, and iii) the progressive increase in the Si coordination number from four to six, the latter being not quenchable at ambient pressure Hemley et al. (1986); Williams and Jeanloz (1988); Susman et al. (1991); Meade et al. (1992); Zha et al. (1994); Sato and Funamori (2008); Brazhkin (2009); Benmore et al. (2010); Sato and Funamori (2010); Zeidler et al. (2014a); Trease et al. (2017); Prescher et al. (2017).
Beyond structural studies, investigations of the thermodynamical and relaxational properties have proven to be enlightening. For instance, sound velocity measurements have revealed the anomalous negative pressure derivatives of elastic moduli at low Kondo et al. (1981). They have also provided an equation of state (EoS) density vs pressure for -SiO2 below Schroeder et al. (1990); Zha et al. (1994); Weigel et al. (2012); Coasne et al. (2014). The stiffening of the elastic moduli, associated with residual densification of the recovered glasses at ambient conditions, has also been evidenced many times Grimsditch (1984); Polian and Grimsditch (1990); Rouxel et al. (2010). Accurate volumetric experiments at pressures below have revealed several features of polyamorphism in some other glasses among which logarithmic kinetics and significant inelastic effects are the more salient ones Tsiok et al. (1998); Brazhkin et al. (2008, 2016). However, most of the studies reported so far involve compression only. Although it is admitted that the high- octahedral structure of -SiO2 reverts back to the tetrahedral one at ambient conditions, little is known about this back transformation and its relation with other properties like density or elastic properties. The same is true for the residual densification process. In this Letter, we re-investigate the variations of sound velocities in -SiO2 using pressure cycles and in situ Brillouin light scattering experiments of unprecedented quality. Combined with density data we provide a series of quantitative results related to the transformations along the loading-unloading paths.
High pressures were generated using Chervin-type diamond anvil cells (DAC) with cullets of diameter. Samples of about were made from a thick polished plate of Tetrasil SE fused silica ([OH] 100 ppm). They were each loaded in a chamber of diameter drilled in rhenium gasket together with ruby-spheres to measure the pressure Chervin et al. (2001). The accuracy on pressure measurements was and the pressure-transmitting medium was argon fluid to ensure an hydrostatic stress up to the highest . In situ high pressure Brillouin light scattering (BLS) experiments were performed using a standard triple-pass tandem interferometer Lindsay et al. (1981) and a single line diode-pumped solid-state laser operating at = . All the measurements were obtained at room temperature in the symmetric platelet geometry with a scattering angle of Weigel et al. (2012). The collection aperture was limited using a curved slit matching the spurious geometrical broadening of the Brillouin lines to the resolution of the spectrometer Vacher et al. (2006). From the Brillouin frequency shifts, the velocity of the high frequency () longitudinal and transverse acoustic waves, and respectively, are obtained. These are related to the bulk modulus and to the shear modulus ,
| (1) |
where is the density.
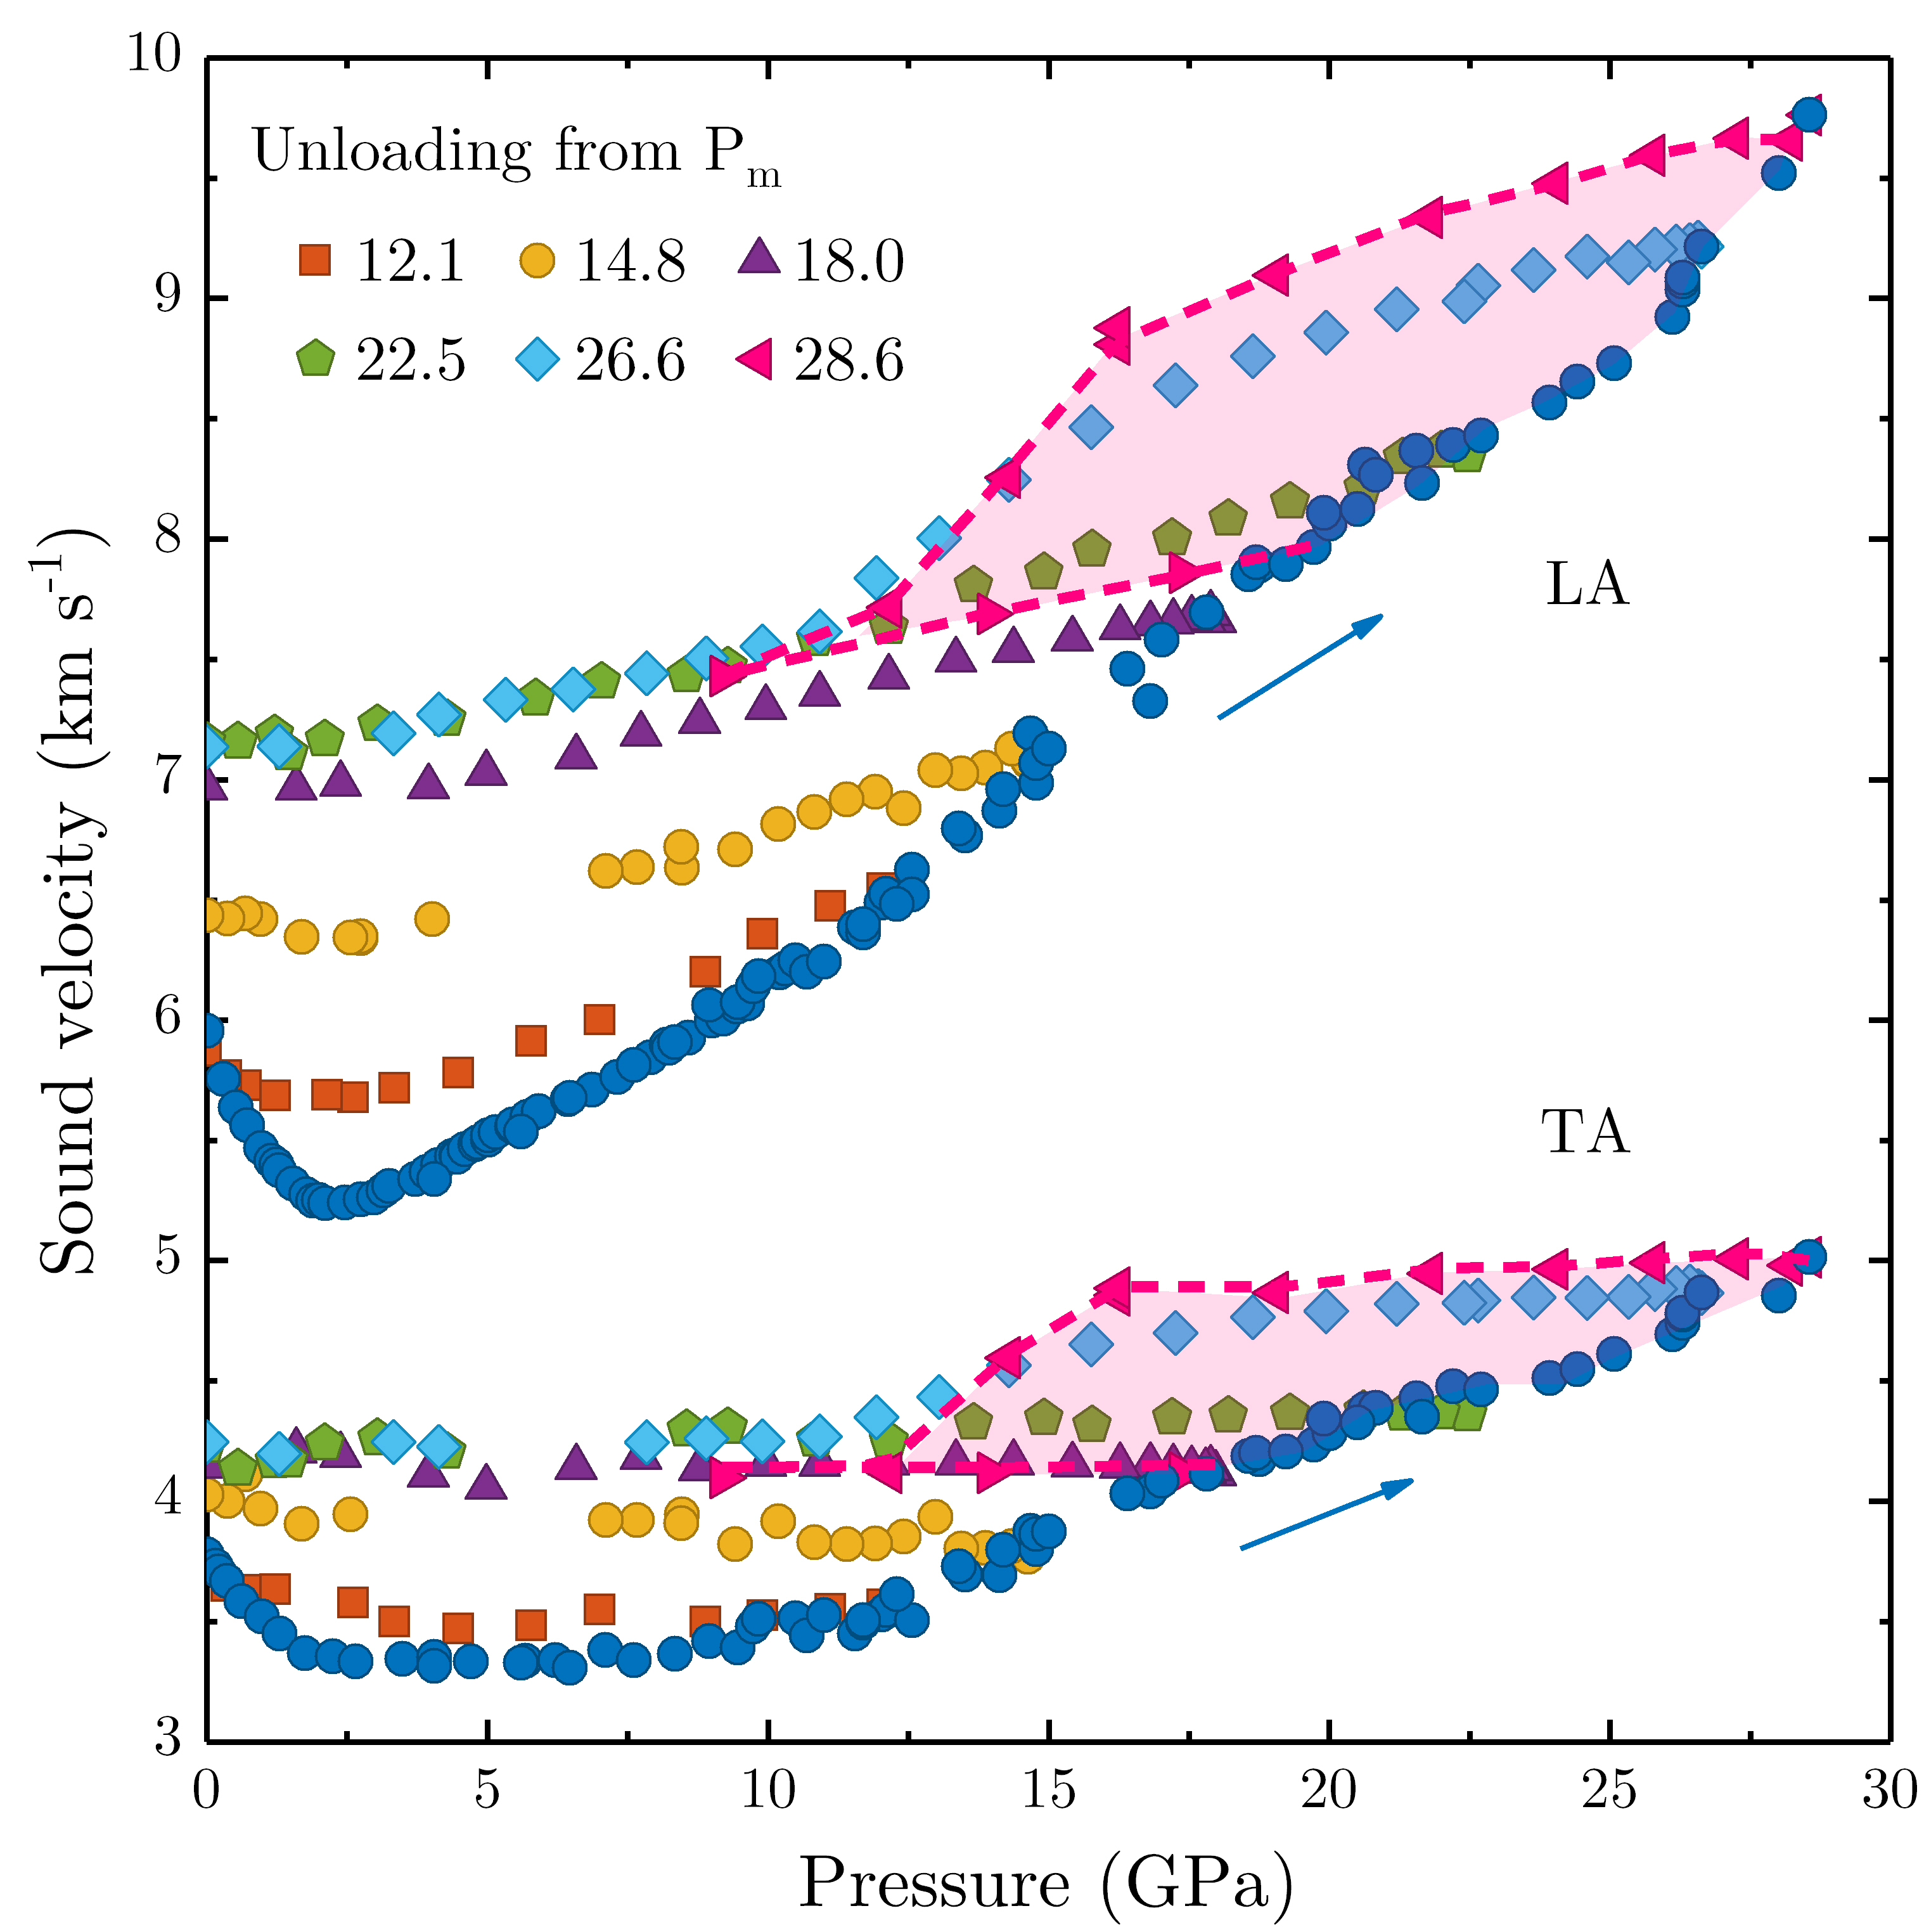
Compression-decompression cycles reaching various maximum pressures extending up to nearly have been carried out. As expected, the results found upon compression for both LA and TA velocities, shown as blue circles in Fig. 1, superimpose on a single curve for all cycles. For , the values of the sound velocities upon decompression also match the ones on compression within the accuracy of the measurements (See S-I and Fig. S1 in Supplemental Material). The other symbols in Fig. 1 show the results acquired for decompression paths from higher ranging from . Upon decompression, the velocities are larger than those obtained in the compression part of the cycles, indicating strong modifications in the elastic properties, but also revealing unsuspected hysteresis phenomena at high (pink shaded area in Fig. 1). These two points will be discussed later on.
We will focus our analysis on the quantity where is a compressibility. This quantity is actually of prime interest since it gives the infinitesimal density variation associated with a pressure variation . Volumetric measurements give a direct access to the static compressibility , and to the density using the mass conservation, thus leading to . The cumulative sum of the is the density increase as a function of . On the other hand, sound velocities are directly related to the quantity, , where for isotropic materials, see Eq. 1. It indicates that is a direct measure of an apparent density variation related to elastic and frequency dependent viscoelastic processes,
| (2) |
For a continuous function, can always be calculated and does not require knowledge of . The cumulative sum of the is an apparent density increase as a function of . For an elastic solid, and so that the pressure dependence of the density can be straightforwardly obtained iteratively using Eq. 2, starting from the known density at a pressure Schroeder et al. (1990); Zha et al. (1994); Weigel et al. (2012); Coasne et al. (2014).
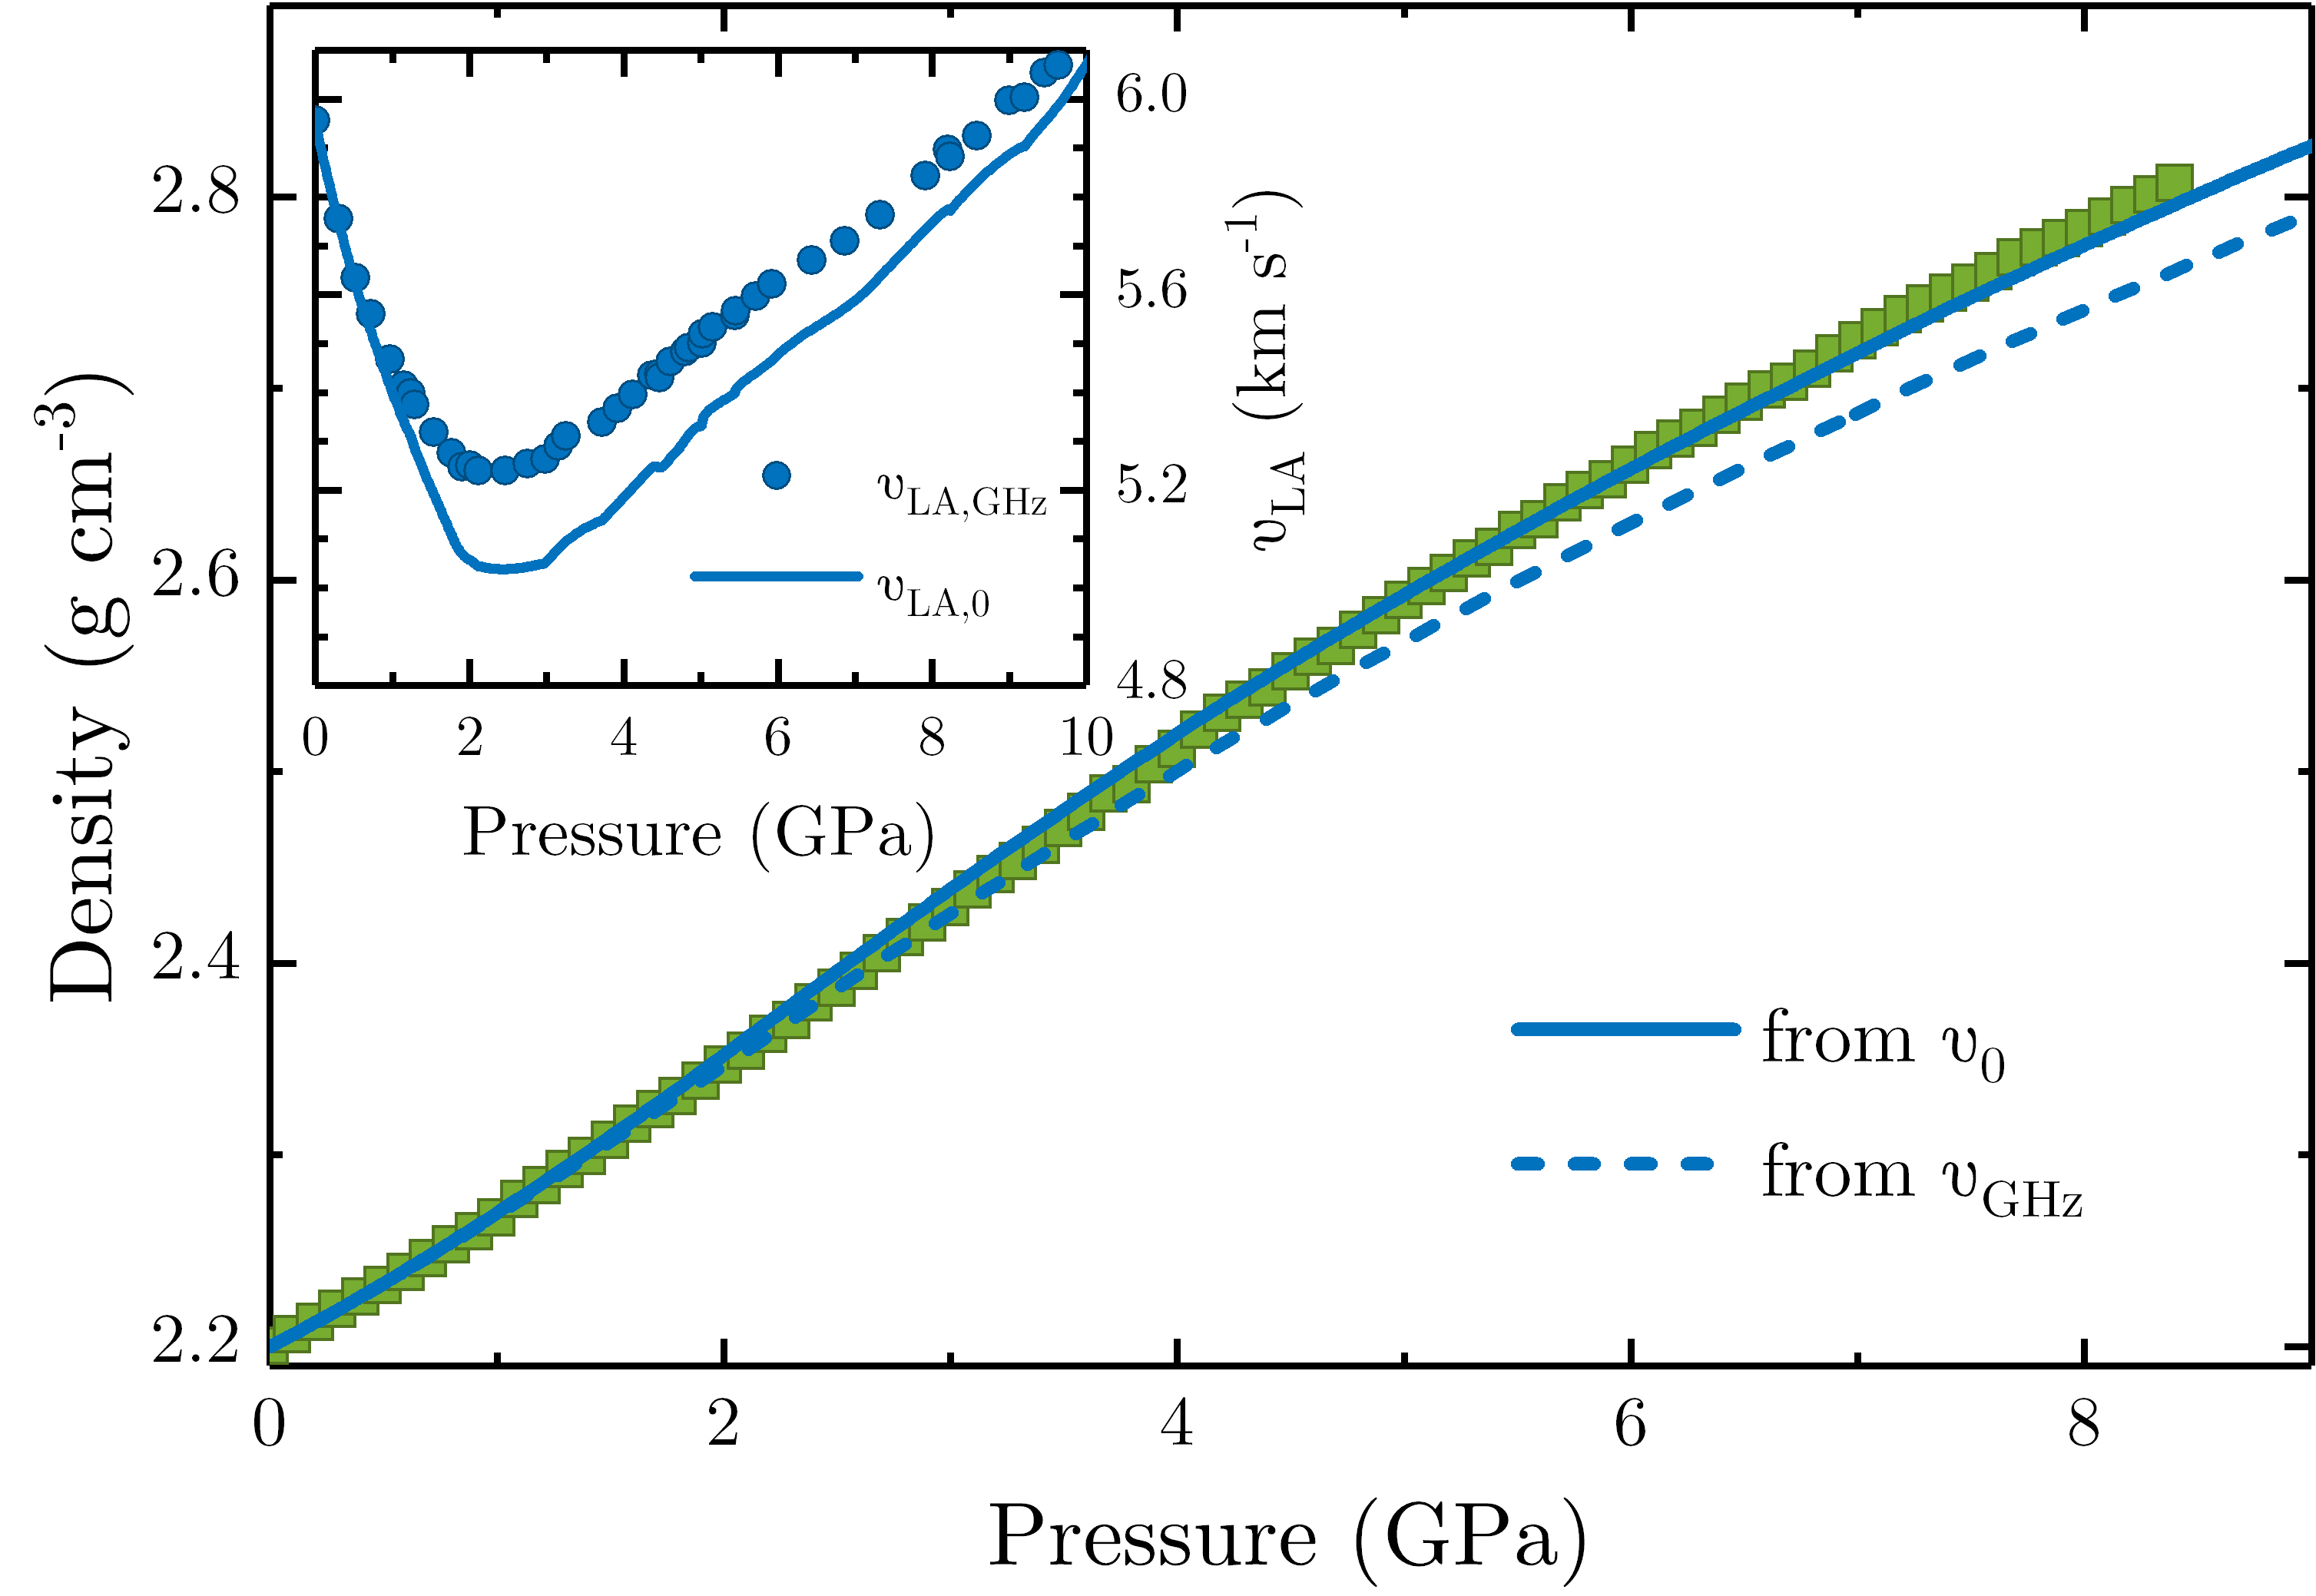
We start our analysis by focusing on the low part of the compression. Fig. 2 shows the density increase of -SiO2 as a function of the applied pressure for . The squares are from volumetric measurements using an accurate strain-gauge technique Tsiok et al. (1998), thus referring to the static compressibility . The dashed line in Fig. 2 is the curve calculated using the velocities acquired upon compression and Eq. 2. The latter is slightly lower than the experimental static values. This is actually explained by the frequency dependence of sound velocities caused by internal friction, i.e. viscoelastic effects. Two dissipative processes dominate in glasses at room temperature (See S-II in Supplemental Material): the interaction with relaxing structural entities called defects Anderson and Bömmel ; Jäckle et al. (1976) and the anharmonic interactions with thermal vibrations Maris (1971). Accordingly, sound velocities should vary between a low-frequency (relaxed) value and a high-frequency (unrelaxed) one . A quantitative description of velocity dispersion exists for -SiO2 Vacher et al. (2005) which has been extended to high pressures Ayrinhac et al. (2011). It results in the curve for LA modes shown in the inset in Fig. 2, significantly lower than the velocities at GHz frequencies (see also Fig. S2 in Supplemental Material). Using the relaxed velocities and Rufflé et al. (2010), a new curve is determined from Eq. 2 which is plotted as a solid line in Fig. 2. These new variations are appreciably larger than those deduced from uncorrected velocities, and stand very close to the experimental static values. This result highlights the need to take into account the viscoelastic character of the medium to obtain a fair estimate of the EoS.
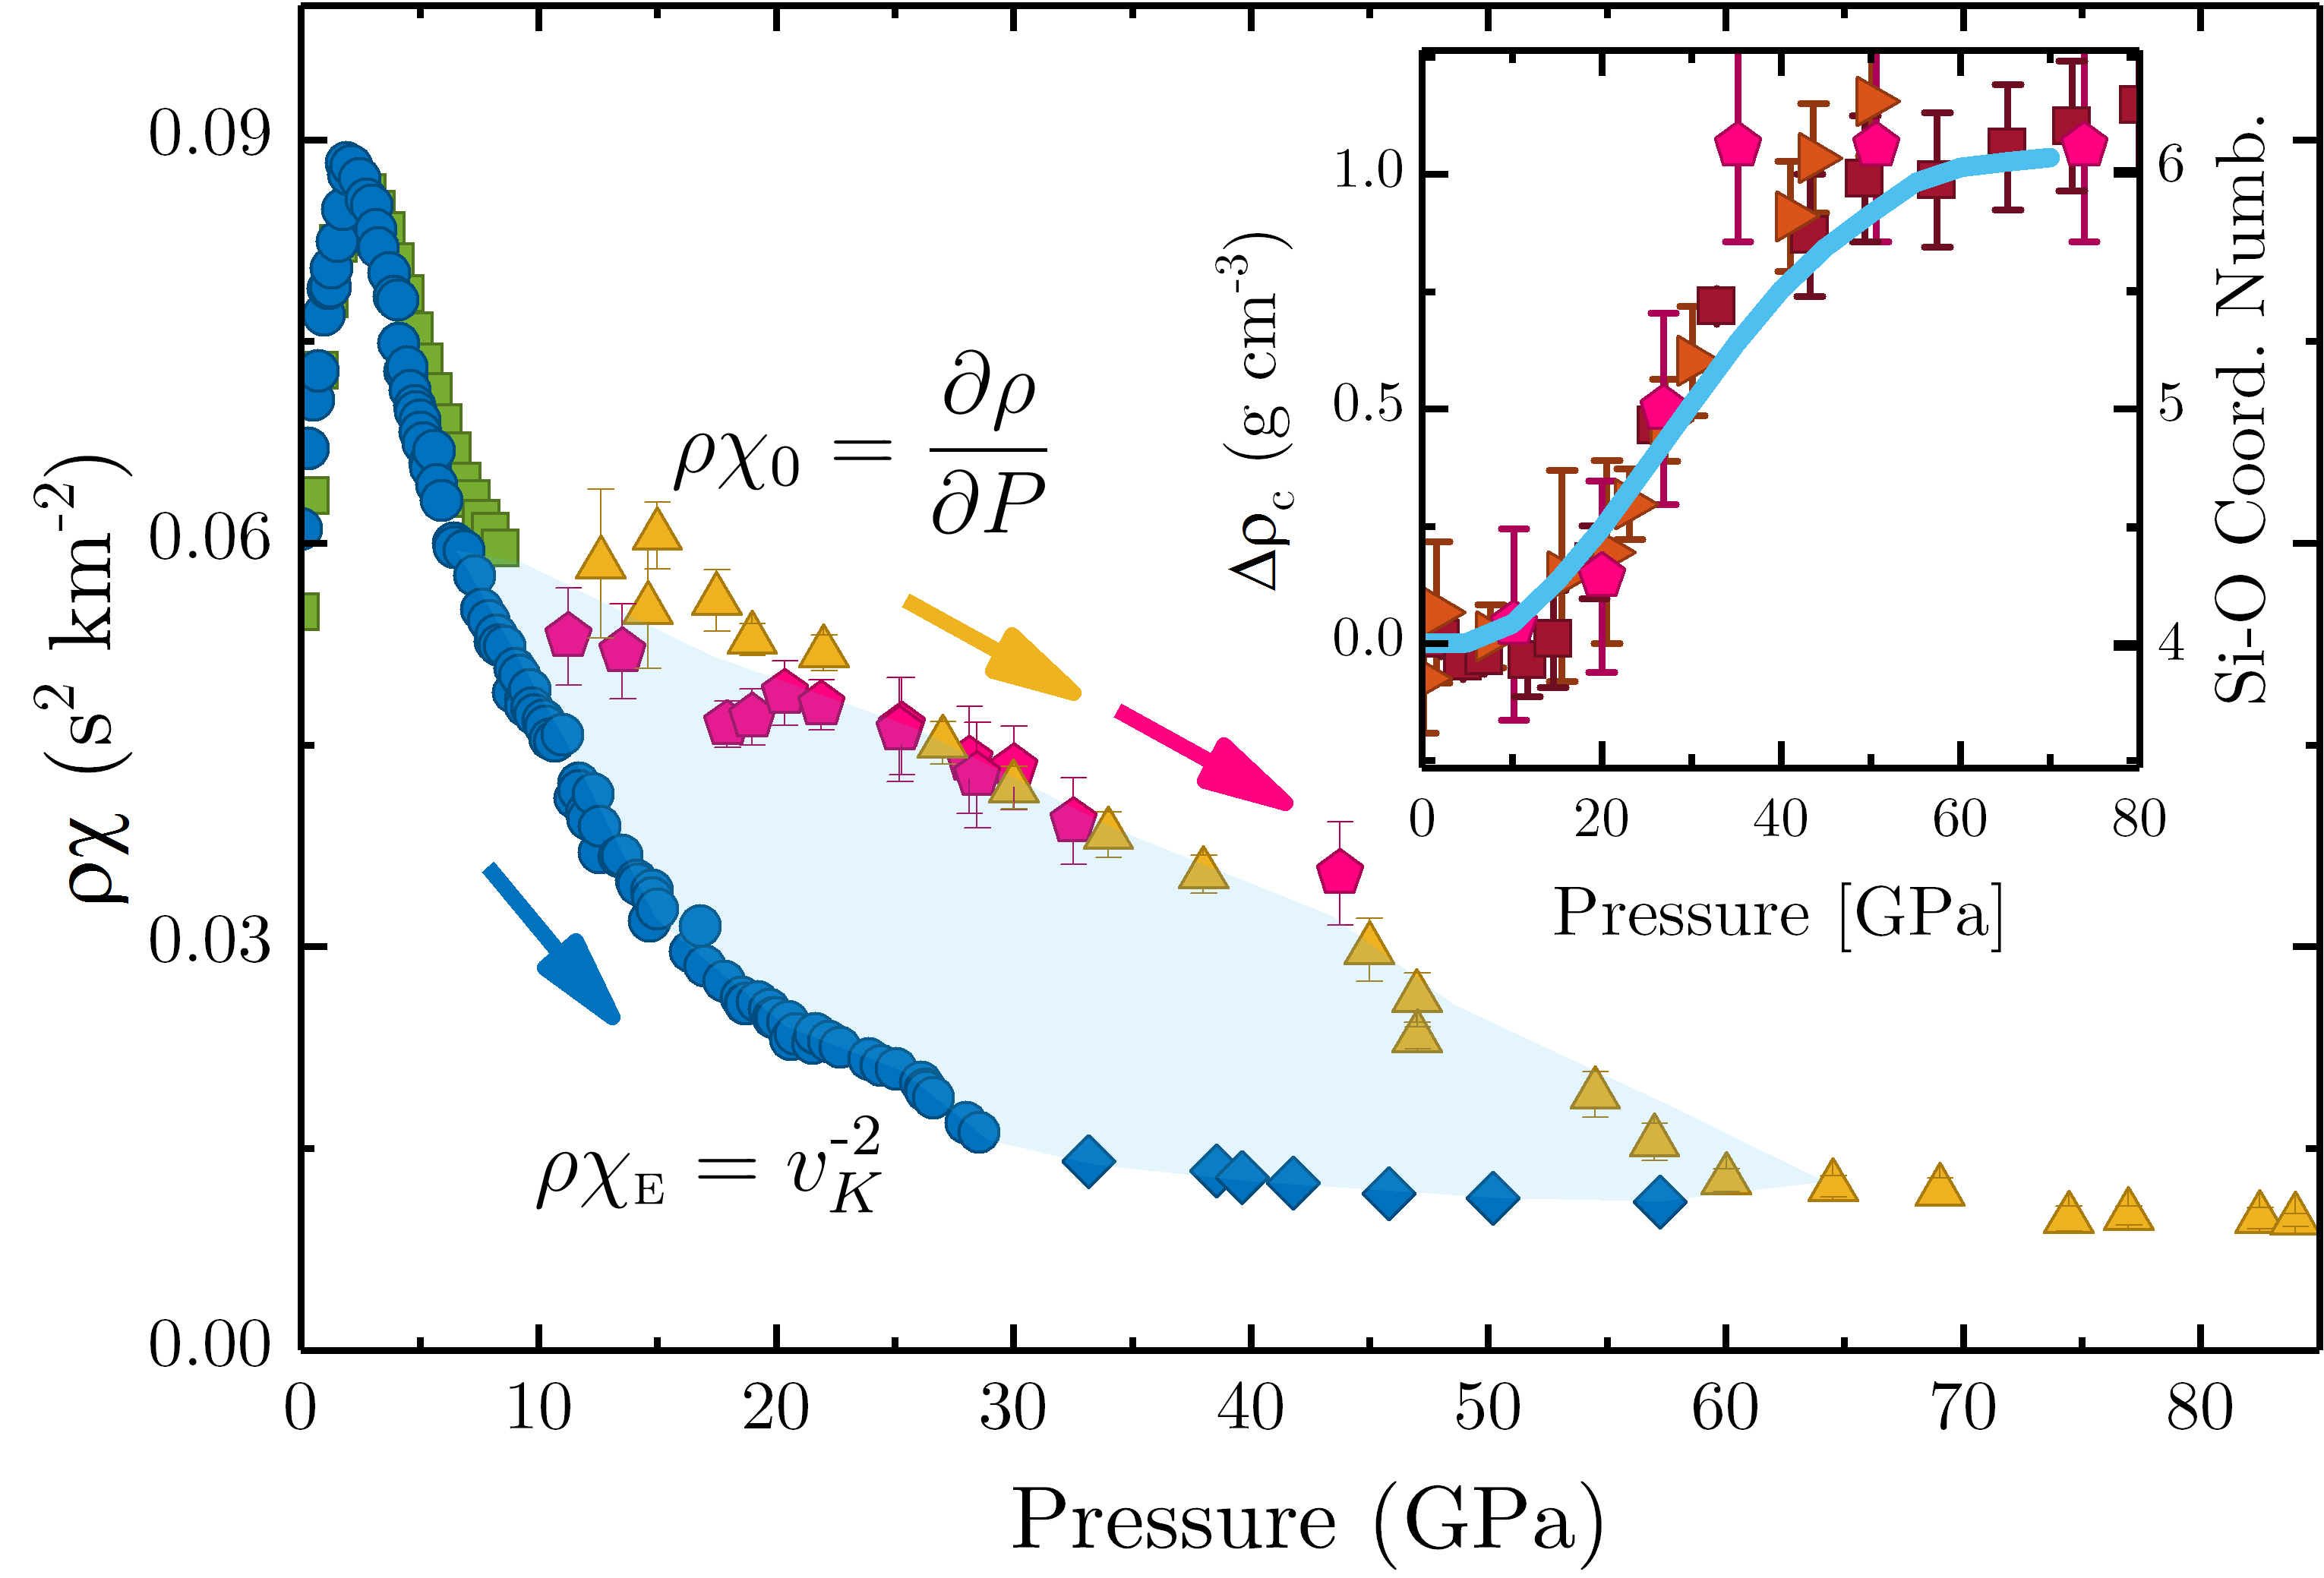
Even corrected from the dynamical effects discussed above, the values obtained for lead however to a compressibility which remains much smaller than . This is shown in Fig. 3, where the pressure dependence of upon compression (blue circles) is plotted. Our data are completed by those of Zha et al. (1994) at the highest (blue lozenges). These values can be compared to the static ones, , calculated using densities from literature Tsiok et al. (1998); Sato and Funamori (2008); Petitgirard et al. (2017), and also shown in Fig. 3 (See also S-III and Fig. S4 in Supplemental Material). Following Fig. 2, and superimpose below . Above, decreases much more rapidly than , their ratio reaching a factor 3 around . At the two curves merge again, indicating that vitreous silica recovers an almost elastic behavior at high .
Two compaction processes can be invoked to explain the difference between the two compressibilities: i) volume non-conservative plastic flow processes which upon decompression would lead to a residual densification. ii) slow relaxation processes appearing frozen in at the high BLS frequencies, and thus hardening the network, which could result from structural transformations existing in this range. The two mechanisms can exist side by side and it is a priori impossible to estimate them separately from the data plotted in Fig. 3. Let us calculate the compaction associated with the difference between the two curves for a step in pressure,
| (3) |
which relates to the compaction missing in the measured . The cumulative sum of the latter quantity is reported in the inset in Fig. 3 as a solid line. gently starts to increase around to eventually end up around , having its maximum rate around . An increase in density of about is obtained for this contribution. We notice that this value is about twice as high as the known maximum residual densification observed in vitreous silica, i.e. , thus confirming the presence of slow relaxational mechanisms. The mean SiO coordination number as a function of from recent diffraction experiments Benmore et al. (2010); Sato and Funamori (2010); Prescher et al. (2017) is also plotted in the inset in Fig. 3 using the same relative scale. One observes a remarkable superposition with the calculated . They almost increase at the same rate, strongly suggesting that originates solely from the progressive transformation from the fourfold-coordinated structure to the sixfold one, rather than from plastic flow.
We now turn to the unloading part of the cycles for . Comparing the decompression curve from (pink left triangles in Fig. 1) to the one from (green pentagons), we first remark that significantly larger velocities are found at high for the former, while both curves coincide on the low- side. Re-increasing the pressure from (pink right triangles), we observe further that the velocities behave differently from the decompression curve and merge eventually with the initial compression one at . This suggests an hysteresis phenomenon, illustrated as a pink shaded area in Fig. 1. The latter might be due to the fivefold- and sixfold-coordinated Si atoms remaining stable during decompression. In that picture, the progressive structural transformation modifies the elastic properties, both the static and the apparent ones probed by BLS, thus also unveiling the delayed revert transformation through the hysteresis in the sound velocities. From Fig. 1), we observe that the return to the tetrahedral structure would then occur between and more abruptly than the progressive direct transformation upon compression. We can anticipate that volume measurements upon decompression from above should also reveal similar rapid changes. There are indeed some converging indications of the latter from diffraction experiments Sato et al. (2018) as well as from ab initio molecular dynamics simulations Ryuo et al. (2017). Further, similar behaviors were also reported for the trigonally coordinated network former -B2O3 Nicholas et al. (2004); Huang et al. (2008); Brazhkin et al. (2008); Zeidler et al. (2014b). It was proposed that changes in the BO coordination number were gradual upon compression but abrupt at the time of decompression Nicholas et al. (2004); Huang et al. (2008), an interpretation which has however been questioned Brazhkin et al. (2009).
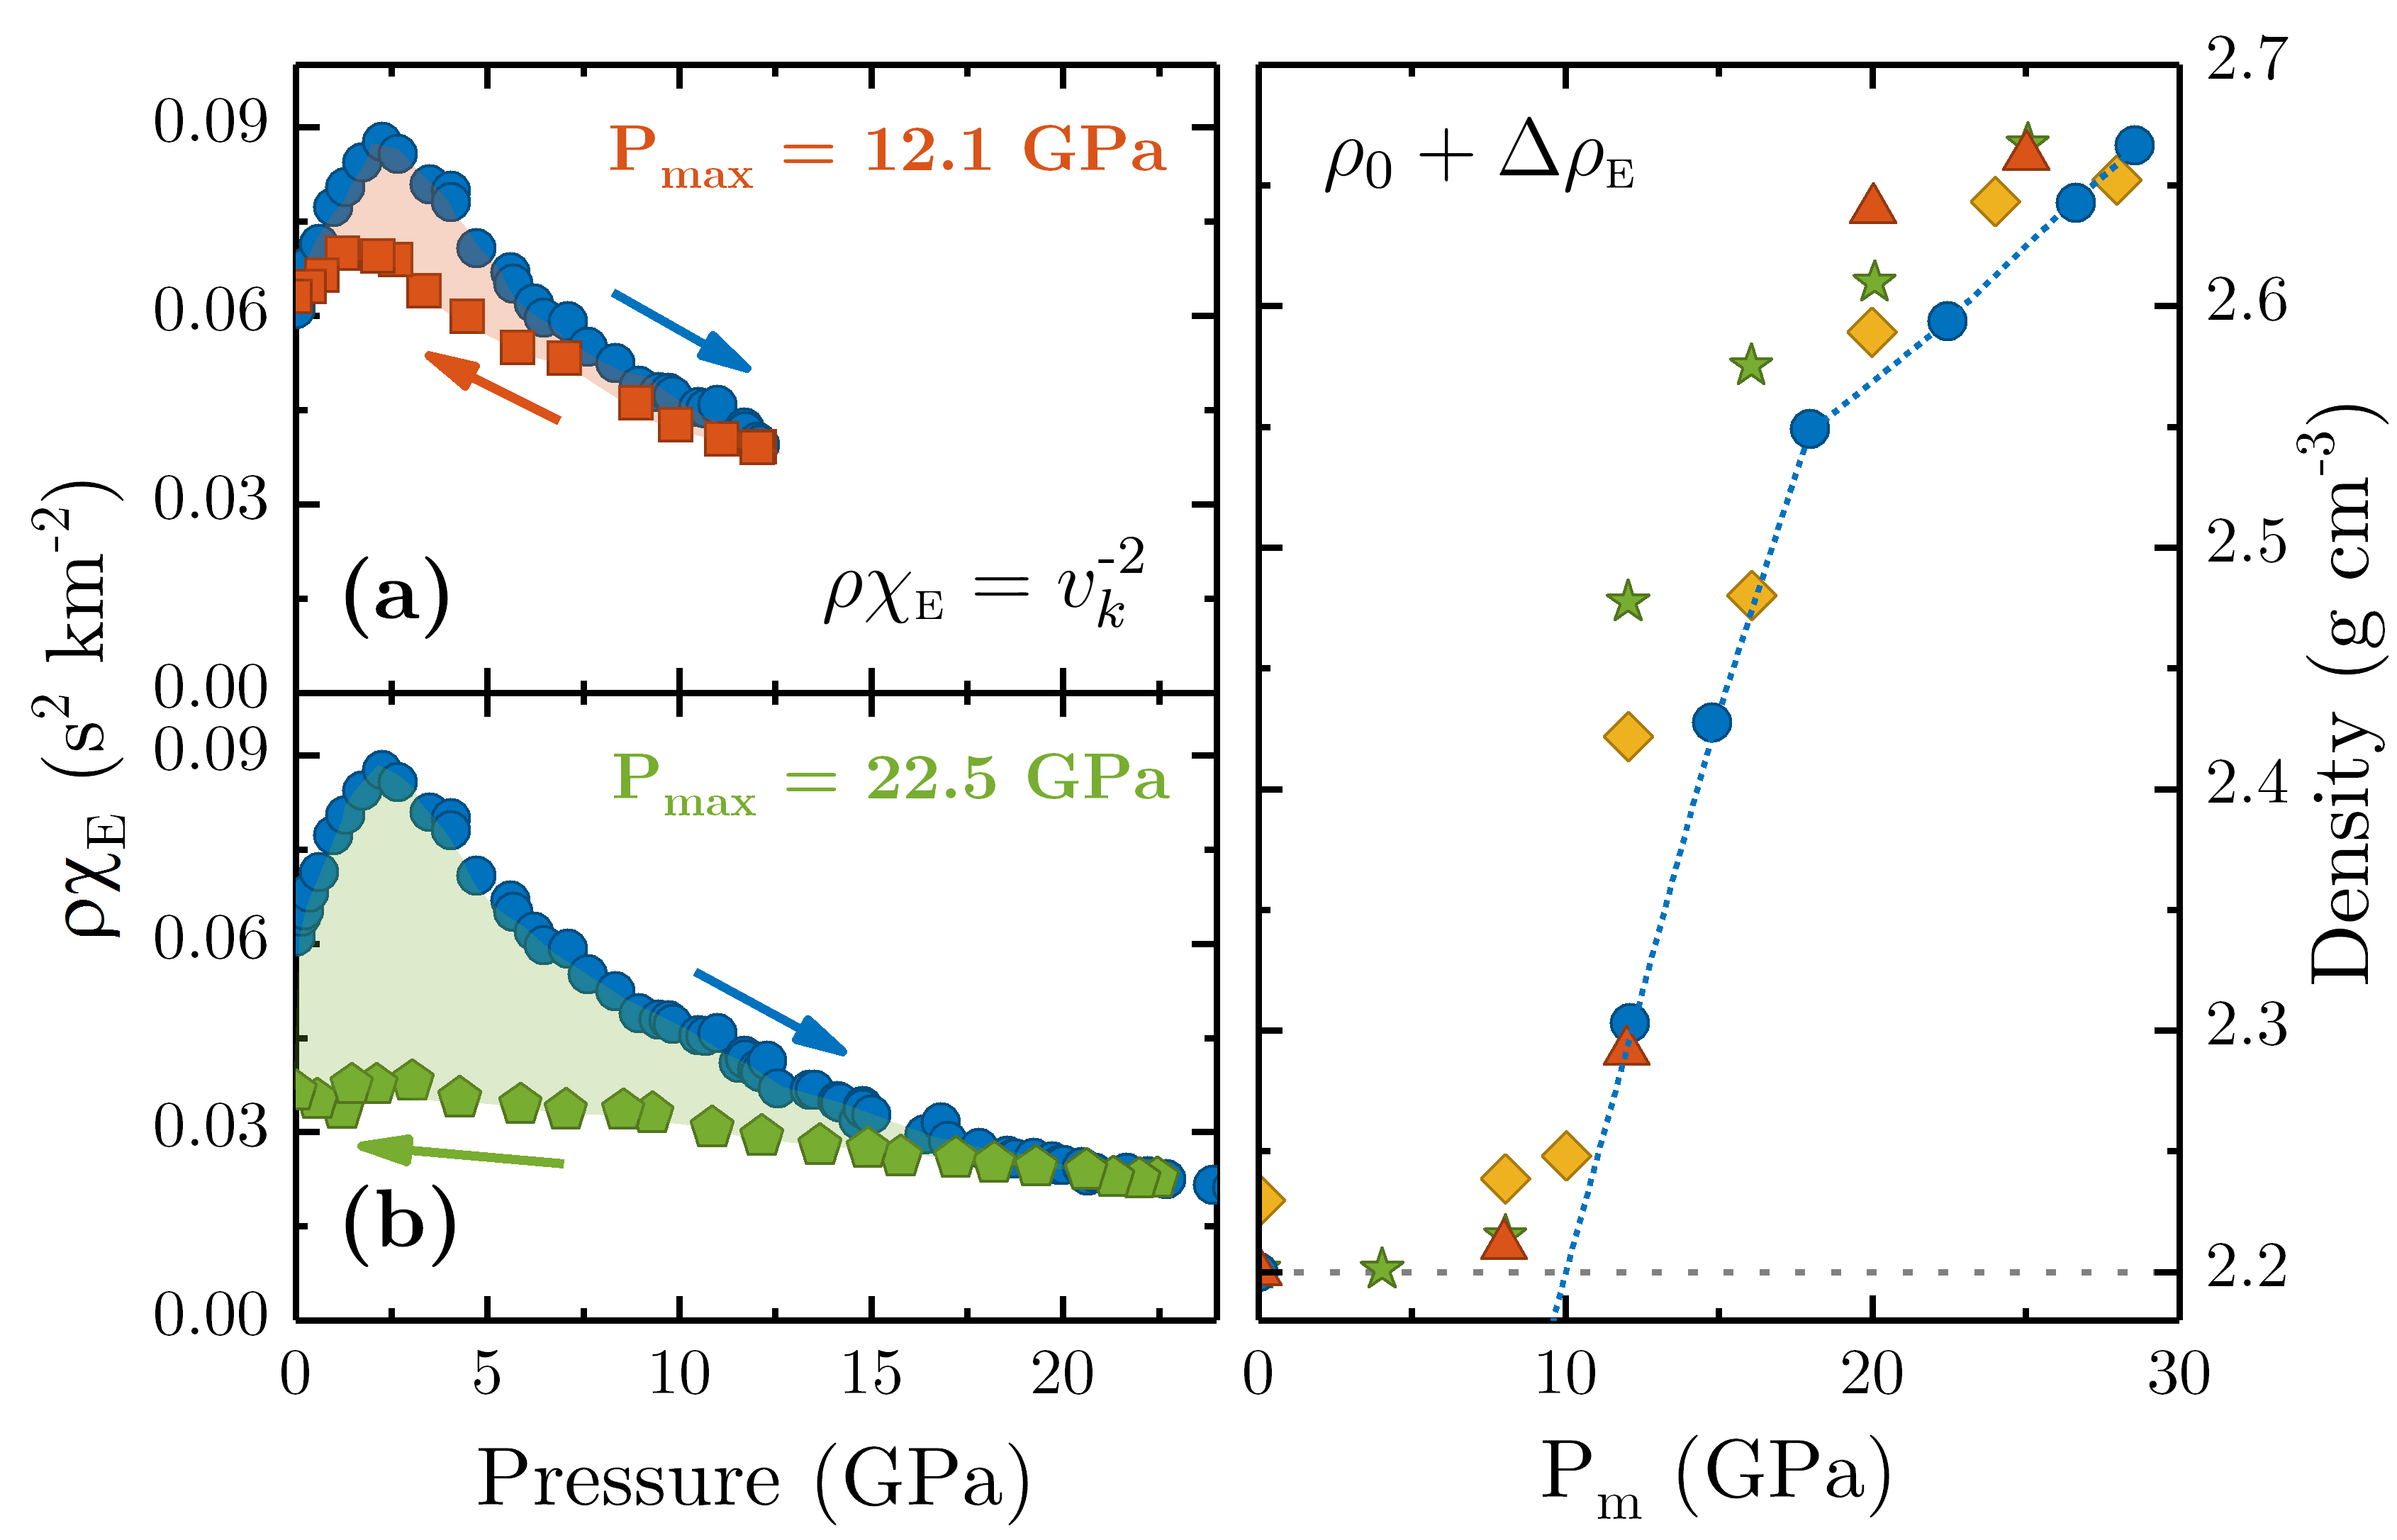
Finally, we address the issue of the residual densification. As shown in Fig. 1, the final sound velocity after a complete pressure release is generally higher than that of the pristine sample, reflecting strong modifications in the elastic properties. This final value increases strongly when goes from and tends to saturate above. Following Eq. 2, we can calculate the cumulative changes in density along compression-decompression cycles. Figs. 4a and 4b illustrate the variations of along a cycle for two different . The shaded area, which reflects , increases with increasing . The obtained final densities are shown in Fig. 4(c) as a function of (blue circles). starts to increase for until about beyond which it tends to saturate at , a value in agreement with the maximum residual densification observed in vitreous silica. To our knowledge, there exists only one set of experimental data for the residual densification as a result of hydrostatic compression at room temperature (red triangles Rouxel et al. (2008)) allowing a comparison with our results at , 20 and . The latter densities also agree with our outputs. If the had been calculated from the BLS velocities without being corrected for the dynamical dissipative effects, they would have been underestimated by about 10% (See Fig. S3 in Supplemental Material). We also note that the hysteresis at high , ascribed to changes in the coordination number, affects the estimate of the residual densification for the highest , however marginally due to the very low compressibility of the highly compacted network (See S-IV and Fig. S5 in Supplemental Material). Moreover, our results also compare fairly well to estimates of the residual densification based on numerical simulations Liang et al. (2007); Sundararaman et al. (2018) also plotted in Fig. 4(c). While showing the same general trend, the latter exhibit slightly larger variations in the initial stages of the densification process. Some other numerical results show qualitatively similar results, albeit with a larger densification rate Mantisi et al. (2012).
It is remarkable that, even if slow anelastic effects prevent obtaining the EoS from sound velocities using Eq. 2, the residual densification can be figured out from the latter. This reveals that the underlying process does not relate to volume non-conservative plasticity but rather to continuous changes in the elastic properties of silica along the compression-decompression cycle. It is interesting to note that residual densification, often called permanent densification, is however reversible at room temperature over periods of several years, showing the metastable character of the residual densification Polian and Grimsditch (1990). Annealing densified samples at a few hundred degrees above room temperature is sufficient to rapidly recover the pristine density Mackenzie (1963); Rat et al. (1999); Guerette et al. (2015). This indicates that irreversible volume non-conservative plastic flow does not occur in hydrostatic compression of silica glass at room temperature, even if this result does not preclude the existence of shear plastic flow in mechanical load testings including shear stress. Residual densification and coordination changes are not two independent processes. The former starts indeed for above , in coincidence with the mean SiO coordination number increase and in agreement with the idea that fivefold defects could promote the residual densification Liang et al. (2007). However, residual densification saturates around while the mean SiO coordination number reaches 4.5 only Benmore et al. (2010); Sato and Funamori (2010); Prescher et al. (2017). To the extent that changes in coordination number disappear at decompression, the residual densification process would rather manifest in the topology of the network via, in particular, changes in ring statistics within the structure Ryuo et al. (2017); Takada (2018).
Summarizing, we show that the large difference between the static compressibility and that extracted from BLS experiments can be used to monitor the pressure window where slow structural rearrangements occur in vitreous silica. The associated compaction rate upon compression is quantified and successfully compared to the SiO average coordination number. Out of this pressure window, vitreous silica behaves almost elastically and the equation of state can be recovered from the sound velocities corrected from dispersion effects, significant at low pressure. Besides, this transformation displays a significant hysteresis. Finally, we find out that the large difference observed in the sound velocity data along the loading-unloading path does account for the residual densification of the recovered silica samples. This reveals that the underlying process does not relate to volume non-conservative plasticity but rather to continuous changes in the elastic properties.
More generally, this work also shows that complete pressure cycles certainly deserve more attention and that precise density and sound velocity measurements, when combined, give fundamental insights into pressure-induced transformations in glasses. That would be definitely interesting to address the case of -B2O3 or -GeO2 for example. For the latter, there are indications that polyamorphism with coordination numbers higher than six occurs above Brazhkin et al. (2011); Kono et al. (2016), which would justify similar work. Concerning -B2O3, such approach should help in solving the controversy existing about the rapid changes in the structure and the elastic properties upon decompression.
This work was supported by the French National Research Agency programs MECASIL ANR-12-BS04-0004-03 and PIPOG ANR-17-CE30-0009.
References
- McMillan (2002) P. McMillan, Nat. Mater. 1, 19 (2002).
- Brazhkin (2007) V. Brazhkin, High Pressure Res. 27, 333 (2007).
- Sanloup et al. (2013) C. Sanloup, J. W. E. Drewitt, Z. Konopkova, P. Dalladay-Simpson, D. M. Morton, N. Rai, W. van Westrenen, and W. Morgenroth, Nature 503, 104 (2013).
- Millot et al. (2015) M. Millot, N. Dubrovinskaia, A. Černok, S. Blaha, L. Dubrovinsky, D. G. Braun, P. M. Celliers, G. W. Collins, J. H. Eggert, and R. Jeanloz, Science 347, 418 (2015).
- Meade and Jeanloz (1987) C. Meade and R. Jeanloz, Phys. Rev. B 35, 236 (1987).
- Tsiok et al. (1998) O. B. Tsiok, V. V. Brazhkin, A. G. Lyapin, and L. G. Khvostantsev, Phys. Rev. Lett. 80, 999 (1998).
- Polian and Grimsditch (1993) A. Polian and M. Grimsditch, Phys. Rev. B 47, 13979 (1993).
- Sato and Funamori (2008) T. Sato and N. Funamori, Phys. Rev. Lett. 101, 255502 (2008).
- Hemley et al. (1986) R. J. Hemley, H. K. Mao, P. M. Bell, and B. O. Mysen, Phys. Rev. Lett. 57, 747 (1986).
- Williams and Jeanloz (1988) Q. Williams and R. Jeanloz, Science 239, 902 (1988).
- Susman et al. (1991) S. Susman, K. J. Volin, D. L. Price, M. Grimsditch, J. P. Rino, R. K. Kalia, P. Vashishta, G. Gwanmesia, Y. Wang, and R. C. Liebermann, Phys. Rev. B 43, 1194 (1991).
- Meade et al. (1992) C. Meade, R. J. Hemley, and H. K. Mao, Phys. Rev. Lett. 69, 1387 (1992).
- Zha et al. (1994) C.-s. Zha, R. J. Hemley, H.-k. Mao, T. S. Duffy, and C. Meade, Phys. Rev. B 50, 13105 (1994).
- Brazhkin (2009) V. V. Brazhkin, Phys. Rev. Lett. 102, 209603 (2009).
- Benmore et al. (2010) C. J. Benmore, E. Soignard, S. A. Amin, M. Guthrie, S. D. Shastri, P. L. Lee, and J. L. Yarger, Phys. Rev. B 81, 054105 (2010).
- Sato and Funamori (2010) T. Sato and N. Funamori, Phys. Rev. B 82, 184102 (2010).
- Zeidler et al. (2014a) A. Zeidler, K. Wezka, R. F. Rowlands, D. A. J. Whittaker, P. S. Salmon, A. Polidori, J. W. E. Drewitt, S. Klotz, H. E. Fischer, M. C. Wilding, C. L. Bull, M. G. Tucker, and M. Wilson, Phys. Rev. Lett. 113, 135501 (2014a).
- Trease et al. (2017) N. M. Trease, T. M. Clark, P. J. Grandinetti, J. F. Stebbins, and S. Sen, J. Chem. Phys. 146, 184505 (2017).
- Prescher et al. (2017) C. Prescher, V. B. Prakapenka, J. Stefanski, S. Jahn, L. B. Skinner, and Y. Wang, Proc. Natl. Acad. Sci. 114, 10041 (2017).
- Kondo et al. (1981) K. Kondo, S. Lio, and A. Sawaoka, J. Appl. Phys. 52, 2826 (1981).
- Schroeder et al. (1990) J. Schroeder, T. G. Bilodeau, and X.-S. Zhao, High Pressure Res. 4, 531 (1990).
- Weigel et al. (2012) C. Weigel, A. Polian, M. Kint, B. Rufflé, M. Foret, and R. Vacher, Phys. Rev. Lett. 109, 245504 (2012).
- Coasne et al. (2014) B. Coasne, C. Weigel, A. Polian, M. Kint, J. Rouquette, J. Haines, M. Foret, R. Vacher, and B. Rufflé, J. Phys. Chem. B 118, 14519 (2014).
- Grimsditch (1984) M. Grimsditch, Phys. Rev. Lett. 52, 2379 (1984).
- Polian and Grimsditch (1990) A. Polian and M. Grimsditch, Phys. Rev. B 41, 6086 (1990).
- Rouxel et al. (2010) T. Rouxel, H. Ji, J. P. Guin, F. Augereau, and B. Rufflé, J. Appl. Phys. 107, 094903 (2010).
- Brazhkin et al. (2008) V. V. Brazhkin, Y. Katayama, K. Trachenko, O. B. Tsiok, A. G. Lyapin, E. Artacho, M. Dove, G. Ferlat, Y. Inamura, and H. Saitoh, Phys. Rev. Lett. 101, 035702 (2008).
- Brazhkin et al. (2016) V. V. Brazhkin, E. Bychkov, and O. B. Tsiok, J. Phys. Chem. B 120, 358 (2016).
- Chervin et al. (2001) J.-C. Chervin, B. Canny, and M. Mancinelli, High Pressure Res. 21, 305 (2001).
- Lindsay et al. (1981) S. M. Lindsay, M. W. Anderson, and J. R. Sandercock, Rev. Sci. Instrum. 52, 1478 (1981).
- Vacher et al. (2006) R. Vacher, S. Ayrinhac, M. Foret, B. Rufflé, and E. Courtens, Phys. Rev. B 74, 012203 (2006).
- (32) O. L. Anderson and H. E. Bömmel, J. Am. Ceram. Soc. 38, 125.
- Jäckle et al. (1976) J. Jäckle, L. Piché, W. Arnold, and S. Hunklinger, J. Non-Cryst. Solids 20, 365 (1976).
- Maris (1971) H. J. Maris, in Physical Acoustics, Vol. VIII, edited by W. Mason and R. Thurston (Academic Press, New York, NY, 1971) p. 279.
- Vacher et al. (2005) R. Vacher, E. Courtens, and M. Foret, Phys. Rev. B 72, 214205 (2005).
- Ayrinhac et al. (2011) S. Ayrinhac, B. Rufflé, M. Foret, H. Tran, S. Clément, R. Vialla, R. Vacher, J. C. Chervin, P. Munsch, and A. Polian, Phys. Rev. B 84, 024201 (2011).
- Rufflé et al. (2010) B. Rufflé, S. Ayrinhac, E. Courtens, R. Vacher, M. Foret, A. Wischnewski, and U. Buchenau, Phys. Rev. Lett. 104, 067402 (2010).
- Petitgirard et al. (2017) S. Petitgirard, W. J. Malfait, B. Journaux, I. E. Collings, E. S. Jennings, I. Blanchard, I. Kantor, A. Kurnosov, M. Cotte, T. Dane, M. Burghammer, and D. C. Rubie, Phys. Rev. Lett. 119, 215701 (2017).
- Sato et al. (2018) T. Sato, N. Funamori, D. Wakabayashi, K. Nishida, and T. Kikegawa, Phys. Rev. B 98, 144111 (2018).
- Ryuo et al. (2017) E. Ryuo, D. Wakabayashi, A. Koura, and F. Shimojo, Phys. Rev. B 96, 054206 (2017).
- Nicholas et al. (2004) J. Nicholas, S. Sinogeikin, J. Kieffer, and J. Bass, Phys. Rev. Lett. 92, 215701 (2004).
- Huang et al. (2008) L. Huang, J. Nicholas, J. Kieffer, and J. Bass, J. Phys.-Cond. Matter 20, 075107 (2008).
- Zeidler et al. (2014b) A. Zeidler, K. Wezka, D. A. J. Whittaker, P. S. Salmon, A. Baroni, S. Klotz, H. E. Fischer, M. C. Wilding, C. L. Bull, M. G. Tucker, M. Salanne, G. Ferlat, and M. Micoulaut, Phys. Rev. B 90, 024206 (2014b).
- Brazhkin et al. (2009) V. V. Brazhkin, O. B. Tsiok, and Y. Katayama, JETP Letters 89, 244 (2009).
- Rouxel et al. (2008) T. Rouxel, H. Ji, T. Hammouda, and A. Moréac, Phys. Rev. Lett. 100, 225501 (2008).
- Sundararaman et al. (2018) S. Sundararaman, L. Huang, S. Ispas, and W. Kob, J. Chem. Phys. 148, 194504 (2018).
- Liang et al. (2007) Y. Liang, C. R. Miranda, and S. Scandolo, Phys. Rev. B 75, 024205 (2007).
- Mantisi et al. (2012) B. Mantisi, A. Tanguy, G. Kermouche, and E. Barthel, Eur. Phys. J. B 85, 304 (2012).
- Mackenzie (1963) J. Mackenzie, J. Am. Ceram. Soc. 46, 461 (1963).
- Rat et al. (1999) E. Rat, M. Foret, E. Courtens, R. Vacher, and M. Arai, Phys. Rev. Lett. 83, 1355 (1999).
- Guerette et al. (2015) M. Guerette, M. R. Ackerson, J. Thomas, F. Yuan, E. B. Watson, D. Walker, and L. Huang, Scientific Reports 5 (2015), 10.1038/srep15343.
- Takada (2018) A. Takada, J. Non-Cryst. Solids 499, 309 (2018).
- Brazhkin et al. (2011) V. V. Brazhkin, A. G. Lyapin, and K. Trachenko, Phys. Rev. B 83, 132103 (2011).
- Kono et al. (2016) Y. Kono, C. Kenney-Benson, D. Ikuta, Y. Shibazaki, Y. Wang, and G. Shen, Proc. Natl. Acad. Sci. 113, 3436 (2016).