Effects of Gas on Formation and Evolution of Stellar Bars and Nuclear Rings in Disk Galaxies
Abstract
We run self-consistent simulations of Milky Way-sized, isolated disk galaxies to study formation and evolution of a stellar bar as well as a nuclear ring in the presence of gas. We consider two sets of models with cold or warm disks that differ in the radial velocity dispersions, and vary the gas fraction by fixing the total disk mass. A bar forms earlier and more strongly in the cold disks with larger , while gas progressively delays the bar formation in the warm disks . The bar formation enhances a central mass concentration which in turn makes the bar decay temporarily, after which it regrows in size and strength, eventually becoming stronger in models with smaller . Although all bars rotate fast in the beginning, they rapidly turn to slow rotators. In our models, only the gas-free, warm disk undergoes rapid buckling instability, while other disks thicken more gradually via vertical heating. The gas driven inward by the bar potential readily forms a star-forming nuclear ring. The ring is very small when it first forms and grows in size over time. The ring star formation rate is episodic and bursty due to feedback, and well correlated with the mass inflow rate to the ring. Some expanding shells produced by star formation feedback are sheared out in the bar regions and collide with dust lanes to appear as filamentary interbar spurs. The bars and nuclear rings formed in our simulations have properties similar to those in the Milky Way.
Subject headings:
galaxies: evolution — galaxies: ISM — galaxies: kinematics and dynamics — galaxies: nuclei — galaxies: spiral — galaxies: structure — ISM: general — stars: formation1. Introduction
More than of disk galaxies in the local universe possess a well-developed stellar bar (e.g., Sellwood & Wilkinson 1993; Lee et al. 2012a; Gavazzi et al. 2015). Stellar bars greatly influence evolution of gas in disks by exerting non-axisymmetric gravitational torque and create gaseous substructures such as dust lanes and nuclear rings (e.g., Sanders & Huntley 1976; Athanassoula 1992; Buta & Combes 1996; Martini et al. 2003a, a; Kim et al. 2012a). Gas in orbital motions hits dust lanes and loses angular momentum to infall toward the galaxy center. The infalling gas is gathered to form a nuclear ring where intense star formation takes place (e.g., Burbidge & Burbidge 1960; Phillips 1996; Buta & Combes 1996; Knapen et al. 2006; Mazzuca et al. 2008, 2011; Comerón et al. 2010; Sandstrom et al. 2010; Hsieh et al. 2011). Some galaxies possess filamentary interbar spurs that are connected almost perpendicularly to dust lanes (e.g., Sheth et al. 2000, 2002; Zurita & Pérez 2008), although their origin has been unidentified so far.
To explain the formation of gaseous substructures and understand what controls their physical properties, a number of previous studies employed a fixed gravitational potential to represent a stellar bar (e.g., Athanassoula 1992; Englmaier & Gerhard 1997; Maciejewski et al. 2002; Maciejewski 2004; Regan & Teuben 2003, 2004; Ann & Thakur 2005; Kim et al. 2012a, b; Kim & Stone 2012; Li et al. 2015; Shin et al. 2017). These studies found that dust lanes are shocks (Athanassoula, 1992) lying almost parallel to the trajectories of -orbits in a steady state, while the shape of a nuclear ring is well described by -orbits (e.g., Athanassoula 1992; Englmaier & Gerhard 1997; Patsis & Athanassoula 2000; Kim et al. 2012b; Li et al. 2015). Nuclear rings form by the centrifugal barrier that the infalling, rotating gas cannot overcome, rather than resonances, and are smaller in galaxies with stronger bars (Kim et al., 2012a), consistent with the observations of Comerón et al. (2010). Although these models with fixed bar potentials are useful to explore the parameter space in great detail, they are unrealistic in that stellar bars in real galaxies form and evolve so that their properties such as strength, size, and pattern speed can vary considerably with time.
There have been numerous -body simulations on how stellar bars form and evolve. These numerical work found that bars form due to dynamical instabilities of self-gravitating stellar disks (Miller et al., 1970; Hohl, 1971; Kalnajs, 1972; Goldreich & Tremaine, 1979; Combes & Sanders, 1981; Sellwood & Wilkinson, 1993; Polyachenko, 2013; Saha & Elmegreen, 2018). Recent pure -body simulations showed that not only the bar strength and length but also the pattern speed continuously vary with time on the course of disk evolution (Minchev et al. 2012; Manos & Machado 2014). Sometimes, when the vertical velocity dispersion becomes very small compared to the radial velocity dispersion, bars can undergo vertical buckling instability which in turn makes the bars weaker and shorter (Combes & Sanders, 1981; Combes et al., 1990; Raha et al., 1991; Merritt & Sellwood, 1994; Martinez-Valpuesta et al., 2006; Kwak et al, 2017). The bar properties and their temporal evolution appear to be quite sensitive to the initial galaxy models. For instance, Saha & Elmegreen (2018) very recently showed that the bar strength at late time can differ, by more than a factor of two, depending on the bulge mass and density structure in the initial galaxy models. The bar growth time as well as its strength are also dependent upon the halo spin parameter (Collier et al., 2018). While these results are informative, they are based on models with no gaseous component, and thus cannot tell how gas responds to the bars and forms substructures, not to mention how star formation occurs in real barred galaxies.
In recent years, several studies adopted Smoothed Particle Hydrodynamics simulations to include the effects of the gaseous component on stellar bars (e.g., Fux 1999; Bournaud et al. 2005; Berentzen et al. 2007; Athanassoula et al. 2013; Renaud et al. 2013; Carles et al. 2016). Since gas is dynamically highly responsive, it can readily change the density distribution of the whole disk to affect the bar formation and evolution. However, the results of the studies mentioned above differ, both quantitatively and qualitatively, in the effects of gas on the bar formation. For instance, Berentzen et al. (2007) found no significant correlation between the gas fraction and the bar formation time, while Athanassoula et al. (2013) reported that disks with larger stay longer in a near-axisymmetric state and form a bar more slowly. On the other hand, Robichaud et al. (2017) showed that disks with larger form bars earlier when feedback from active galactic nuclei (AGN) is considered, while the bar formation without AGN feedback is almost independent of .
The presence of gas which is dissipative in nature appears to make stellar bars weakened or destroyed to some extent. Bournaud et al. (2005) argued that gas can completely dissolve a bar within by exerting gravitational torque, while Berentzen et al. (2007) and Athanassoula et al. (2013) found that bars are not completely destroyed even in the presence of the gaseous component. In particular, Berentzen et al. (2007) found that the bar weakening in gas-poor disks is caused by buckling instability, whereas a central mass concentration (CMC) due to gas infall and pile-up near the galaxy center in gas-rich galaxies heats the disks and thus weakens the bars. They further showed that the bar strength after the weakening does not differ much in disks with different . Athanassoula et al. (2013) showed that bars, albeit not completely destroyed, weaken more strongly in galaxies with larger . These results suggest that the role of gas on the evolution of stellar bars is not yet clearly understood.
In this paper, we run high-resolution simulations of Milky Way-sized, isolated disk galaxies consisting of a live halo, a stellar disk, and a gaseous disk. These three components interact with each other through mutual gravity, while the gaseous component suffers radiative heating and cooling and is subject to star formation and related feedback. Fux (1999) ran similar simulations specific to the Milky Way to model the Galactic bar and the central molecular zone (CMZ), but did not allow for star formation and ensuing feedback. Our main objectives are two-folds. First, we want to understand how the gaseous disk affects the formation and evolution of a stellar bar. Second, we want to study how a nuclear ring evolves under the situation where the bar properties vary self-consistently with time. The high-resolution models presented in this work improve the previous simulations mentioned above that did not have sufficient resolution to investigate gaseous structures and star formation in detail. These models also extend the previous hydrodynamic simulations with fixed bar potentials by allowing stellar bars to evolve over time. To explore how bars and nuclear rings develop in various situations, we vary the velocity anisotropy parameter (or Toomre stability parameter) as well as the gas fraction while keeping the total disk mass fixed.
The remainder of the paper is organized as follows. In Section 2, we describe our galaxy models and numerical methods that we adopt. In Section 3, we present how stellar bars form and evolve in the presence of the gaseous component. In Section 4, we describe evolution of gaseous structures that form and star formation rates in the nuclear, bar, and outer disk regions. In Section 5, we summarize and discuss the astronomical implications of the present work.
2. Models and Methods
2.1. Galaxy Models
To study formation and evolution of a stellar bar and its gravitational interactions with the gaseous component, we consider galaxy models with physical properties similar to those of the Milky Way. Our initial galaxy models consist of a stellar disk, a gaseous disk, a dark matter (DM) halo, and a central supermassive black hole. For the density distribution of the DM halo, we adopt the Hernquist (1990) profile
| (1) |
where is the radial distance, and and denote the total mass and the scale radius of the halo, respectively. The scale radius is often specified in terms of the concentration parameter and the virial radius through
| (2) |
(Springel et al. 2005). For all models, we fix , , and , corresponding to . Initially, we place a supermassive black with mass at the galaxy center, which is allowed to accrete surrounding gas without any feedback effect in the present work.
For the stellar disk, we initially adopt the following density distribution
| (3) |
where and are the radial and vertical distances in the cylindrical coordinates, while , , and refer to the mass, the radial scale length, and the vertical scale height of the stellar disk, respectively. For models with gas included, we adopt the same form as Equation (3) for the initial density distribution of a gaseous disk, but with the gas mass , the scale radius , and the scale height . To study the effect of gas on the bar formation, we vary the gas fraction in the range of to , while fixing the total disk mass to . The observed range of the gas fraction for Milky Way-like galaxies is around –% (e.g., Papovich et al. 2016).
To construct a stellar disk by distributing particles, one needs to specify the velocity anisotropy parameter
| (4) |
where and are the velocity dispersions in the radial and vertical directions, respectively (Yurin & Springel 2014). For fixed , varying corresponds to changing Toomre (1966) stability parameter
| (5) |
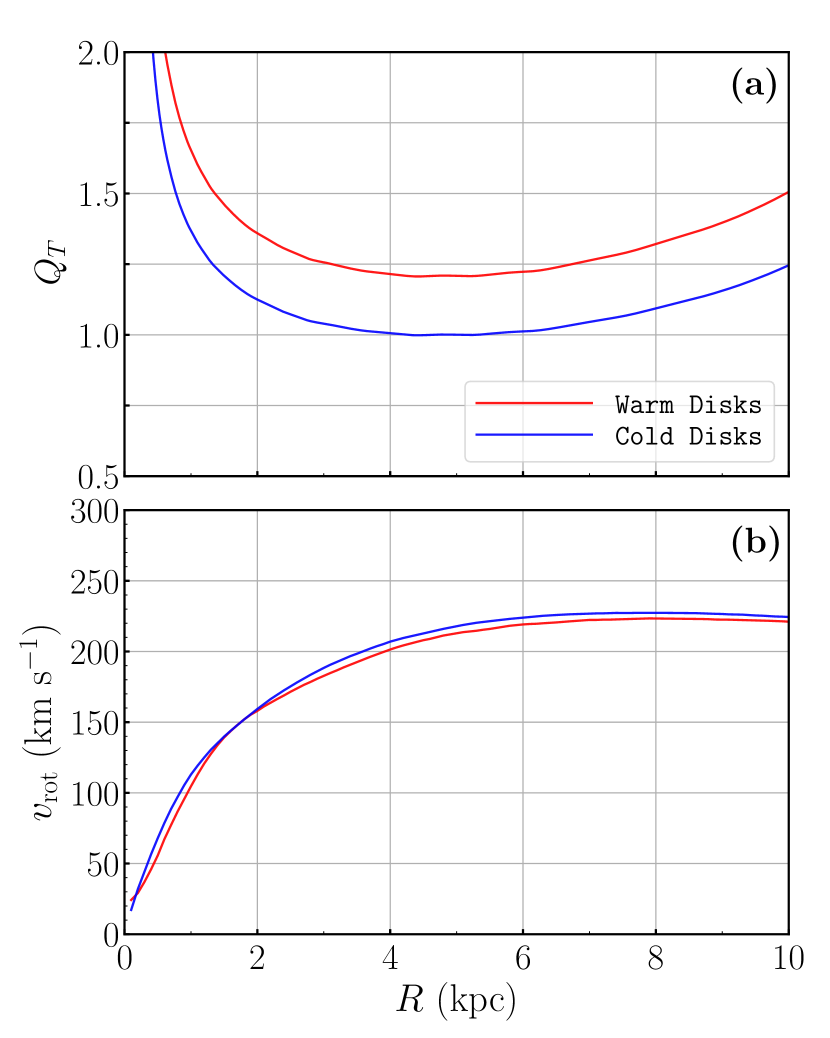
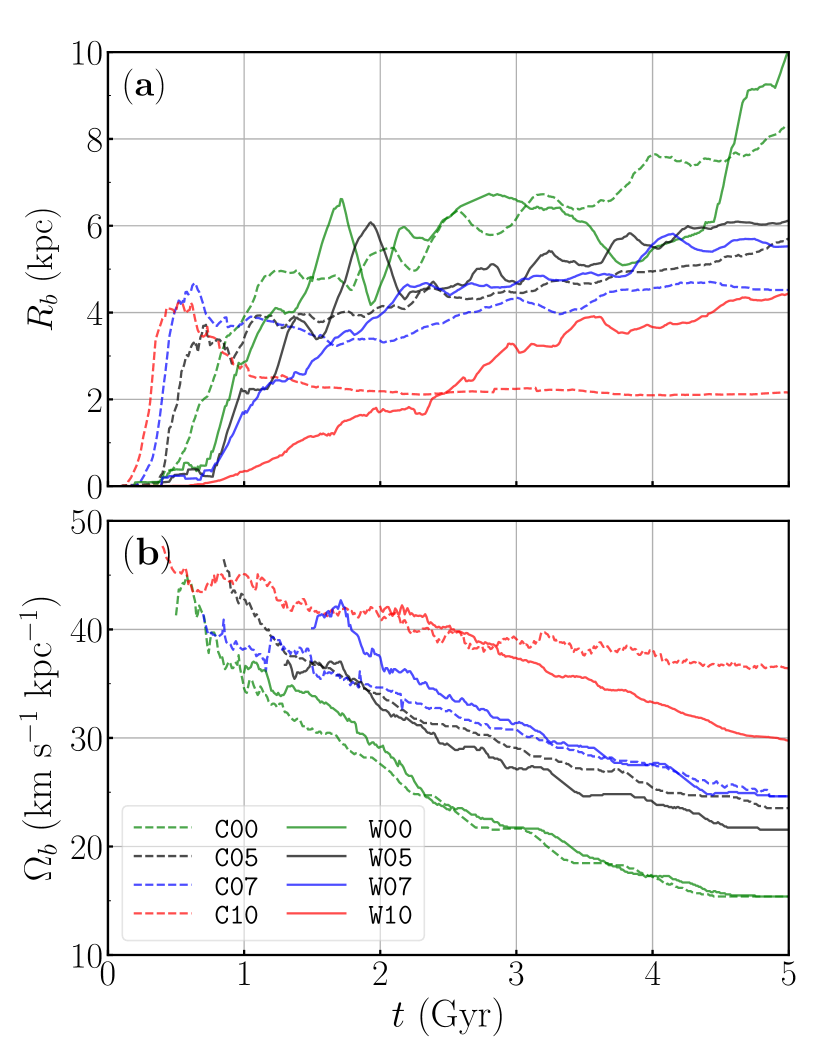
where is the epicycle frequency and is the surface density of the combined (stellar plus gaseous) disk. To study the effect of the velocity anisotropy (or ) on the bar formation, we in this paper consider two sets of disk models: relatively cold disks with and relatively warm disks with . These initial values of without a bar are smaller than the observed values for the Milky Way in the solar neighborhood (e.g., Sharma et al. 2014; Guiglion et al. 2015; Katz et al. 2018): we will show in Section 3.3 that the bar formation and evolution increase in our models to the values close to 4. Figure 1(a) plots the radial distributions of for the cold and warm disks. Note that is minimized at , with the minimum values of for the cold disks and for the warm disks. Table 1 lists the names and parameters of all models together with some numerical outcomes. The models with postfix “C” and “W” have a cold and warm disk, respectively, and the number after the postfix represents the gas fraction in each set of models.
| Model | ||||||
|---|---|---|---|---|---|---|
| (1) | (2) | (3) | (4) | (5) | (6) | (7) |
| C00 | - | 1.0 | 0.63 | 1.67 | - | - |
| C05 | 1.0 | 0.49 | 1.63 | 0.40 | 0.19 | |
| C07 | 1.0 | 0.47 | 1.83 | 0.35 | 0.13 | |
| C10 | 1.0 | 0.22 | 2.50 | 0.50 | 0.04 | |
| W00 | - | 1.44 | 0.59 | 1.51 | - | - |
| W05 | 1.44 | 0.52 | 1.60 | 0.27 | 0.20 | |
| W07 | 1.44 | 0.46 | 1.51 | 0.29 | 0.31 | |
| W10 | 1.44 | 0.36 | 1.60 | 0.19 | 0.19 |
Our initial galaxy models with no gas are realized by making use of the publicly available GALIC code (Yurin & Springel, 2014). GALIC is very flexible in generating an equilibrium configuration. It adjusts particle velocities iteratively to obtain a desired density distribution. For models with gas, we reduce the mass of each stellar particle to , while keeping their number and positions intact. We then insert a self-gravitating, isothermal gas disk with mass and the vertical scale height . Since the conversion of a part of the stellar disk to the self-gravitating gaseous disk effectively reduces the scale height and velocity dispersions, the new hybrid disk is slightly out of equilibrium. We thus evolve the whole system over by imposing an isothermal condition and no star formation. The system gradually relaxes to a quasi-equilibrium state in which the stellar disk remains almost unchanged with , while the gaseous disk, being more dynamically responsive, becomes thinner to and at and , respectively. While at the relaxed state tends to be smaller for larger and smaller , the differences are only within a few percents. Figure 1(b) plots the rotational velocities at the relaxed state for the cold- and warm-disk models, insensitive to . This indicates that the total gravitational potential in the hybrid disk is almost unchanged notwithstanding the gas fraction.
Each model is constructed by distributing a total of particles: , , and for the halo, stellar disk, and gaseous disk, respectively. The mass of each halo particle is , while stellar and gaseous particles each have mass of and for models with , and and for models with .
2.2. Numerical Method
We evolve our galaxy models using the GIZMO code (Hopkins, 2015), which is a second-order accurate, magnetohydrodynamics code based on a kernel discretization of the volume coupled to a high-order matrix gradient estimator and a Riemann solver. It thus conserves mass, momentum, and energy almost exactly. Gravity is solved by an improved version of the Tree-PM method with an opening angle of . Softening lengths for stellar and halo particles are set to and , respectively, corresponding to the mean particle separations. The gaseous particles have a fully adaptive softening length with the minimum value set to .
For the evolution of gaseous particles, we use a second-order accurate meshless finite-mass method that conserves angular momentum very accurately (Hopkins, 2015). The gaseous particles are subject to radiative cooling due to various line emissions and heating mostly via photoionization and photoelectric effects (e.g., Katz et al. 1996; Hopkins et al. 2014, 2018). We find that these radiative processes together with star formation feedback and bar-related gas dynamics result in for the temperature of most gas in the disk, corresponding to the warm neutral gas of the interstellar medium.
We implement a stochastic prescription for star formation and feedback. Star formation is allowed to occur only in dense, self-gravitating regions where the velocity field is converging and the local gas density exceeds the critical value . For a gaseous particle satisfying the above criteria, the star formation probability over the time interval is given by , where is the star formation efficiency (Hopkins et al., 2011; Seo & Kim, 2013). In each time step, we generate a uniform random number and switch such a gaseous particle into a new stellar particle with the same mass only when .
We handle star formation feedback using simple momentum input as well as mass return to the neighboring gaseous particles in the form of Type Ia and II supernova (SN) events. In our models, each stellar particle (with mass approximately ) corresponds to an unresolved star cluster. Assuming the Kroupa (2001) initial mass function and using the lifetime of Type II SN progenitors (Lejeune & Schaerer 2001) and the rate of Type Ia SNe (Mannucci et al. 2006), we calculate the number of SN events, , expected from a stellar particle in each time step. Type II SNe occur only from newly formed particles younger than , the lifetime of stars, while Type Ia SNe can explode from not only newly-created stars older than but also the pre-existing particles comprising of the initial stellar disk. SNe inject momentum and mass to the surrounding gas particles inside the shell radius
| (6) |
corresponding to the shock radius at the shell formation stage for almost-simultaneous SNe. The amount of the total radial momentum deposited is given by
| (7) |
(e.g., Chevalier 1974; Shull 1980; Cioffi et al. 1988; Seo & Kim 2013; Kim & Ostriker 2015). Each gas particle inside receives momentum and mass proportional to its occupied volume.
3. Stellar Bars
In this section, we focus on the formation and evolution of stellar bars and the effects of the gaseous component on them. Evolution of gaseous structures including nuclear rings and star formation therein will be presented in Section 4.
3.1. Bar Formation
Since finite disk thickness reduces self-gravity at the disk midplane, all combined disks with are stable to axisymmetric gravitational perturbations. However, non-axisymmetric perturbations are still able to grow as they swing from leading to trailing configurations (e.g., Binney & Tremaine 2007; Kim & Ostriker 2007; Kwak et al 2017), eventually organizing into bars. We find that the effect of gas on bar formation is different between models with a cold disk and a warm disk, as described below.
3.1.1 Cold-disk Models
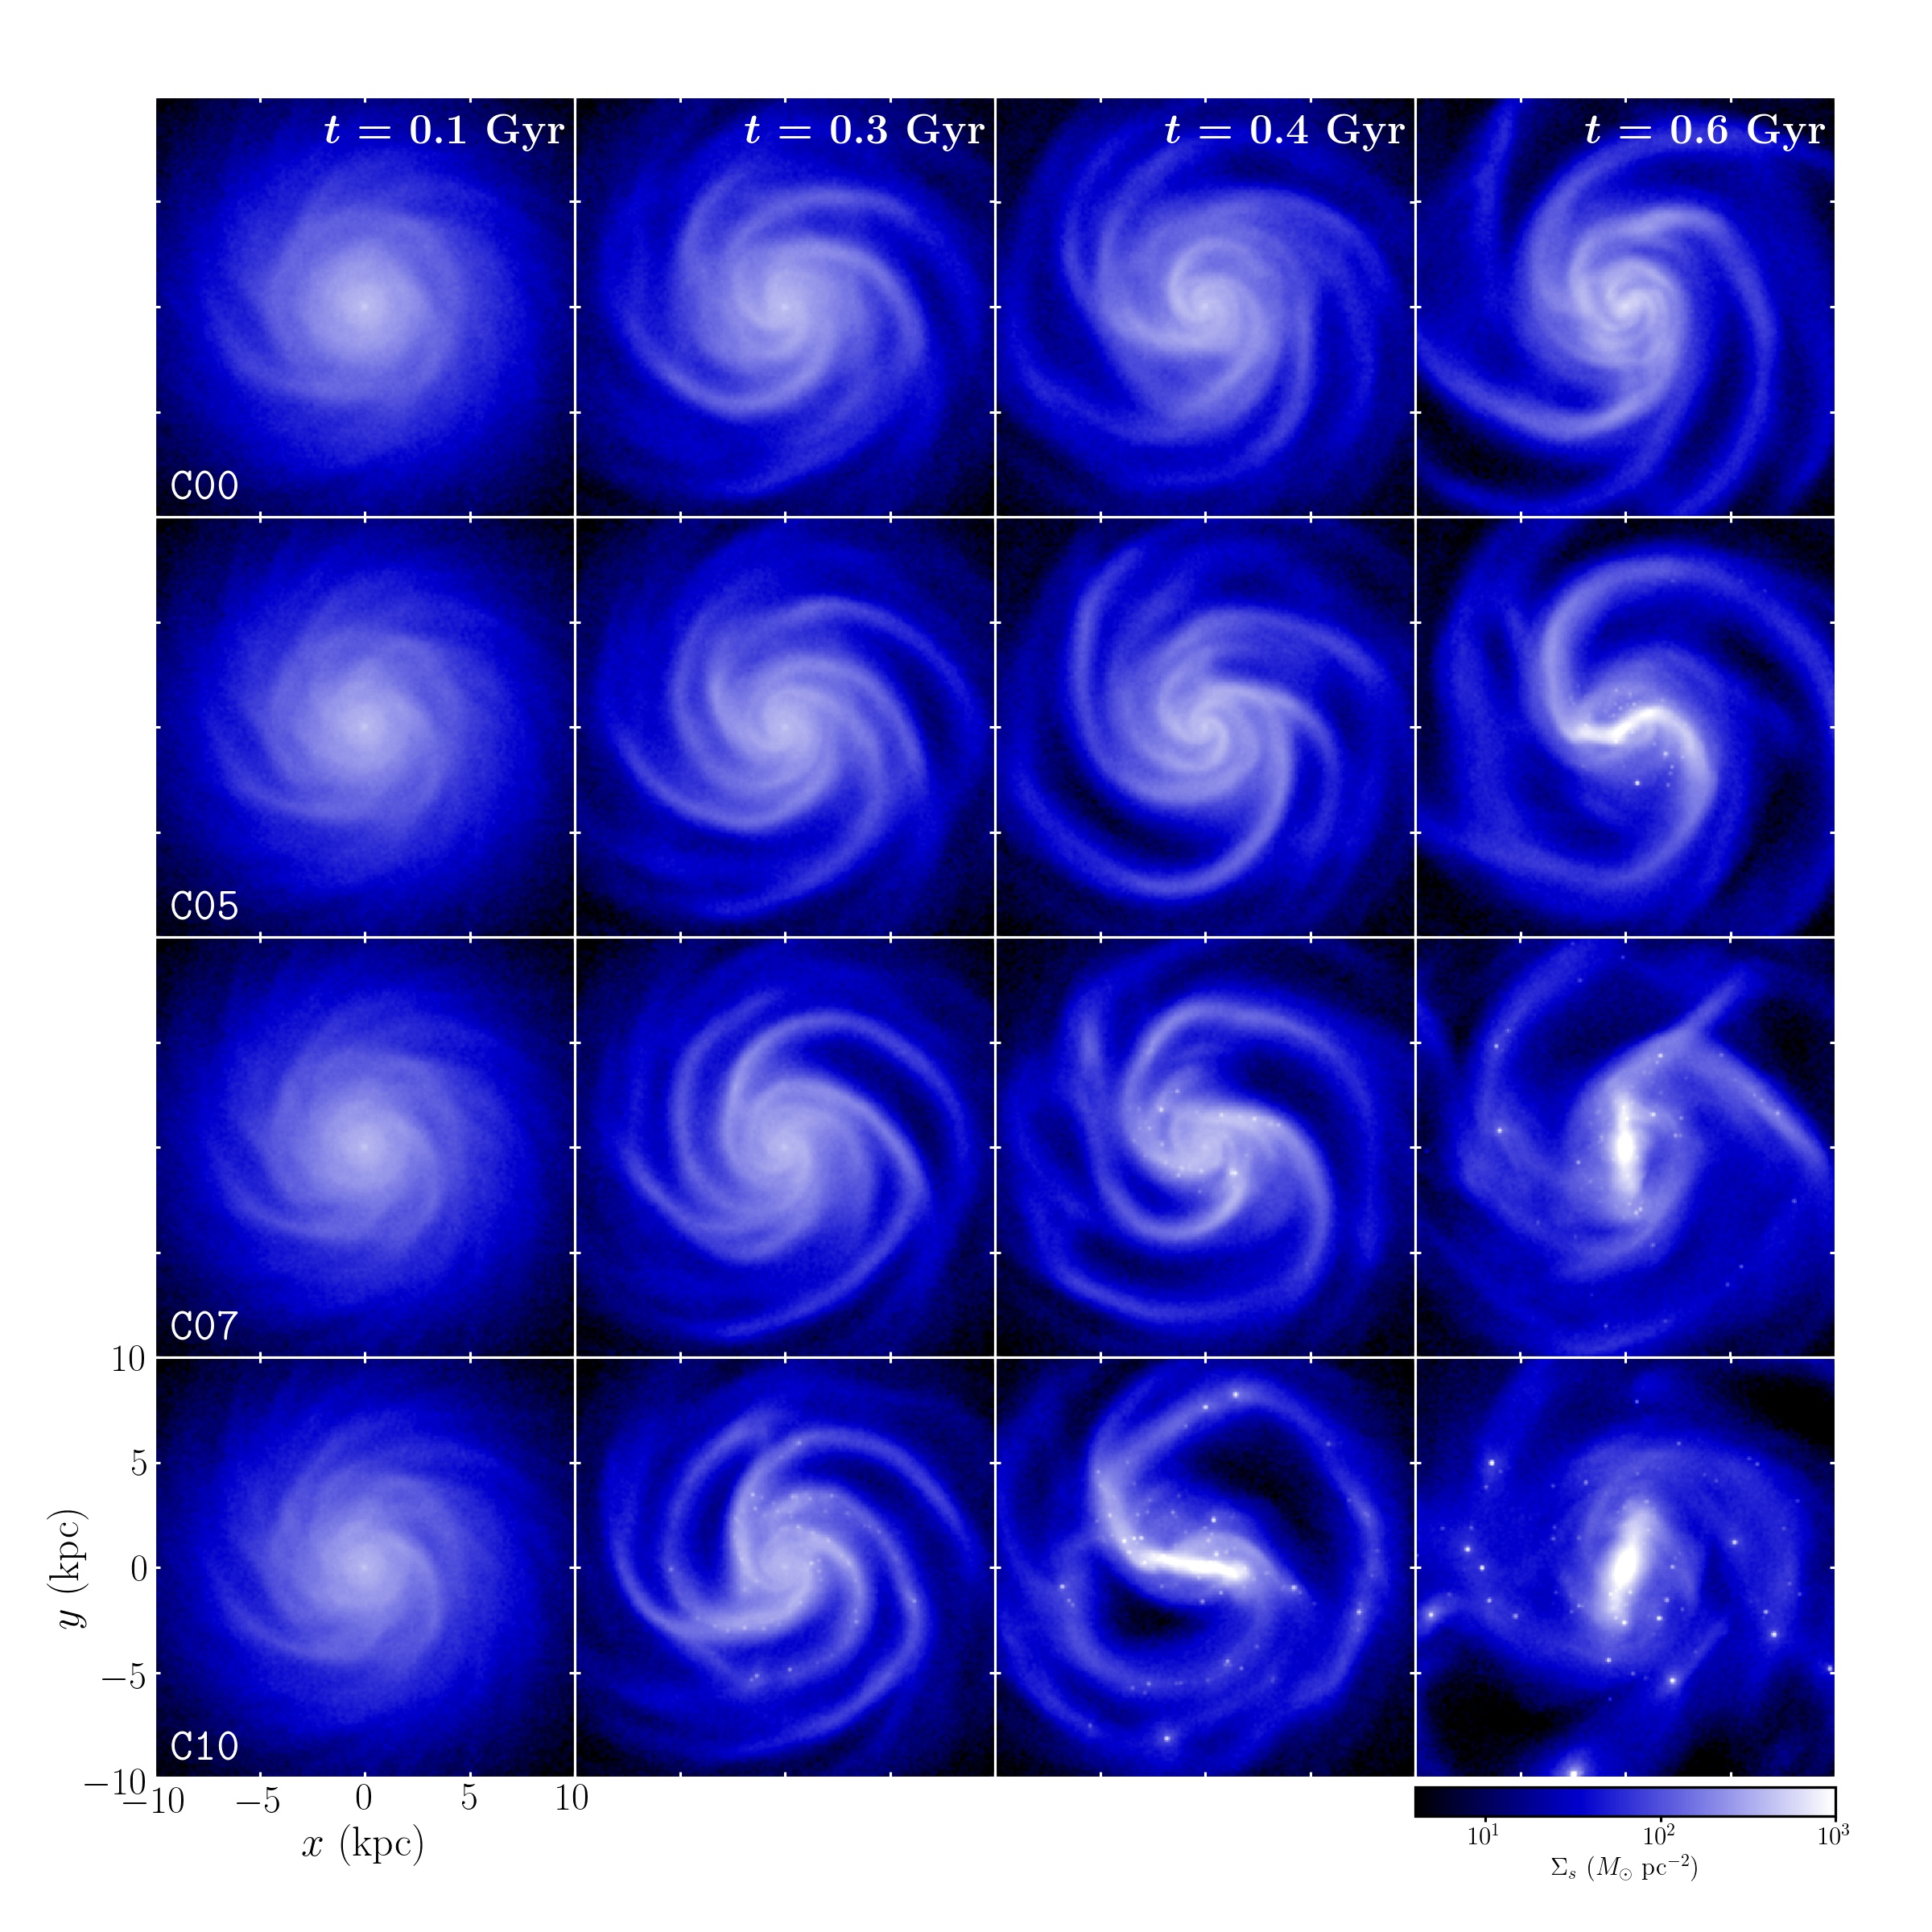
Figure 2 plots the stellar surface density in logarithmic scale in the regions of the cold-disk models at , 0.3, 0.4, and . It is apparent that the disks at early time are subject to swing amplification and produce spiral structures that extend from the galaxy center all the way to the outer edge. The disks harbor various spiral modes with high azimuthal mode numbers (–), with their amplitudes depending on . Model C10 has strongest spiral arms since its disk is effectively coldest, and newly formed stars indicated by bright spots are distributed along the spirals at .
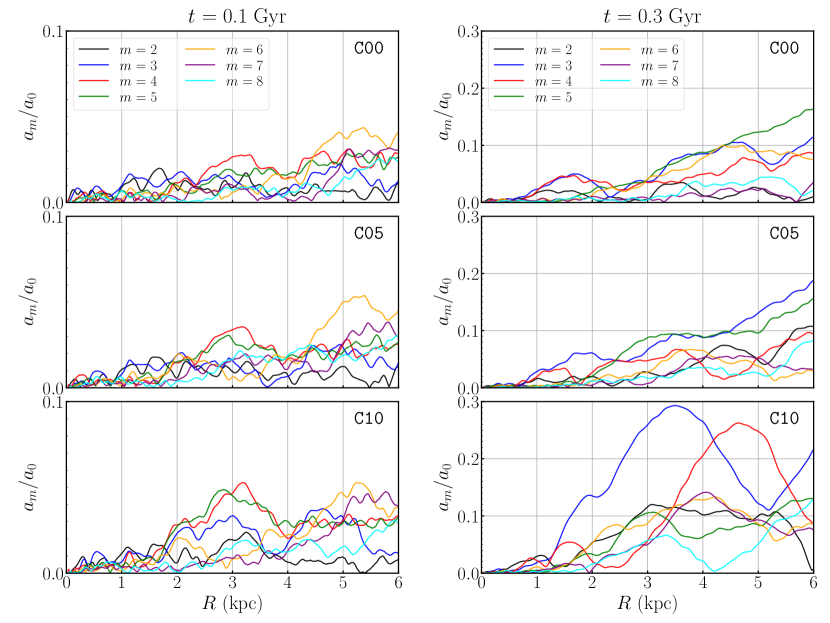
Figure 3 plots the radial distributions of the various Fourier amplitudes relative to in the stellar disks of models C00, C05, and C10 at and . At , the modes with and have largest amplitudes in the – and – regions of the disks, respectively. The strength of swing amplification is measured roughly by the instantaneous growth rate multiplied by the duration of amplification (e.g., Julian & Toomre 1966; Kim & Ostriker 2001). While modes with high may have a large instantaneous growth rate, they usually have a limited time for amplification because they quickly wind out kinematically due to background shear (e.g., Goldreich & Lynden-Bell 1965; Julian & Toomre 1966). It turns out that the mode grows most strongly at in all the cold-disk models, although modes with and also contribute to the perturbed density in the outer regions. The dominance of the three-arm spiral modes at small radii in the early phase of bar formation is also seen in the models of Fanali et al. (2015).
Swing amplification in the cold-disk models is so virulent that the spirals rapidly become nonlinear. For instance, the spirals in model C10 at have an amplitude at –. These spirals interact nonlinearly with other spirals with higher that propagate radially inward. As a consequence, one arm of the spirals becomes loose and merge with the other two arms, eventually transforming into an bar mode that is supported by stable -orbit families (Contopoulos & Grosbøl, 1989). Since gaseous particles are colder than stellar particles, the swing amplification and ensuing bar formation occur faster in models with larger . Figure 2 shows that model C10 already possesses a well-developed bar by , while it takes model C00 about longer to form a noticeable bar.
3.1.2 Warm-disk Models
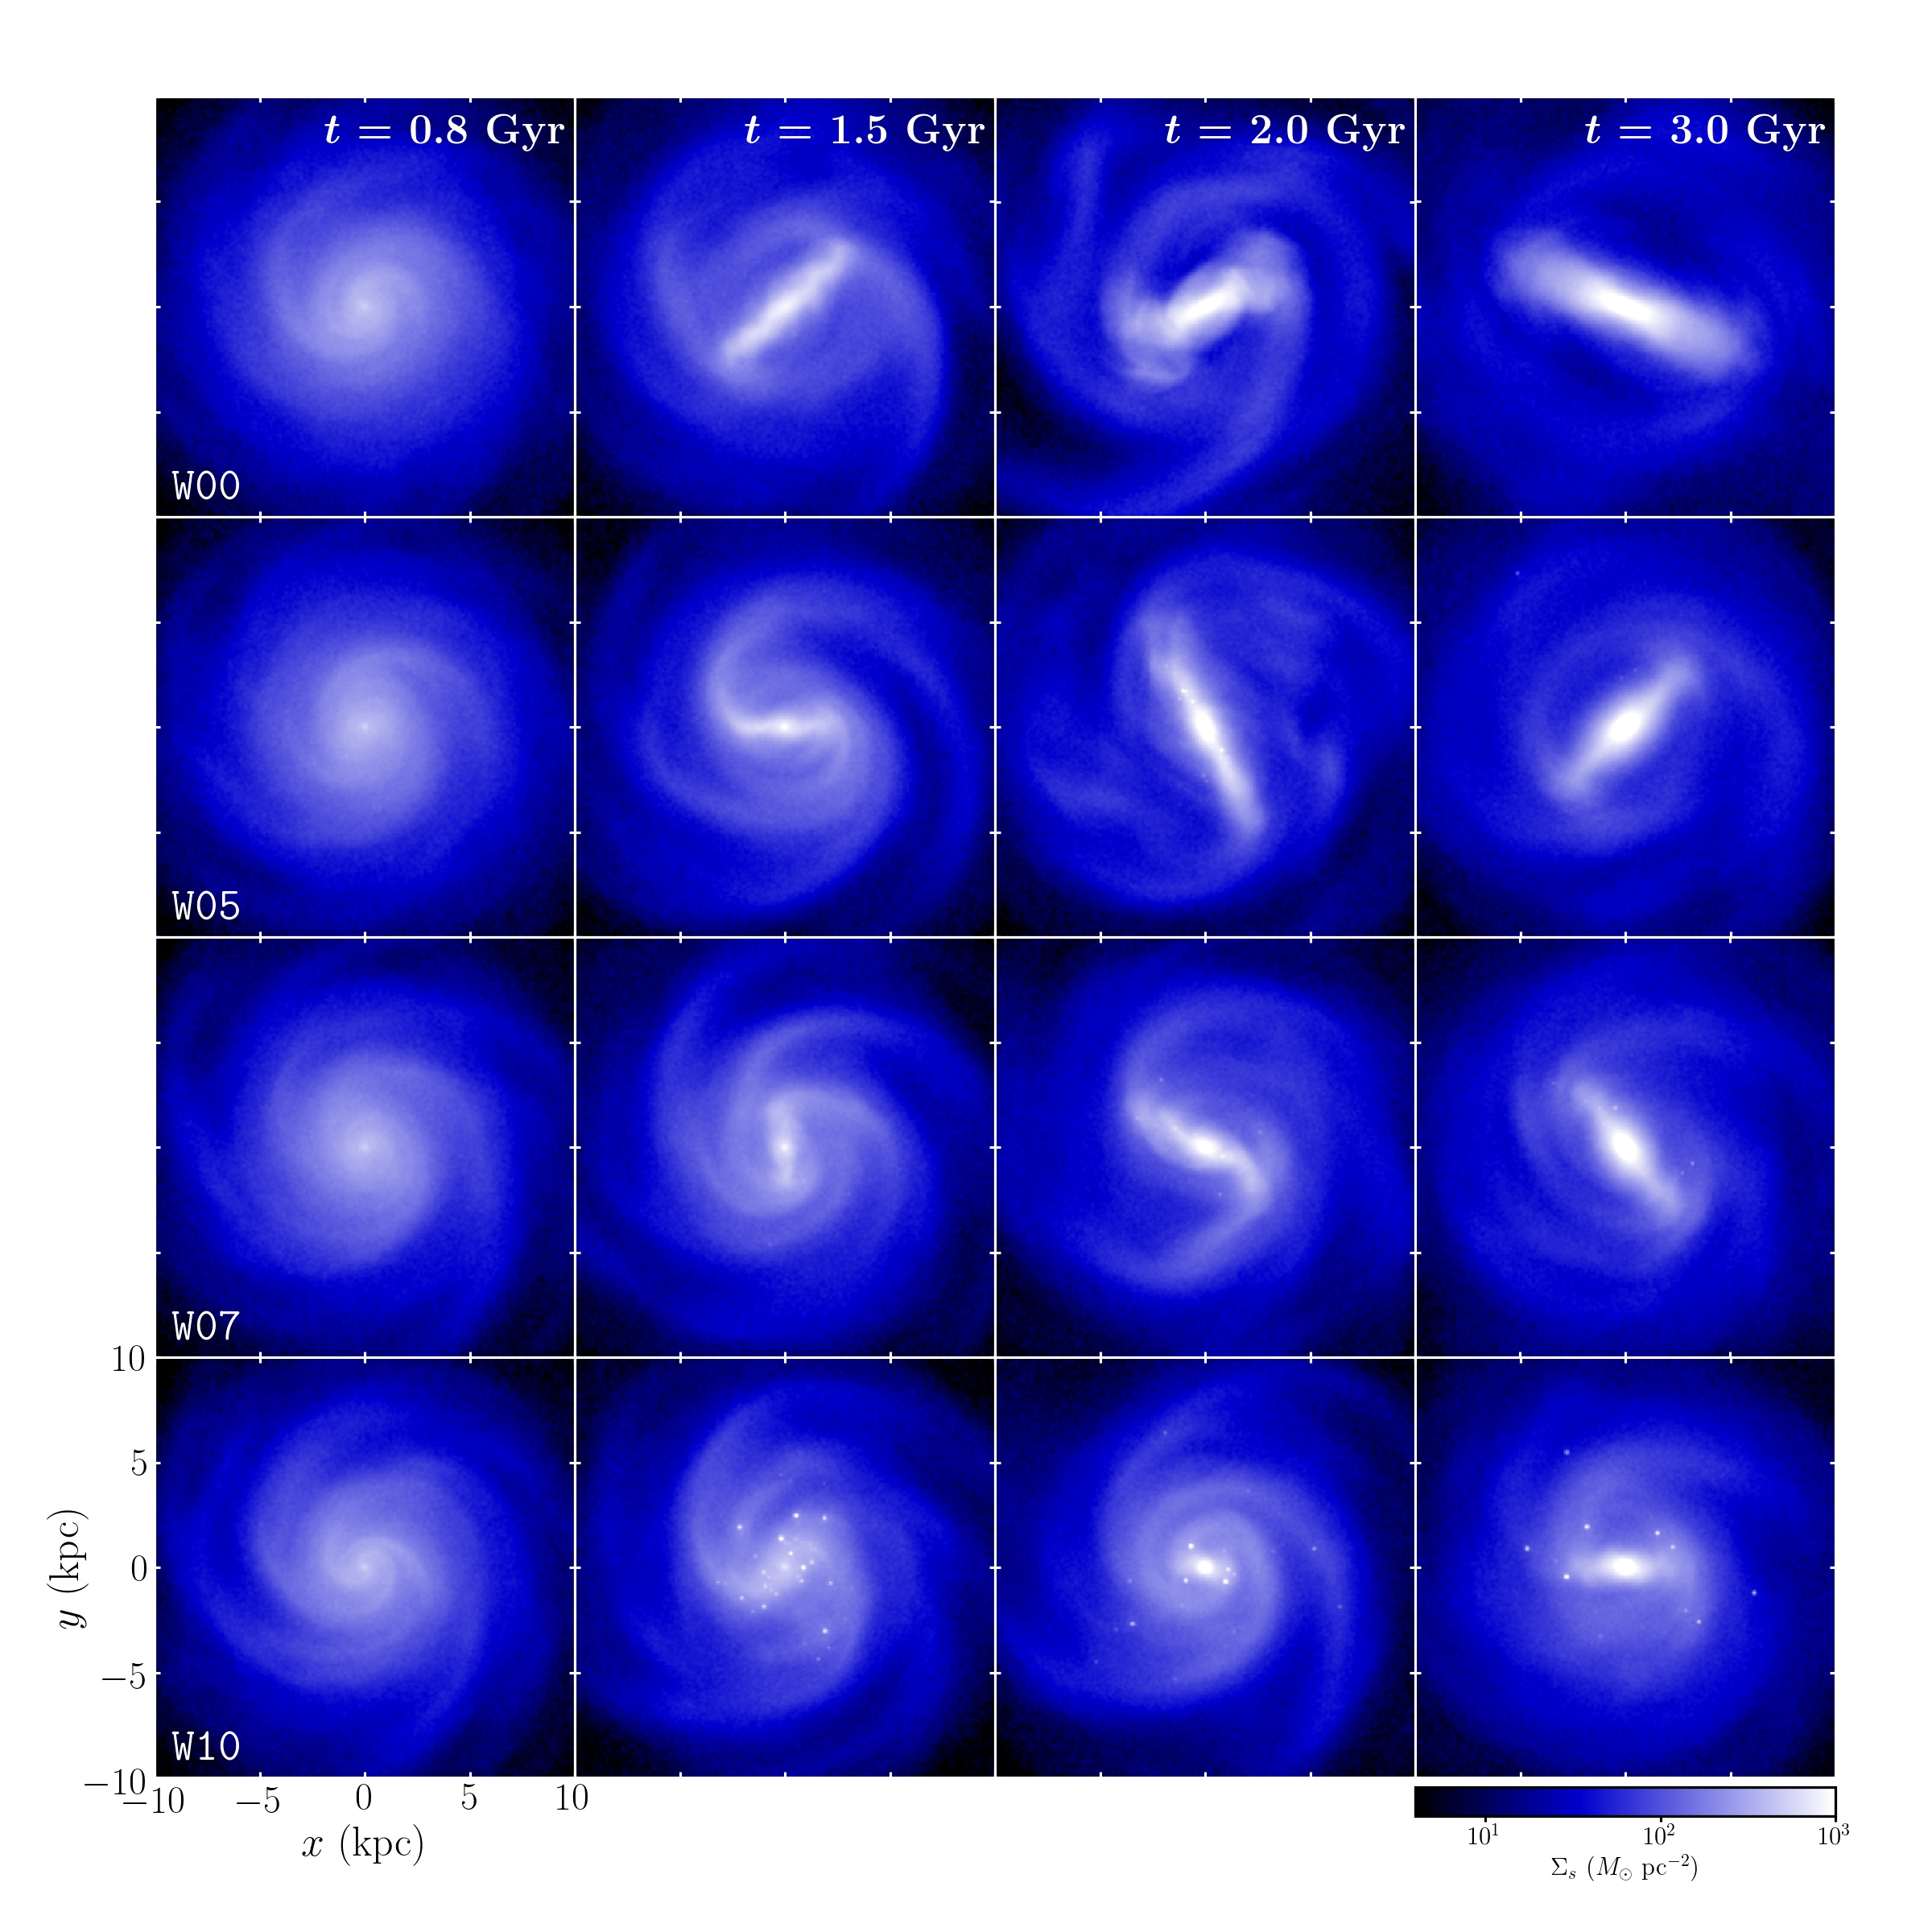
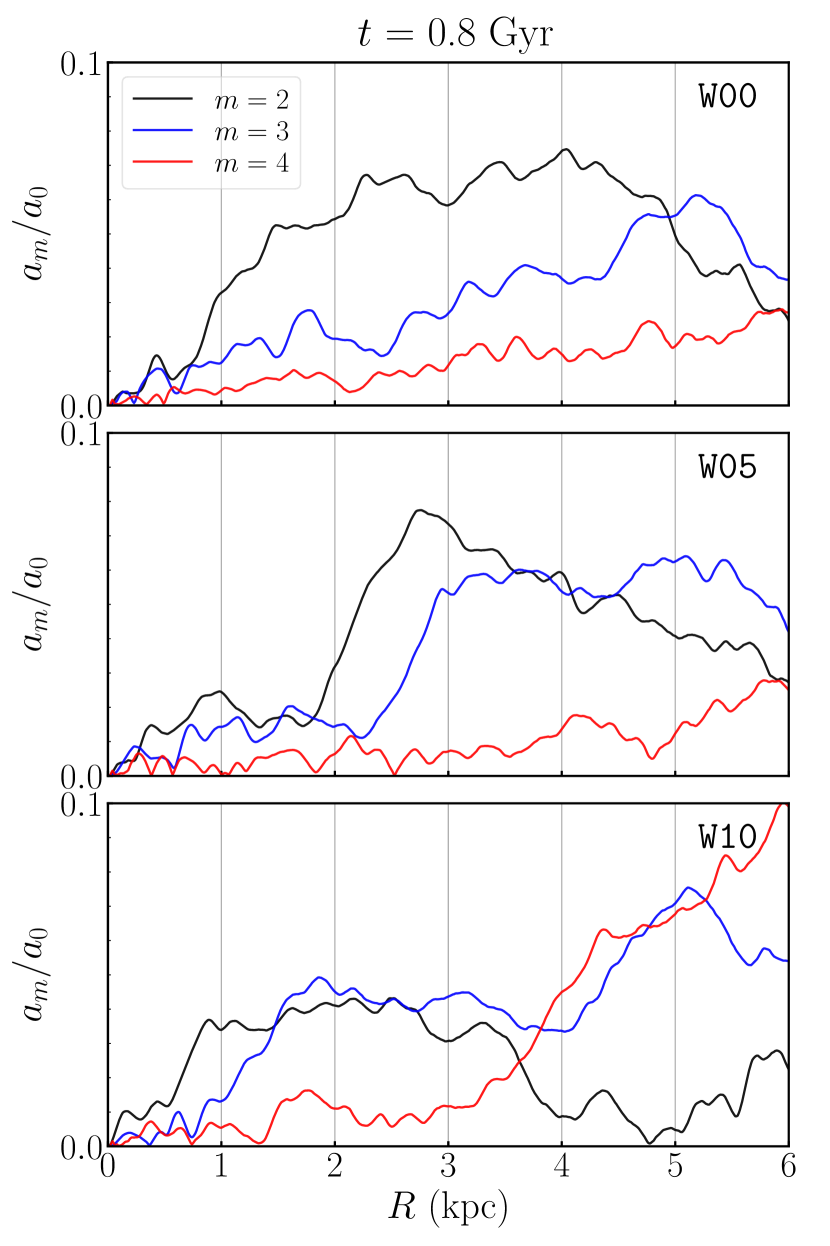
Warm disks form a bar slower than cold disks due to lager . Unlike in the cold disks, the presence of gas delays the bar formation in the warm disks. Figure 4 plots the stellar surface density in logarithmic scale in the regions of the warm-disk models at , 1.5, 2.0, and . Figure 5 plots the radial distributions of the Fourier amplitudes of the – azimuthal modes that dominate in models W00, W05, and W10 at . At this time, by which all cold disks have already formed a bar, the warm disks still exhibit only weak spiral structures. Similarly to the cold disks, the warm disks are subject to swing amplification, but the associated amplification factor is less than 10% and the resulting spiral waves after the initial swing amplification are thus in the linear regime.
Still, a warm disk with larger is effectively colder and thus more vulnerable, especially at – where is smallest. Since random velocity dispersions (or acoustic waves) tend to stabilize small-scale modes, disks with larger should favor larger- modes for growth. This expectation is consistent with Figure 5 that shows that the modes with , 3, and 4 have grown most strongly by in models W00, W05, and W10, respectively. This in turn indicates that the amplitude of the mode that will seed the bar formation is larger in models with smaller . Note that these mode numbers favored in the warm disks are smaller than those dominant in the early phase of swing amplification in the cold disks.
Because of relatively large , the initial swing amplification in the warm disks is too mild to form a bar instantly. Without a bulge, these trailing waves are well positioned to propagate right through the center and then emerge as leading waves in the opposite side, amplifying further as they unwind again from leading to trailing configurations (e.g., Binney & Tremaine 2007). An eventual bar formation requires several cycles of swing amplifications and feedback loops, which takes longer than . A disk with larger takes longer to form a bar since the bar-forming perturbations are weaker at the end of the initial swing amplification.
3.2. Physical Properties
3.2.1 Bar Strength
In our models, the strength and size of bars vary with time considerably, which is related to the CMC. Conventionally, the bar strength is defined by the maximum value of the Fourier mode relative to the mode as
| (8) |
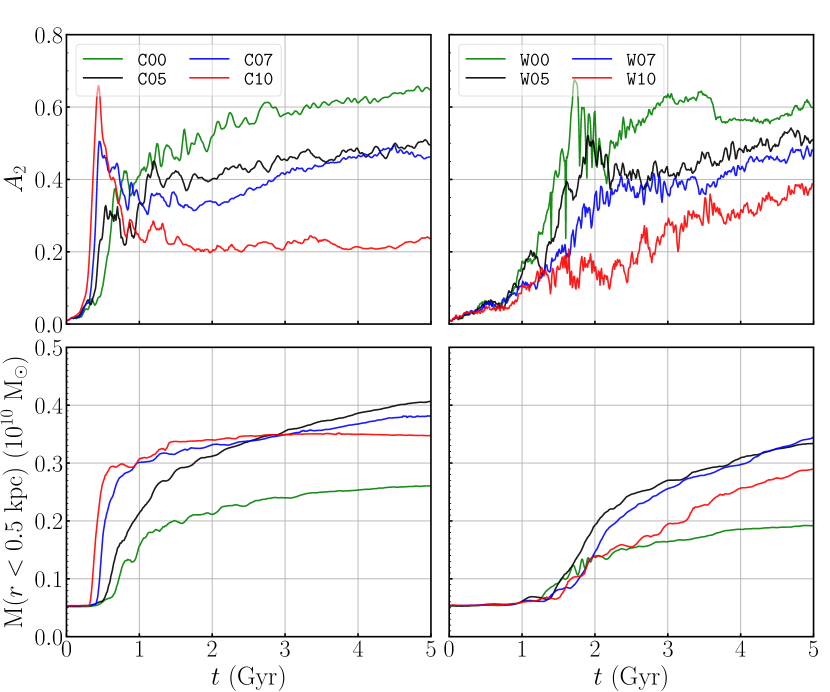
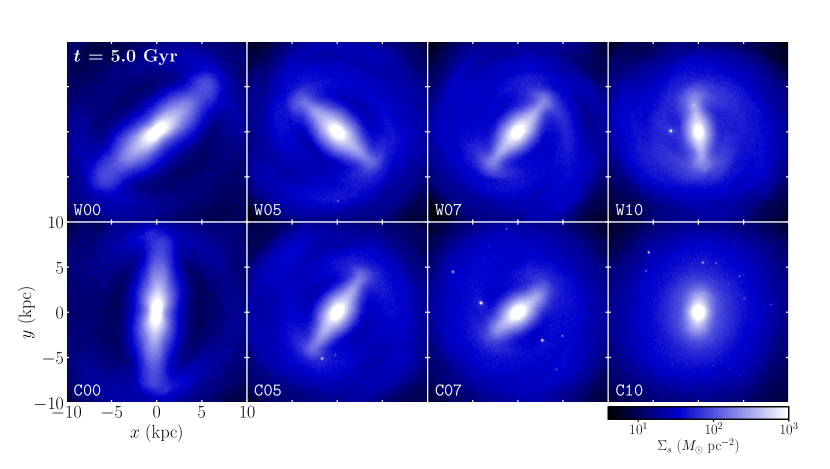
To measure the CMC, we use the total (star plus gas) mass inside the central regions with . Figure 6 plots the temporal changes of the bar strength and the CMC for the cold-disk (left) and the warm-disk (right) models. Figure 7 plots the distribution of the stellar surface density at for all models. Clearly, a bar forms earlier in the cold disks than in the warm disks. The presence of gas causes the bar to form faster and more strongly in the cold-disk models, while it makes the bar formation delayed in the warm-disk models. Bar formation necessarily involves mass relocation and thus changes the CMC even in the gas-free models, although the CMC is more significant in models with more gas since the bar potential induces strong gas inflows. Changes in the central mass affect orbits of stars, notably in the vertical direction, when they pass close to the galaxy center, leading to bar thickening and weakening (e.g. Martinez-Valpuesta et al. 2006; Berentzen et al. 2007; Kwak et al 2017). In addition, gas that is dissipative in nature does not follow exact -orbits in the bar regions and thus makes the bar weaker.
In the cold-disk models, the rapid decay of the bar strength after attaining a peak is caused by the rapid increase in the CMC. The bar weakening in model C10 is so dramatic that it quickly turns into an oval shape, as illustrated in Figure 7. With a relatively slow increase of the CMC, the bar in model C00 does not experience such weakening: it keeps longer and stronger secularly, and attains a Boxy/Peanut (B/P) shape at , a common late-time feature of -body bars (e.g., Manos & Machado 2014). The central mass increases more rapidly as the bar grows faster and stronger, resulting in stronger bar weakening in the cold-disk models with larger . This collectively makes a bar stronger in disks with smaller at the end of the runs.
In the warm-disk models, on the other hand, the bar growth time is relatively long and the CMC growth is accordingly quite slow. Therefore, the bar weakening after the peak strength is not so dramatic as in the cold disks. As a result, the bars at in the warm disks are stronger for smaller . Column (4) of Table 1 lists the values of averaged over –. Putting together all the results for both cold and warm disks, we conclude that the bar strength in the late phase of the disk evolution is inversely proportional to the gas fraction, independent of , notwithstanding temporal evolution in the early phase. A mild drop in of model W00 at – is due to buckling instability, which will be discussed in Section 3.3.
3.2.2 Bar Length and Pattern Speed
Since a bar is smoothly connected to the disk in which it is embedded, it is quite ambiguous to determine the bar ends. We empirically find that the stellar surface density of traces the bar boundaries reasonably well, which allows us to measure the bar semi-major axis from our simulations. To calculate the pattern speeds of non-axisymmetric features, we use the cross-correlation of the perturbed surface densities at two different epochs separated by :
| (9) |
(e.g., Oh et al. 2008, 2015). At a given time and radius, we determine the angle at which is maximized. The instantaneous pattern speed of the non-axisymmetric features is then determined by .
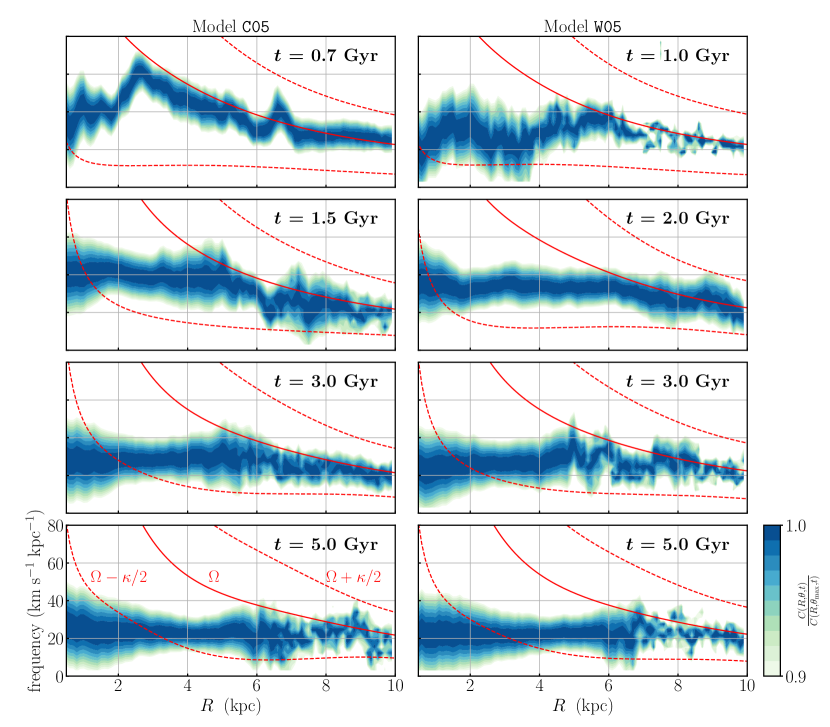
Figure 8 plots as contours the amplitudes of the normalized cross-correlation in the – plane for some selected epochs of models C05 (left) and W05 (right) together with the and curves at given time. The cross-correlation in the inner disk traces the bar pattern speed, while the regions outside the bar is dominated by the spiral arms. The bar pattern speed varies with at very early time when the bars are forming. Once they achieve a full strength (i.e., after and for models C05 and W05, respectively), however, becomes almost independent of , indicating that they are rotating rigidly. On the other hand, the spirals that form in the regions outside the bar have pattern speeds almost equal to , suggesting that they are material arms, until after the bar formation. They then tend to corotate with the bar (see Section 4.1).
Figure 9 plots temporal variations of and the bar pattern speed for all models. Overall, the increasing and decreasing trend of with time is similar to that of the bar strength, such that a bar becomes long (short) when it is strong (weak). Bars in models C07 and C10 are relatively short when they achieve the peak strength (at –), indicating that their strength is largely due to high stellar density resulting from rapid bar formation. Note that the bar pattern speed decreases continuously after the formation in all models, and a stronger bar slows down at a faster rate. This is because the angular momentum transfer between the bar and halo is more active for a stronger bar (e.g., Athanassoula et al. 2013; Martinez-Valpuesta et al. 2006). Note also that all bars except an oval in model C10 grow in size as they slow down over time (e.g., Athanassoula et al. 2002, 2003).
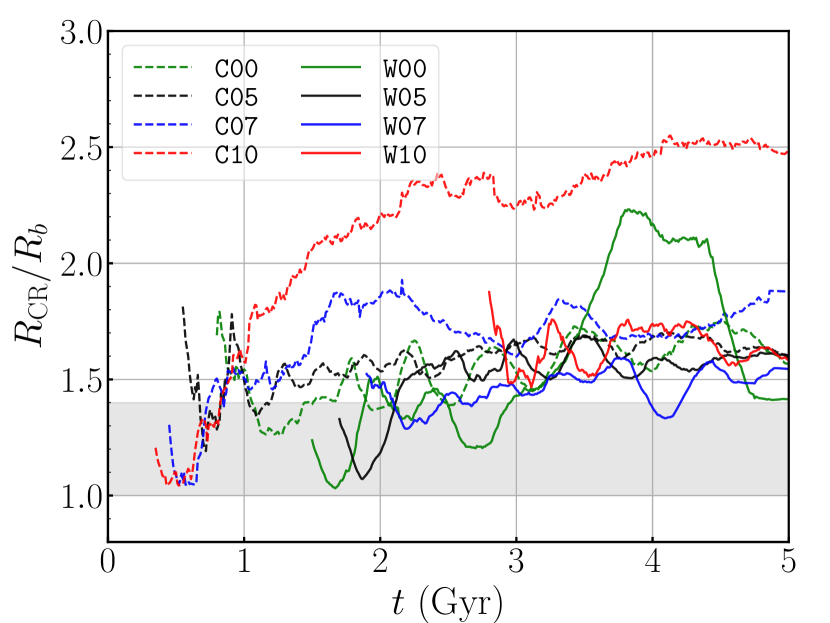
Bars are classified as being “fast” or “slow” if is less or greater than 1.4, respectively, where is the corotation radius. Figure 10 plots temporal variations of for all the bars formed in our models. The bars have for all time, indicating that they are located inside the corotation resonance. The initial decrease of is due to the rapid growth of during the bar formation, resulting in fast bars right after the formation. The bars subsequently slow down by transferring angular momentum to the surrounding halos, and turn to slow rotators with . This is overall consistent with the previous results that bars in simulations are usually slow unless disks are highly gas-rich (Athanassoula, 2014) or the galaxy rotation curves are dominated by a strong bulge (Pettitt & Wadsley, 2018). Column (5) of Table 1 gives the time-averaged values of over –. In model C10, the bar evolves to an oval with . The bar in model W00 undergoes buckling instability at to become shorter (see below), resulting in over –. Other than these, the bars in our models have – during most of their evolution.
3.3. Boxy/Peanut Bulge and Buckling Instability
We find that all bars in our models thicken over time and evolve to B/P bulges, except an oval in model C10 that remains in an ellipsoidal shape. The thickness of a bar or boxy/peanut bulge is conventionally measured by the B/P strength defined as
| (10) |
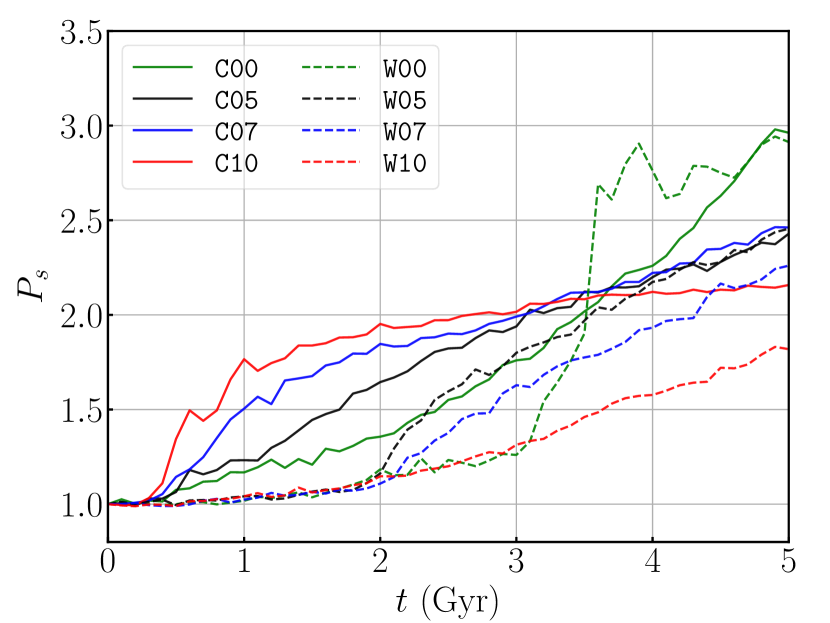
where the tilde indicates the median and the subscript “0” refers to the initial disk configuration (e.g., Iannuzzi & Athanassoula 2015; Fragkoudi et al. 2017). Figure 11 plots the temporal variations of the B/P strength in our models. The B/P strength increases gradually over time due to the CMC as well as the bar mass, both of which heat the disk by exciting stellar motions along the vertical direction. The late-time increase of in model C00 is largely caused by the increase in the bar mass rather than the CMC. The maximum thickness occurs typically at –, with larger values corresponding to stronger bars. In addition to this gradual thickening, model W00 also experiences a rapid increase of at , which is caused by a vertical buckling instability.
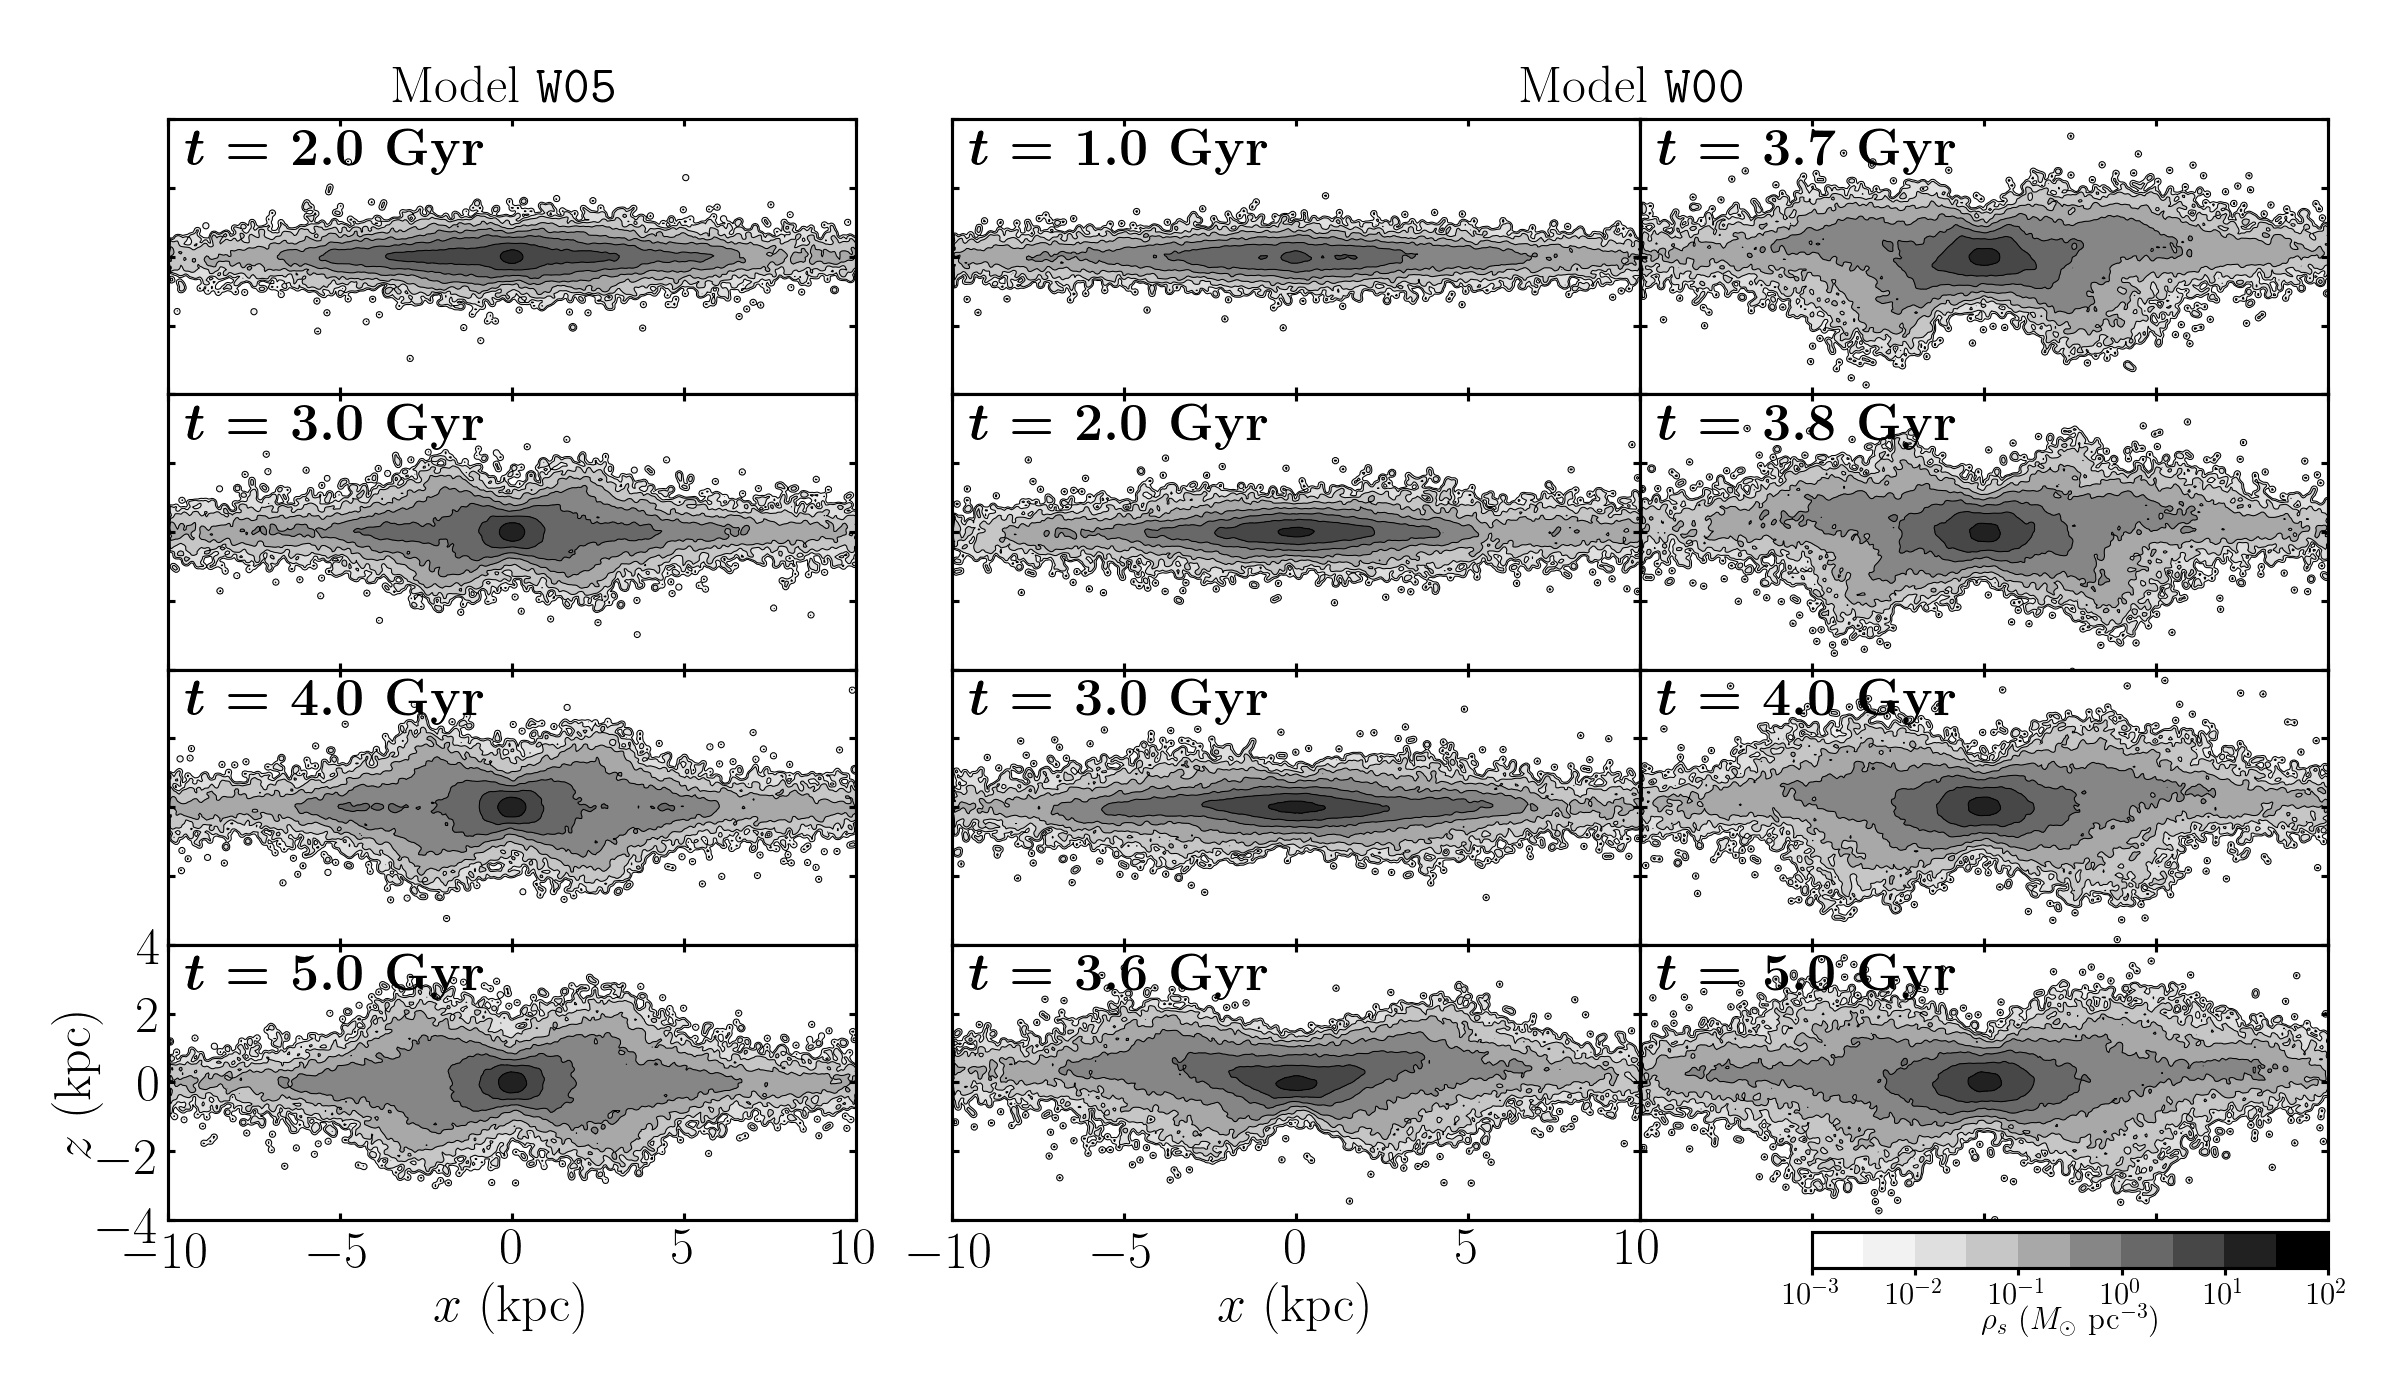
To illustrate the buckling instability, Figure 12 plots the contours of the stellar density in the – plane at some selected epochs of models W00 and W05, where and denote the directions along the bar semi-major axis and perpendicular to the galactic plane, respectively. The disk (or bar) in model W05 thickens gradually along the vertical direction and remains almost symmetric with respect to the midplane () during its entire evolution. On the other hand, the disk in model W00 thickens gradually for and then undergoes a fast buckling instability at , promptly increasing and breaking the reflection symmetry about the plane (e.g., Martinez-Valpuesta et al. 2006). It also causes a temporal drop in the bar strength (see Figure 6). The disk subsequently becomes more-or-less symmetric at , and the bar becomes a B/P bulge.
The operation of buckling instability requires the ratio of the velocity dispersions to be smaller than a critical value (e.g., Binney & Tremaine 2007). Toomre (1966) and Araki (1987) found that infinitesimally-thin, non-rotating slabs are unstable if , while Merritt & Sellwood (1994) suggested an instability criterion of for axisymmetric rotating disks. For barred disks with spatially varying , Martinez-Valpuesta et al. (2006) and Kwak et al (2017) used -body simulations to show that the critical values for buckling are at for their models, suggesting that the critical value may depend on the density and velocity distributions inside the disk.
Figure 13 plots temporal changes of for models C00, C05, W00, and W05 at (left) and (right). The bar formation in itself increases , while the CMC and the bar mass tend to increase . Since the bar formation primarily involves the mass re-distribution in the galactic plane, increases more rapidly and strongly than . In the inner disk where a bar is located, this causes to decrease with time in the early phase of bar evolution ( and for the cold- and warm-disk models), and subsequently to increase as the increase of slows down.
The minimum value of is determined by the competition between the bar strength and the CMC. It turns out that all of our models with gas included suffer a large increase in to always have in the bar regions throughout their entire evolution, and thus remain stable to the buckling instability. Although model C00 has no gas, its bar is strong enough to heat the disk vertically, resulting in for all time. On the other hand, the bar in model W00 grows strong but relatively slowly, and incurs only a mild increase in the CMC and the bar mass. As a consequence, it has as low as and undergoes buckling instability. These results suggest that the critical value for the buckling instability is for our models, and that the presence of gas tends to suppress buckling instability by increasing the CMC. This is qualitatively similar to the results of Iannuzzi & Athanassoula (2015) who found that models without gas belong to a strong-B/P group where bars undergo bucklings and result in high , while those with a large fraction of gas involve gradual bar and growth and are in a moderate-B/P group. Berentzen et al. (2007) also showed that gas-free/poor disks experience buckling, while gas-rich models thicken due to vertical heating instead of buckling.
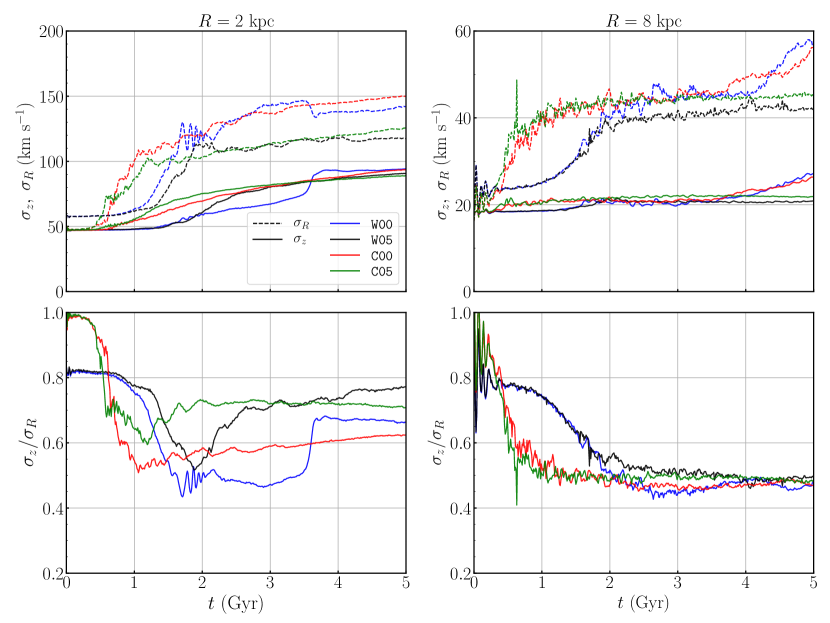
The right panels of Figure 13 show that the bar formation increases significantly also in the outer regions. However, the excitation of the vertical stellar motions due to the CMC and the bar mass is negligible in these regions, making almost unchanged. The amount of the increment in the velocity dispersions is insensitive to the gas fraction until when the bar grows in size sufficiently to directly influence stellar orbits in the outer regions. This makes at reduced to at the end of the runs, almost independent of . The velocity dispersions at in both cold- and warm-disk models are consistent with the solar neighborhood values – and – of the Milky Way obtained from the analysis of the second Gaia data release (e.g., Katz et al. 2018; see also Sharma et al. 2014; Guiglion et al. 2015).
4. Gaseous Structures and Star Formation
4.1. Spiral Structures
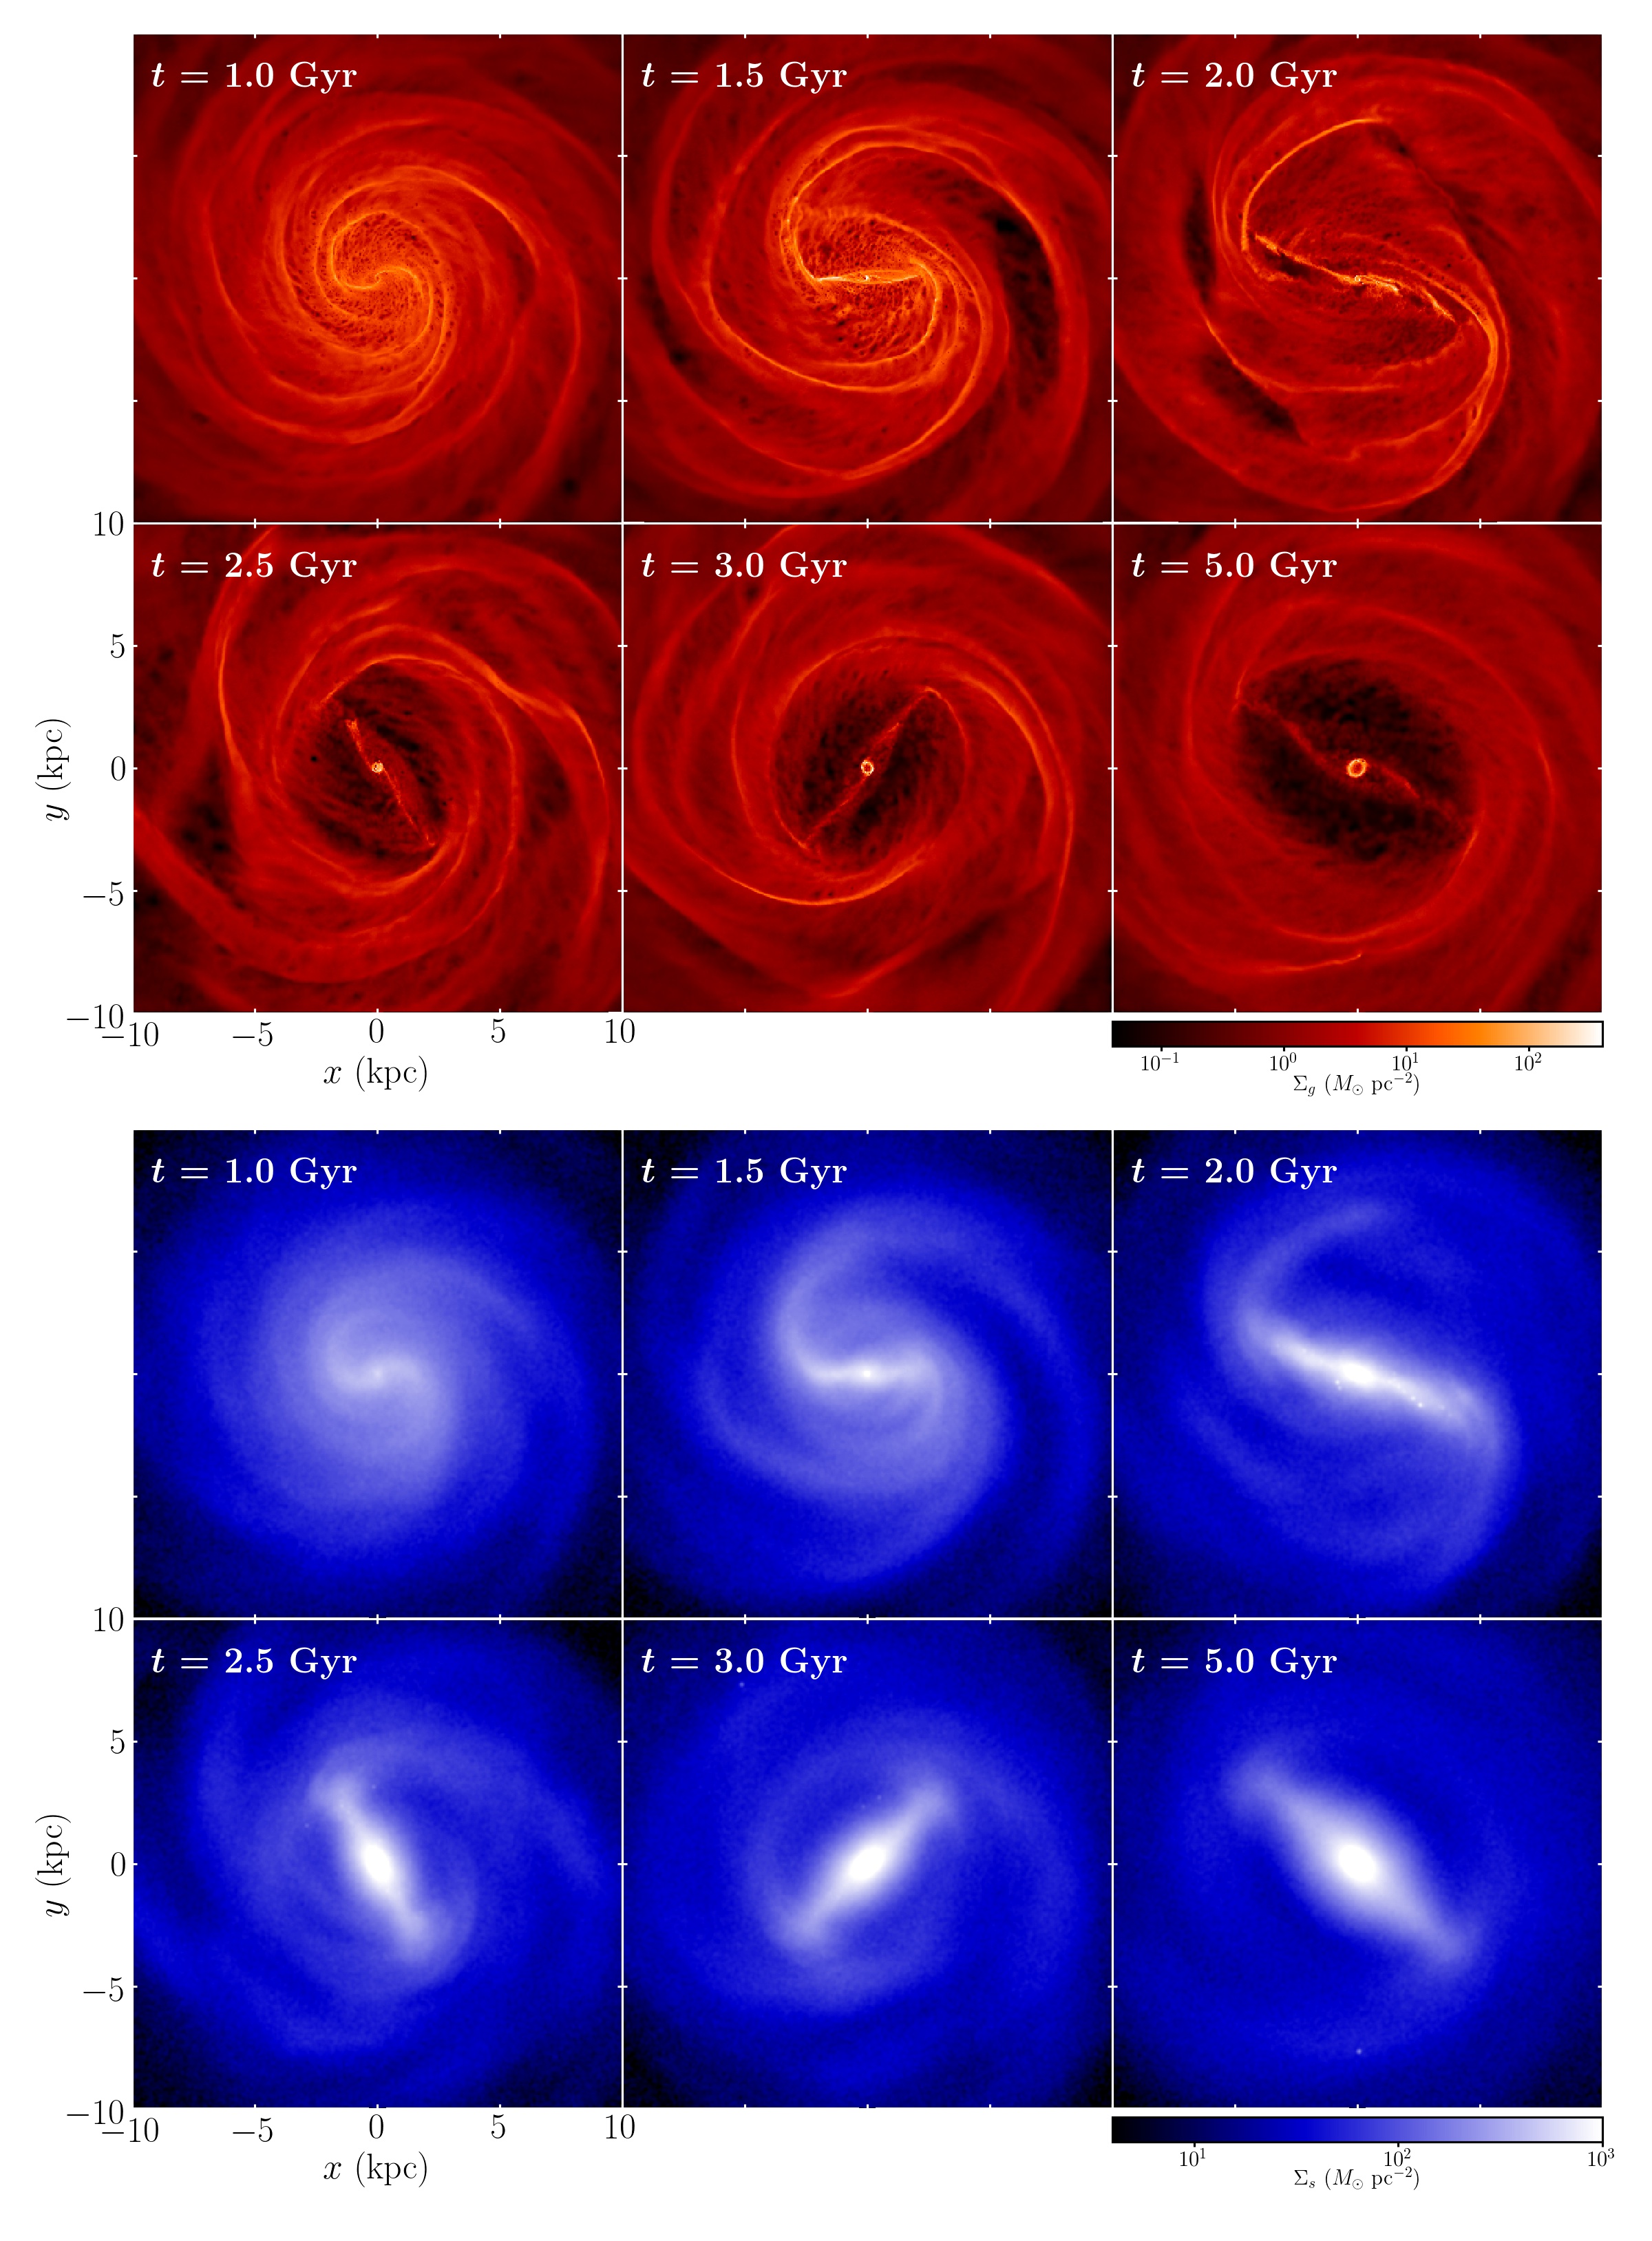
Figure 14 plots snapshots of the gas surface density (upper panels) as well as the stellar surface density (lower panels) in logarithmic scale of model W05 in the regions at six different epochs. The stellar surface density counts both the pre-existing particles in the initial stellar disk and the new stellar particles created from the gaseous disk. Both the bars and gas are rotating in the counterclockwise direction.
In the regions outside the bar, the gas disk exhibits spiral structures that not only trace the local minima of the total gravitational potential but also are sites of star formation. The location of the gaseous spiral arms almost coincides with that of the stellar spiral arms, although the former is narrower and more strongly peaked. The number of arms depends on and when they form, and their pattern speed closely follows the local angular speed of galaxy rotation (see Figure 8). This suggests that the arms have a character of material arms at early time, similarly to self-generated arms driven by swing amplifications (e.g., Baba et al. 2013; D’Onghia et al. 2013). They then merge themselves and start to interact with the bar potential that is growing, eventually ending up being four spirals that are piecewise logarithmic in shape, with a pitch angle of –. Figure 8 shows that at late time the spirals tend to roughly corotate with the bar, which is consistent with the results of Roca-Fàbrega et al. (2013) who showed that spiral arms in unbarred disks have a pattern speed close to , whereas those in barred-spiral models corotate with a bar.
4.2. Nuclear Ring
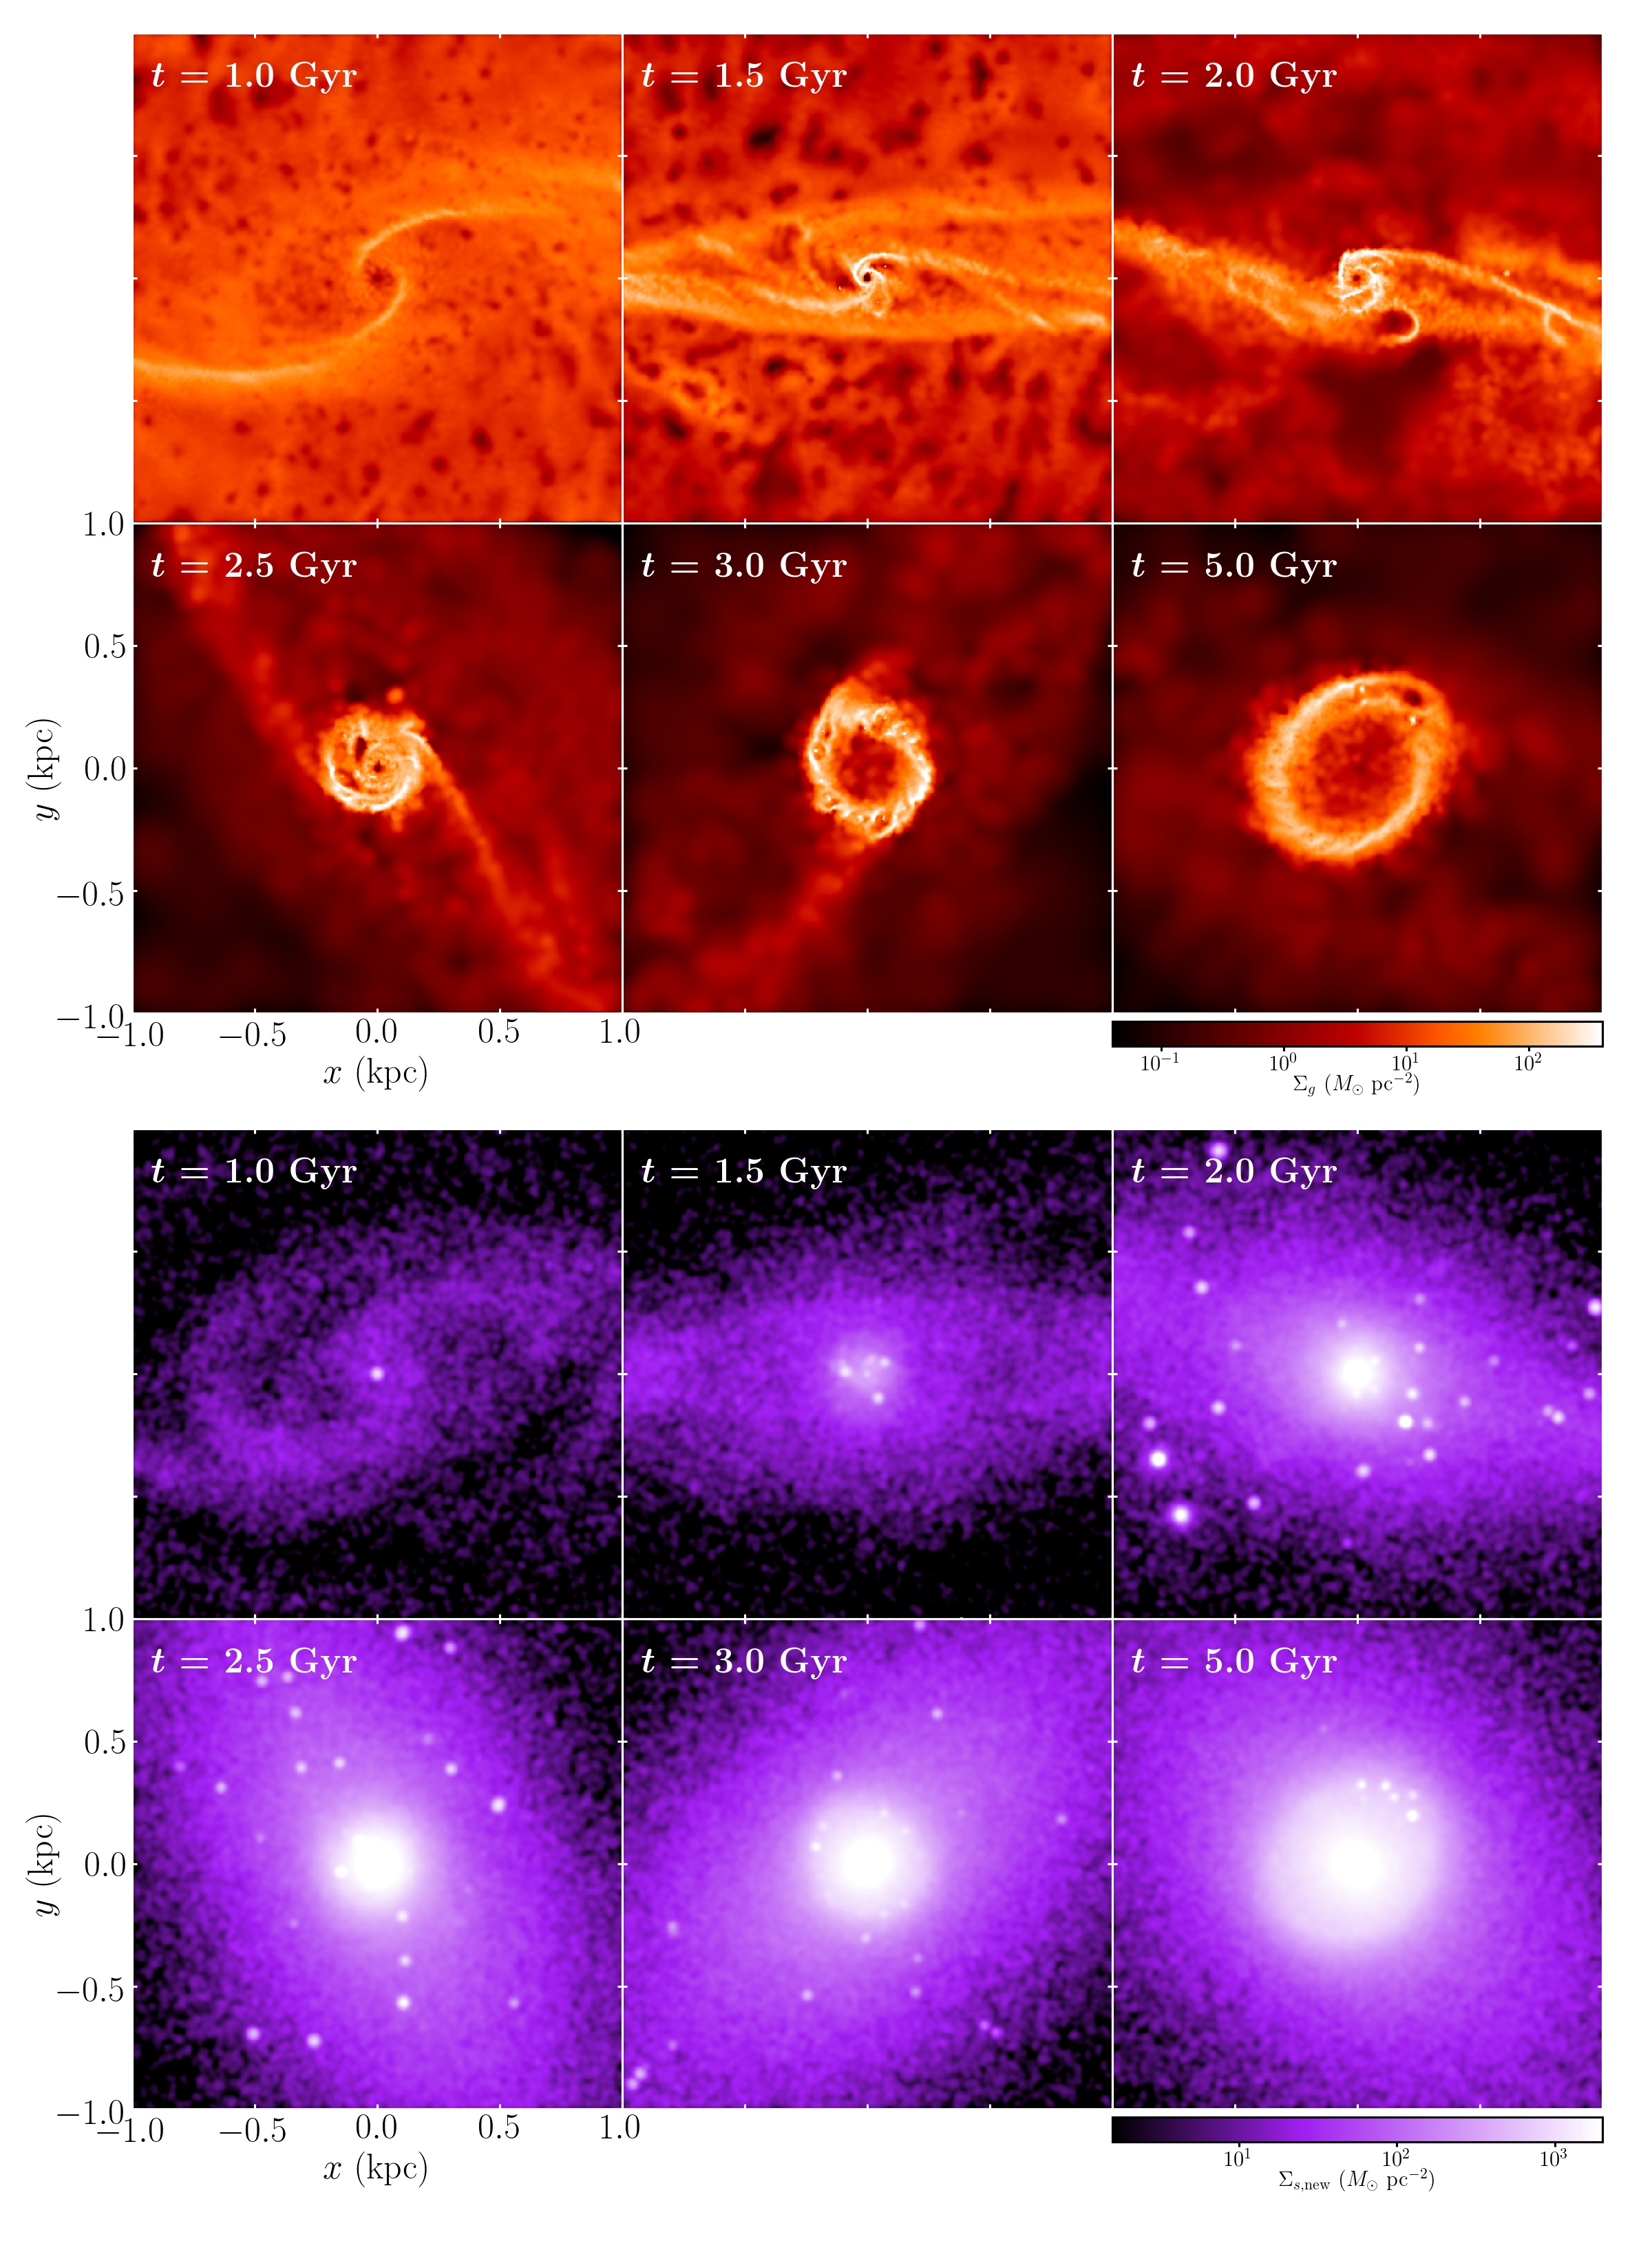
The regions inside are governed by the bar potential. In model W05, a weak stellar bar at produces a pair of dust lanes that are relatively straight at and take a form of trailing spirals toward the center (e.g., Maciejewski 2004). As the bar grows further, the dust lanes become quite straight and are located very close to the semi-major axis of the bar (e.g., Kim et al. 2012a). To display detailed structures of dust lanes and a nuclear ring, Figure 15 zooms in the central regions of the snapshots shown in Figure 14, with the lower panels showing only the stars produced from the gaseous disk. At , there are some stars formed from the dust lanes that are curved, yet no ring is created at the center. A small nuclear ring with radius is beginning to form at as the material driven inward by the bar potential accumulates near the galaxy center.
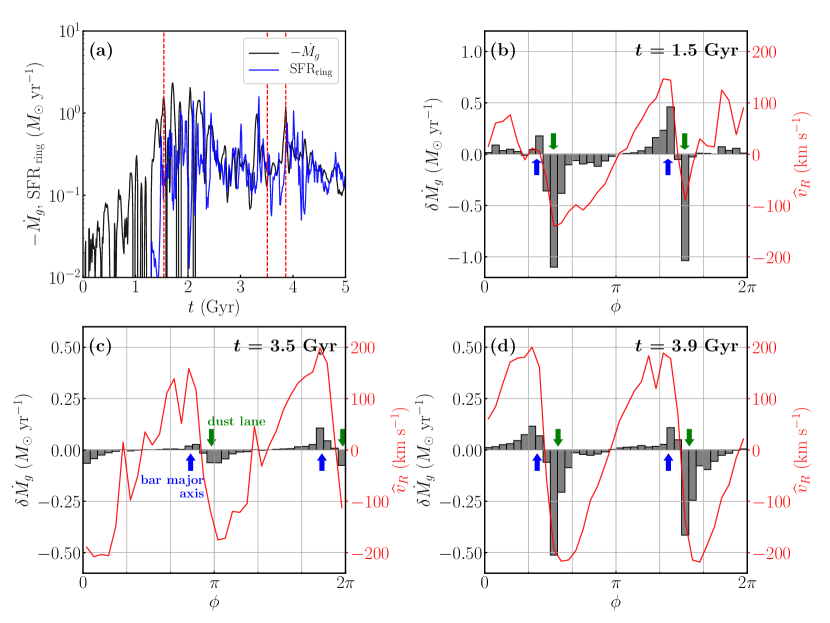
To quantify the mass inflow, we calculate the binned gas inflow rate , where and denote the bin boundaries and width, respectively. The gas inflow rate at is then given by . Figure 16(a) plots as a black solid line the temporal changes of at in model W05. For comparison, we also plot the ring star formation rate SFRring as a red line, which will be discussed in Section 4.4. Figure 16(b-d) plots the angular distributions of the binned mass inflow rate (histograms) as well as the vertically averaged radial velocity (solid lines) at and , , and for model W05. These times are chosen to illustrate the cases when the bar is growing (), when the mass inflow rate is small () or large () after the bar reaches roughly a quasi-steady state. Clearly, the gas infall occurs mainly along the dust lanes (green arrows) located downstream from the bar semi-major axis (blue arrows). While fluctuates with large amplitudes during the bar formation due to star formation feedback, it varies quite mildly around the mean value of about after , and the maximum binned inflow rates amount to to with inflow velocities of –. Since the gas in the bar regions more-or-less follows -orbits, some gas in the upstream side from the semi-major axis moves outward radially, but the associated outflow rate is in general smaller than the inflow rate, resulting in overall inflows.
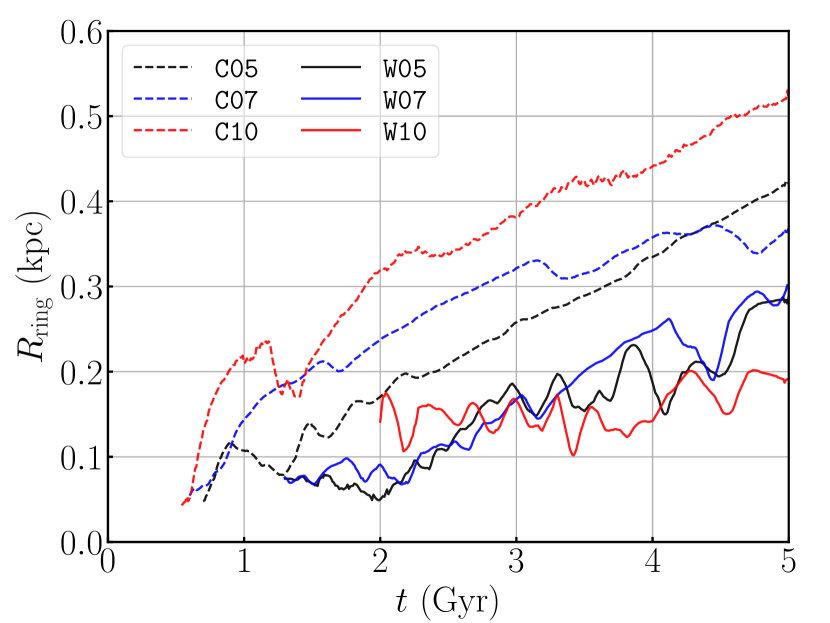
To explore how the ring size varies with time in our models, we measure the density-weighted, angle-averaged ring radius using
| (11) |
Figure 17 plots as functions of time for all models with gas. In model W05, the ring remains small and exhibits small fluctuations until the bar strength reaches its peak at . During this time, intermittent star formation occurring in the nuclear regions disperse the ring and dust lanes temporarily.
After the bar achieves the maximum strength, the gas in the bar regions experiences massive infall and is added continuously to the ring. The ring in model W05 grows in size slowly with time to at , which is caused primarily by the increase in the bar size (Fig. 9a). As the bar becomes longer, fresh gas at larger and thus with higher angular momentum infalls to be added to the ring. At the same time, the gas already in the ring that has lower angular momentum than the gas being added is continually consumed to star formation at a rate of . Since the ring mass is typically , the ring gas is almost completely replaced by newly inflowing gas from outside in . The decrease in the bar pattern speed which tends to make the dust lanes move away from the bar semi-major axis (e.g., Li et al. 2015) as well as the CMC increase also help to increase the ring size. Large fluctuations in the ring size at late time in the warm-disk models are due to active star formation feedback (see Section 4.4). Column (6) of Table 1 lists the time-averaged values of over –. Although all rings in our models keep growing until the end of the simulations, they would stop growing when the bars reach a steady state.
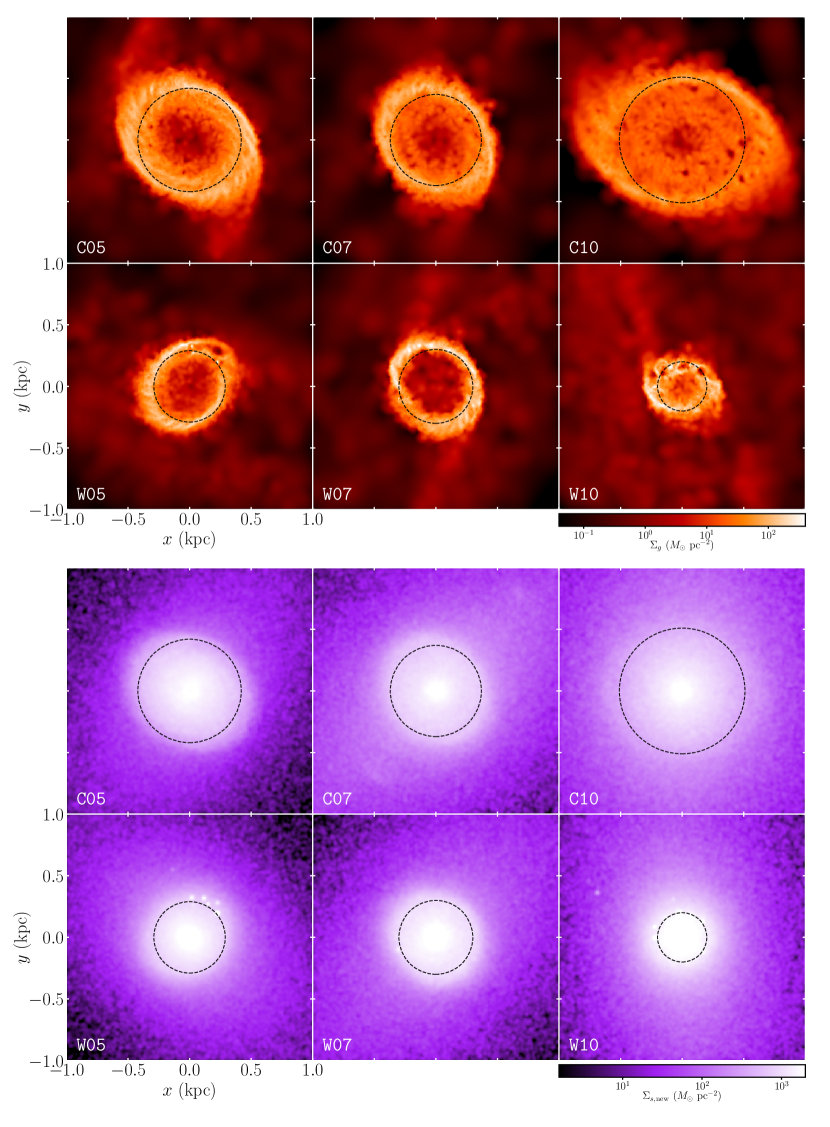
Figure 18 compares the distributions of the gas surface density (upper panels) and the surface density of the newly formed stars (lower panels) at in the nuclear regions in all models with gas. The black dashed circles mark the ring size obtained by Equation (11). Although the newly formed stars as a whole are smoothly distributed at without noticeable features, we find that young stars with age less than are in a ring shape, similarly to the gaseous counterpart, which may be observed as stellar nuclear rings in the TIMER survey (e.g., Gadotti et al. 2019). Stars older than this age were also in a ring at earlier time, but their radial diffusion through mutual scattering makes it difficult to keep them in a ring shape.
Overall, the rings in the cold disks are larger than in the warm disks since the former forms earlier and thus can grow for a longer period of time until the end of the runs. There is no apparent correlation between the ring size and the gas fraction. In model W10, the nuclear ring has a radius of , largest among the rings, when it first forms at , and its size does not vary much with time afterward. This is because the CMC that is already sufficiently strong at the time of ring formation overwhelms the effect of the bar growth that occurs quite slowly (e.g., Li et al. 2017). Although the bar (or oval) in model C10 remains short and weak throughout most of its evolution, the gas inflows driven by spiral arms into the bar regions are significant to make the ring larger in size over time (e.g., Kim & Kim 2014; Seo & Kim 2014).
That a nuclear ring forms small and becomes larger with time found in our current models is different from the cases with a static bar potential in which a ring is large when it forms (e.g., Kim et al. 2012a, b). When the properties of a stellar bar are fixed with time, the non-axisymmetric bar torque produces dust-lane shocks downstream away from the bar semi-major axis. In this case, a ring forming at the inner ends of the dust lanes has quite a large radius, although it subsequently shrinks in size by 10 to 20% as collisions of dense clumps inside the ring take away angular momentum from the ring (Kim et al., 2012a). In our self-consistent models, on the other hand, the physical properties of stellar bars keep changing with time, providing non-steady gravitational potentials to the gas. Near the time when a nuclear ring forms (), the bar potential is strong enough to induce shocks only in the innermost () parts of the dust lanes, so that the resulting nuclear ring should be much smaller than the counterpart under the fixed bar potential where the dust-lane shocks are extended across the whole bar length.
4.3. Filamentary Spurs
While perpendicular filamentary interbar spurs have often been observed in association with dust lanes in real galaxies (e.g., Sheth et al. 2002; Zurita & Pérez 2008; Elmegreen et al. 2009), previous hydrodynamic simulations with a fixed bar potential were unable to produce such structures (e.g., Kim et al. 2012a, b; Seo & Kim 2013, 2014). In these simulations, the bar regions quickly reach a quasi-steady state in which gas approximately follows -orbits that are almost parallel to the dust lanes (see, e.g., Figure 7 of Kim et al. 2012b).
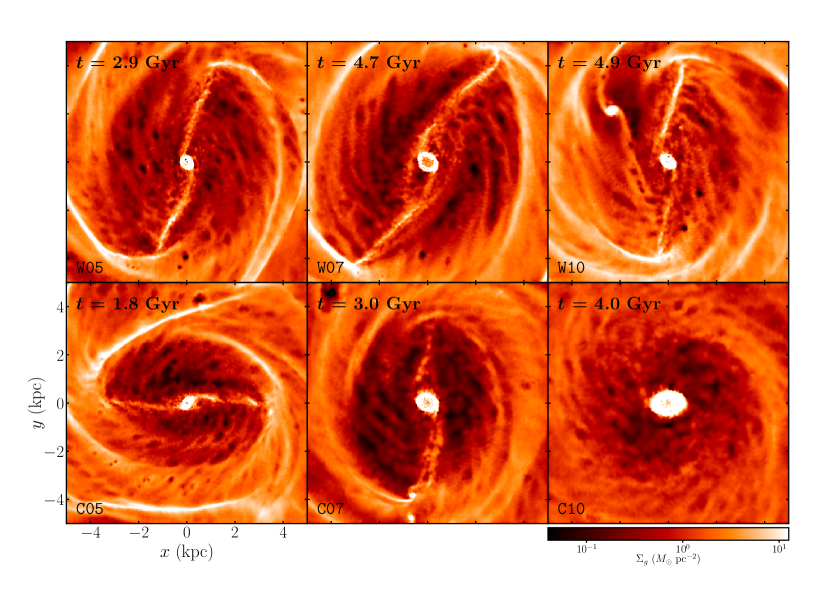
Unlike in the previous simulations, we find that the current self-consistent simulations with gas produce interbar spur-like structures during the time when a bar grows, except for model C10 in which a bar rapidly evolves to a weak oval without dust lanes. Figure 19 plots logarithm of the gas surface density in the inner regions for all models with gas at selected epochs when spur-like structures are vivid. It is apparent that in all models except model C10 several interbar spurs are connected perpendicularly to the dust lane. These structures are transient, lasting typically for before being destroyed by nearby star formation. In terms of the number, shape, and density of spurs, there is no noticeable difference from model to model. The density enhancement associated with the spurs is only in the interbar regions, which becomes larger in the dust lanes by up to an order of magnitude. High-density peaks formed by collisions of the spurs with the dust lanes sometimes undergo star formation.
Spur-like structures in our models are originated from star formation feedback as well as non-steady gas streamlines. Shells produced by feedback in the low-density interbar regions are stretched by shear in the background flows, creating filamentary structures there. Since the bars in our simulations change with time, there are no well-defined -orbit families that gas can follow. As the bar slows down, the gas velocity relative to the bar becomes larger. With the increased ram pressure, the dust lanes slowly move away from the bar semi-major axis (e.g., Li et al. 2015), and the gas streamlines that turn their directions near the semi-major axis become almost perpendicular to the dust lanes. The sheared filaments also turn directions near the bar semi-major axis and hit the dust lanes perpendicularly to enhance the local density.
4.4. Ring Star Formation
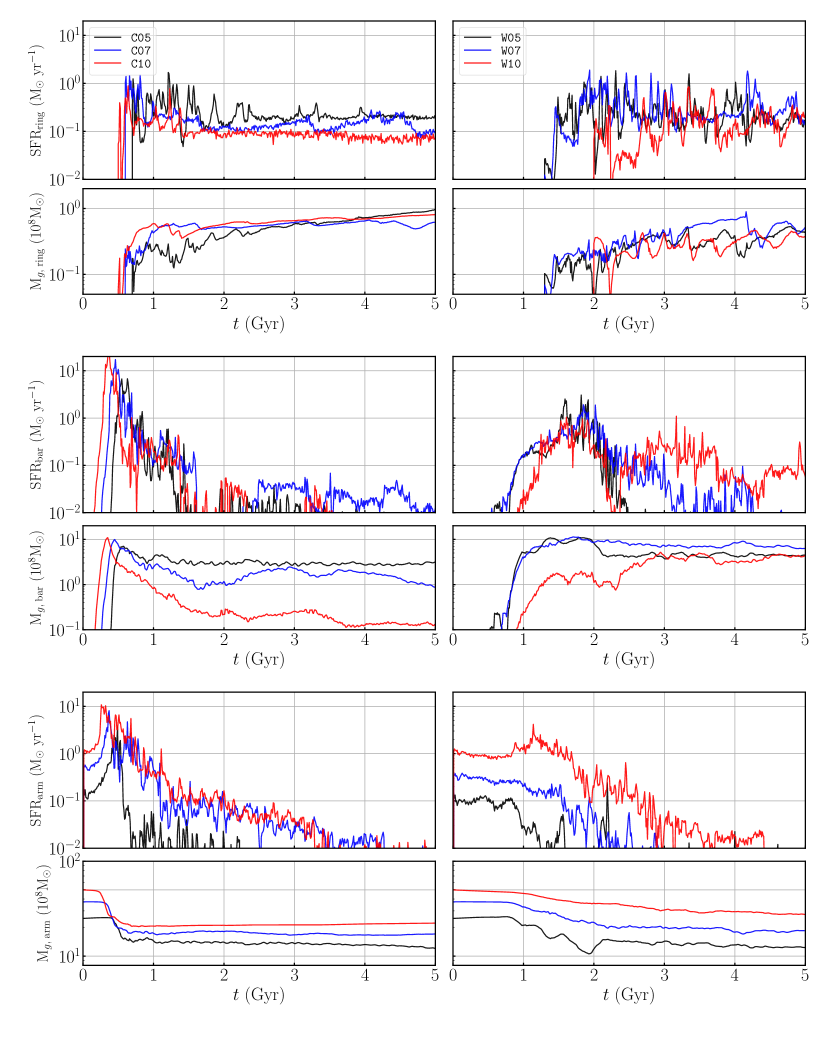
Star formation in our cold-disk models is widely distributed across the entire disk, while the warm-disk models actively form stars only inside the bar and nuclear regions. Using the instantaneous bar and ring sizes, we divide the entire disk into three parts: the arms regions with , the bar regions with , and the ring regions with . Figure 20 plots temporal changes of the star formation rate (SFR) as well as the gas mass () in the cold-disk (left) and warm-disk (right) models. The top, middle, and bottom panels give the SFR occurring in the ring, bar, and arm regions, respectively.
In the outer disk, star formation occurs mostly inside spiral arms and is stronger in the cold disks with stronger arms. The presence of strong spirals before the development of a bar is responsible for a sharp increase in the arm SFR at the expense the gas mass in the outer parts of the cold-disk models. As the spirals become weaker due to heating of star particles scattered off arms and gas clouds, the SFR in the outer disk decrease rapidly with time. The decrease of the gas mass and no gas inflow from outside also make the arm SFR decreased.
The formation of a bar certainly triggers star formation in the bar and central regions. As the bar grows, the non-axisymmetric potential produces a pair of dense ridges and a nuclear ring in which most of the disk star formation takes place at late time. The early increasing trend of the bar/ring SFR is similar to that of the bar strength. After the bar achieves a full strength ( in the cold disks and in the warm disks), the density of dust lanes become reduced and the bar SFR experiences a dramatic drop, while the decrease in the ring SFR is only mild due to continued mass infalls. This is in contrast to the cases with a fixed bar potential where fast gas exhaustion caused by a fast bar growth on the timescale of makes the ring SFR declines very rapidly afterward (e.g., Seo & Kim 2013, 2014). The relatively slow decrease of the ring SFR results from the fact that bars in our current models grow slowly and become longer in size over time. This not only makes the duration of star formation extended but also expands the regions influenced by the bar potential, allowing sustained gas inflows to the rings. In addition, mass ejections via SNe from star particles help to increase the gas mass available for the ring star formation.
Overall, the ring SFR is larger when a bar is stronger. The gas mass, roughly , in the ring is insensitive to , so that a smaller ring has a higher gas density and thus a higher SFR. The ring SFR is highly episodic and bursty caused by star formation feedback. Sometimes, especially at early time when rings are small, feedback is so strong that the rings are completely destroyed and reform multiple times. Column (7) of Table 1 lists the time-averaged ring SFR over –. In model W10, the bar is weak and grows slowly, and the resulting SFR in the ring also exhibits a slow growth with intermittent bursts. Since the gas stays longer in the bar region, the bar SFR in model W10 is higher than that in models W05 and W07 with stronger bars. In model C10, the bar size remains almost unchanged after , so that the ring SFR keeps decreasing as the bar region becomes devoid of gas.
5. Summary and Discussion
5.1. Summary
We have presented the results of self-consistent three-dimensional simulations of barred galaxies that possess both stellar and gaseous disks. Our primary goals are to understand the effects of the gaseous component on the bar formation and to explore how nuclear rings form and evolve in galaxies where the bar properties vary self-consistently with time. We consider radiative heating and cooling of the gas and allow for star formation and related feedback, but do not include magnetic fields in the present work. We consider two sets of models, similar to the Milky Way, which differ in the velocity anisotropy parameter (or, equivalently, the minimum Toomre stability parameter ). The models with and 1.44 have a disk with and 1.2, and are thus referred to as “cold-disk” or “warm-disk” models, respectively. In each set, we vary the mass of gaseous disk, , in the range between 0 and 10%, while fixing the total disk mass to . The main results of our work can be summarized as follows.
-
1.
Effects of Gas on the Bar Formation: Perturbations in the initial disks are swing amplified to form spiral structures. In the cold-disk models, the initial swing amplification is strong enough to make the spirals highly nonlinear instantly, and the disks soon become dominated by the spirals that have a long duration for growth. These spirals interact nonlinearly with other modes with different and rapidly transform to an bar mode supported by closed -orbit families. Since the gaseous component is effectively colder than the stellar component, a bar in a disk with larger forms faster and more strongly.
In the warm-disk models, however, the initial swing amplification is only moderate and the resulting spirals are in the linear regime. Thus, spirals that will eventually become a bar should be amplified further via successive swing amplifications and multiple loops of feedback. Modes with larger are favored in a disk with larger due to lower effective velocity dispersions, indicating that the amplitude of the bar-seeding spirals is lower for larger . Unlike in the cold disks, therefore, a warm disk with larger forms a bar more slowly.
-
2.
Bar Evolution: Bar formation necessarily involves the mass re-distribution as well as gas inflows toward the center, increasing CMC. The CMC as well as the bar mass in turns weaken the bar by exciting stellar motions in the vertical direction. The CMC grows faster for a stronger bar, resulting in a faster bar decay. For example, a bar in model C10 grows very rapidly () and then becomes weaker by a factor of three in , eventually turning to an oval. On the other hand, model C00 with a slow increase of the CMC does not experience such bar weakening. Consequently, bars in both cold and warm disks become stronger in models with smaller at the end of the runs. The bar length is correlated with the bar strength such that a stronger bar is usually longer. Although bars are fast when they form, they slow down to become slow rotators with by transferring angular momentum to their surrounding halos.
We find that all bars formed in our models thicken over time to become a B/P bulge. While the bar thickening occurs gradually due to vertical heating in most models, the gas-free, warm-disk model W00 undergoes a rapid thickening via buckling instability which occurs when , where and refer to the velocity dispersions in the vertical and radial directions, respectively. The presence of gas tends to stabilize the buckling instability by enhancing the CMC and thus , consistent with the results of Berentzen et al. (2007) and Iannuzzi & Athanassoula (2015). Although model C00 does not have gas, its CMC growth is strong enough to quench the buckling instability.
-
3.
Nuclear Ring and Spur: The non-axisymmetric bar torque induces shocks in the gas flows and form dust lanes. The gas experiences infall along the dust lanes to form a nuclear ring. At early time when the bar grows, only a gas close to the galaxy center responds to the bar potential, leading to a small nuclear ring with radius . Due to strong feedback from explosive star formation inside the ring, the tiny ring is repeatedly disrupted and reforms. As the bar grows in size, gas at larger radii starts to infall and be added to the nuclear ring. Since the gas at larger radii has increasingly larger angular momentum, the addition of gas from larger radii makes the nuclear ring larger with time, up to – at the end of the runs. Overall, the rings are larger in the cold disks since they form earlier and thus grow for a longer period of time. The ring is smallest in model W10 in which the CMC offsets the effect of the bar size on the ring growth (Li et al., 2017). The ring is largest in model C10 where spiral arms supply gas with high angular momentum to the bar regions.
Unlike the previous simulations with a fixed bar potential, our current self-consistent simulations form filamentary interbar spurs that are connected perpendicularly to dust lanes. The origin of filaments is expanding SN shells produced by star formation feedback that are sheared out in the low-density bar regions. Since the bars becomes stronger and longer over time, the dust lanes move gradually away from the bar semi-major axis. When the filaments hit the dust lanes perpendicularly, the local density is enhanced by an other of magnitude in the dust lanes, sometimes enough to form stars.
-
4.
Star Formation: The cold-disk models form stars both in the outer disks with spiral arms and in the inner disk with a bar, while star formation in the warm-disk models with weak spirals is concentrated in the inner disk. Bar formation triggers star formation in the bar regions (mostly inside dust lanes) as well as in the nuclear rings. Overall, the ring SFR is stronger for a stronger bar. The ring star formation is highly episodic and bursty due to feedback that can sometimes disrupt the rings. The SFR in the bar regions rapidly declines after the bar attains the peak strength. However, the decrease in the ring SFR is quite mild due to a slow bar growth as well as a temporal increase in the bar length, the latter of which can continuously supply the gas to the ring at late time. Mass return via SNe also helps the ring SFR persist longer than the cases with a fixed bar potential (e.g., Seo & Kim 2013, 2014). Overall, the ring SFR is very similar to the the mass inflow rate to the ring, amounting typically to to at velocities – along the dust lanes (see Figure 16).
5.2. Discussion
In this paper, we consider galaxy models similar to the Milky Way to study bar formation in disks with gas. The properties of the bars and nuclear rings formed in our simulations are very close to those in the Milky Way. The Milky Way is known to have a bar with the semi-major axis of – (Morris & Serabyn 1996; Dame et al. 2001; Ferriére et al. 2007; Kruijssen et al. 2015; Bland-Hawthorn & Gerhard 2016). The CMZ, a nuclear ring in the Milky Way, has a radius of – (Morris & Serabyn, 1996), consistent with the ring sizes displayed in Figure 17. The CMZ is observed to have a total gas mass of – (Dahmen et al., 1998; Ferriére et al., 2007; Immer et al., 2012; Longmore et al., 2013), similar to gas mass – in the ring of model W05. The present-day SFR in the CMZ is estimated to be –(Morris & Serabyn 1996; Yusef-Zadeh et al. 2009; Immer et al. 2012; Longmore et al. 2013; Koepferl et al. 2015), about 10 times smaller than the value inferred from the CMZ mass (Tsuboi & Ukita, 1999; Longmore et al., 2013). This is probably because star formation in the CMZ is episodic and currently in the low state (Kruijssen et al., 2014; Krumholz et al., 2016), consistent with the results of our simulations.
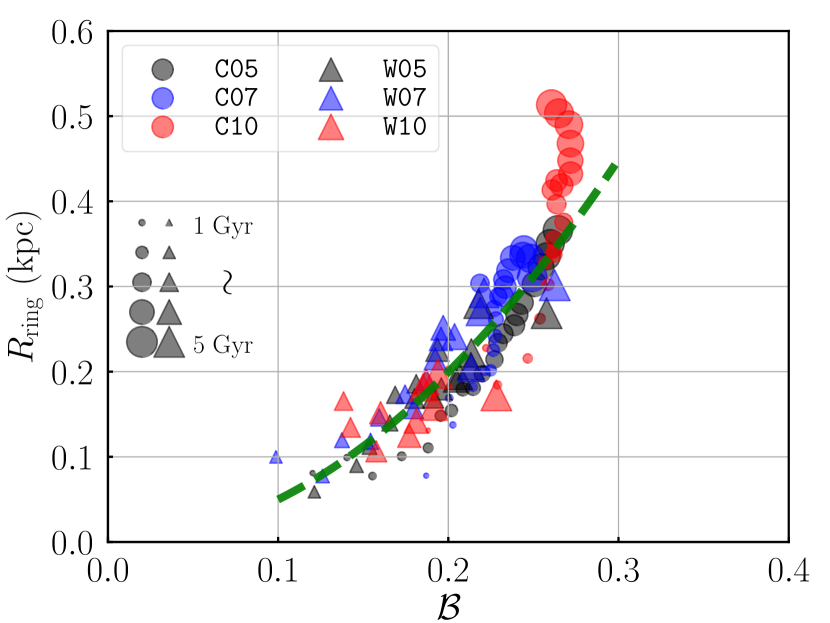
Our models show that the size of a nuclear ring increases with time after the temporal bar weakening associated with the CMC, suggesting the CMC definitely affects the ring size. Previous simulations employing a rigidly-rotating fixed bar potential found that rings are smaller for stronger and/or faster bars (Kim et al., 2012a; Li et al., 2015). To see what controls the ring size in our current models in which bars evolve self-consistently, we try to fit using various combinations of the CMC, the bar strength , and the pattern speed , and empirically find that the dimensionless parameter
| (12) |
gives a reasonable fit. Figure 21 plots as a function of for all models at various time, with the symbol size denoting the time. Except for model C10 with an oval, the ring size is given roughly by , showing that nuclear rings are larger for larger CMC, smaller , and/or smaller , consistent with the results of the previous simulations (e.g., Kim et al. 2012a; Li et al. 2015) and observations (e.g., Mazzuca et al. 2008, 2011; Comerón et al. 2010). The dependence of on the physical parameters in Equation (12) suggests that the ring size in our simulations is most sensitive to the CMC rather than the bar strength or pattern speed.
Except model C10 with an oval, all bars in our models have – during most of their evolution, corresponding to slow bars. This is in contrast to observational results that bars in most external galaxies are fast rotators with (e.g., Corsini 2008, 2011; Fathi et al. 2009; Pérez et al. 2012; Aguerri et al. 2015). A recent made-to-measure modeling of Portail et al. (2017) to match the red clump giant density as well as the bulge kinematics obtained from various surveys found for the bar in the Milky Way, with the corotation resonance . Together with the measured bar length of (Wegg et al., 2015), this suggests that the Milky Way bar is also a fast rotator with (Portail et al., 2017). It appears that the bar pattern speed as well as are affected by various parameters such galaxy rotation curve, gas fraction, halo shape, etc. (e.g., Athanassoula 2014; Pettitt & Wadsley 2018). For instance, Pettitt & Wadsley (2018) showed that the bar pattern speed depends rather critically on the shape of the rotation curve in such a way that bars under the “rising” rotation curve are slow, while the other rotation curves produce fast bars. We note that the our rotation curve shown in Figure 1 is quite similar to the rising rotation curve considered in Pettitt & Wadsley (2018). Under the rising rotation curve, the bars that form have relatively low specific angular momentum and thus a small pattern speed from the outset, and a small amount of angular momentum transfer to the halo makes them evolve to slow bars. An inclusion of a strong bulge, which is missing in our current models, would make the bars rotate faster.
All nuclear rings formed in our models have radii less than at the end of the runs. Although these are more-or-less comparable to the ring sizes in galaxies like the Milky Way, they are certainly smaller than typical nuclear rings in normal barred-spiral galaxies such as NGC 1097 (e.g., Comerón et al. 2010) and those formed in simulations with fixed bar potentials (e.g., Kim et al. 2012a, b; Li et al. 2015). Relatively small nuclear rings are presumably due to the absence of a bulge in our initial galaxy models. Recently, Li et al. (2017) used hydrodynamic simulations with static stellar potentials to show that a nuclear ring forms only in models with a central object exceeding of the total disk mass, and that the ring size increases almost linearly with the mass of the central object. This opens the possibility that the presence of a massive compact bulge would make a ring large when it first forms. The ring can be even larger as it grows due to an addition of gas with larger angular momentum from outer regions.
We find that the effects of gas to the bar formation depends rather sensitively on the velocity anisotropy parameter or such that gas causes a bar to form faster and stronger in cold disks with , while tending to suppress the bar formation in warm disks with . In contrast, Athanassoula et al. (2013) reported that the gaseous component with always prevents the bar formation, similarly to our warm-disk models. On the other hand, Robichaud et al. (2017) ran simulations of bar formation with or without AGN feedback, and showed that gas in models with AGN feedback promotes the bar formation, similarly to our cold-disk models, whereas the bar formation without AGN feedback is independent of . These discrepancies in the results of various simulations with different parameters suggest that bar formation involves highly nonlinear processes especially with gas and is thus very sensitive to the initial galaxy models as well as the gas fraction.
In addition to the gas fraction and velocity anisotropy parameter, the properties of a DM halo also appears to affect dynamical evolution of bars via angular momentum exchanges with the disks (e.g. Sellwood 1980; Debattista & Sellwood 2000; Athanassoula et al. 2003). Recent numerical simulations (with no gas) showed that the bar evolution is influenced by the shape and the spin parameter of the DM halo (e.g., Athanassoula et al. 2013; Collier et al. 2018). In particular, Athanassoula et al. (2013) found that bars under a triaxial halo form earlier and experience stronger decay than in galaxies with a spherical halo. On the other hand, Collier et al. (2018) found that bars under both prolate and oblate haloes start to form later. They further showed that a halo with faster spin is less efficient in absorbing angular momentum and thus results in a weaker and smaller bar. It will be interesting to see how the presence of gas conspires with the halo spin to guide the bar formation and ensuing evolution.
In this work, we did not consider feedback from the central black hole that was allowed to accrete the surrounding gas passively. In the Milky Way, the observed fluorescent X-ray emission from cold iron atoms in molecular clouds inside the CMZ is possibly due to X-ray irradiation from Sgr A*, suggesting potential importance of the AGN feedback on nuclear rings (e.g., Koyama et al. 1996; Su et al. 2010). Some barred galaxies host AGN at their centers, but the physical connection between a bar and AGN activities is not clear. Some observational studies suggest that the bar fraction in AGN-host galaxies is higher than in galaxies without AGN (e.g., Arsenault 1989; Laine et al. 2002; Galloway et al. 2015), while other studies do not find any specific correlations between them (e.g., Bang & Ann 2009; Lee et al. 2012b; Cheung et al. 2014). Recently, Robichaud et al. (2017) used numerical simulations to find that AGN feedback suppresses star formation in the vicinity of a black hole, while forming a dense ring in which star formation is enhanced. They found that such positive and negative effects are almost equal, making no overall quenching or enhancement of star formation in barred galaxies. We note that these results were based on models with a static (rather than live) halo and a not-well-resolved gas disk with particles. It is desirable to run self-consistent models with high resolution to accurately assess the effects of AGN feedback on star formation in barred galaxies.
References
- Aguerri et al. (2015) Aguerri J. A. L., Méndez-Abreu, J., Falcón-Barroso, et al. 2015, A&A, 576, A102
- Ann & Thakur (2005) Ann, H. B., & Thakur, P. 2005, ApJ, 620, 197
- Araki (1987) Araki, S. 1987, AJ, 94, 99
- Arsenault (1989) Arsenault, R., 1989, A&A, 217, 66
- Athanassoula (1992) Athanassoula, E. 1992, MNRAS, 259, 345
- Athanassoula (2014) Athanassoula, E. 2014, MNRAS, 438, L81
- Athanassoula et al. (2002) Athanassoula E., 2002, ApJ, 569, L83
- Athanassoula et al. (2003) Athanassoula, E. 2003, MNRAS, 341, 1179
- Athanassoula et al. (2013) Athanassoula, E., Machado, R. E. G., & Rodionov, S. A. 2013, MNRAS, 429, 1949
- Baba et al. (2013) Baba, J., Saitoh, T. R., & Wada, K. 2013, ApJ, 763, 46
- Bang & Ann (2009) Bang, J. & Ann., H. B. 2009, J. Korean Earth Sci. Soc., 30, 1
- Berentzen et al. (2007) Berentzen, I., Shlosman, I., & Martinez-Valpuesta, I. 2007, ApJ, 666, 189
- Binney & Tremaine (2007) Binney, J., & Tremaine, S. 2007, Galactic Dynamics, 2nd ed. (Princeton: Princeton Univ. Press)
- Bland-Hawthorn & Gerhard (2016) Bland-Hawthorn, J., & Gerhard, O. 2016, ARA&A, 54,529
- Bournaud et al. (2005) Bournaud, F., Combes, F., & Semelin, B. 2005, MNRAS, 364, L18
- Buta & Combes (1996) Buta, R., & Combes, F. 1996, Fund. Cosmic Phys., 17, 95
- Burbidge & Burbidge (1960) Burbidge, E. M., & Burbidge, G. R. 1960, ApJ, 132, 30
- Carles et al. (2016) Carles, C., Martel, H., Ellison, S. L., & Kawata, D. 2016, MNRAS, 463, 1074
- Cioffi et al. (1988) Cioffi, D. F., McKee, C. F., & Bertschinger, E. 1988, ApJ, 334, 252
- Cheung et al. (2014) Cheung E. et al. 2014, MNRAS, 447, 506
- Chevalier (1974) Chevalier, R. A. 1974, ApJ, 188, 501
- Collier et al. (2018) Collier, A., Shlosman, I., &, Heller, C. 2018, MNRAS, 476, 1331
- Combes et al. (1990) Combes, F., Debbasch, F., Friedli, D., & Pfenniger, D. 1990, A&A, 233, 82
- Combes & Sanders (1981) Combes, F., & Sanders, R. H. 1981, A&A, 96, 164
- Comerón et al. (2010) Comerón, S., Knapen, J. H., Beckman, J. E., Laurikainen, E., Salo, H., Martínez-Valpuesta, & Buta, R. J. 2010, MNRAS, 402, 2462
- Contopoulos & Grosbøl (1989) Contopoulos, G., & Grosbøl, P. 1989, A&A Rev., 1, 261
- Corsini (2008) Corsini E. M. 2008, in Bureau M., Athanassoula E., Barbuy B., eds, IAU Symp. Vol. 245, Formation and Evolution of Galaxy Bulges. (Kluwer: Dordrecht) p. 125
- Corsini (2011) Corsini E. M. 2011, Mem. Soc. Astron. Ital. Suppl., 18, 23
- Dahmen et al. (1998) Dahmen, G., Huttemeister, S., Wilson, T. L., & Mauersberger, R. 1998, A&A, 331, 959
- Dame et al. (2001) Dame, T. M., Hartmann, D., & Thaddeus, P. 2001, ApJ, 547, 792
- Debattista & Sellwood (2000) Debattista, V., Sellwood, J. A. 2000, ApJ, 543, 704
- D’Onghia et al. (2013) D’Onghia, E., Vogelsberger, M., & Hernquist, L. 2013, A&A, 766,34
- Englmaier & Gerhard (1997) Englmaier, P., & Gerhard, O. 1997, MNRAS, 287, 57
- Elmegreen et al. (2009) Elmegreen, B. G., Galliano, E. & Alloin, D. 2009, ApJ, 703, 1297
- Fanali et al. (2015) Fanali, R., Dotti, M., Fiacconi, D., & Haardt, F. 2015, MNRAS, 454, 3641
- Fathi et al. (2009) Fathi K., Beckman J. E., Piñol-Ferre N., et al. 2009, ApJ, 704, 1657
- Ferriére et al. (2007) Ferriére, K., Gillard, W., & Jean, P. 2007, A&A, 467, 611
- Fragkoudi et al. (2017) Fragkoudi, F., Di Matteo, P., Haywood, M. et al. 2017, A&A, 606, 47
- Katz et al. (2018) Katz, D., Antoja, T., Romero-Gómez, M. et al. 2018, A&A, 616, A11 (Gaia 2 SI)
- Gadotti et al. (2019) Gadotti, D. A., Sánchez-Blázquez, P., Falcón-Barroso, J. et al. 2019, MNRAS, 482, 506
- Galloway et al. (2015) Galloway M. A. et al. 2015, MNRAS, 448, 3442
- Gavazzi et al. (2015) Gavazzi, G. Consolandi, G., Dotti, M., et al. 2015, A&A, 580, A116
- Goldreich & Lynden-Bell (1965) Goldreich, P., & Lynden-Bell, D. 1965, MNRAS, 130, 125
- Goldreich & Tremaine (1979) Goldreich, P., & Tremaine, S. 1979, ApJ, 233, 857
- Guiglion et al. (2015) Guiglion, G., Recio-Blanco, A., de Laverny, P. et al. 2015, A&A, 583, A91
- Hohl (1971) Hohl, F. 1971, ApJ, 168, 343
- Hopkins et al. (2011) Hopkins, P. F., Quataert, E., & Murray, N. 2011, MNRAS, 417, 950
- Hopkins et al. (2014) Hopkins, P. F., Keres̆, D., Oñorbe, J. et al. 2014, MNRAS, 445, 581
- Hopkins et al. (2018) Hopkins, P. F., Wetzel, A., Keres̆, D. et al. 2018, MNRAS, in press; arXiv:1702.06148
- Hopkins (2015) Hopkins, P. F. 2015, MNRAS, 450, 53
- Hernquist (1990) Hernquist, L. 1990, ApJ, 356, 359
- Hsieh et al. (2011) Hsieh, P.-Y., Matsushita, S., Liu, G. Ho, P. T. P., Oi, N., & Wu, Y.-L. 2011, ApJ, 736, 129
- Immer et al. (2012) Immer, K., Schuller, F., Omont, A., & Menten, K. M. 2012, A&A, 537, A121
- Iannuzzi & Athanassoula (2015) Iannuzzi, F., & Athanassoula, E. 2015, MNRAS, 450, 2514
- Julian & Toomre (1966) Julian, W. H., & Toomre, A. 1966, ApJ, 146, 810
- Kalnajs (1972) Kalnajs, A. J. 1972, ApJ, 175, 63
- Katz et al. (1996) Katz, N., Weinberg, D. H., &,Hernquist, L., 1996, ApJS, 105, 19
- Knapen et al. (2006) Knapen, J. H., Mazzuca, L. M., Böker, T., Shlosman, I., Colina, L., Combes, F., & Axon, D. J. 2006, A&A, 448, 489
- Kim & Ostriker (2015) Kim, C.-G., & Ostriker, E. C. 2015, ApJ, 802, 99
- Kim & Ostriker (2001) Kim, W.-T., & Ostriker, E. C. 2001, ApJ, 559, 70
- Kim & Ostriker (2007) Kim, W.-T., & Ostriker, E. C. 2007, ApJ, 60, 1232
- Kim et al. (2012a) Kim, W.-T., Seo, W.-Y., & Kim, Y. 2012a, ApJ, 758, 14
- Kim et al. (2012b) Kim, W.-T., Seo, W.-Y., Stone, J. M., Yoon, D., & Teuben, P. J. 2012a, ApJ, 747, 60 (Paper I)
- Kim & Stone (2012) Kim, W.-T., & Stone, J. M. 2012, ApJ, 751, 124
- Kim & Kim (2014) Kim, Y., & Kim, W.-T. 2014, MNRAS, 440, 208
- Koepferl et al. (2015) Koepferl, C. M., Robitaille, T. P., Morales, E. F. E., & Johnston, K. G. 2015, ApJ, 799, 53
- Koyama et al. (1996) Koyama, K., Maeda, Y., Sonobe, T. et al. 1996, PASJ, 48, 249
- Kroupa (2001) Kroupa, P. 2001, MNRAS, 322, 231
- Kruijssen et al. (2014) Kruijssen, J. M. D., Longmore, S. N., Elmegreen, B. G., et al. 2014, MNRAS, 440, 3370
- Kruijssen et al. (2015) Kruijssen, J. M. D., Dale, J. E., & Longmore, S. N. 2015, MNRAS, 447, 1059
- Krumholz et al. (2016) Krumholz, M. R., Kruijssen, J. M. D., & Crocker, R. M. 2016, MNRAS, 466, 1213
- Fux (1999) Fux, R. 1999, A&A, 345, 787
- Kwak et al (2017) Kwak, S., Kim, W.-T., Rey, S.-C., & Kim, S. 2017, ApJ, 839, 24
- Laine et al. (2002) Laine, S., Shlosman, I., Knapen, J. H., & Peletier, R. F. 2002 ApJ, 567, 97
- Lee et al. (2012a) Lee, G.-H., Park, C., Lee, M. G., & Choi, Y.-Y. 2012a, ApJ, 745, 125
- Lee et al. (2012b) Lee, G.-H., Woo, J.-H., Lee, M. G., et al. 2012b, ApJ, 750, 141
- Lejeune & Schaerer (2001) Lejeune, T., & Schaerer, D. 2001, A&A, 366, 538
- Li et al. (2015) Li, Z., Shen, J., & Kim, W.-T. 2015, ApJ, 806, 150
- Li et al. (2017) Li, Z., Sellwood, J. A., & Shen, J., 2017, ApJ, 850, 67
- Longmore et al. (2013) Longmore, S. N., Bally, J., Testi, L., et al. 2013, MNRAS, 429, 987
- Maciejewski (2004) Maciejewski, W. 2004, MNRAS, 354, 892
- Maciejewski et al. (2002) Maciejewski, W., Teuben, P.J., Sparke, L. S., & Stone, J. M. 2002, MNRAS, 329, 502
- Mannucci et al. (2006) Mannucci, F., Della-Valle, M., & Panagia, N. 2006, MNRAS, 370, 773
- Manos & Machado (2014) Manos, T., & Machado, R. E. G. 2014, MNRAS, 438, 2201
- Martinez-Valpuesta et al. (2006) Martinez-Valpuesta, I., Shlosman, I., & Heller, C. 2006, ApJ, 637, 214
- Martini et al. (2003a) Martini, P., Regan, M. R., Mulchaey, J. S., & Pogge, R. W. 2003a, ApJS, 146, 353
- Martini et al. (2003a) Martini, P., Regan, M. R., Mulchaey, J. S., & Pogge, R. W. 2003b, ApJ, 589, 774
- Mazzuca et al. (2008) Mazzuca, L. M., Knapen, J. H., Veilleux, S., & Regan, M. W. 2008, ApJ, 174, 337
- Mazzuca et al. (2011) Mazzuca, L. M., Swaters, R. A., Knapen, J. H., & Veilleux, S. 2011, ApJ, 739, 104
- Merritt & Sellwood (1994) Merritt, D., & Sellwood, J. A. 1994, ApJ, 425, 551
- Miller et al. (1970) Miller, R. H., Prendergast, K. H., & Quirk, W. J. 1970, ApJ, 161, 903
- Minchev et al. (2012) Minchev, I., Famaey, B., Quillen, A. C., et al. 2012, A&A, 548, 126
- Morris & Serabyn (1996) Morris, M., & Serabyn, E. 1996, ARA&A, 34, 645
- Oh et al. (2008) Oh, S. H., Kim, W.-T., Lee, H. M., & Kim, J. 2008, ApJ, 683, 94
- Oh et al. (2015) Oh, S. H., Kim, W.,-T., & Lee, H. M. 2015, ApJ, 807, 73
- Papovich et al. (2016) Papovich, C., Labbé, I., Glazebrook, K. et al. 2016, NatAs, 1, 3
- Patsis & Athanassoula (2000) Patsis, P. A., & Athanassoula, E. 2000, A&A, 358, 45
- Pérez et al. (2012) Pérez, I., Aguerri, J. A. L., & Méndez-Abreu, J. 2012, A&A, 540, A103
- Pérez & Granger (2007) Pérez, F., & Granger, B. E. 2007, CSE, 9, 21
- Pettitt & Wadsley (2018) Pettitt, A. R. & Wadsley, J. W. 2018, MNRAS, 474, 5645
- Phillips (1996) Phillips, A. C. 1996, in ASP Conf. Ser. 91, Barred Galaxies, ed. R. Buta, D. A. Crocker, & B. G. Elmegreen (San Francisco: ASP), 44
- Polyachenko (2013) Polyachenko, E. V. 2013, Astronomy Letters, 39, 72
- Portail et al. (2017) Portail, W., Gerhard, O., Wegg, C., & Ness, M. 2017, MNRAS, 465, 1621
- Raha et al. (1991) Raha, N., Sellwood, J. A., James, R. A., & Kahn, F. D. 1991, Nature, 352, 411
- Regan & Teuben (2003) Regan, M. W., & Teuben, P. J. 2003, ApJ, 582, 723
- Regan & Teuben (2004) Regan, M. W., & Teuben, P. J. 2004, ApJ, 600, 595
- Renaud et al. (2013) Renaud, F., Bournaud, F., Emsellem, E., et al. 2013, MNRAS, 436, 1836
- Robichaud et al. (2017) Robichaud, F., Williamson, D., Martel, H., Kawata, D., & Ellison, S. L. 2017, MNRAS, 469, 3277
- Roca-Fàbrega et al. (2013) Roca-Fàbrega, S., Valenzuela, O., Figueras, F. et al. 2013, MNRAS, 432, 2878
- Saha & Elmegreen (2018) Saha, K. & Elmegreen, B. 2018, ApJ, 858, 24
- Sanders & Huntley (1976) Sanders, R. H., & Huntley, J. M. 1976, ApJ, 209, 53
- Sandstrom et al. (2010) Sandstrom, K., Krause, O., Linz, H., Schinnerer E. et al. 2010, A&A, 518, L59
- Sellwood (1980) Sellwood. J. A. 1980, A&A, 89, 296
- Sellwood & Wilkinson (1993) Sellwood, J. A., & Wilkinson, A. 1993, Rep. Prog. Phys., 56, 173
- Seo & Kim (2013) Seo, W.-Y., & Kim, W.-T. 2013, ApJ, 769, 100 (Paper I)
- Seo & Kim (2014) Seo, W.-Y., & Kim, W.-T. 2014, ApJ, 769, 100
- Sharma et al. (2014) Sharma, S., Bland-Hawthorn, J., Binney, J. et al. 2014, ApJ, 793, 51
- Sheth et al. (2000) Sheth, K., Regan, M. W., Vogel, S. N., & Teuben, P. J. 2000, ApJ, 532, 221
- Sheth et al. (2002) Sheth, K., Vogel, S. N., Regan, M. W., et al. 2002, AJ, 124, 2581
- Shin et al. (2017) Shin, J., Kim, S. S., Baba, J., et al. 2017, ApJ, 841, 74
- Shull (1980) Shull, J. M. 1980, ApJ, 237, 769
- Springel et al. (2005) Springel, V., Di Matteo, T., & Hernquist, L. 2005, MNRAS, 361, 776
- Su et al. (2010) Su, M., Slatyer, T. R., & Finkbeiner, D. P. 2010, ApJ, 724, 1044
- Toomre (1966) Toomre, A. 1966, In Geophysical Fluid Dynamics, notes on the 1966 Summer Study Program at Woods Hole Oceanographic Institute, ref. no. 66-46, 111
- Tsuboi & Ukita (1999) Tsuboi, M., Handa, T., & Ukita, N. 1999, ApJS, 120, 1
- Wegg et al. (2015) Wegg, C., Gerhard, O., & Portail, M., 2015, MNRAS, 450, 4050
- Yurin & Springel (2014) Yurin, D., & Springel, V. 2014, MNRAS, 444, 62
- Yusef-Zadeh et al. (2009) Yusef-Zadeh, F., Hewitt, J. W., Arendt, R. G., et al. 2009, ApJ, 702, 178
- Zurita & Pérez (2008) Zurita, A., & Pérez, I. 2008, A&A, 485, 5