High redshift massive quiescent Galaxies are as flat as star forming galaxies: the flattening of galaxies and the correlation with structural properties in CANDELS/3D-HST
Abstract
We investigate the median flattening of galaxies at in all five CANDELS/3D-HST fields via the apparent axis ratio . We separate the sample into bins of redshift, stellar-mass, sérsic index, size, and UVJ determined star-forming state to discover the most important drivers of the median (). Quiescent galaxies at and are rounder than those at lower masses, consistent with the hypothesis that they have grown significantly through dry merging. The massive quiescent galaxies at higher redshift become flatter, and are as flat as star forming massive galaxies at , consistent with formation through direct transformations or wet mergers. We find that in quiescent galaxies, correlations with and , and are driven by the evolution in the sérsic index (), consistent with the growing accumulation of minor mergers at lower redshift. Interestingly, does not drive these trends fully in star-forming galaxies. Instead, the strongest predictor of in star-forming galaxies is the effective radius, where larger galaxies are flatter. Our findings suggest that is tracing bulge-to-total () galaxy ratio which would explain why smaller/more massive star-forming galaxies are rounder than their extended/less massive analogues, although it is unclear why Sersic index correlates more weakly with flattening for star forming galaxies than for quiescent galaxies
Subject headings:
galaxies: evolution, galaxies: formation1. Introduction
Tracing the morphological evolution of galaxies from photometry is valuable in providing insights into the underlying kinematics of galaxy evolution when time-expensive, high S/N spectra are unavailable. Physical parameters have long been known to broadly couple to Hubble-type (e.g., Roberts & Haynes, 1994; Blanton et al., 2003), with young, star forming (SF) galaxies exhibiting some form of gas-rich disk or flattened structure and quiescent (Q) galaxies exhibiting older stellar populations in rounder, puffed up ellipticals (although passive disks do make up a small, but not insignificant population of passive galaxies; Bruce et al. 2014a, e.g.,).
In order to quantify the morphological evolution, various structural parameters have proven to be useful proxies for visual classification. In general, disk galaxies have been associated with a low () Sersic index surface brightness profile (or an exponential profile), and elliptical galaxies with a high () Sersic index light profile (de Vacouleurs profile). Along with a Sersic parameter, galaxies have also been quantified based on their effective radius, , and their apparent axis ratio, .
On a galaxy-by-galaxy basis, is not in itself a very useful parameter as it can depend strongly on inclination angle. However, distributions of have been used to infer the intrinsic axis ratios of populations of galaxies separated by their Hubble type (e.g., Sandage et al., 1970; Lambas et al., 1992) and by mass, star-forming state and redshift (e.g., Law et al., 2012; Chang et al., 2013; van der Wel et al., 2014b). For instance, in the local universe, Lambas et al. (1992) found that the elliptical -distribution implied that these galaxies are intrinsically triaxial as pure oblate/prolate models could not account for the observed axis ratio distributions.
van der Wel et al. (2014b) and Chang et al. (2013) used similar methodology to measure how the distributions evolve with redshift in star-forming and quiescent galaxies. Chang et al. (2013) confirmed that the apparent axis ratio distribution of quiescent galaxies at low- is consistent with intrinsic triaxial shapes, and that this is also true in their high-redshift () counterparts. They also found that at , galaxies with exhibited a higher oblate fraction which they interpreted as massive galaxies being comprised of disks in the past, which were destroyed in major-merger events. For lower-mass quiescent galaxies (), the evolution of the oblate fraction is reversed, with low-mass quiescent galaxies at high- not having sufficient time to settle into stable disk systems as compared to today.
In star-forming galaxies, van der Wel et al. (2014b) found that disks are ubiquitous among massive galaxies at all redshifts below . At lower stellar mass (), the fraction of galaxies with elongated intrinsic shapes increases towards higher redshifts and lower masses, and that similar to their low-mass quiescent counter parts discussed in Chang et al. (2013), these galaxies did not have sufficient time to settle into stable disks. This interpretation is supported by kinematic analysis in IFU studies, such as Simons et al. (2017) who find that disordered (i.e. dispersion dominated) motions decreases with decreasing redshift in low-mass star-forming galaxies.
In this study, we choose to investigate the median apparent axis-ratio () evolution instead of modelling the distributions and inferring their intrinsic shapes. We instead, infer the intrinsic flattening from the median flattening, with the underlying assumption that the trends in the median encapsulate trends in the larger population. We caveat this with the fact that many studies who investigated the apparent axis ratio distribution, , find that a single morphological type often does not reproduce the observed , and that the models demand a more heterogeneous population (e.g., Lambas et al., 1992; Chang et al., 2013; van der Wel et al., 2014b). By using the , we can quantify the dependency on other structural parameters such as , and and their evolution. We analyze how these values change as a function of the star-forming state of these galaxies and determine what is tracing in these different populations.
We note that the apparent average flattening of a population of galaxies is closely related to the average intrinsic flattening defined by the ratio of the short axis to the long axis of a galaxy (see, e.g. Franx et al., 1991). The ratio of intermediate axis to long axis influences the apparent flattening only weakly.
Throughout this article, we assume a -CDM cosmology (, , and ).
2. Sample Selection
This work makes use of the structural parameter catalogues of van der Wel et al. (2012) which were generated using GALFIT Peng et al. (2010). We use the parameters in the observed F160W band, which corresponds to the H-band. These authors constructed PSFs in a hybrid way: the outskirts of the PSFs are derived from stacked stars in the image; the area within a radius of 3 pixels is based on theoretical PSFs constructed by TinyTim Krist (1995) and processed in the same way as the raw science data. GALFIT is used to fit to each individual galaxy. Neighboring objects are masked out if they are substantially fainter than the main target, otherwise they are included in the fit (see van der Wel et al., 2012, for more details).
We also utilize the most recent () photometric catalogues on which they are based from the CANDELS/3D-HST survey (Brammer et al., 2012; Skelton et al., 2014; Momcheva et al., 2016). We use the stellar population parameters, and rest-frame colours based on the ‘zbest’ catalogues, which will use (if available) first a spectroscopic redshift, then a (good) grism redshift and lastly a photometric redshift if a spectroscopic and grism redshift were not available. Stellar masses were estimated from fits of stellar population models to the full photometric dataset (ranging from the UV to 4.5 m). We refer the reader to the aforementioned papers and their associated documentation for details. 111https://3dhst.research.yale.edu/Data.php
We perform a first pass selection using the 3DHST photometric flags (), as well as an magnitude cut of to ensure uncertainties in size and shape were within (as described in van der Wel et al. 2012). We use objects with a quality flag of in van der Wel et al. (2012) which means that GALFIT converged on a solution (without crashing) and that the solution did not require parameters to take on their ‘constraint’ values.
We also separate our sample into SF and Q galaxies based on their rest-frame and colours, where galaxies display a colour bi-modality and separate based on specific star formation rates (Labbé et al., 2005; Williams et al., 2009, 2010; Whitaker et al., 2011). We use the boundaries defined in Muzzin et al. (2013) to separate the Q and SF sequences.
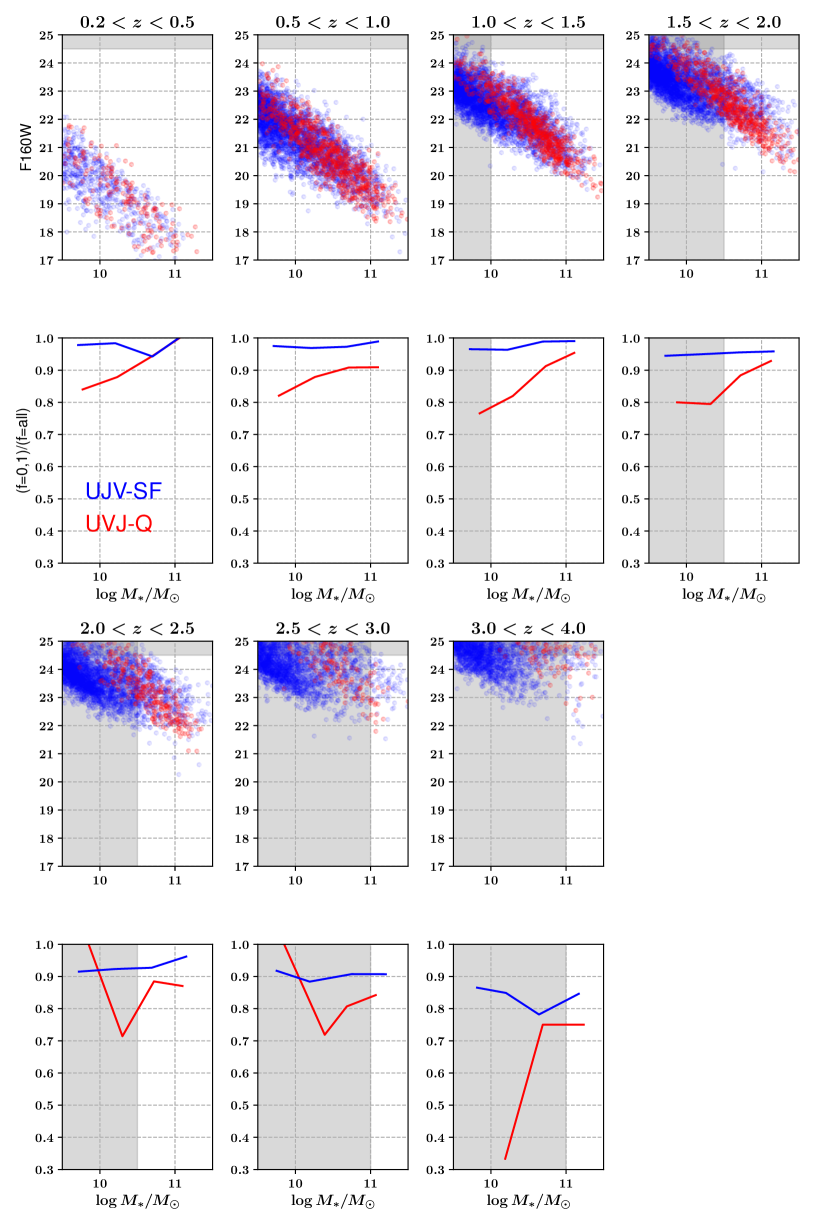
In Figure 1 we have plotted the AB magnitude, and the fraction of ‘good’ structural fits ( in van der Wel et al. (2012)) as a function of mass and redshift, as well as SF state to determine our mass completeness as a result of our magnitude limit and the effect of our decision to take only ‘good’ structural parameters. In the top panels we have indicated the mass completeness limit for each redshift (which ranges from ), to ensure sufficient signal-to-noise (S/N). In the bottom panels, we see the fraction of ‘good’ structural fits using our mass and magnitude selection is always greater in the SF galaxies, likely because of the difference in their rest-frame optical colours. This is particularly striking for quiescent galaxies at the highest redshift bin () at where we see the recovery of ‘good’ fits is . However, our mass cut from the top panels ensures we have recovered of the total galaxies in each redshift bin.
After applying all the aforementioned selection criteria to the complete 3DHST catalogue, we are left with 9301 galaxies. A census of these galaxies broken down into their respective redshift and UVJ-SF state can be found in Table 1.
| -range | ||
|---|---|---|
| 173 | 589 | |
| 781 | 3426 | |
| 643 | 1904 | |
| 357 | 614 | |
| 187 | 477 | |
| 16 | 78 | |
| 12 | 44 |
Note. — Above are the number of galaxies in each redshift range that are above our mass limits outlined in Fig. 1.
3. Analysis
3.1. Correcting for Systematics
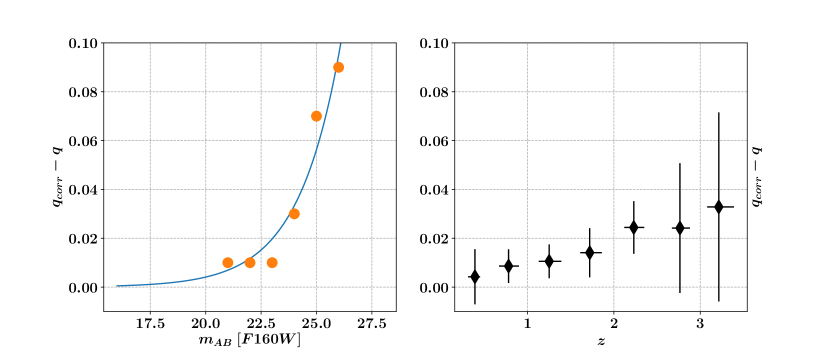
Since we are taking a median of , and we have already imposed a fairly conservative S/N cut, our random errors on the median are a fraction of a percent for most data points in this article. However, the systematics in can be significant at the faintest magnitudes. Since we wish to investigate the trends with flattening out to significant , rather than exclude these galaxies from our sample, we chose to correct for the systematics investigated by van der Wel et al. (2012).
In their article, van der Wel et al. (2012) used model light profiles convolved with the noise and PSF profiles of HST to estimate the effects of systematics. They repeated their surface brightness profile fitting on the simulated images and found that near the magnitude limits of their survey, the measured in the data were flatter than the model images. In their Table 3, they tabulated the average systematic as a function of magnitude, which we have plotted in Fig. 2. Notice that van der Wel et al. (2012) list “simulation output - model input” in their Table 3. Hence the correction values shown in Fig. 2 are the opposite of the listed values, as we show the term that is added to the observed data. In the left panel of Fig. 2, we fit an exponential function to the data, and made corrections to the values of in the catalog based on each object’s magnitude. Although we do not know the magnitude of the systematic for any individual object, our approach of medians means we can apply these corrections. In the right panel of Fig. 2 we have shown the median correction as a function of . As expected, the magnitude of the correction is larger at higher redshift, where the sample is dominated by objects at fainter magnitude limit (as seen in the upper panel of Fig. 1).
Unless otherwise specified, the values of presented in this paper are corrected for these systematic effects.
Another potential systematic can be caused by the shifting intrinsic bandpass as a function of wavelength. We tested the effect of bandpass on the axis ratio in two ways. First, we used the analysis of the GAMA survey Kelvin et al. (2012) . These authors derived the flattenings in bands ranging from the u band to the K band. We find that the difference in the median flattening is very small for this sample. When expressed as a function of log(wavelength), it is = 0.00 for quiescent galaxies and 0.05 for star forming galaxies. This is measured between the g band and the H band, representative for our sample. The effect on our results are negligible. In addition, we used the CANDELS photometry itself to estimate the effect, by comparing the flattening of the F125W and F160W bands. We find and 0.11 0.024 for quiescent and star forming galaxies. The effect for star forming galaxies somewhat higher than estimated from GAMA, but consistent at the 2.5 level. It suggests that the dependence of flattening on passband may depend on redshift. It would still lead to very small systematics. We tested whether this correction would affect our results; and we only found a small difference for flattening of the star forming galaxies as a function of redshift (Fig. 4), where the trend changes by about 0.02 per unit redshift. This is a very small trend which will be ignored in the rest of the analysis.
3.2. Trends with star-formation, , , and
To investigate trends in with other properties, we binned our galaxies into 7 different redshift bins (with ranges specified in Table 1 ), as well as 4 different stellar mass bins ( ), 3 bins of ( ), and 3 bins of ( ). We exclude galaxies with from our sample, as this is smaller than the HWHM of the PSF. The median are derived for the various bins, and the errors are determined from a bootstrap procedure. Bootstrap resamples are constructed and the medians are determined. The error bars shown in the figures are the rms deviations derived from the distribution of bootstrap medians.
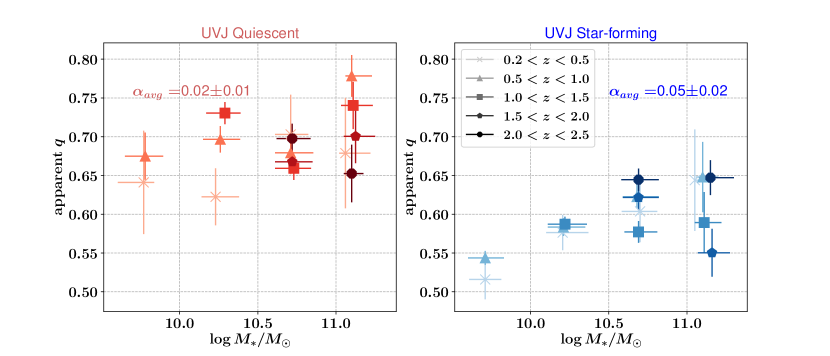
In Fig. 3 we have plotted as a function of and . In this figure, we only plot our results to because we are not complete in mass above this redshift (although we plot our highest mass bin, where we are complete in Fig. 4). Considering only the quiescent galaxies, we have calculated the average linear least squares slope () for every redshift bin, and find an , which is consistent with being independent of . On the other hand, star-forming galaxies at do display a broad mass dependence, () with lower mass galaxies appearing flatter than higher mass galaxies. Because we are mass-limited, whether or not this trend continues at is an open question which would require deeper survey depths to answer.
If we now consider the broad difference between quiescent and star-forming galaxies in Fig. 3, we see that the quiescent galaxies are generally rounder than their equivalent mass star-forming counterparts. The exception to this is in our redshift bin, where at , the axis ratios are indistinguishable. This could be indicative of similar morphology between the two populations at these redshifts.
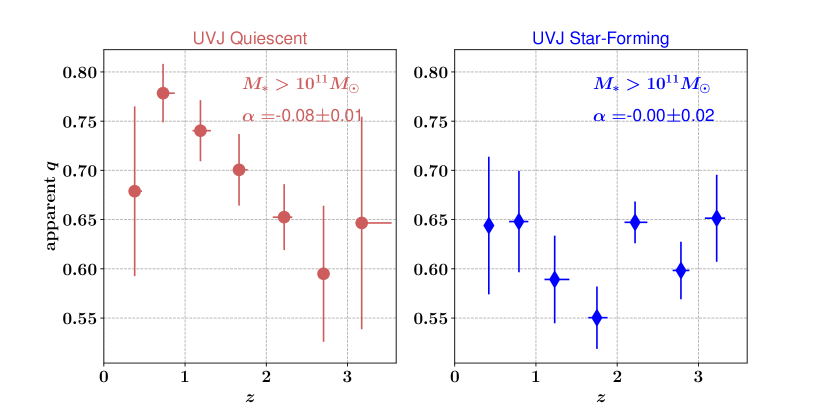
We investigate this similarity to higher redshifts by only considering galaxies in our highest mass bin where we have sufficient redshift coverage given our mass-complete limits. In Fig. 4, we have plotted the apparent axis ratio of galaxies in our highest mass bin as a function of redshift. We see quiescent galaxies are flatter at higher redshifts of equivalent mass, whereas the star-forming galaxies show little evolution in with redshift. As in Fig. 3, at , the quiescent galaxies are rounder than their star-forming counterparts. At , we see that there is no discernible difference in the between the star-forming and quiescent populations, suggesting that at this mass (as alluded to in Fig. 3) perhaps these galaxies have similar structure.
Given the known association between a galaxy’s mass and size (e.g., Shen et al., 2003; van der Wel et al., 2014a; Lange et al., 2015) and that the size of galaxies at an equivalent mass are observed to be smaller at larger redshifts (e.g., Daddi et al., 2005; Trujillo et al., 2006; Franx et al., 2008; van Dokkum et al., 2008; Straatman et al., 2015), it is also important to determine whether the trends observed in Fig. 3 are driven by the size evolution. As previously mentioned, we have binned our data according to and have plotted how this evolves with and in Fig. 5 and Fig. 6, respectively, but have omitted bins with fewer than 3 galaxies (as has been done for all medians in this article).
In Fig. 5, we see that the of star-forming galaxies depends more strongly on than their quiescent counterparts (with for quiescent and star-forming galaxies respectively), with large galaxies being flatter than smaller galaxies. At low-, quiescent galaxies become marginally rounder with increasing size, with this trend disappearing, or even reversing at .
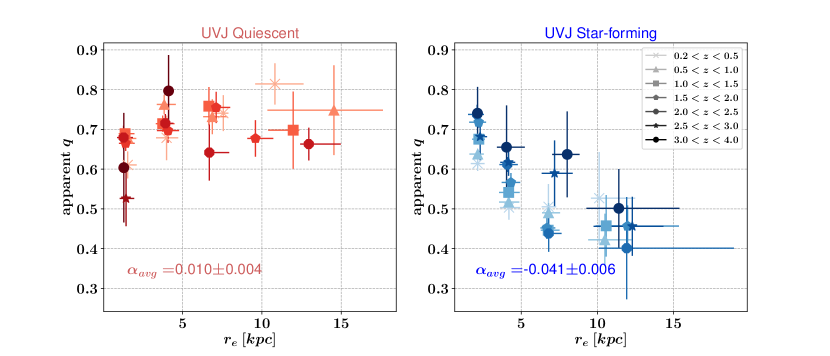
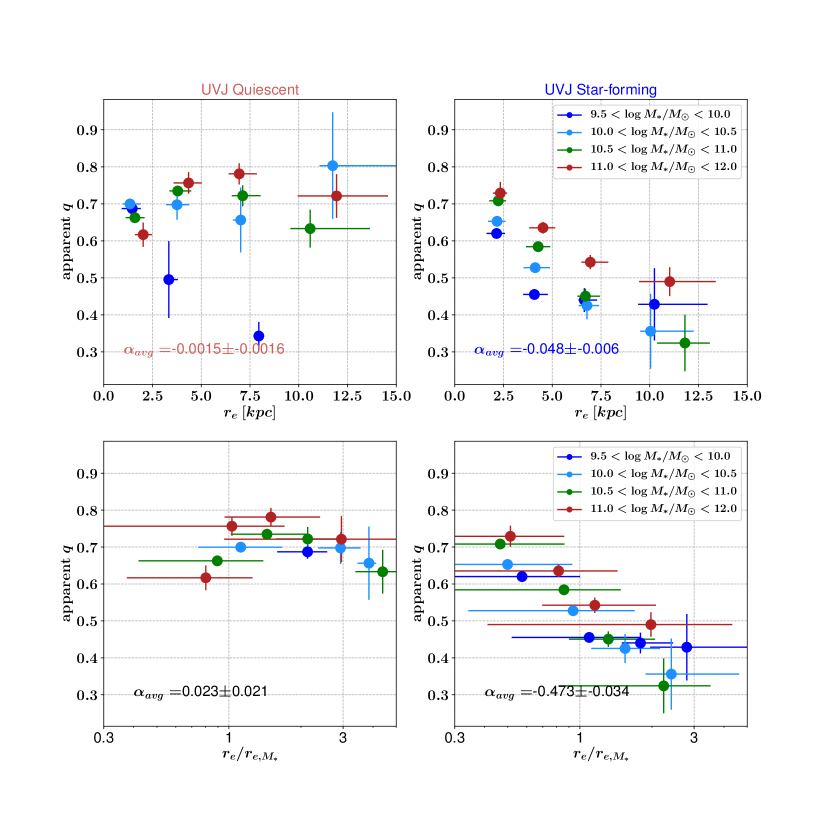
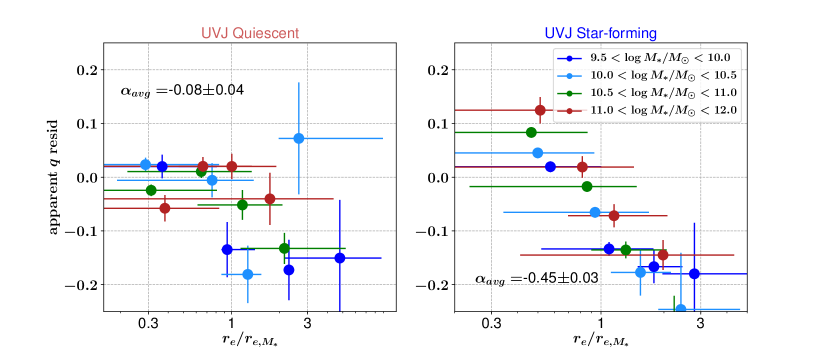
Fig 6 echoes the trends with seen in Fig. 5 (with star-forming galaxies showing steeper than quiescent galaxies), however there is a much stronger dependence on than with , with massive galaxies always rounder than less massive galaxies at fixed , with the exception of the smallest quiescent galaxies where the trend reverses. These trends are also what are expected if the B/T ratio increases with increasing and decreasing . In this figure, we also plot as a function of /, where is the expected size given the stellar mass from the mass-size relations of van der Wel et al. (2014a). This can be thought of as a deviation from the mass-size relation. When plotting this fraction instead of the , we see the mass dependence largely disappears in both quiescent and star-forming galaxies. In quiescent galaxies we see a relatively flat relationship. For star-forming galaxies, galaxies that lie below the mass-size relation are rounder than those that lie above it.
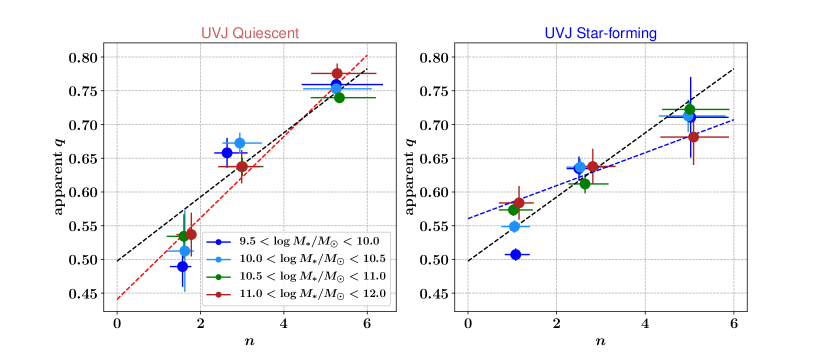
In Fig. 7, we investigate the dependencies of on and . In this Figure, the galaxies have been binned by . We observe a strong positive correlation between and in both quiescent and star forming galaxies, with no significant dependence. Because there is no significant dependence, we have plotted trend lines in Fig. 7 based on the median of all galaxies, as well as only the quiescent/star-forming in their respective bin. These lines show that the dependence is steeper for quiescent galaxies. This is the most significant trend observed out of the structural parameters investigated.
3.3. Is driving trends with ?
Because of the tight relationship between and , we re-investigate the observed trends with to test the extent to which these trends can be explained by trends in . To this end, we re-calculate using their measured values of as well as the relationships for star-forming and quiescent galaxies in Fig. 7, . We then take the residual between and and and plot that against , and .
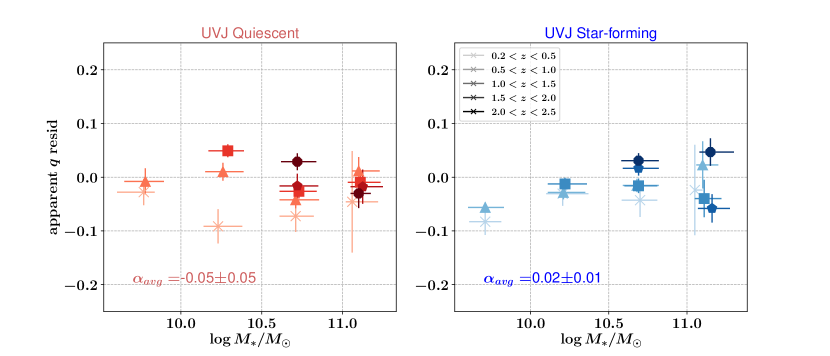
Fig. 8 shows the residuals of the values in Fig. 3. In this figure, we see for most data points that the residuals are of the original values, and can account for most of the observed . For star-forming galaxies, although there is structure in the residuals, can also account for the trends, especially at the lowest redshifts.
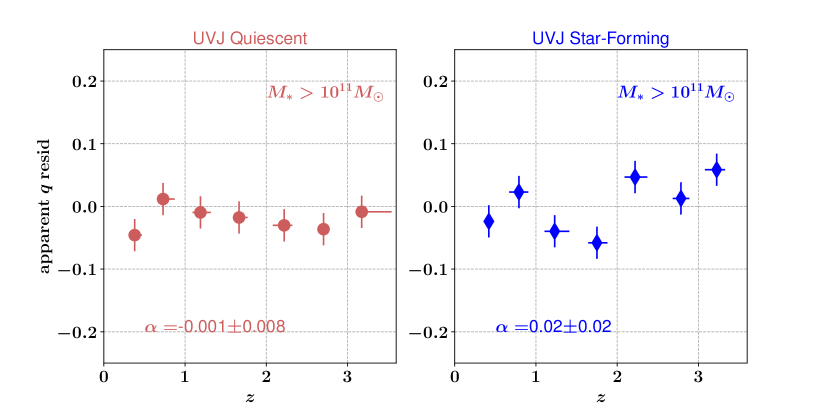
In Fig. 9, we show the residuals of the relationship of our massive galaxy subsample () with . In massive galaxies, we see that can be fully accounted for by , and the trend of massive galaxies becoming rounder at lower redshift is also gone, with this relationship accounted for by an evolution in the median . We see the flat relationship with star-forming galaxies is also maintained. Therefore, we conclude that the evolution in can account for any evolution in massive galaxies.
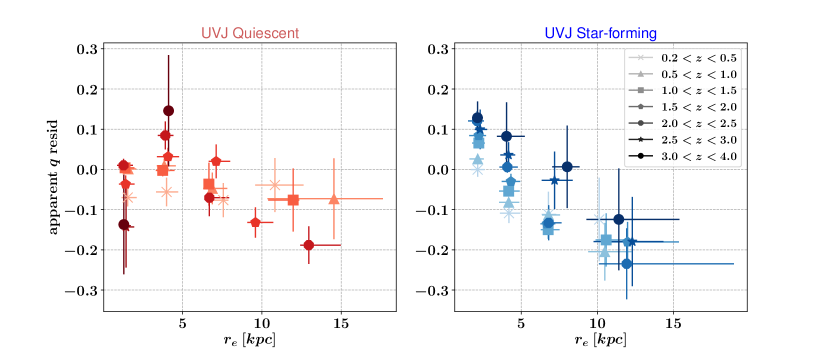
Although can convincingly account for most of the observed , as well as trends with and , it is insufficient to explain the trends in for star-forming galaxies. Fig. 10 and Fig. 11 are the residuals plots of Fig. 5 and Fig. 6, respectively. For the quiescent galaxies in Fig. 6, we do see that the previously seen mass dependence of at fixed radius is gone (again with the exception of galaxies at the smallest radius). However, the mass dependence for star-forming galaxies persists, as well as the overall trend with .
4. Discussion and Conclusions
In the previous sections, we investigated the dependence of the observed with various structural parameters. At all masses below , the median quiescent galaxy is rounder than their star-forming counterpart (Fig 3). For quiescent galaxies, when binned by there was no discernible trend with mass, whereas star-forming galaxies do show a significant mass dependence at low-redshift (). At the highest masses (), quiescent galaxies are increasingly flat at higher , until they match the apparent of star-forming galaxies at . This suggests that at the highest redshifts, massive quiescent galaxies are structurally similar to their star-forming counterparts, and that high- quiescent galaxies could be disk-like, a notion that has been posited previously (e.g., van der Wel et al., 2011; Wuyts et al., 2011; Bruce et al., 2012; Buitrago et al., 2013; Chang et al., 2013; Newman et al., 2015; Hill et al., 2017)
This result is also consistent with studies of nearby relic galaxies, which are thought to be “unprocessed” descendants of high redshift quiescent galaxies (e.g. van den Bosch et al., 2012; Trujillo et al., 2014; Yıldırım et al., 2017; Ferré-Mateu et al., 2017).
The observed trend of massive galaxies flattening at higher redshift (Fig. 4) can be explained entirely by the dependence of on . This conclusion was drawn through an analysis of the residuals after subtracting the effect of from . To obtain this correction, we binned our sample according to and and found to correlate strongly with with no apparent stellar-mass dependence (Fig. 7). By using the linear relationship surmised in Fig. 7, we calculated what would be given the modelled from the catalog of van der Wel et al. (2012), and plotted the residuals. The residuals for with in massive galaxies were consistent with 0 (Fig. 9), with the conclusion that the evolution in drives the evolution in .
The -residuals were also plotted for the other masses, and the residuals were insignificant for the quiescent galaxies. These results are consistent with a simple picture in which quiescent galaxies grow with time due to minor mergers (e.g., (van Dokkum et al., 2010)) which would make them appear rounder and increase the Sersic index. More detailed comparisons with simulations are required to test this explanation in detail.
It is remarkable that the star-forming galaxies show different trends than the quiescent galaxies. This is likely related to the fact that the star-forming galaxies grow through very different mechanisms (e.g., growth through the accretion of gas and subsequent star formation in a disk).
We do not find a strong trend of flattening with redshift (e.g., Fig 4); on the other hand, the flattening correlates significantly with mass, and very strongly with effective radius; and with Sersic index. If we “take out” the correlation with Sersic index, we still see a correlation of residual flattening with effective radius, in contrast to the quiescent galaxies.
The most remarkable of these correlations for star-forming galaxies is the correlation with : when binning galaxies based on their , for star-forming galaxies we observed a negative relationship between and , with larger galaxies exhibiting stronger flattening than smaller star forming galaxies, regardless of (Fig. 5). This trend persists when comparing star-forming galaxies at fixed in different mass bins (Fig. 6). At fixed , massive galaxies are always rounder than lower mass galaxies, regardless of star-forming state (with the exception of the smallest quiescent galaxies which requires further investigation). This mass dependence disappears when considering as a function from the deviation of the relevant mass-size relation (Fig. 6).
To first order, the results are interpreted by assuming that is tracing the bulge-to-total galaxy ratio () in star-forming galaxies. It has been shown previously that broadly traces in massive galaxies (e.g., Bruce et al., 2014b; Kennedy et al., 2016); this combined with the our observation that is also correlated with makes a consistent picture.
It is not entirely clear, however, why size plays such a dominant role: the flattening varies by a factor of about 2 as a function of size normalized to the mass size relation - stronger than the variation with Sersic index. In addition, when the dependence on Sersic index is taken out, there remains a correlation with size.
Possibly, these effects are simply due to the fact that the light distribution of star forming galaxies is very sensitive to dust, orientation, and young, unobscured star formation. Hence simple trends as for quiescent galaxies become complex - take for example the case of disk galaxies for which the disks almost “disappear” due to dust when viewed edge-on (e.g., Patel et al., 2012). In short, models are needed to interpret these results and derive the full interpretation.
5. Summary
We have taken the catalogues of van der Wel et al. (2012) and studied the evolution of the median apparent axis ratio () for over 9000 galaxies out to with , , and . We find :
-
1.
Quiescent galaxies are rounder than their star-forming counterparts at all masses below . Above , the median flattening between massive quiescent and star-forming galaxies is identical, suggesting they had very similar structure in the early universe (Fig. 4). This is an extension in redshift of previous work (Chang et al., 2013) who found an increased incidence of disk-like structure in massive quiescent galaxies at .
-
2.
The flattening in quiescent galaxies is mass independent, whereas in star-forming galaxies, there is a steep positive correlation with stellar mass at least until (Figs. 3,4); due to our mass limits, whether this trend continues to higher is an open question.
-
3.
In star-forming galaxies, correlates significantly with , in contrast to quiescent galaxies where there is no discernable trend (Fig. 5).
-
4.
In quiescent galaxies, the strongest common correlation was between and (Fig. 7). For most relationships, there is very little residual correlation between and (the expected calculated from the sérsic index), however this was not the case in star-forming galaxies (Fig. 8).
-
5.
We suspect that is likely tracing the ratio which would explain why smaller/more massive star-forming galaxies are rounder than their extended/less massive counterparts, as well as why we do not observe strong and dependencies in quiescent galaxies, as the majority of the quiescent galaxies are not expected to have prominent disks. We caveat that we are also only tracing the light, which would weight blue disks with lower mass-to-light ratios heavily in the observables, and that the mass distribution could be quite different.
6. Acknowledgements
We thank the referee for the constructive comments which helped to improve the paper. This research has made use of NASA’s Astrophysics Data System. This work is based on observations taken by the 3D-HST Treasury Program (GO 12177 and 12328) with the NASA/ESA HST, which is operated by the Association of Universities for Research in Astronomy, Inc., under NASA contract NAS5-26555. We used the public available programming language PYTHON, including the NUMPY, MATPLOTLIB packages.
References
- Blanton et al. (2003) Blanton, M. R., Hogg, D. W., Bahcall, N. A., et al. 2003, ApJ, 594, 186
- Brammer et al. (2012) Brammer, G. B., van Dokkum, P. G., Franx, M., et al. 2012, ApJS, 200, 13
- Bruce et al. (2012) Bruce, V. A., Dunlop, J. S., Cirasuolo, M., et al. 2012, MNRAS, 427, 1666
- Bruce et al. (2014a) Bruce, V. A., Dunlop, J. S., McLure, R. J., et al. 2014a, MNRAS, 444, 1001
- Bruce et al. (2014b) —. 2014b, MNRAS, 444, 1660
- Buitrago et al. (2013) Buitrago, F., Trujillo, I., Conselice, C. J., & Haussler, B. 2013, MNRAS, 428, 1460
- Chang et al. (2013) Chang, Y.-Y., van der Wel, A., Rix, H.-W., et al. 2013, ApJ, 773, 149
- Daddi et al. (2005) Daddi, E., Renzini, A., Pirzkal, N., et al. 2005, ApJ, 626, 680
- Ferré-Mateu et al. (2017) Ferré-Mateu, A., Trujillo, I., Martín-Navarro, I., et al. 2017, MNRAS, 467, 1929
- Franx et al. (1991) Franx, M., Illingworth, G., & de Zeeuw, T. 1991, ApJ, 383, 112
- Franx et al. (2008) Franx, M., van Dokkum, P. G., Förster Schreiber, N. M., et al. 2008, ApJ, 688, 770
- Hill et al. (2017) Hill, A. R., Muzzin, A., Franx, M., et al. 2017, ApJ, 837, 147
- Kelvin et al. (2012) Kelvin, L. S., Driver, S. P., Robotham, A. S. G., et al. 2012, MNRAS, 421, 1007
- Kennedy et al. (2016) Kennedy, R., Bamford, S. P., Häußler, B., et al. 2016, MNRAS, 460, 3458
- Krist (1995) Krist, J. 1995, in Astronomical Society of the Pacific Conference Series, Vol. 77, Astronomical Data Analysis Software and Systems IV, ed. R. A. Shaw, H. E. Payne, & J. J. E. Hayes, 349
- Labbé et al. (2005) Labbé, I., Huang, J., Franx, M., et al. 2005, ApJ, 624, L81
- Lambas et al. (1992) Lambas, D. G., Maddox, S. J., & Loveday, J. 1992, MNRAS, 258, 404
- Lange et al. (2015) Lange, R., Driver, S. P., Robotham, A. S. G., et al. 2015, MNRAS, 447, 2603
- Law et al. (2012) Law, D. R., Steidel, C. C., Shapley, A. E., et al. 2012, ApJ, 745, 85
- Momcheva et al. (2016) Momcheva, I. G., Brammer, G. B., van Dokkum, P. G., et al. 2016, ApJS, 225, 27
- Muzzin et al. (2013) Muzzin, A., Marchesini, D., Stefanon, M., et al. 2013, ApJ, 777, 18
- Newman et al. (2015) Newman, A. B., Belli, S., & Ellis, R. S. 2015, ApJ, 813, L7
- Patel et al. (2012) Patel, S. G., Holden, B. P., Kelson, D. D., et al. 2012, ApJ, 748, L27
- Peng et al. (2010) Peng, C. Y., Ho, L. C., Impey, C. D., & Rix, H.-W. 2010, AJ, 139, 2097
- Roberts & Haynes (1994) Roberts, M. S., & Haynes, M. P. 1994, ARA&A, 32, 115
- Sandage et al. (1970) Sandage, A., Freeman, K. C., & Stokes, N. R. 1970, ApJ, 160, 831
- Shen et al. (2003) Shen, S., Mo, H. J., White, S. D. M., et al. 2003, MNRAS, 343, 978
- Simons et al. (2017) Simons, R. C., Kassin, S. A., Weiner, B. J., et al. 2017, ApJ, 843, 46
- Skelton et al. (2014) Skelton, R. E., Whitaker, K. E., Momcheva, I. G., et al. 2014, ApJS, 214, 24
- Straatman et al. (2015) Straatman, C. M. S., Labbé, I., Spitler, L. R., et al. 2015, ApJ, 808, L29
- Trujillo et al. (2014) Trujillo, I., Ferré-Mateu, A., Balcells, M., Vazdekis, A., & Sánchez-Blázquez, P. 2014, ApJ, 780, L20
- Trujillo et al. (2006) Trujillo, I., Förster Schreiber, N. M., Rudnick, G., et al. 2006, ApJ, 650, 18
- van den Bosch et al. (2012) van den Bosch, R. C. E., Gebhardt, K., Gültekin, K., et al. 2012, Nature, 491, 729
- van der Wel et al. (2011) van der Wel, A., Rix, H.-W., Wuyts, S., et al. 2011, ApJ, 730, 38
- van der Wel et al. (2012) van der Wel, A., Bell, E. F., Häussler, B., et al. 2012, ApJS, 203, 24
- van der Wel et al. (2014a) van der Wel, A., Franx, M., van Dokkum, P. G., et al. 2014a, ApJ, 788, 28
- van der Wel et al. (2014b) van der Wel, A., Chang, Y.-Y., Bell, E. F., et al. 2014b, ApJ, 792, L6
- van Dokkum et al. (2008) van Dokkum, P. G., Franx, M., Kriek, M., et al. 2008, ApJ, 677, L5
- van Dokkum et al. (2010) van Dokkum, P. G., Whitaker, K. E., Brammer, G., et al. 2010, ApJ, 709, 1018
- Whitaker et al. (2011) Whitaker, K. E., Labbé, I., van Dokkum, P. G., et al. 2011, ApJ, 735, 86
- Williams et al. (2009) Williams, R. J., Quadri, R. F., Franx, M., van Dokkum, P., & Labbé, I. 2009, ApJ, 691, 1879
- Williams et al. (2010) Williams, R. J., Quadri, R. F., Franx, M., et al. 2010, ApJ, 713, 738
- Wuyts et al. (2011) Wuyts, S., Förster Schreiber, N. M., van der Wel, A., et al. 2011, ApJ, 742, 96
- Yıldırım et al. (2017) Yıldırım, A., van den Bosch, R. C. E., van de Ven, G., et al. 2017, MNRAS, 468, 4216