Star-disc (mis-)alignment in Rho Oph and Upper Sco: insights from spatially resolved disc systems with K2 rotation periods
Abstract
The discovery of close in, giant planets (hot Jupiters) with orbital angular momentum vectors misaligned with respect to the rotation axis of their host stars presents problems for planet formation theories in which planets form in discs with angular momentum vectors aligned with that of the star. Violent, high eccentricity migration mechanisms purported to elevate planetary orbits above the natal disc plane predict populations of proto-hot Jupiters which have not been observed with Kepler. Alternative theories invoking primordial star-disc misalignments have recently received more attention. Here, the relative alignment between stars and their protoplanetary discs is assessed for the first time for a sample of 20 pre-main-sequence stars. Recently published rotation periods derived from high quality, long duration, high cadence K2 light curves for members of the Ophiuchus and Upper Scorpius star forming regions are matched with high angular resolution observations of spatially resolved discs and projected rotational velocities to determine stellar rotation axis inclination angles which are then compared to the disc inclinations. Ten of the fifteen systems for which the stellar inclination could be estimated are consistent with star-disc alignment while five systems indicate potential misalignments between the star and its disc. The potential for chance misalignment of aligned systems due to projection effects and characteristic measurement uncertainties is also investigated. While the observed frequency of apparent star-disc misalignments could be reproduced by a simulated test population in which of systems are truly aligned, the distribution of the scale of inferred misalignment angles could not.
keywords:
protoplanetary discs – stars: formation – stars: rotation – stars: variables: T Tauri1 Introduction
The traditional Kant-Laplace nebular hypothesis of star and planet formation - based on the close alignment of the solar rotation axis to the planetary orbital axes in the solar system (; Beck & Giles 2005) - predicts that protoplanetary discs form perpendicular to the rotation axis of their natal collapsing cores. Without additional perturbations, the planets that form in such a disc then have orbital angular momentum vectors aligned with the stellar rotation axis. In stark contrast, observations of the Rossiter-McLaughlin effect among transiting exoplanets have uncovered planet orbital axis–stellar rotation axis misalignments: nearly per cent of close-in, giant planets (hot Jupiters) display orbital obliquities of up to, and including, (i.e. anti-alignment; Wright et al. 2011; Campante et al. 2016).
Hot Jupiters are unlikely to have formed in situ (Rafikov, 2006). Instead, they are understood to have migrated inward from their initial formation location. Kozai oscillations induced by planet-planet interactions (Naoz et al., 2011), star-planet interactions (Fabrycky & Tremaine, 2007), or planet-planet scattering (Rasio & Ford, 1996) are widely considered to explain the short period, high obliquity orbits observed. Tidal orbital circularisation and stellar spin-axis reorientation (Winn et al., 2010; Albrecht et al., 2012) are additionally invoked to explain why a greater fraction of hot Jupiters are not observed on more oblique orbits. However, high eccentricity migration mechanisms predict a population of proto-hot Jupiters on highly eccentric orbits (Socrates et al., 2012) which have not been observed by Kepler (Dawson et al., 2015).
Alternative, smoother migration mechanisms have also been proposed to explain the existence of high-obliquity hot Jupiters (Goldreich & Tremaine, 1980; Ida & Lin, 2008; Bromley & Kenyon, 2011). In turn, these require primordial star-disc misalignments, potentially caused by gravitational perturbations from stellar companions on binary orbits inclined with respect to the circum-primary disc plane (Batygin, 2012; Spalding & Batygin, 2015); interactions between the stellar magnetic field and the inner disc regions (e.g. Foucart & Lai, 2011; Lai et al., 2011); or turbulence in the natal molecular cloud during gravitational collapse (e.g. Bate et al. 2010; Fielding et al. 2015). Observational investigations into the presence of star-disc misalignments have so far been limited to debris disc systems in which the host is a main sequence (MS) star. This is primarily due to their relatively close proximity to Earth compared to protoplanetary disc systems meaning that (i) the discs have been easier to spatially resolve and (ii) for two of the closest debris disc hosts, direct estimates of the stellar rotation axis geometry have been made possible using long baseline optical interferometry (e.g. Le Bouquin et al. 2009; Monnier et al. 2012). Both these systems favour star-disc alignment.
Statistical assessment of the likelihood of star-disc misalignment in debris disc systems has relied upon more indirect determinations of the stellar inclination, (Watson et al., 2011; Greaves et al., 2014). In these studies, is estimated by combining measurements of the rotation period, , projected rotational velocity, , and stellar radius, , following Campbell & Garrison (1985):
| (1) |
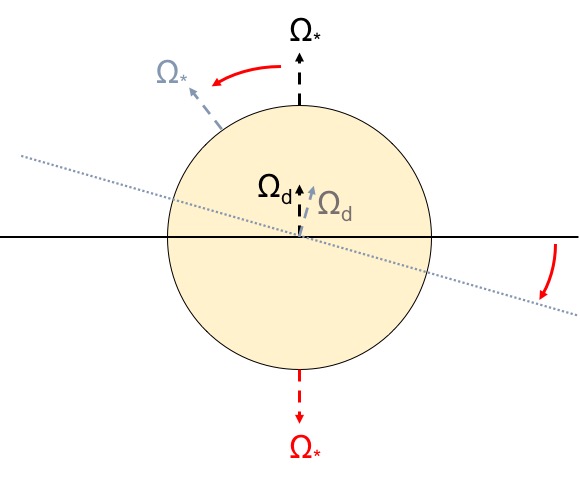
The lack of evidence found for star-disc misalignment in the Watson et al. (2011) and Greaves et al. (2014) studies has been used to suggest that the occurrence rate of primordial star-disc misalignments is low. However, as noted in Greaves et al. (2014), these studies do not probe the full three dimensional aspect of star-disc alignment (see Fig. 1) and so misaligned systems may be hidden amongst their samples. Furthermore, this interpretation assumes, for example, that (i) the debris disc traces the same plane as the original protoplanetary disc, (ii) the star-disc obliquity does not alter during pre-main-sequence (PMS) evolution (c.f. Rogers et al. 2012), and/or that (iii) debris discs form and survive as frequently in misaligned star-disc systems as in aligned systems. Here, the focus of star-disc misalignment is turned to PMS stars.
2 Sample selection
| ID | Alt. ID | SpT | P.A. | Dist. | Refs. | Note | ||||
| (days) | (km) | (∘) | (∘) | (pc) | (mag) | |||||
| (1) | (2) | (3) | (4) | (5) | (6) | (7) | (8) | (9) | (10) | (11) |
| Oph | ||||||||||
| 1 | ISO-Oph 51 | 1.8 | M | 1, 1, 1 | B | 3.2 | ||||
| 2 | WSB 63 | 12.2 | M | 3, 2, 1 | TD | 1.6 | ||||
| 3 | DoAr 24E | 5.9 | G | 2, 2, 1 | B | 3.2 | ||||
| 4 | Elias 2-24 | 6.6 | K | 2, 2, 6 | – | 3.5 | ||||
| 5 | GY 314 | 6.2 | K | 2, 2, 1 | PTD | 2.5 | ||||
| 6 | DoAr 25 | 8.9 | K | 3, 2, 1 | TD | 1.0 | ||||
| 7 | SR 21A | 2.0 | G | 3, 3, 2 | TD;B | 2.7 | ||||
| Upper Sco | ||||||||||
| 8 | USco J160900.0-190836 | 1.8 | M | 4, 6, 3 | TD;B | 0.2 | ||||
| 9 | CD-22 11432 | 2.8 | K | – | 4, 7, 3 | B | – | |||
| 10 | V935 Sco | 5.0 | K | – | 3, 5, 1 | CB | – | |||
| 11 | RX J1603.9-2031A | 3.9 | K | 4, 4, 3 | TD;B | 0.5 | ||||
| 12 | USco J160357.9-194210 | 3.8 | M | 4, 8, 3 | PTD | 0.2 | ||||
| 13 | USco J160643.8-190805 | 7.0 | K | – | 4, 8, 3 | B | – | |||
| 14 | USco J160823.2-193001 | 5.4 | K | 4, 8, 3 | PTD;B | 0.5 | ||||
| 15 | USco J160900.7-190852 | 10.0 | K | 4, 8, 3 | PTD;B | 0.2 | ||||
| 16 | USco J160959.4-180009 | 3.7 | M | 4, 6, 3 | TD | 0.2 | ||||
| 17 | RX J1614.3-1906 | 4.8 | K | 4, 6, 3 | TD | 2.0 | ||||
| 18 | USco J155624.8-222555 | 2.0 | M | 4, 6, 3 | TD | 0.1 | ||||
| 19 | RX J1604.3-2130A | 5.0 | K | 4, 4, 4 | PTD;B | 1.0 | ||||
| 20 | HIP 79977 | 1.7 | F | 5, 9, 5 | DD | 0.1 | ||||
While limited to just one dimension of a three dimensional problem, comparing star and disc inclinations is still a useful tool to probe star-disc misalignment. The sample considered here is based on matching recently published rotation periods for members of Ophiuchus and Upper Scorpius ( Oph and Upper Sco; Rebull et al. 2016a), obtained during NASA’s K2 mission (Howell et al., 2014), to previously published spatially resolved disc detections and determinations. Only K2 rotation periods are used as the high quality, long-duration, high cadence light curves (LCs) enable stellar rotation signatures to be identified among other sources of temporal variability exhibited by PMS stars. The uninterrupted coverage afforded by space-based observations also avoids the day beat period affecting ground-based period determinations (Davies et al., 2014). Space-based rotation periods have also been determined for members of the star forming region NGC 2264 with CoRoT (Affer et al., 2013) but this region is not considered here as, at pc, it is too distant for the discs of its members to be spatially resolved by current interferometric facilities.
| ID | Companion ID | Sep. | P.A. | Refs | Note | ||||
|---|---|---|---|---|---|---|---|---|---|
| (”) | (∘) | (mag) | (mas) | (mas/yr) | (mas/yr) | ||||
| (1) | (2) | (3) | (4) | (5) | (6) | (7) | (8) | (9) | (10) |
| 10 | – | 10 | – | ||||||
| 9 | – | 8 | P | ||||||
| 13 | – | 9 | P | ||||||
| 3 | – | 1, 3 | P | ||||||
| – | – | – | – | – | – | S | |||
| 7 | – | 2, 5 | P | ||||||
| – | EM* SR 21S | – | – | – | – | S | |||
| 1 | – | 6 | P | ||||||
| – | 2MASS J16263713-2415599 | – | – | – | – | S | |||
| 14 | – | 7 | S | ||||||
| – | USco J160822.4-193004 | – | – | – | – | P | |||
| 15 | – | 7 | P | ||||||
| 8 | USco J160900.0-190836 | – | – | – | – | S | |||
| 19 | – | 4, 7 | P | ||||||
| – | RX J1604.3-2130B | – | – | – | – | S |
From the initial Rebull et al. (2018) sample, only stars with an infrared excess (IRex) and a single rotation period measurement were retained. The latter selection criteria avoided including stars exhibiting differential rotation (Rebull et al., 2016b). Further requiring that stars were identifiable within SIMBAD for cross-matching purposes provided a starting sample of . The literature was searched for spatially resolved disc detections with star-disc systems retained at this stage111EPIC 203969721 was not retained as it was unclear which component of this multiple system the rotation period belonged to and whether the same component hosts the disc resolved by Cox et al. (2017).. A further literature search for measurements resulted in a sample of systems (see Table 1).
Measuring is not without its difficulties. Acquiring high resolution spectra with a good signal-to-noise ratio (SNR) across photospheric lines is essential. Lines sensitive to other broadening mechanisms (thermal, pressure, and Zeeman broadening, for instance) must ideally be avoided while instrumental broadening should be accounted for in the models of zero rotation. The measurements collated here have been determined via different procedures involving the comparison of optical (Chen et al., 2011; Dahm et al., 2012; Kohn et al., 2016) and near-infrared (Doppmann et al., 2003; Doppmann et al., 2005) spectra to artificially rotationally-broadened spectral templates (Doppmann et al., 2003; Doppmann et al., 2005; Chen et al., 2011; Kohn et al., 2016) or slowly rotating “standard” MS stellar spectra (Dahm et al., 2012). In the latter case, it is assumed that the pressure broadening induced by the lower surface gravities of PMS stars compared to their MS counterparts is minimal.
The Doppmann et al. (2005), Dahm et al. (2012), and Kohn et al. (2016) studies explicitly restrict their analysis to lines unaffected by Zeeman broadening. Chen et al. (2011) do not make explicit mention of whether the effects of Zeeman broadening are taken into account in their analysis. However, measurements are only sourced from this latter study for the debris disc-hosting star, HIP 79977. The location of this object in the Hertzsprung-Russell diagram suggests that the large-scale magnetic field is likely to be low (Gregory et al., 2012). As such, Zeeman broadening effects are expected to be minimal.
The measurements for DoAr 24E, Elias 2-24, and GY 314, retrieved from Doppmann et al. (2003), were made using spectral lines in the Na interval. Doppmann et al. (2003) note these lines may be susceptible to Zeeman broadening effects: large-scale magnetic field strengths of kG – typical for disk-hosting PMS stars (e.g. Donati et al. 2011, 2012, 2013) – may lead to a over-estimation in their measurements. For GY 314, an additional estimate was available in the literature: Greene & Lada (1997) reported , lower than that reported by Doppmann et al. (2003). Greene & Lada (1997) based their estimate on synthetically broadened spectra of a K5 MS star while their spectra were of poorer resolution. The Doppmann et al. (2003) estimate is adopted herein. The impacts of this are addressed further in Section 4.1.
The only star for which an independent estimates of had been obtained using sufficiently high-resolution spectra is SR 21A: James et al. (2016) found , consistent with the estimate adopted here. For all other systems, inspecting the reliability of each measurement directly was not possible. However, both Dahm et al. (2012) and Kohn et al. (2016) cross-checked their measurements against previously published values for the and stars, respectively, which overlapped with prior high resolution spectroscopic surveys. For all but the most rapidly rotating stars ( on the order of hundreds of km s-1), good agreements was found between estimates.
3 Calculation of stellar inclination
Determining using equation (1) requires an estimate of the stellar radius, . While it is possible to fit templates to spectra in order to determine directly, spectra with consistent resolution were not available across the full sample of stars. Model-independent assessments of were instead made from the stellar effective temperature, , and bolometric luminosity, . In turn, estimates of were made using spectral-type-to- conversions empirically-derived for Myr old stars (Pecaut & Mamajek, 2013). These account for the larger surface gravities and spotted surfaces of PMS stars.
For most of the systems considered here, either a single estimate of the spectral type exists in the literature or multiple studies report consistent spectral type estimates. However, some systems have a broader range of published spectral type estimates. For instance, those for Elias 2-24 range from M2 (Doppmann et al., 2003) to K5.5 (Wilking et al., 2005) while Rigliaco et al. (2016) report K, corresponding to a spectral type K3.5 (according to the Pecaut & Mamajek 2013 scale). Wilking et al. (2005) and Gatti et al. (2006) both report spectral types of K5 for GY 314 while Luhman & Rieke (1999) and Prato (2007) report M0 for the same object. Spectral typing SR 21A is complicated by the presence of absorption features across hydrogen emission lines (see discussions in Prato et al. 2003 and Kohn et al. 2016) with G3 (Prato et al., 2003) and F7 (Herczeg & Hillenbrand, 2014) spectral types both reported. In all cases, the spectral types in Table 1 are chosen as the most commonly-adopted values in the literature.
Values of were calculated by applying a bolometric correction (BC) to a distance modulus- and extinction-corrected 2MASS -band magnitude. A bolometric magnitude for the Sun, mag was adopted following Mamajek (2012). Extinction is best assessed using stellar photosphere-tracing spectra. However, only SR 21A, DoAr 24E and USco J160900.7-190852 had spectroscopically-determined extinction estimates available in the literature (Prato et al., 2003; Herczeg & Hillenbrand, 2014; Ansdell et al., 2016b). Instead, the extinction at -band, , was determined from photometry using
| (2) |
where is the spectral type-dependent intrinsic colour and the value of the constant is valid for the 2MASS photometric system (Yuan et al., 2013). The resulting estimates of are listed in Table 1.
This method of estimating the extinction assumes that the stellar photosphere is the only contributor to the observed - and -band flux. In their assessment of the multi-wavelength photometry obtained for the systems in Table 1, Rebull et al. (2018) identify the shortest wavelength at which the infrared excess becomes significant. The stars in Table 1 are each reported to display clear infrared excesses emerging longward of m. However, Fischer et al. (2011) showed that accretion disk-hosting, low mass PMS stars may exhibit emission in excess of that expected of a bare stellar photosphere even across wavebands. To minimise contamination from accretion and thermal disc emission, Fischer et al. (2011) recommend using - colours to determine extinction towards low mass stars rather than - or -. However, contemporaneous photometry at and bands is not available for the systems in Table 1. The intrinsically variable nature of PMS stars means that using non-contemporaneous photometry would adversely affect the measurement of the observed colour. As 2MASS photometry is contemporaneous and Fischer et al. (2011) highlight that the median level of excess is similar across and bands (thus having a minimal effect on the inferred colour), the 2MASS - colour is used in the estimation of the extinction.
For each star, the 2MASS -band BC and were interpolated from table 6 of Pecaut & Mamajek (2013). The measurement uncertainties on were propagated from the uncertainties in spectral type classification and assuming an error in of dex. This method of calculating assumes that the luminosity spreads observed across individual star forming regions are indicative of a true spread in (cf. discussion in Soderblom et al. 2014). Although unresolved binaries, differential extinction, photometric variability, and variable accretion all contribute to the observed luminosity spread, they cannot explain its full extent (Hartmann, 2001; Burningham et al., 2005; Preibisch & Feigelson, 2005; Slesnick et al., 2008). In addition, spreads have been found independently of spreads (Jeffries, 2007).
Two methods are adopted for estimating the distance modulus (). In the first instance, typical distances to the star forming regions are assigned to all members of each star forming region: pc for Oph, (Ortiz-León et al., 2017), and pc for Upper Sco (de Zeeuw et al., 1999). Secondly, distance estimates computed from individual Gaia DR2 parallax measurements (Gaia Collaboration et al., 2016, 2018) were retrieved from Bailer-Jones et al. (2018).
3.1 Accounting for multiplicity
Of the star-disc systems in Table 1, exist in confirmed or candidate binary systems. Their projected separations, position angles, -band magnitude difference () as well as their Gaia parallax (), and proper motions ( and ) are presented in Table 2. According to the projected binary separation of CD-22 11432 reported in Metchev & Hillenbrand (2009) and the disc radius reported in Barenfeld et al. (2017), the binary companion is located exterior to the outer disc edge. Thus, the disc in this system is not considered to be circum-binary as was assumed in Kraus et al. (2012).
Additional motion caused by binary companions is not accounted for in the Gaia DR2 parallax estimation (Luri et al., 2018). The binaries V935 Sco, CD-22 11432 and USco J160643.8-190805 appear unresolved in Gaia DR2. Thus, distance estimates are not provided for these three systems in Table 1. The astrometric excess noise values from the Gaia astrometric fits were inspected to ensure that the impact of additional motion induced by the presence of companions was minimal (cf. Lindegren et al. 2016). With the exception of Usco J160643.8-190805, all astrometric excess noise values were milliarcseconds (mas). Individual distances obtained from Bailer-Jones et al. (2018) for the remaining 17 stars are listed in Table 1.
Flux contamination can bias the stellar inclination estimates if a companion or neighbouring star is sufficiently close. For instance, essentially all of the flux from neighbouring stars with projected separations ” will be captured in the 2MASS point spread function (PSF). The three systems which lack individual Gaia DR2 parallax measurements lie within this limit. Individual component photometry at - and -bands is not available in the literature for these objects. Consequently, their cannot be determined and they are excluded from further analysis. Another close binary system, DoAr 24E, has a projected separation of ” (Simon et al., 1995). At this separation, the 2MASS photometry is likely affected by partial Malmquist bias whereby part of the secondary flux is captured within the 2MASS PSF. Individual component - and -band photometry for this binary system, retrieved from Prato et al. (2003), were converted from the CIT to the 2MASS photometric system using the relations in Carpenter (2001) and adopted instead.
K2 photometry is also susceptible to contamination by close neighbours. DoAr 24E and SR 21A both have relatively close neighbours but these are both infrared companions (Prato et al., 2003). Contamination of their optical LCs is thus unlikely. By comparison, the companion to ISO-Oph 51 is relatively distant. However, the results for this object from K2 appear confused. Cody et al. (2017) report that the K2 photometry of ISO-Oph 51 is contaminated by a neighbouring source at ”. SIMBAD and Gaia DR2 were used to check for neighbouring stars: only 2MASS J16263713-2415599 is known to exist within ” of ISO-Oph 51 (see Table 2) and is assumed herein to be the likely source of this contamination due to its similar optical brightness222Individual component photometry in Wilking et al. (2005) and Erickson et al. (2011) reveal ISO-Oph 51 and 2MASS J16263713-2415599 have Cousins- magnitudes of 13.97 and 13.30, respectively.. In accounting for this contamination, Cody et al. (2017) do not recover the day periodicity reported by Rebull et al. (2018). Instead, Cody et al. (2017) find a day periodicity in bursting events exhibited in the LC of ISO-Oph 51. This periodicity is not likely to trace stellar rotation. Meanwhile, Rebull et al. (2018) also highlight the bursting events within the LC of ISO-Oph 51 while reporting a day periodicity in the “burster” LC of 2MASS J16263713-2415599. In light of this apparent confusion, ISO Oph 51 is removed from further analysis.
As an additional check for potential photometry contamination, a companion search within of each of the remaining objects in Table 1 was performed using the Gaia archive333https://gea.esac.esa.int/archive/. No evidence for additional co-distant and co-moving companions was found.
4 Results and discussion
| SFR | Gaia | |||
| ID | ||||
| () | (∘) | () | (∘) | |
| (1) | (2) | (3) | (4) | (5) |
| WSB 63 | – | – | ||
| DoAr 24E | ||||
| Elias 2-24 | ||||
| GY 314 | ||||
| DoAr 25 | ||||
| SR 21A | ||||
| J160900.0-190836 | ||||
| RX J1603.9-2031A | ||||
| J160357.9-194210 | ||||
| J160823.2-193001 | ||||
| J160900.7-190852 | ||||
| J160959.4-180009 | ||||
| RX J1614.3-1906 | ||||
| J155624.8-222555 | ||||
| RX J1604.3-2130A | ||||
| HIP 79977 | – | |||
and values computed using (i) distances of pc or depending on the star forming region (SFR) membership and (ii) Gaia parallaxes are presented in Table 3. The two estimates for each star agree to within the derived uncertainties. An estimate of could not be made for five stars as exceeded a value of , regardless of the adopted . Of these five stars, it is possible that WSB 63 is affected by systematic errors as both estimates exceeded a value of by . This result is robust against the choice of spectral type for this object444Alternative spectral types reported in the literature include M (Cieza et al., 2010) and M (Kohn et al., 2016).. Consulting Table 1, one can see that this object features both the slowest rotation period and the largest of the sample. The period reported for this star may not trace stellar rotation. Instead, it may be associated with a different variability mechanism.
A comparison of the disc and stellar inclinations for the 15 systems in Table 3 with estimates is presented in Fig. 2. In each case, both estimates of are shown: Gaia estimates in black, red and green; SFR estimates in grey, pink and cyan. Systems for which only lower limits to could be estimated are marked by right-hand arrows. Green and cyan left-hand arrows are used as markers for USco J160900.7-190852 (for which only an upper limit to was available in the literature) to help in distinguishing this object from the two other objects with the same disc inclination (GY 314 and USco J160357.9-194210).
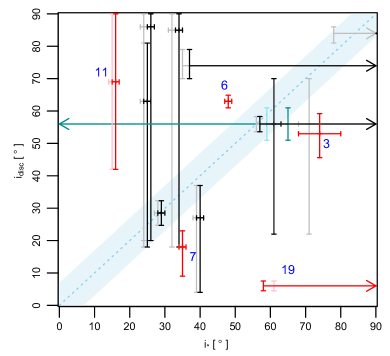
The dashed line in Fig. 2 marks the location of star-disc alignment (i.e. ) while the blue shaded area marks the region either side of this line. This corresponds to the degree of misalignment present between the ecliptic plane and the solar equator (Beck & Giles, 2005). Star-disc systems lying above or below the dashed line but within the shaded region could only be considered misaligned if one also considers the solar system to be so. Six of the ten systems with estimates (not including those with lower limits) are consistent with and are thus considered to be aligned. For USco J160900.0-190836, USco J160959.4-180009, and USco J155624.8-222555, this is certainly helped by the large lower bounds to their disc inclination uncertainties. For others, the alignment is more tightly constrained: Elias 2-24, for instance, has (adopting Gaia ) while (Dipierro et al., 2018).
For HIP 79977, the estimate made using the Gaia also exceeds a value of by . However, by using the SFR , the uncertainty on means that the estimated value is consistent with within . The inferred lower bound of for using the SFR is consistent with the relatively high disc inclination obtained for this object ( ∘; Thalmann et al. 2013). The fact that exceeds a value of for this object is likely to be symptomatic of the increased measurement accuracy required to infer stellar inclinations close to . lower limits to are also provided in Table 3 for the remaining three systems with estimates within of (GY 314, USco J160823.2-193001, and RX J1604.3-2130A). Each of these systems have high-precision disc inclination estimates. As a result, insights can still be drawn as to the degree of misalignment (if any) present in these systems. As Fig. 2 clearly shows, both GY 314 and USco J160823.2-193001 have stellar inclination lower limits consistent with their disc inclination measurements. In contrast, star-disc misalignment appears to be present in RX J1604.3-2130A with using Gaia . This star (labelled system 19 in Fig. 2) is discussed further in Section 4.3.
The four remaining systems, namely DoAr 24E, DoAr 25, SR 21A, and RX J1603.9-2031A, each display at . These are identified in Fig. 2 by the numbers 3, 6, 7, and 11, respectively. The most statistically significant misalignment () is exhibited by DoAr 25 with . DoAr 24E appears misaligned at the level with while SR 21A and RX J1603.9-2031A both appear misaligned at the level ( and , respectively). DoAr 24E and SR 21A exist in wide binary systems (Chelli et al., 1988; Reipurth & Zinnecker, 1993; Simon et al., 1995) while RX J1603.9-2031A, although close in the sky to the known triple system RX J1603.9-2031B (” sky-projected separation), appears to be single (Köhler et al., 2000; Lafrenière et al., 2014). DoAr 25 was included in surveys for multiplicity (Costa et al., 2000; Ratzka et al., 2005; Cheetham et al., 2015; Ruíz-Rodríguez et al., 2016; Kohn et al., 2016) with no companion found to date. The possibility of prior dynamical interaction via a fly-by (e.g. Cuello et al. 2018) cannot be ruled out. Further investigation of the possible cause of these apparent star-disc misalignments is beyond the scope of this paper.
4.1 Impact of systematic uncertainties
In Section 2, the potential for systematic uncertainties being present among the measurements retrieved from the literature was raised. In particular, the measurements retrieved from Doppmann et al. (2003) are potentially overestimated by up to as the spectral lines used in the measurement of are susceptible to Zeeman broadening effects. Thus, it is important to consider the potential impact this has on the results outlined above.
In particular, this has the potential to affect the inferred estimates for DoAr 24E, Elias 2-24 and GY 314. If is overestimated by , this would lead to a similar overestimation of . For Elias 2-24, this would lead to a reduction in such that , maintaining the strong case for star-disc alignment in this system (). For DoAr 24E, the reduction in reduces the value of such that the object is consistent with the degree of misalignment present in the solar system and, as such, would not typically be interpreted as being misaligned ( at significance). Finally, the reduction in for GY 314 results in a value of such that . This further implies that GY 314 features star-disc misalignment ( at significance). Taken together, this indicates no net impact in terms of the total number of systems which appear misaligned.
4.2 Comparison to Monte Carlo simulations of test data
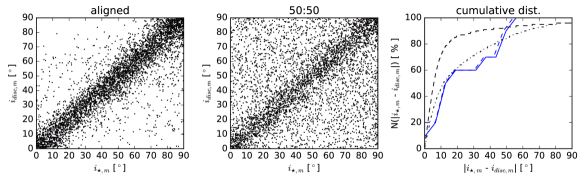
To further assess whether the misalignments in Fig. 2 can be considered significant given the measurement uncertainties, projection effects, and sample size, Monte Carlo simulations of two test populations were conducted. In the first simulated dataset, in which of the star-disc systems are aligned, a single value for the true inclination was drawn from a uniform distribution of possible inclinations between and and assigned as both the true stellar inclination () and the true disc inclination (). In the second simulated dataset, and were assigned in the same way for of the sample. For the other , values of and were drawn separately from the uniform distribution of possible inclinations. In this way, of the sample are aligned while are randomly oriented.
The observed sample of disc and stellar inclinations shown in Fig. 2 were then used to evaluate characteristic measurement uncertainties for and to convert and to their respective “observed” values. From Table 3, the typical uncertainty on is roughly uniform at up to stellar inclinations of . For , the uncertainty increases exponentially (). Simulated “observed” values of the stellar inclination () were drawn from a normal distribution of possible inclinations centred on with standard deviation given by the -dependent characteristic measurement uncertainty. No such trend with disc inclination was observed for the uncertainties on in Table 1. Instead, the median lower and upper bounded uncertainties were used to construct an asymmetric probability distribution centred on with apparent standard deviation of and . Simulated “observed” values of the disc inclination () were drawn from this distribution using the rv discrete function of the scipy.stats package in Python (Jones et al., 2001).
Finally, the and values were corrected for degeneracies involved in measuring the inclination (see Fig. 1) such that all simulated measurements ( and ) exist in the range . In each simulated dataset, 10,000 measurements of the disc and stellar inclination were realised. The apparent dearth of data points in the top left corner of the left panel of Fig. 3 is a real effect and is attributed to the asymmetric distribution of disc inclination measurement uncertainties used to generate this plot. The resulting and for the aligned and aligned; randomly oriented simulated datasets are presented in the left and middle panels of Fig. 3, respectively. The aligned test population indicates that of systems in our sample can be expected to display even if across the entire sample. By comparison, if of the star-disc systems have randomly oriented inclinations, the percentage of systems expected to display rises to . Here, of the ten systems with determinations indicate the presence of star-disc misalignment. If one widens this to include the four systems with lower limits to , the frequency of apparent star-disc misalignment in the sample reduces to . Thus, it may be possible that the star-disc misalignments inferred for DoAr 24E, DoAr 25, SR 21A, RX J1603.9-2031A, and RX J1604.3-2130A merely arise as a result of measurement uncertainties and projection effects.
The right panel of Fig. 3 compares the cumulative distribution of for the aligned (black dashed line) and aligned; randomly oriented (black dot-dashed line) simulated datasets to that of the ten systems with star and disc inclination estimates (blue lines). A double-sided Kolmogorov-Smirnov (KS) test indicates that the observed sample of , calculated using the Gaia measurements, is consistent with being drawn from the same parent population as the aligned or the aligned; randomly oriented simulated populations at probabilities of and , respectively. Similar results are found when using the SFR measurements: probabilities of and , respectively. Thus, although the frequency of apparent star-disc misalignments observed appears consistent with the simulated population of aligned systems (with characteristic measurement uncertainties and projection effects taken into account), the distribution of observed appears not to be. Instead, the observed distribution of is more consistent with the aligned; randomly oriented simulated population.
4.3 RX J1604.3-2130A
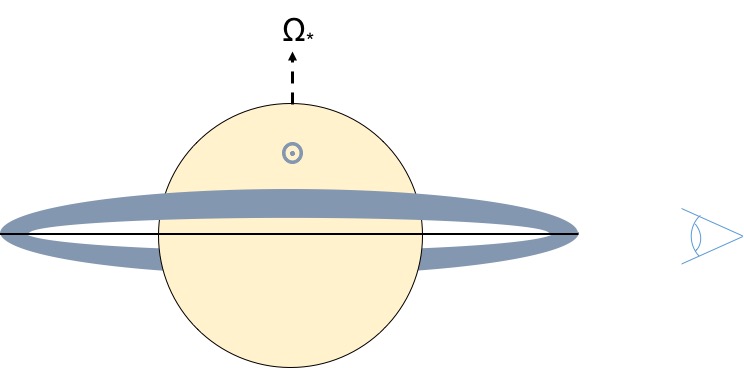
The lower limits to determined for RX J1604.3-2130A (see Table 3) suggest that the star and the outer regions of this transitional disc are strongly misaligned at the level, with . As discussed previously, systematic errors can artificially increase above its true value. Looking at this scenario from a different perspective, if one assumes that the star is aligned with the outer regions of its disc, the near pole-on geometry of the star would make measurement of difficult as the starspots present in a particular hemisphere of the star will not give rise to measurable rotation-modulated stellar flux variations unless they exist at very low latitudes. By comparison, Doppler imaging studies typically infer the presence of large polar spots on active stars like the PMS stars considered here (Strassmeier, 2002). Furthermore, a star viewed pole-on would exhibit no rotational broadening of its photospheric spectral lines. Thus, the fact that and measurements exist for this object may be taken as evidence in itself that at least some degree of misalignment is present in the system.
Interestingly, the LC of RX J1604.3-2130A also exhibits short-period “dipper” events (Rebull et al., 2018; Ansdell et al., 2016a). The dipper phenomenon is generally attributed to occultation of the stellar photosphere by clumps of dusty disc material (Ansdell et al., 2016b) but this has typically been considered to require disc inclinations of at least . As the outer disc regions of RX J1604.3-2130A are observed close to face-on, they are unlikely to be responsible for the observed stellar occultation events. Ansdell et al. (2016a) suggested the problem of observing a face-on outer disc and dipper LC phenomena could be reconciled via occultation of the stellar photosphere by accretion streams (McGinnis et al., 2015; Bodman et al., 2017) if an inner disk warp exists. Indirect evidence for optically thick material existing closer to the star in a plane inclined with respect to the outer disc has been inferred from the presence of shadows in the outer disc (Takami et al., 2014; Pinilla et al., 2018). The inferred large misalignment angle between the inner and outer disk regions suggests that the stellar inclination estimated herein may be consistent with the inclination of the inner disc material even if the star and outer disc are misaligned.
The cause of such a star-outer disc misalignment remains unclear. Facchini et al. (2014) have suggested that disc warps could be caused by embedded protoplanets on inclined orbits while Canovas et al. (2017) argue that the structure of the transition disc of RX J1604.3-2130A is most likely caused by the presence of multiple sub-stellar companions interior to the outer disc. Alternative scenarios for gap clearing which do not require the existence of protoplanets do exist but (i) the complex radial structure of the disc of RX J1604.3-2130A makes gap carving in the dust disc via photoevaporation or grain growth unlikely and (ii) the additional existence of a gas cavity (Zhang et al., 2014) is difficult to reconcile with dead zone-induced dust gaps (e.g. Ruge et al. 2016). Thus far, no companion within the disc of RX J1604.3-2130A has been found. Kraus et al. (2008) surveyed the object using aperture masking interferometry and direct imaging, ruling out companions down to mag between mas of the central star, mag between mas, and mag between mas. High contrast SPHERE observations (Canovas et al., 2017) have also ruled out the existence of companions down to between while Ireland et al. (2011) ruled out the existence of companions down to mag between .
Further from the star, a possible wide companion to RX J1604.3-2130A at was identified by Kraus & Hillenbrand (2009). It remains to be seen whether this seemingly co-moving and co-distant companion (namely RX J1604.3-2130B, see Table 2) is close enough to be responsible for dynamically perturbing the disc.
5 Summary
In this study, I have evaluated the degree to which star-disc misalignments are present among young stellar objects in the Ophiuchus and Upper Scorpius SFRs. Due to observational limitations, this analysis is restricted to evaluating misalignments between the inclination angles of the stellar and disc angular momentum vectors. The data required to assess the degree of star-disc inclination misalignment exists in the literature for members of these two SFRs. However, the analysis presented in Section 4 is limited to fifteen star-disc systems as (i) individual component photometry was not available for three close binary systems, (ii) the K2 photometry around ISO-Oph 51 and its companion appears confused (see Section 3.1), and (iii) the estimate for WSB 63 exceeded a value of by . It was only possible to determine an upper limit to for one of these fifteen systems while another four were limited to lower limit estimates of as their estimates exceeded a value of by .
An initial assessment of the degree of misalignment present in the sample was made by evaluating . Systems with , accounting for the measurement uncertainties on their and estimates, were identified as showing evidence of potential star-disc misalignment. The value of reflects the degree of misalignment present in the solar system (Beck & Giles, 2005) which is typically considered to be an aligned system. Four out of the ten systems with estimates appeared misaligned: DoAr 24E ( at significance); DoAr 25 ( at significance); SR 21A ( at significance); RX J1603.9-2031A ( at significance). In addition, one out of the four systems with only lower limits (RX J1604-2130A) appeared misaligned: ( significance). In contrast, the strongest case for alignment between the star and disc inclinations is found for Elias 2-24 where .
The possible influence of systematic uncertainties introduced by the measurements retrieved from Doppmann et al. (2003) were also investigated. These measurements utilised spectral lines which may be affected by Zemman broadening. As such, these measurements may be overestimated by as much as . When taken into account, Elias 2-24 still appears consistent with star-disc alignment while the star-disc misalignment inferred for DoAr 24E reduces to levels consistent with that found in the solar system. However, the fraction of systems indicating the presence of misalignment remains consistent as the reduced value for GY 314 enables to be calculated for this object, implying ( significance).
As shown in Fig. 1, comparing disc and stellar inclinations only probes one dimension of a three dimensional problem: a star with its south pole facing the observer is indistinguishable from one with its north pole tilted toward the observer while the position angle of the stellar rotation axis is not probed at all. A second assessment of the degree of misalignment present in the sample was made which accounted for the chance misalignment of truly aligned systems due to projection effects and characteristic measurement uncertainties on and . Monte Carlo simulations of two populations of test data were created. In one test population, of star and disc inclinations were equal while in the second test population, of the star and disc inclinations were randomly oriented. This test showed that the frequency of star-disc inclination misalignments observed in the sample (four out of ten) could be reproduced by the aligned population. However, KS tests indicated that the distribution of observed was inconsistent with being drawn from the same parent population as the aligned test case.
The results presented here are in contrast to similar analyses performed for stars hosting warm debris discs (Watson et al., 2011; Greaves et al., 2014). The eighteen star-debris disc systems studied all showed preference for star-disc alignment through comparison of and . This result was used to suggest that the dynamical effects leading to the formation of high obliquity hot Jupiters do not operate on the planetesimals in the outer disc. The misalignments uncovered within the sample of PMS star-disc systems considered here suggest that this interpretation may not be entirely correct. Instead, the discrepancy between the degree of misalignment in protoplanetary and debris disc systems could hint at a possible link between star-disc-planet alignment and the formation and/or survival of debris discs.
Further investigation into the fraction of star-disc misalignments among protoplanetary disc systems will be possible through the ongoing Gaia-ESO spectrographic survey (Gilmore et al., 2012). Through its provision of high-resolution spectra for a large proportion of members of local star forming regions, consistent measurements of and will be possible to determine for a larger fraction of Oph and Upper Sco members with K2 rotation periods and spatially resolved discs.
Acknowledgements
I thank the referee whose thorough and detailed review greatly improved the content of this paper. This work is supported by the ERC Starting Grant “ImagePlanetFormDiscs” (Grant Agreement No. 639889) and has made use of the SIMBAD database, operated at CDS, Strasbourg, France; the VizieR catalogue access tool, CDS, Strasbourg, France; and NASA’s Astrophysics Data System. This work has made use of data from the European Space Agency (ESA) mission Gaia (https://www.cosmos.esa.int/gaia), processed by the Gaia Data Processing and Analysis Consortium (DPAC, https://www.cosmos.esa.int/web/gaia/dpac/consortium). Funding for the DPAC has been provided by national institutions, in particular the institutions participating in the Gaia Multilateral Agreement. Thanks go to Stuart P. Littlefair, Jane S. Greaves, Kirstin Hay, Sam Morrell, and Tim Naylor for useful and interesting discussions.
References
- Affer et al. (2013) Affer L., Micela G., Favata F., Flaccomio E., Bouvier J., 2013, MNRAS, 430, 1433
- Albrecht et al. (2012) Albrecht S., et al., 2012, ApJ, 757, 18
- Ansdell et al. (2016a) Ansdell M., Gaidos E., Williams J. P., Kennedy G., Wyatt M. C., LaCourse D. M., Jacobs T. L., Mann A. W., 2016a, MNRAS, 462, L101
- Ansdell et al. (2016b) Ansdell M., et al., 2016b, ApJ, 816, 69
- Bailer-Jones et al. (2018) Bailer-Jones C. A. L., Rybizki J., Fouesneau M., Mantelet G., Andrae R., 2018, AJ, 156, 58
- Barenfeld et al. (2017) Barenfeld S. A., Carpenter J. M., Sargent A. I., Isella A., Ricci L., 2017, ApJ, 851, 85
- Bate et al. (2010) Bate M. R., Lodato G., Pringle J. E., 2010, MNRAS, 401, 1505
- Batygin (2012) Batygin K., 2012, Nature, 491, 418
- Beck & Giles (2005) Beck J. G., Giles P., 2005, ApJ, 621, L153
- Bodman et al. (2017) Bodman E. H. L., et al., 2017, MNRAS, 470, 202
- Bromley & Kenyon (2011) Bromley B. C., Kenyon S. J., 2011, ApJ, 735, 29
- Burningham et al. (2005) Burningham B., Naylor T., Littlefair S. P., Jeffries R. D., 2005, MNRAS, 363, 1389
- Campante et al. (2016) Campante T. L., et al., 2016, ApJ, 819, 85
- Campbell & Garrison (1985) Campbell B., Garrison R. F., 1985, PASP, 97, 180
- Canovas et al. (2017) Canovas H., et al., 2017, A&A, 598, A43
- Carpenter (2001) Carpenter J. M., 2001, AJ, 121, 2851
- Cheetham et al. (2015) Cheetham A. C., Kraus A. L., Ireland M. J., Cieza L., Rizzuto A. C., Tuthill P. G., 2015, ApJ, 813, 83
- Chelli et al. (1988) Chelli A., Zinnecker H., Carrasco L., Cruz-Gonzalez I., Perrier C., 1988, A&A, 207, 46
- Chen et al. (2011) Chen C. H., Mamajek E. E., Bitner M. A., Pecaut M., Su K. Y. L., Weinberger A. J., 2011, ApJ, 738, 122
- Cieza et al. (2010) Cieza L. A., et al., 2010, ApJ, 712, 925
- Cody et al. (2017) Cody A. M., Hillenbrand L. A., David T. J., Carpenter J. M., Everett M. E., Howell S. B., 2017, ApJ, 836, 41
- Costa et al. (2000) Costa A., Jessop N. E., Yun J. L., Santos C. A., Ward-Thompson D., Casali M. M., 2000, in IAU Symposium. p. 48
- Cox et al. (2017) Cox E. G., et al., 2017, ApJ, 851, 83
- Cuello et al. (2018) Cuello N., et al., 2018, MNRAS,
- Dahm et al. (2012) Dahm S. E., Slesnick C. L., White R. J., 2012, ApJ, 745, 56
- Davies et al. (2014) Davies C. L., Gregory S. G., Greaves J. S., 2014, MNRAS, 444, 1157
- Dawson et al. (2015) Dawson R. I., Murray-Clay R. A., Johnson J. A., 2015, ApJ, 798, 66
- Dipierro et al. (2018) Dipierro G., et al., 2018, MNRAS, 475, 5296
- Donati et al. (2011) Donati J.-F., et al., 2011, MNRAS, 412, 2454
- Donati et al. (2012) Donati J.-F., et al., 2012, MNRAS, 425, 2948
- Donati et al. (2013) Donati J.-F., et al., 2013, MNRAS, 436, 881
- Doppmann et al. (2003) Doppmann G. W., Jaffe D. T., White R. J., 2003, AJ, 126, 3043
- Doppmann et al. (2005) Doppmann G. W., Greene T. P., Covey K. R., Lada C. J., 2005, AJ, 130, 1145
- Duchêne et al. (2007) Duchêne G., Bontemps S., Bouvier J., André P., Djupvik A. A., Ghez A. M., 2007, A&A, 476, 229
- Erickson et al. (2011) Erickson K. L., Wilking B. A., Meyer M. R., Robinson J. G., Stephenson L. N., 2011, AJ, 142, 140
- Fabrycky & Tremaine (2007) Fabrycky D., Tremaine S., 2007, ApJ, 669, 1298
- Facchini et al. (2014) Facchini S., Ricci L., Lodato G., 2014, MNRAS, 442, 3700
- Fielding et al. (2015) Fielding D. B., McKee C. F., Socrates A., Cunningham A. J., Klein R. I., 2015, MNRAS, 450, 3306
- Fischer et al. (2011) Fischer W., Edwards S., Hillenbrand L., Kwan J., 2011, ApJ, 730, 73
- Foucart & Lai (2011) Foucart F., Lai D., 2011, MNRAS, 412, 2799
- Gaia Collaboration et al. (2016) Gaia Collaboration et al., 2016, A&A, 595, A1
- Gaia Collaboration et al. (2018) Gaia Collaboration et al., 2018, A&A, 616, A1
- Gatti et al. (2006) Gatti T., Testi L., Natta A., Randich S., Muzerolle J., 2006, A&A, 460, 547
- Gilmore et al. (2012) Gilmore G., et al., 2012, The Messenger, 147, 25
- Goldreich & Tremaine (1980) Goldreich P., Tremaine S., 1980, ApJ, 241, 425
- Greaves et al. (2014) Greaves J. S., et al., 2014, MNRAS, 438, L31
- Greene & Lada (1997) Greene T. P., Lada C. J., 1997, AJ, 114, 2157
- Gregory et al. (2012) Gregory S. G., Donati J.-F., Morin J., Hussain G. A. J., Mayne N. J., Hillenbrand L. A., Jardine M., 2012, ApJ, 755, 97
- Hartmann (2001) Hartmann L., 2001, AJ, 121, 1030
- Herczeg & Hillenbrand (2014) Herczeg G. J., Hillenbrand L. A., 2014, ApJ, 786, 97
- Howell et al. (2014) Howell S. B., et al., 2014, PASP, 126, 398
- Ida & Lin (2008) Ida S., Lin D. N. C., 2008, ApJ, 673, 487
- Ireland et al. (2011) Ireland M. J., Kraus A., Martinache F., Law N., Hillenbrand L. A., 2011, ApJ, 726, 113
- James et al. (2016) James D. J., Aarnio A. N., Richert A. J. W., Cargile P. A., Santos N. C., Melo C. H. F., Bouvier J., 2016, MNRAS, 459, 1363
- Jeffries (2007) Jeffries R. D., 2007, MNRAS, 381, 1169
- Jones et al. (2001) Jones E., Oliphant T., Peterson P., et al., 2001, SciPy: Open source scientific tools for Python, http://www.scipy.org/
- Köhler et al. (2000) Köhler R., Kunkel M., Leinert C., Zinnecker H., 2000, A&A, 356, 541
- Kohn et al. (2016) Kohn S. A., Shkolnik E. L., Weinberger A. J., Carlberg J. K., Llama J., 2016, ApJ, 820, 2
- Kraus & Hillenbrand (2009) Kraus A. L., Hillenbrand L. A., 2009, ApJ, 703, 1511
- Kraus et al. (2008) Kraus A. L., Ireland M. J., Martinache F., Lloyd J. P., 2008, ApJ, 679, 762
- Kraus et al. (2012) Kraus A. L., Ireland M. J., Hillenbrand L. A., Martinache F., 2012, ApJ, 745, 19
- Lafrenière et al. (2014) Lafrenière D., Jayawardhana R., van Kerkwijk M. H., Brandeker A., Janson M., 2014, ApJ, 785, 47
- Lai et al. (2011) Lai D., Foucart F., Lin D. N. C., 2011, MNRAS, 412, 2790
- Le Bouquin et al. (2009) Le Bouquin J.-B., Absil O., Benisty M., Massi F., Mérand A., Stefl S., 2009, A&A, 498, L41
- Lindegren et al. (2016) Lindegren L., et al., 2016, A&A, 595, A4
- Luhman & Rieke (1999) Luhman K. L., Rieke G. H., 1999, ApJ, 525, 440
- Luri et al. (2018) Luri X., et al., 2018, A&A, 616, A9
- Mamajek (2012) Mamajek E. E., 2012, ApJ, 754, L20
- Mathews et al. (2012) Mathews G. S., Williams J. P., Ménard F., 2012, ApJ, 753, 59
- McGinnis et al. (2015) McGinnis P. T., et al., 2015, A&A, 577, A11
- Metchev & Hillenbrand (2009) Metchev S. A., Hillenbrand L. A., 2009, The Astrophysical Journal Supplement Series, 181, 62
- Monnier et al. (2012) Monnier J. D., et al., 2012, ApJ, 761, L3
- Naoz et al. (2011) Naoz S., Farr W. M., Lithwick Y., Rasio F. A., Teyssandier J., 2011, Nature, 473, 187
- Ortiz-León et al. (2017) Ortiz-León G. N., et al., 2017, ApJ, 834, 141
- Pecaut & Mamajek (2013) Pecaut M. J., Mamajek E. E., 2013, ApJS, 208, 9
- Pecaut et al. (2012) Pecaut M. J., Mamajek E. E., Bubar E. J., 2012, ApJ, 746, 154
- Pinilla et al. (2018) Pinilla P., et al., 2018, ApJ, 868, 85
- Prato (2007) Prato L., 2007, ApJ, 657, 338
- Prato et al. (2003) Prato L., Greene T. P., Simon M., 2003, ApJ, 584, 853
- Preibisch & Feigelson (2005) Preibisch T., Feigelson E. D., 2005, ApJS, 160, 390
- Preibisch & Zinnecker (1999) Preibisch T., Zinnecker H., 1999, AJ, 117, 2381
- Preibisch et al. (2001) Preibisch T., Guenther E., Zinnecker H., 2001, AJ, 121, 1040
- Preibisch et al. (2002) Preibisch T., Brown A. G. A., Bridges T., Guenther E., Zinnecker H., 2002, AJ, 124, 404
- Rafikov (2006) Rafikov R. R., 2006, ApJ, 648, 666
- Rasio & Ford (1996) Rasio F. A., Ford E. B., 1996, Science, 274, 954
- Ratzka et al. (2005) Ratzka T., Köhler R., Leinert C., 2005, A&A, 437, 611
- Rebull et al. (2016a) Rebull L. M., et al., 2016a, AJ, 152, 113
- Rebull et al. (2016b) Rebull L. M., et al., 2016b, AJ, 152, 114
- Rebull et al. (2018) Rebull L. M., Stauffer J. R., Cody A. M., Hillenbrand L. A., David T. J., Pinsonneault M., 2018, AJ, 155, 196
- Reipurth & Zinnecker (1993) Reipurth B., Zinnecker H., 1993, A&A, 278, 81
- Rigliaco et al. (2016) Rigliaco E., et al., 2016, A&A, 588, A123
- Rogers et al. (2012) Rogers T. M., Lin D. N. C., Lau H. H. B., 2012, ApJ, 758, L6
- Ruge et al. (2016) Ruge J. P., Flock M., Wolf S., Dzyurkevich N., Fromang S., Henning T., Klahr H., Meheut H., 2016, A&A, 590, A17
- Ruíz-Rodríguez et al. (2016) Ruíz-Rodríguez D., Ireland M., Cieza L., Kraus A., 2016, MNRAS, 463, 3829
- Simon et al. (1995) Simon M., et al., 1995, ApJ, 443, 625
- Slesnick et al. (2008) Slesnick C. L., Hillenbrand L. A., Carpenter J. M., 2008, ApJ, 688, 377
- Socrates et al. (2012) Socrates A., Katz B., Dong S., Tremaine S., 2012, ApJ, 750, 106
- Soderblom et al. (2014) Soderblom D. R., Hillenbrand L. A., Jeffries R. D., Mamajek E. E., Naylor T., 2014, Protostars and Planets VI, pp 219–241
- Spalding & Batygin (2015) Spalding C., Batygin K., 2015, ApJ, 811, 82
- Strassmeier (2002) Strassmeier K. G., 2002, Astronomische Nachrichten, 323, 309
- Takami et al. (2014) Takami M., et al., 2014, ApJ, 795, 71
- Thalmann et al. (2013) Thalmann C., et al., 2013, ApJ, 763, L29
- Torres et al. (2006) Torres C. A. O., Quast G. R., da Silva L., de La Reza R., Melo C. H. F., Sterzik M., 2006, A&A, 460, 695
- Tripathi et al. (2017) Tripathi A., Andrews S. M., Birnstiel T., Wilner D. J., 2017, ApJ, 845, 44
- Watson et al. (2011) Watson C. A., Littlefair S. P., Diamond C., Collier Cameron A., Fitzsimmons A., Simpson E., Moulds V., Pollacco D., 2011, MNRAS, 413, L71
- Wilking et al. (2005) Wilking B. A., Meyer M. R., Robinson J. G., Greene T. P., 2005, AJ, 130, 1733
- Winn et al. (2010) Winn J. N., Fabrycky D., Albrecht S., Johnson J. A., 2010, ApJ, 718, L145
- Wright et al. (2011) Wright J. T., et al., 2011, PASP, 123, 412
- Yuan et al. (2013) Yuan H. B., Liu X. W., Xiang M. S., 2013, MNRAS, 430, 2188
- Zhang et al. (2014) Zhang K., Isella A., Carpenter J. M., Blake G. A., 2014, ApJ, 791, 42
- de Zeeuw et al. (1999) de Zeeuw P. T., Hoogerwerf R., de Bruijne J. H. J., Brown A. G. A., Blaauw A., 1999, AJ, 117, 354