Unconventional magnetization textures and domain-wall pinning in Sm–Co magnets
Abstract
The most powerful magnets for high temperature applications are Sm–Co-based alloys with a microstructure that combines magnetically soft and hard regions. The microstructure consists of a dense domain-wall-pinning network that endows the material with remarkable magnetic hardness. A precise understanding of the coupling between magnetism and microstructure is essential for enhancing the performance of Sm–Co magnets, but experiments and theory have not yet converged to a unified model. Here, we combine transmission electron microscopy, atom probe tomography, and nanometer-resolution off-axis electron holography with micromagnetic simulations to show that the magnetization processes in Sm–Co magnets result from an interplay between curling instabilities and pinning effects at the intersections between magnetically soft and hard regions. We also find that topologically non-trivial magnetic domains separated by a complex network of domain walls play a key role in the magnetic state. Our findings reveal a previously hidden aspect of magnetism and provide insight into the full potential of high-performance magnetic materials.
I Introduction
Sm–Co-based materials are the strongest magnets available today, particularly for vital high-temperature precision applications thanks to their high Curie temperatures hadjipanayis2000 ; gutfleisch2011 ; mccallum2014 . Extensive research and industrial development in the past few decades has led to a significant improvement in their magnetic performance Horiuchi2013 . One such example is a highly engineered Sm–Co-based system that consists of a cellular microstructure with a Sm2Co17 matrix that is enclosed by SmCo5 cells and intersected by the so-called Z phase (Zr-rich platelets) perpendicular to the -axis of the Sm2Co17 matrix, which is at the same time the magnetic easy axis hadjipanayis1999 ; hadjipanayis2000 ; duerrschnabel2017 . This characteristic geometry results from tailored aging-heat treatments hadjipanayis2000 , and corresponds to a network of intertwined magnetically soft (Sm2Co17) and hard (SmCo5) regions.
Magnetic properties due to combinations of hard and soft structures are highly tunable because they make use of the high saturation magnetization of the soft phase and the strong magnetocrystalline anisotropy of the hard phase kronmueller1996 ; Skomski2013 . Particular attention has been devoted to modeling the Sm–Co cellular microstructure skomski1997 ; Fidler2000 ; streibl2000 ; Fidler2004 in order to predict its coercivity. The enhanced coercivity in these cellular Sm–Co magnets emerges from the difference between the magnetocrystalline anisotropy of the two phases and consequently the difference in domain-wall energy skomski1997 . While conventional wisdom states that this microstructure constitutes a pinning system for domain walls, the exact magnetization processes remain elusive despite the intense activities that have been performed to understand the interaction of domain walls with the SmCo5 cells Gaunt1972 ; livingston1977 ; Nagel1979 ; hadjipanayis1982b ; fidler1982 ; wong1997 ; Zhang2018 .
Magnetic imaging experiments, by means of Lorentz transmission electron microscopy (LTEM), magnetic force microscopy, and Kerr microscopy, have revealed that domain walls follow the SmCo5 cell morphology fidler1982 ; hadjipanayis1982 ; hadjipanayis2000b ; Gutfleisch2006 ; okabe2006 ; SepehriAmin2017 ; Zhang2018 , thus confirming strong pinning at the cell boundaries. Theory and experiment, however, have yet to converge on the role of the Z phase on the magnetic properties of this material skomski1997 ; Fidler2000 ; streibl2000 ; Fidler2004 . Forward modeling of the Z phase is impeded by the fact that the material parameters of this phase cannot be easily estimated because the thickness of the Z phase can be as thin as 1-2 atomic layers (the thickness varies from material to material), and thus cannot be compared with measurements on bulk samples katter1996 . Hence, high-resolution imaging of the magnetization textures is crucial to elucidate the interplay between the soft, hard, and Z phases, and unveil the magnetization processes that are at play in the cellular Sm–Co magnets.
Here we present a detailed study of the magnetic state in a cellular Sm–Co magnet containing Fe, Cu and Zr, where we correlate atomic-resolution TEM and atom probe tomography (APT) with high-resolution LTEM and off-axis electron-holography (EH) imaging of the domain-wall structure, and systematically compare it with detailed micromagnetic simulations. By matching experiments and theory one-to-one we show that the nanoscale magnetization processes in cellular Sm–Co magnets stem from an interplay between pinning at the SmCo5 cell boundaries and curling instabilities at the intersections between all three phases.
II Results and Discussion
The Sm–Co sample in our study has an overall chemical composition of Sm(Co,Fe,Cu,Zr)7.57 with minor amounts of oxygen (see the Methods section). Figure 1a shows for this sample an overview of the microstructure, revealing the typical soft-magnetic Sm2Co17 matrix enclosed by the hard-magnetic SmCo5 cells and intersected by the Z-phase platelets. A close-up view in Fig. 1b and corresponding energy-dispersive X-ray spectroscopy (EDX) chemical maps in Fig. 1c–g show interfaces between the three phases and confirm that the Z-phase is rich in Zr. The thickness of the interface between the Sm2Co17 matrix and the SmCo5 cells ranges from atomically sharp to 2 nm (visible as blurry contrast), whereas the interfaces with the Z phase are always atomically sharp. The -axis of the crystal structure (see Fig. 1 in the Supplementary Material) lies inside the TEM lamella, and the Z platelets are always perpendicular to the -axis duerrschnabel2017 .
The APT reconstruction in Figure 1h shows the isoconcentration surfaces of Zr and Fe with concentration values of 9.8 and 13.5 at. %, respectively, and reveal four perfectly flat Z platelets, where two rightmost of which are actually so close that they are visible only as one wide platelet. In the top middle part of Fig. 1h between two Z platelets a twisted SmCo5 cell can be seen. The twisted shape explains why in Fig. 1a different interfaces between the 2:17 and 1:5 phases have different sharpness. The concentration profiles of individual elements across a SmCo5 cell and a Z platelet are shown in Figures 1i and j, respectively (across the blue areas in the inset figures). Cu is found inside the cell with a Gaussian-like distribution, which might critically affect the magnetic properties SepehriAmin2017 . The increase in Sm across the SmCo5 cell appears to be non-symmetrical, which may be due to applying a one-dimensional concentration profile to the twisting of the cell. As expected, Zr increases across the Z platelet, but, surprisingly, Cu segregates at the interfaces between the platelet and the matrix, which has a significant impact on the magnetic performance. Therefore, further nanoscale segregation and clustering studies are feasible and encouraged. The SmCo5 cells are typically around 200 nm wide across their widest region and approximately 15 nm thick (Fig. 1a), and the Z platelets are at most 5 nm thick (Fig. 1b) and thus consist of only a few atomic layers (some platelets consist of only 1–2 atomic lattice planes). As we will discuss below, it is the thickness of the Z platelets that plays a crucial role in the magnetic properties.
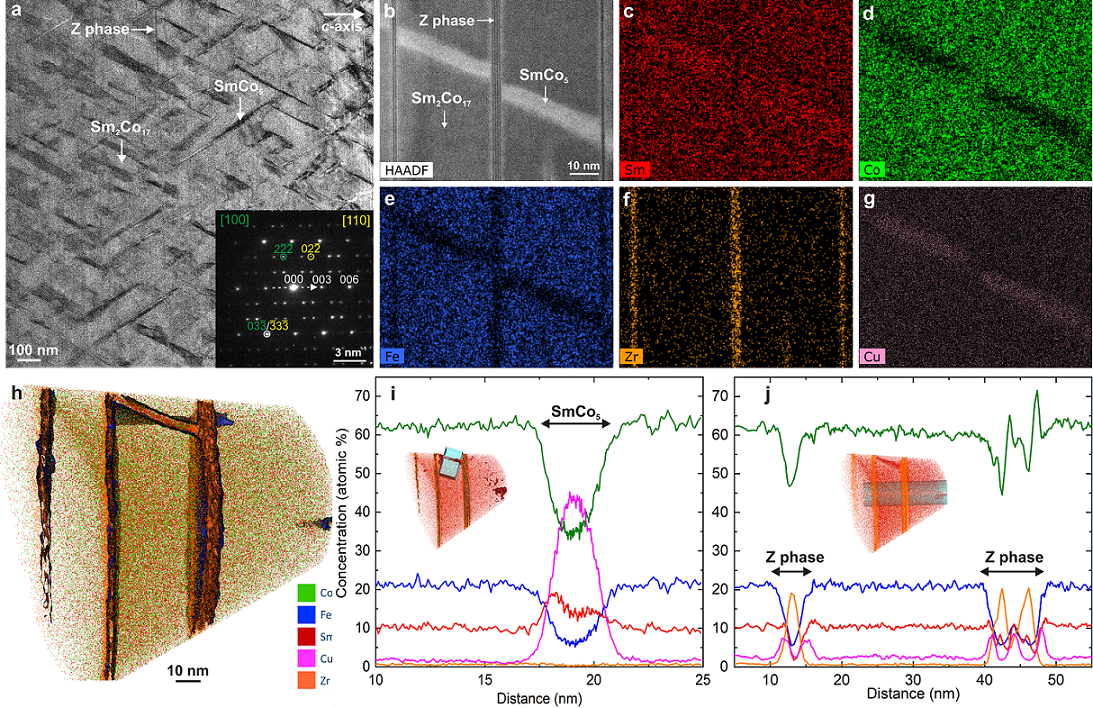
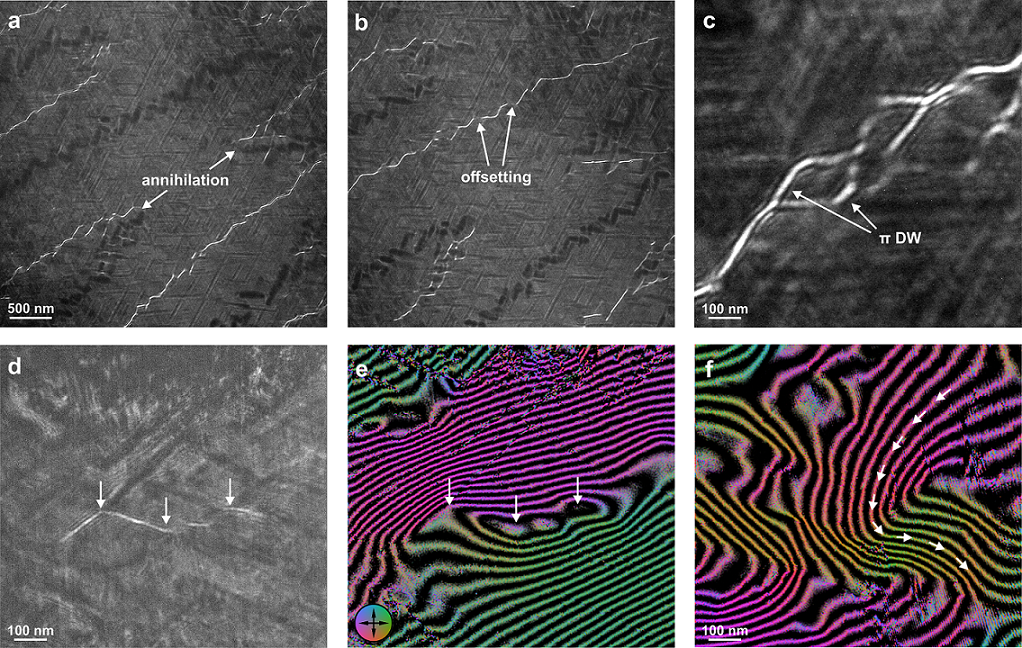
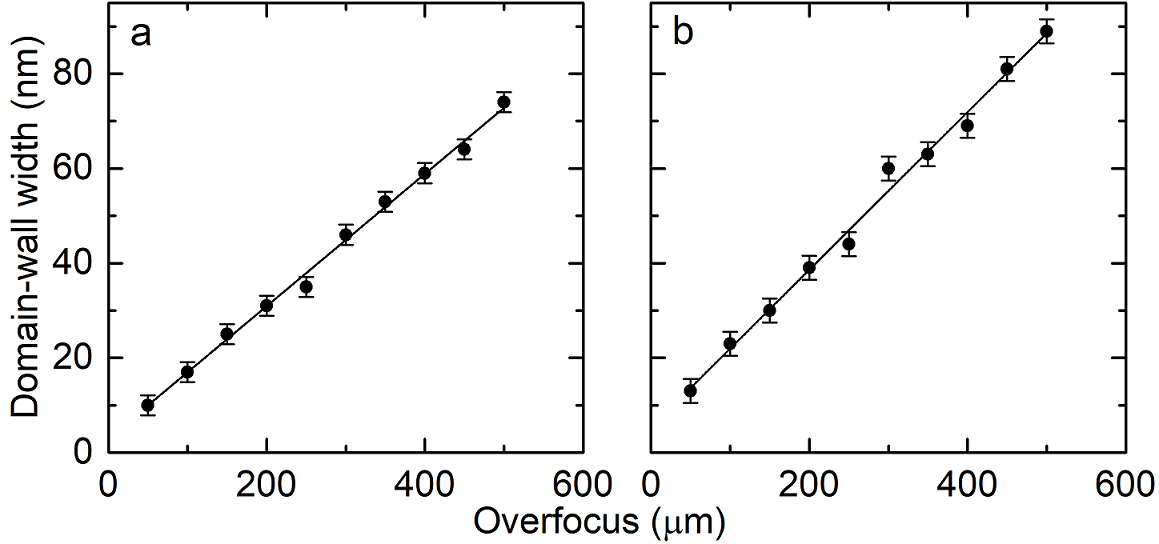
Figure 2 shows magnetic imaging studies of the cellular Sm–Co magnet in a thermally demagnetized (magnetically pristine) state. Figures 2a and b are over- and underfocus Fresnel-mode LTEM images of the same area, respectively. Domain walls (DWs) appear as alternating sharp and bright contrast (convergent), or blurry and dark contrast (divergent), depending on the sign of the defocus and the sense of the magnetization profile along the domain wall. Changing the sign of the defocus inverts the contrast, i.e. the same domain walls have opposite contrast in over and underfocus images. These LTEM images reveal a complex DW pattern that follows exactly the microstructure of the material, similar to those shown in the literature hadjipanayis1982 ; fidler1982 ; hadjipanayis2000b ; Zhang2018 . Specifically, we observe that the domain walls are always adjacent to the SmCo5 cells and are offset by approximately 50 nm via the Z phase exactly where they intersect the cells. Even though LTEM does not enable a quantification of the magnetization direction along the domain-wall profile, considering the high uniaxial anisotropy in the system we may assume that these are Bloch-type domain walls fidler1982 . The average domain-wall thickness width was estimated from a series of images taken at different defocus values (see Fig. 2 in the Supplementary Material) to be nm. This is in agreement with theory, considering the properties of Sm2Co17 from which nm can be derived, where is the exchange stiffness and is the uniaxial magnetocrystalline anisotropy (see Methods). This result suggests that the domain walls are mostly located in the soft Sm2Co17 phase, reminiscent of an exchange spring magnet fullerton1999 .
While a zig-zag domain-wall structure is well known Tian2015 , here we have observed for the first time unexpected domain wall patterns at some of the intersections between the three phases, where domain walls with opposite sense meet and annihilate each other, leaving a trivial ferromagnetic state (marked with arrows in Figs. 2a and b). Surprisingly, topologically complex structures bounded with two walls of the same sense, i.e. total winding of 2 can also be observed, as shown in Fig. 2c. The unwinding of such regions is non-trivial and requires a violation of topological constraints.
We have complemented LTEM with off-axis EH to gain in-depth information on the direction of the local magnetic field inside the sample. Figure 2d shows an LTEM image of a domain wall pinned to a SmCo5 cell with contrast that varies in intensity. Domain walls may be tilted inside the sample and therefore overlap with adjacent magnetic domains, which might result in such contrast. However, a magnetic induction map extracted from off-axis EH of the same area shown in Fig. 2e gives more information on this magnetic structure. The domain wall has a winding of and the magnetic field curls around the SmCo5 cell, forming closed loops reminiscent of magnetic vortices (indicated by the middle arrow). This curling may explain the variation of contrast intensity in LTEM. Interestingly, Figure 2e reveals another domain wall in the top left corner, which is not visible in LTEM in Fig. 2d. Figure 2f shows that the magnetic texture in some areas can be so complex that some domain walls do not have a well-defined angle; instead the angle varies between and . These exotic magnetization textures are closely correlated with the microstructure and indicate that topological aspects need to be considered in order to correctly interpret the magnetic state.
Given the elaborate microstructure, these observations raise various questions regarding the magnetic state in cellular Sm–Co magnets. In order to obtain further insight, we performed detailed high-resolution micromagnetic simulations to elucidate the formation of the observed complex domain patterns. To this end, it is imperative that we fully consider the real microstructure, and thus we constructed a simulation system directly from the TEM images shown above. Figures 3a,b show how we have truncated the microstructure in order to model a system with the three phases at the same geometry and scale.
In our simulations, we have considered the ferromagnetic exchange and uniaxial anisotropy energies, the dipole-dipole interactions, and the exchange energy between the three different phases. The material parameters (, , and saturation magnetization ) are well known and were taken from the literature katter1996 ; nagel2003 ; SepehriAmin2017 ; duerrschnabel2017 (see Methods). The exchange interaction energy between the three phases is unknown. We performed parametric micromagnetic studies where we varied the exchange interaction and compared the theoretical hysteresis curve with the experimental data, thus deducing the correct values by matching simulations to experiments (Fig. 3c-e).
As mentioned above, the precise material properties of the Z phase are unknown because the exact chemical composition is unclear and the platelets can be as thin as a single atomic layer (see Fig. 1b). All material parameters, e.g., exchange stiffness, saturation magnetization, and magnetocrystalline anisotropy are affected by the reduced dimensions of the platelets and their interfaces Hellman2017 . It is known from thin-film studies that the anisotropy is the most sensitive property and changes drastically depending on the thickness and local atomic arrangements Charilaou2016 . We have therefore performed simulations where we considered the Z phase to be either anisotropic or isotropic. In the former case, we assigned the bulk value of katter1996 ; duerrschnabel2017 , whereas in the latter case we set . From the comparison of experimental and theoretical curves, we find that the simulations match the experimental observations only if . Hence, for the rest of the discussion we assume that for the Z phase.
In order to make our simulation quantitatively comparable to the experimental results, we matched the theoretically predicted coercivity with the experimental one by varying the exchange energy between the three phases. We find that the coercivity increases with decreasing exchange energy (see Fig. 3c). This supports experiments that show that increasing Cu content leads to higher coercivity, depending on the compositional gradient at the boundary Gutfleisch2006 ; SepehriAmin2017 . This is due to the formation of Cu-rich interfaces between the magnetic phases that decrease the exchange coupling.
We have also found that changing the thickness of the SmCo5 cells does not modify the magnetic performance strongly, in agreement with experiments Shen2016 and theory Nishida2012 , showing that the pinning field is saturated for a SmCo5 thickness of more than 4 nm. This contradicts the predictions by Fidler et al. Fidler2000 ; Fidler2004 , stating that the SmCo5 thickness should be at least three times the exchange length ( nm) for effective domain-wall pinning. The pinning, however, is a complex process and depends strongly on the Cu content in the SmCo5 cells Kronmueller2002 . In our experiments we have found a Cu-composition gradient, but because the variation of the magnetic material parameters as a function of Cu is unknown, we modeled SmCo5 with a homogeneous Cu enrichment.
Furthermore, we have found that the coercivity strongly depends on the Z-phase thickness (see Fig. 3d). In the absence of the Z phase, it has a maximum value of 5.7 T, and decreases significantly with increasing Z-phase thickness up to 5 nm, where it reaches a minimum of 3 T and then remains constant. These results explain recent experimental observations, where the magnetic performance deteriorated with increasing Z-phase thickness Zhang2018 . However, since Zr is essential in forming the Sm–Co microstructure hadjipanayis1982 , it cannot be completely eliminated from the material, but the Z-phase platelets may be designed to be as thin as possible to maximize the performance. As we will discuss below, smaller thickness impedes magnetization curling and hence a stronger external field is required to initiate the magnetization reversal process, which begins at the intersections of the Z and Sm2Co17 phases.
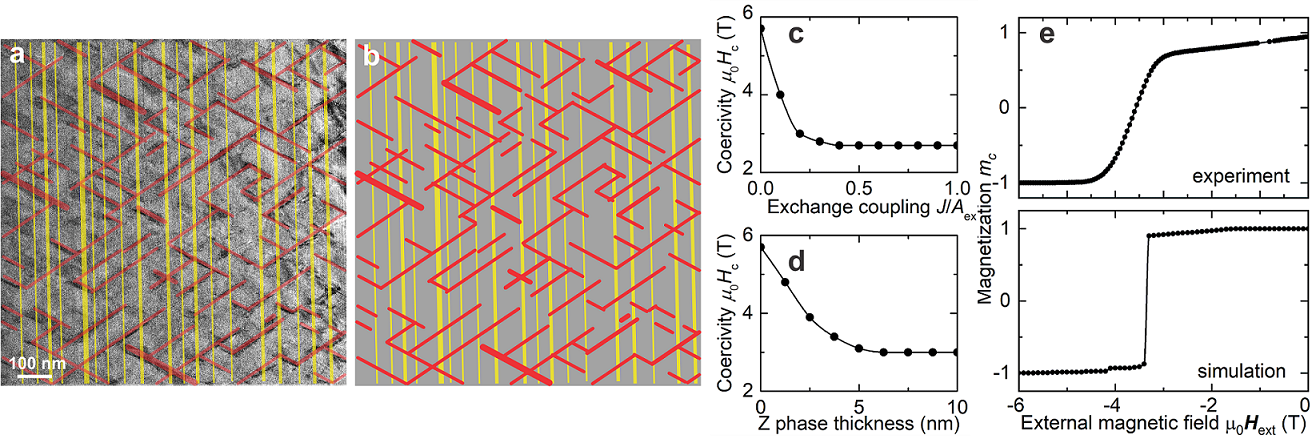
In the simulations that we discuss in the following section, the thicknesses of the cell boundary and the Z phase were derived directly from the TEM images, where we have 10 nm thick SmCo5 cells and 1 to 5 nm thick Z-phase platelets. Figure 3e shows an experimentally measured (see Methods) and a simulated curve along the easy axis, confirming the agreement between experiment and theory, specifically the value of the remanence and a gradual decrease of the magnetization upon reversing the external field prior to the full magnetization switching at 3.4 T. Our simulations indicate that the gradual decrease is due to the magnetically isotropic defects that reverse their magnetization earlier than the rest of the material, which is yet another confirmation that the Z phase does not exhibit significant magnetocrystalline anisotropy. Note that the curves are not identical, because the experiment was performed on a bulk sample, where we have gradual switching of parts of the material, while the theory considers a single thin lamella. Furthermore, the lamella with a thickness/width aspect ratio of about 1/1000 has an additional shape anisotropy, though much smaller than the magnetocrystalline anisotropy .
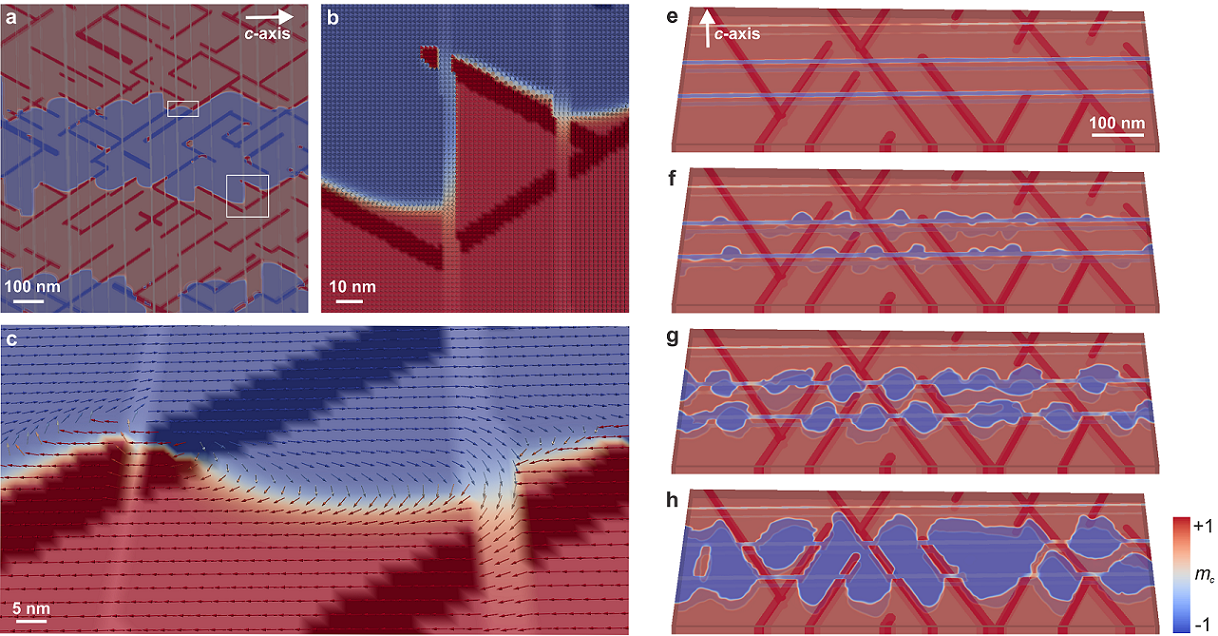
In order to study the magnetization texture in cellular Sm–Co magnets, we compare simulated domain-wall structures with those observed in the experiment. Fig. 4a shows an experimental Fresnel defocus image at 0.24 mm overfocus of the region shown in Fig. 3 in the thermally demagnetized state, which contains magnetic domains separated by three domain walls with the characteristic zig-zag shape following the microstructure. In our simulations, we initialized the system with three straight DWs and ran it for 1 ns to allow the domain walls to relax into the state of minimal energy. The resulting relaxed magnetization texture is overlaid in Fig. 4b onto its corresponding TEM image. The positions of the domain walls in the experimental LTEM image (white intersected lines) and the simulated magnetization image match very closely. In fact, in both cases the domain walls follow precisely the microstructure. Additionally, small magnetic domains with opposite magnetization approximately 5 nm wide are present (white circles in Fig. 4), which form due to strong pinning to SmCo5. In order to directly correlate the micromagnetics with experimental observation, a magnetic phase shift image has been calculated based on the micromagnetic results (see Methods). From it, a Fresnel image and a magnetic induction map were reconstructed and shown in Figs. 4c and d, respectively. A close match between the theory and experiment is apparent, as the simulated images contain features, such as domain wall offsetting and curling, identical to those observed in Fig. 2. Additionally, the micromagnetic simulation reveals that the curling is out-of plane (see Figure 5).
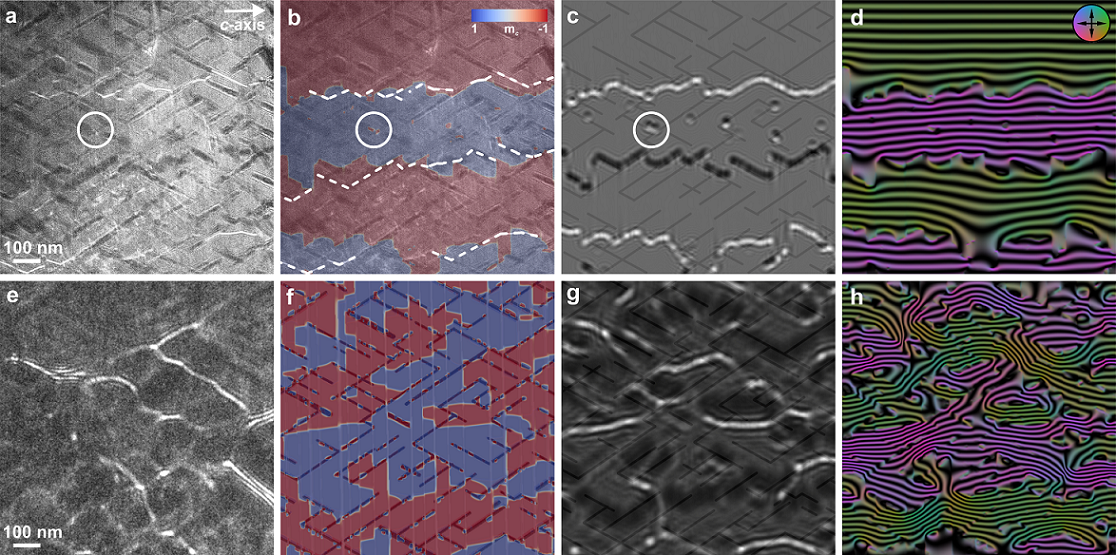
Furthermore, we ramped up the magnetic field to saturate the sample in both the experiment and the simulation and then removed the field to observe the remanent state. As we know from Fig. 3e, this corresponds to , meaning that one would expect the magnetization to be nearly uniform in the remanent state, but surprisingly this is not the case. Figure 4e, which shows an experimental Fresnel image of the remanent state (after applying an external field of 6 T) at 0.8 mm overfocus, reveals a state with a complex network of domains separated by branching domain walls (note that the region shown in Fig. 4e is not the same as in Fig. 4a.). This state represents initial nucleation stages of the magnetization process. Some domain walls have strong contrast with multiple lines of three or more satellites, which are only visible for domain walls that are perfectly edge-on. Lower-degree domain walls usually form weak and fading satellites. In Fig. 4f, the simulated magnetization state, again very similar to the experiment, contains a large number of small domains with opposite magnetization pinned to the SmCo5 cells. These are the smallest possible domains, around 5 nm wide, constrained by the domain-wall width. We have again simulated a magnetic phase image from the micromagnetic simulation, from which we extracted a Fresnel defocus image and a magnetic induction map, shown in Fig. 4g and h, respectively. The magnetic texture shows a good match with the experiment, notably the complex DW network. The magnetic induction map reveals the presence of vortex-like out-of-plane curling in the remanent state.
In the following, we take a deeper look into our simulations beyond the experimental limitations. Figure 5 shows the magnetization as contour plots overlaid onto the microstructure. Note the prominent resemblance of Fig. 5a with the Fresnel defocus images of Fig. 2, i.e. the DWs follow exactly the SmCo5 cell geometry, including the offsetting by the Z phase platelets. Figure 5b shows a close-up image of the magnetization texture around intersections between the three phases for the region marked with a square in Fig. 5a. By fitting a magnetization profile across the domain wall with , where is the distance from the domain-wall center and , we have deduced the DW width in the SmCo5 and the Sm2Co17 phases to be 1.5 nm and 4.7 nm, respectively. These values are slightly larger than the theoretically expected values of 1.2 nm and 2.7 nm using the equation , but they agree with our experimental observation of the domain-wall thickness of 4 2 nm (see Suppl. Fig. 2). This confirms our conclusion that the domain walls are mostly located in Sm2Co17 and pinned to the the SmCo5 cell. The minimum domain size of 5 nm is also shown in Fig. 5b at the left edge of the SmCo5 cell that is intersected by a Z phase platelet. Notably, the DWs inside the Z phase are extremely thin, and the moments turn away from the -axis due to the dominating shape anisotropy of the platelets. This indicates that the DWs between the Sm–Co phases and the Z phase are in fact DWs. To minimize the associated exchange energy, the magnetic moments are twisted with opposite handedness at the edges of the SmCo5 cell boundary. This is further analyzed in Fig. 5c, which shows a detailed view of a region where the three phases intersect and a domain wall propagates through all of them. We observe a narrow domain wall in the SmCo5 cell, a broader wall in the Sm2Co17 cell, and a curling of the moments away from the -axis inside the Z phase. The curling has a significant out-of-plane component. The domain wall is in fact injected into the hard phase at the location where the three phases meet. These results shed new light on previous observations based on electron microscopy okabe2006 , which suggested an out-of-plane tilting of the magnetic flux away from the easy axis around intersections.
The points in the microstructure where the three phases intersect play a critical role in the magnetization process because their edges with different material properties enable curling instabilities. We show in Fig. 5e-h the process of magnetization reversal, i.e., coming from a saturated state and applying an external field in the opposite direction. The demagnetization starts at the intersections between the Z phase and the soft Sm2Co17 matrix in the form of nucleating domains that gradually grow inside the Sm2Co17 matrix, and become pinned by the hard SmCo5 cells. The domain growth then progresses through the intersections where all three phases meet and crosses the SmCo5 cells through these points. This further indicates that the Z phase does indeed play a vital role in the magnetization process, emerging as an interplay between curling instabilities at intersections between the Z phase and the Sm2Co17 matrix, and pinning at the hard cells. Importantly, this demagnetization process might also be responsible for the formation of DWs with higher winding angles, such as those observed in Fig. 2.
III Conclusions
We have shown via magnetic imaging in TEM, APT and micromagnetic simulations that there are sharp magnetic DWs in cellular Sm–Co magnets that follow exactly the morphology of the hard-phase cells and are offset by the Z-phase platelets. Based on our finding that the domain walls are mostly located in the soft Sm2Co17 phase, reminiscent of an exchange spring system kneller1991 , we propose that the thickness of SmCo5 cells should be reduced to a minimum, considering that the domain walls in SmCo5 are only about 1.5 nm wide. Importantly, we have confirmed that the Z phase plays a crucial role in the magnetization process because curling instabilities at the intersections between the soft and Z phase act as nucleation sites for DWs upon switching the external magnetic field. The domain walls propagate inside the soft Sm2Co17 matrix and become pinned at the SmCo5 hard cells. In that case they can only propagate further through the intersections between the cells and the Z phase. Hence, we propose that both the Zr and Sm contents should be reduced in this system. This would result in finer Zr platelets, which would impede magnetization switching, and the reduced Sm would lead to smaller SmCo5 cells, which would in turn increase remanence, leading to a much more powerful magnet. Additionally, we have observed topologically non-trivial domains with highly-complex DWs, and, where all three phases meet, out-of-plane curling of domain walls. These exotic magnetic structures need to be studied further in order to understand the physics of multi-phase magnets in detail and to allow fully harnessing the potential of these high-performance materials.
IV Methods
IV.1 Sample synthesis:
For the synthesis of the Sm–Co magnet, the alloying elements were melted in an induction furnace under argon and the resulting alloy was cast in a metallic mold. After crushing the alloy with a hammer mill, the resulting powder was milled in a jet mill with a particle size of 4 – 8 m. The powder was then filled into a rubber mold, aligned with magnetic pulses of field strength 5 T and pressed in an isostatic press with 3000 MPa. The green parts were sintered under vacuum at a temperature of 1200–1220 ∘C, solution annealed at 1170–1200 ∘C, and then quenched with an inert gas to room temperature. Subsequently, the parts were tempered at 850 ∘C, slowly cooled to 400 ∘C, and then quenched to room temperature.
The material was produced by Arnold Magnetic Technologies, and has an overall chemical composition Sm(Co0.695,Fe0.213,Cu0.07,Zr0.022)7.57 with a minor additional oxygen content in the form of Sm2O3.
IV.2 Magnetometry:
The magnetization of a small sample piece along the easy axis was measured as a function of external field at room temperature using a Superconducting Quantum Interference Device (SQUID) in a Magnetic Property Measurement System (MPMS3) by Quantum Design.
IV.3 Transmission Electron Microscopy:
Electron-transparent specimens for TEM studies were prepared using Ga+ sputtering and a conventional lift-out method in Helios 600i dual-beam focused ion beam (FIB) scanning electron microscope (SEM) workstation. The ion-beam induced damage on the surfaces was reduced by low-energy ( 1 keV) Ar+ milling using a Fischione Nanomill system. The thickness of the lamellae was measured on an FEI Tecnai F30 FEG transmission electron microscope using an electron energy loss spectroscopy (EELS) log-ratio technique. A uniformly varying range of thicknesses between 80 - 140 nm was achieved.
The Sm–Co specimens were studied at remanence in magnetic-field-free (Lorentz mode) conditions using a spherical aberration-corrected FEI Titan microscope operated at 300 keV. In Fresnel-mode LTEM images, the intensity distribution at defocus is recorded to reveal a bright (convergent) or dark (divergent) contrast at the positions of the magnetic domain walls. The net deflection of electrons from the magnetic domains is induced by the Lorentz force, , where is the electron charge, v is the velocity of the incident electrons and B is the in-plane magnetic induction in the sample. A conventional microscope objective lens was used to apply magnetic fields on the specimen. TEM images were recorded using a direct-electron counting Gatan K2-IS camera and Gatan Microscopy Suite software. Electron holograms were recorded in Lorentz mode using a biprism positioned in one of the conjugated image planes of the electron column. The biprism voltage used was typically in the range of 90-100 V that forms a fringe spacing of 3 nm with a contrast of 75%.
IV.4 Micromagnetic simulations:
High-resolution micromagnetic simulations were performed to investigate the link between the microstructure and the domain-wall network in Sm–Co magnets. The total energy density of the system consists of: (i) ferromagnetic exchange; (ii) uniaxial magnetocrystalline anisotropy; (iii) Zeeman coupling to an external magnetic field; and (iv) dipole-dipole interactions:
| (1) | ||||
where is the magnetization unit vector for phase with the saturation magnetization, is the exchange stiffness, is the first-order uniaxial anisotropy constant, is the external magnetic field, is the local demagnetizing field due to dipole-dipole interactions, and is the exchange field at the interfaces between the different phases. The -component of the magnetization is inside the lamella plane.
The material parameters were taken from the literature katter1996 ; nagel2003 ; duerrschnabel2017 , and are T, pJ/m, and MJ/m3 for SmCo5; T, pJ/m, and MJ/m3 for Sm2Co17; and T, pJ/m, and MJ/m3 for the Z phase. Note that Cu in the SmCo5 changes the material parameters by lowering , and , but the composition of Cu in our material is less than 10% of the 3d metal content and the material parameters are not strongly reduced SepehriAmin2017 . We also performed tests with the material parameters of Sm(Co0.9Cu0.1)5 and found no qualitative difference in the behavior of the system. The simulations were tested for the lamella thickness between 50 and 100 nm, and qualitatively the same results have been obtained.
The exchange field between two phases and is proportional to . Based on our optimization, described in the main text, we found the following exchange values: (i) hard to soft: 16 pJ/m; (ii) soft to hard: 13 pJ/m; (iii) soft to Z phase: 4.4 pJ/m; (iv) Z-phase to soft: 1.3 pJ/m; (v) hard to Z phase: 2.7pJ/m; and (vi) Z phase to hard: 0.95 pJ/m.
Using Equation 1, we solved the Landau-Lifshitz-Gilbert (LLG) equation of motion
| (2) |
where is the electron gyromagnetic ratio, is the dimensionless damping parameter, and is the effective magnetic field in the material consisting of external and internal magnetic fields, which depend on the material parameters. The simulations have been done with mumax3 vansteenkiste2014 , and the visualization of the magnetization textures was done with Paraview paraview .
IV.5 Atom probe tomography:
The needle-shaped geometry required for APT analysis was prepared by applying standard lift-out practices using an FEI Helios Focused Ion Beam 600i workstation, and mounting it to a flat-top microtip coupon supplied by Cameca. Sequential annular milling was applied to achieve an apex of 70 nm diameter, including low-kV cleaning, resulting in 0.01 at.% Ga in the top 10 nm of the specimen. Data collection was performed using a LEAP4000X-HR instrument applying 100 pJ laser pulse energy with 200 kHz repetition rate and a specimen temperature of 54 K (resulting in a Co charge-state ratio (Co++/Co+) between 5 and 10). With these parameters and a chamber vacuum level at 10-9 Pa, data were collected between 5 kV and 9.5 kV with a background level consistently below 20 ppm/ns. The atom-map reconstruction was validated by considering that the Z-platelets are atomically flat, and spatial distribution maps were performed along the c-axis (normal to the platelets) to measure the lattice spacings and thereby validate the accuracy of the atom-map reconstruction dimensions.
IV.6 Magnetic phase image and LTEM simulations:
The electromagnetic phase shift induced in an electron wave by passing through a sample is described by the Aharonov-Bohm effect and can be expressed as DuninBorkowski.2004 :
| (3) | ||||
| (4) |
with and denoting the electrostatic and magnetic contributions to the phase shift, the interaction constant , the magnetic flux quantum , the Lorentz factor , the electron rest mass and the electron wavelength . Furthermore, with is the component of the magnetic vector potential , where corresponds to the incident electron beam direction Ehrenberg.1949 ; Aharonov.1959 .
The magnetization in the sample is linked to the vector potential by the vector convolution integral Mansuripur.1991
| (5) |
where is the vacuum permeability is the vacuum permeability. Using both equations, the magnetic phase shift can be expressed in terms of the magnetization as
| (6) |
By discretizing this equation and utilizing known analytical solutions for the magnetic phase of simple magnetized geometries, magnetic phase images can be calculated for arbitrary magnetization distributions Caron.2018 .
”Contour maps” are used for the visualization of the magnetic phase in the form of magnetic induction. They are generated in Figs. 2 and 4 by taking the cosine of the magnetic phase , which can be amplified beforehand to increase the number of fringes for visualization purposes. A color scheme is superimposed on the magnetic induction maps, which is determined by the gradient of . The latter is an indicator of the direction of the projected in-plane magnetic induction and is indicated in Figs. 2e and 4d as a color wheel. The phase difference between two neighboring contours is .
The magnetic phase can further be utilized to simulate LTEM images by convolving the corresponding wave function with a phase plate:
| (7) |
with denoting the 2D Fourier transform, its inverse and denoting an aberration function Barthel.2018 in the diffraction space containing the defocus (with positive referring to overfocus) given by:
| (8) |
The LTEM images are then calculated from the corresponding electron wave by:
| (9) |
V Supplementary information
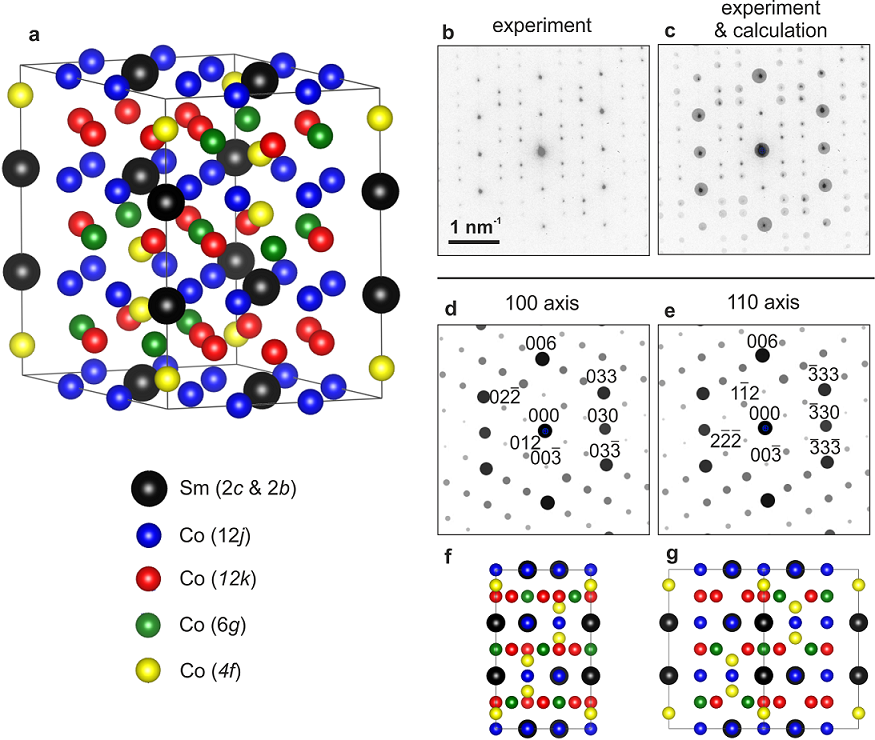
Supplementary Figure 1 shows for the sample of Fig. 1 in the main text a diffraction pattern that contains the reflections from [100] and [110] directions. The experimental and simulated patterns reveal an excellent agreement.
The width of the domain-wall contrast of 4 2 nm at zero defocus was extrapolated from a series of LTEM images recorded at different defocus values, as shown in Supplementary Fig. 2. It is worth mentioning that this approach usually gives a slight overestimate of the true domain-wall width.
An atom-probe tomography (APT) reconstruction is shown in the Supplementary Video 1. Isoconcentration surfaces of 9.83 at. % Zr indicate flat Z-phase platelets, while the isoconcentration surfaces of 14.51 at. % Sm reveal a twisted SmCo5 cell. Note the accumulation of Cu inside the cells (pink).
References
- (1) Hadjipanayis, G. C. et al. High temperature 2:17 magnets: Relationship of magnetic properties to microstructure and processing. IEEE Trans. Magn. 36, 3382 (2000).
- (2) Gutfleisch, O. et al. Magnetic materials and devices for the 21st century: Stronger, lighter, and more energy efficient. Adv. Mat. 23, 821 (2011).
- (3) McCallum, R. W., Lewis, L. H., Skomski, R., Kramer, M. J. & Anderson, I. E. Practical aspects of modern and future permanent magnets. Annu. Rev. Mater. Res. 44, 451 (2014).
- (4) Horiuchi, Y. et al. Effects of solution treated temperature on the structural and magnetic properties of iron-rich Sm(Co,Fe,Cu,Zr)z sintered magnet. IEEE Transactions on Magnetics 49, 3221–3224 (2013).
- (5) Liu, J. F., Zhang, Y., Dimitrov, D. & Hadjipanayis, G. C. Microstructure and high temperature magnetic properties in Sm(Co,Cu,Fe,Zr)z () permanent magnets. J. Appl. Phys. 85, 2800 (1999).
- (6) Duerrschnabel, M. et al. Atomic structure and domain wall pinning in samarium-cobalt-based permanent magnets. Nat. Comm. 8, 54 (2017).
- (7) Kronmüller, H., Fischer, R., Seeger, M. & Zern, A. Micromagnetism and microstructure of hard magnetic materials. J. Phys. D: Appl. Phys. 29, 2274 (1996).
- (8) Skomski, R. et al. Predicting the future of permanent-magnet materials. IEEE Transactions on Magnetics 49, 3215–3220 (2013).
- (9) Skomski, R. Domain-wall curvature and coercivity in pinning type Sm–Co magnets. J. Appl. Phys. 81, 5627 (1997).
- (10) Fidler, J. & Schrefl, T. Micromagnetic modelling – the current state of the art. J. Phys. D: Appl. Phys. 33, R135 (2000).
- (11) Streibl, B., Fidler, J. & Schrefl, T. Domain wall pinning in high temperature Sm(Co,Fe,Cu,Zr)7-8 magnets. J. Appl. Phys. 87, 4765 (2000).
- (12) Fidler, J. et al. Micromagnetic modelling and magnetization processes. J. Magn. Magn. Mater. 272-276, 641–646 (2004).
- (13) Gaunt, P. Domain wall pinning as a source of magnetic hardening in alloys. J. Appl. Phys. 43, 637–638 (1972).
- (14) Livingston, J. D. & Martin, D. L. Microstructure of aged (Co,Cu,Fe)7Sm magnets. J. Appl. Phys. 48, 1350 (1977).
- (15) Nagel, H. Coercivity and microstructure of Sm(Co0.87Cu0.13)7.8. J. Appl. Phys. 50, 1026–1030 (1979).
- (16) Hadjipanayis, G. C., Yadlowsky, E. J. & Wollins, S. H. A study of magnetic hardening in Sm(Co0.69Fe0.22Cu0.07Zr0.02)7.22. J. Appl. Phys. 53, 2386 (1982).
- (17) Fidler, J. Coercivity of precipitation hardened cobalt rare earth 17:2 permanent magnets. J. Magn. Magn. Mater. 30, 58 (1982).
- (18) Wong, B. Y., Willard, M. & Laughlin, D. E. Domain wall pinning sites in Sm(CoFeCuZr)x magnets. J. Magn. Magn. Mater. 169, 178 (1997).
- (19) Zhang, C. et al. The evolution of phase constitution and microstructure in iron-rich 2:17-type Sm-Co magnets with high magnetic performance. Scientific Reports 8 (2018).
- (20) Hadjipanayis, G. C., Hazelton, R. C., Lawless, K. R. & Horton, L. S. Magnetic domains in rare-earth cobalt permanent magnets. IEEE Trans. Magn. 18, 1460 (1982).
- (21) Zhang, Y. et al. Magnetic hardening studies in sintered Sm(Co,Cux,Fe,Zr)z 2:17 high temperature magnets. J. Appl. Phys. 87, 6722 (2000).
- (22) Gutfleisch, O. et al. Evolution of magnetic domain structures and coercivity in high-performance SmCo 2:17-type permanent magnets. Acta Materialia 54, 997–1008 (2006).
- (23) Okabe, F. et al. Microstructures and magnetic domain structures of sintered Sm(Co0.720Fe0.200Cu0.055Zr0.025)7.5 permanent magnet studied by transmission electron microscopy. Mat. Trans. 47, 218 (2006).
- (24) Sepehri-Amin, H. et al. Correlation of microchemistry of cell boundary phase and interface structure to the coercivity of Sm(Co0.784Fe0.100Cu0.088Zr0.028)7.19 sintered magnets. Acta Materialia 126, 1–10 (2017).
- (25) Katter, M., Weber, J., Assmus, W., Schrey, P. & Rodewald, W. A new model for the coercivity mechanism of Sm2(Co,Fe,Cu,Zr)17 magnets. IEEE Trans. Magn. 32, 4815 (1996).
- (26) Fullerton, E. E., Jiang, J. S. & Bader, S. D. Hard/soft magnetic heterostructures: model exchange-spring magnets. J. Magn. Magn. Mater. 200, 392-404 (1999).
- (27) Tian, Y. et al. In Situ Observation of Domain Wall Pinning in Sm(Co,Fe,Cu,Zr)z Magnet by Lorentz Microscopy. IEEE Trans. Magn. 51, 11 (2015).
- (28) Nagel, H. Hard magnetic materials: rare earth-transition metal and Fe-Nd-B, vol. 2A1 of Landolt-Börnstein - Group VIII Advanced Materials and Technologies, chap. Powder Metallurgy Data (SpringerMaterials, 2003).
- (29) Hellman, F. et al. Interface-induced phenomena in magnetism. Reviews of Modern Physics 89 (2017).
- (30) Charilaou, M. et al. Magnetic properties of ultrathin discontinuous Co/Pt multilayers: Comparison with short-range ordered and isotropic CoPt3 films. Phys. Rev. B 93 (2016).
- (31) Shen, Y., Leontsev, S., Sheets, A. O., Horwath, J. C. & Turgut, Z. Effect of flake thickness on coercivity of nanocrystalline SmCo5 bulk prepared from anisotropic nanoflake powder. AIP Advances 6, 056005 (2016).
- (32) Nishida, Y., Endo, M. & Sakurada, S. A modeling study of domain wall pinning in magnets. Journal of Magnetism and Magnetic Materials 324, 1948–1953 (2012).
- (33) Kronmüller, H. & Goll, D. Micromagnetic analysis of pinning-hardened nanostructured, nanocrystalline Sm2Co17 based alloys. Scripta Materialia 47, 545–550 (2002).
- (34) Kneller, E. F. & Hawig, R. The exchange-spring magnet: a new material principle for permanent magnets. IEEE Trans. Magn. 27, 3588 (1991).
- (35) Vansteenkiste, A. et al. The design and verification of mumax3. AIP Advances 4, 107133 (2014).
- (36) Ahrens, J., Geveci, B. & Law, C. Visualization Handbook, chap. ParaView: An End-User Tool for Large Data Visualization (Elsevier, 2005).
- (37) Dunin-Borkowski, R. E. et al. Off-axis electron holography of magnetic nanowires and chains, rings, and planar arrays of magnetic nanoparticles. Microscopy Research and Technique, 390–402 (2004).
- (38) Y. Aharonov and D. Bohm. Significance of electromagnetic potentials in the quantum theory. Physical Review, 485–491 (1959).
- (39) W. Ehrenberg and R. E. Siday. The refractive index in electron optics and the principles of dynamics. Proceedings of the Physical Society. Section B, 8 (1949).
- (40) M. Mansuripur. Computation of electron diffraction patterns in lorentz electron microscopy of thin magnetic films. Journal of Applied Physics, 2455 (1991).
- (41) Jan Caron. Model-based reconstruction of magnetisation distributions in nanostructures from electron optical phase images, Schriften des Forschungszentrums Jülich. Reihe Schlüsseltechnologien/Key technologies 17. (2018).
- (42) J. Barthel. Dr. probe: A software for high-resolution stem image simulation. Ultramicroscopy, 1–11 (2018).
Acknowledgments
LP, MC, RES and JFL gratefully acknowledge funding from the Swiss National Science Foundation (Grant No. 200021–172934). We also thank L. Grafulha Morales and A.-G. Bitterman for the preparation of TEM samples, and ScopeM ETH Zurich for the use of its facilities.
Correspondence
Correspondence and requests for materials should be addressed to LP (email: leonardo.pierobon@mat.ethz.ch), JFL (email: joerg.loeffler@mat.ethz.ch) and MC (email: michalis.charilaou@louisiana.edu).