Dynamics, radiation and overall energy budget of earthquake rupture with coseismic off-fault damage
Abstract
Earthquake ruptures dynamically activate coseismic off-fault damage around fault cores. Systematic field observation efforts have shown the distribution of off-fault damage around main faults, while numerical modeling using elastic-plastic off-fault material models has demonstrated the evolution of coseismic off-fault damage during earthquake ruptures. Laboratory scale micro-earthquake experiments have pointed out the enhanced high-frequency radiation due to the coseismic off-fault damage. However, the detailed off-fault fracturing mechanisms, subsequent radiation and its contribution to the overall energy budget remain to be fully understood because of limitations of current observational techniques and model formulations. Here, we constructed a new physics-based dynamic earthquake rupture modeling framework, based on the combined finite-discrete element method (FDEM), to investigate the fundamental mechanisms of coseismic off-fault damage, and its effect on the rupture dynamics, the radiation and the overall energy budget. We conducted a 2-D systematic case study with depth and showed the mechanisms of dynamic activation of the coseismic off-fault damage. We found the decrease in rupture velocity and the enhanced high-frequency radiation in near-field due to the coseismic off-fault damage. We then evaluated the overall energy budget, which shows a significant contribution of the coseismic off-fault damage to the overall energy budget even at depth, where the damage zone width becomes narrower. The present numerical framework for the dynamic earthquake rupture modeling thus provides the insight into the earthquake rupture dynamics with the coseismic off-fault damage.
JGR-Solid Earth
Institut de Physique du Globe de Paris, Sorbonne Paris Cité, Université Paris Diderot, UMR 7154 CNRS, Paris, France. Laboratoire de Géologie, École Normale Supérieure/CNRS UMR 8538, PSL Research University, Paris, France. EES-17 - Earth and Environmental Sciences Division, Los Alamos National Laboratory, New Mexico, USA Currently working at Earth and Planetary Sciences, Harvard University, Cambridge, MA, USA.
K. Okubokurama_okubo@fas.harvard.edu
Earthquake ruptures dynamically activate coseismic off-fault damage, whose feedback plays an important role in rupture dynamics.
We show the mechanism of dynamically activated off-fault fractures, and its effect on rupture velocity and enhanced high-frequency radiation.
The contribution of off-fault damage to the overall energy budget associated with earthquakes is non-negligible even at depth.
1 Introduction
Coseismic off-fault damage has been recognized as a key factor towards understanding the mechanisms of dynamic earthquake ruptures and the associated overall energy budget. Sibson, (1977) conceptually proposed a formulation for the overall energy budget of dynamic earthquake ruptures; a part of the energy released from accumulated strain energy by interseismic deformation is converted to seismic wave radiation, whereas the rest is expended in inelastic deformation processes within fault zone. Wallace and Morris, (1986) then characterized the structure of fault zones from the observation of deep mines in North America, where fault cores are surrounded by fractured rock. Chester and Logan, (1986); Chester et al., (1993) also proposed similar fault zone structures based on field observations of San Gabriel and Punchbowl faults in southern California.
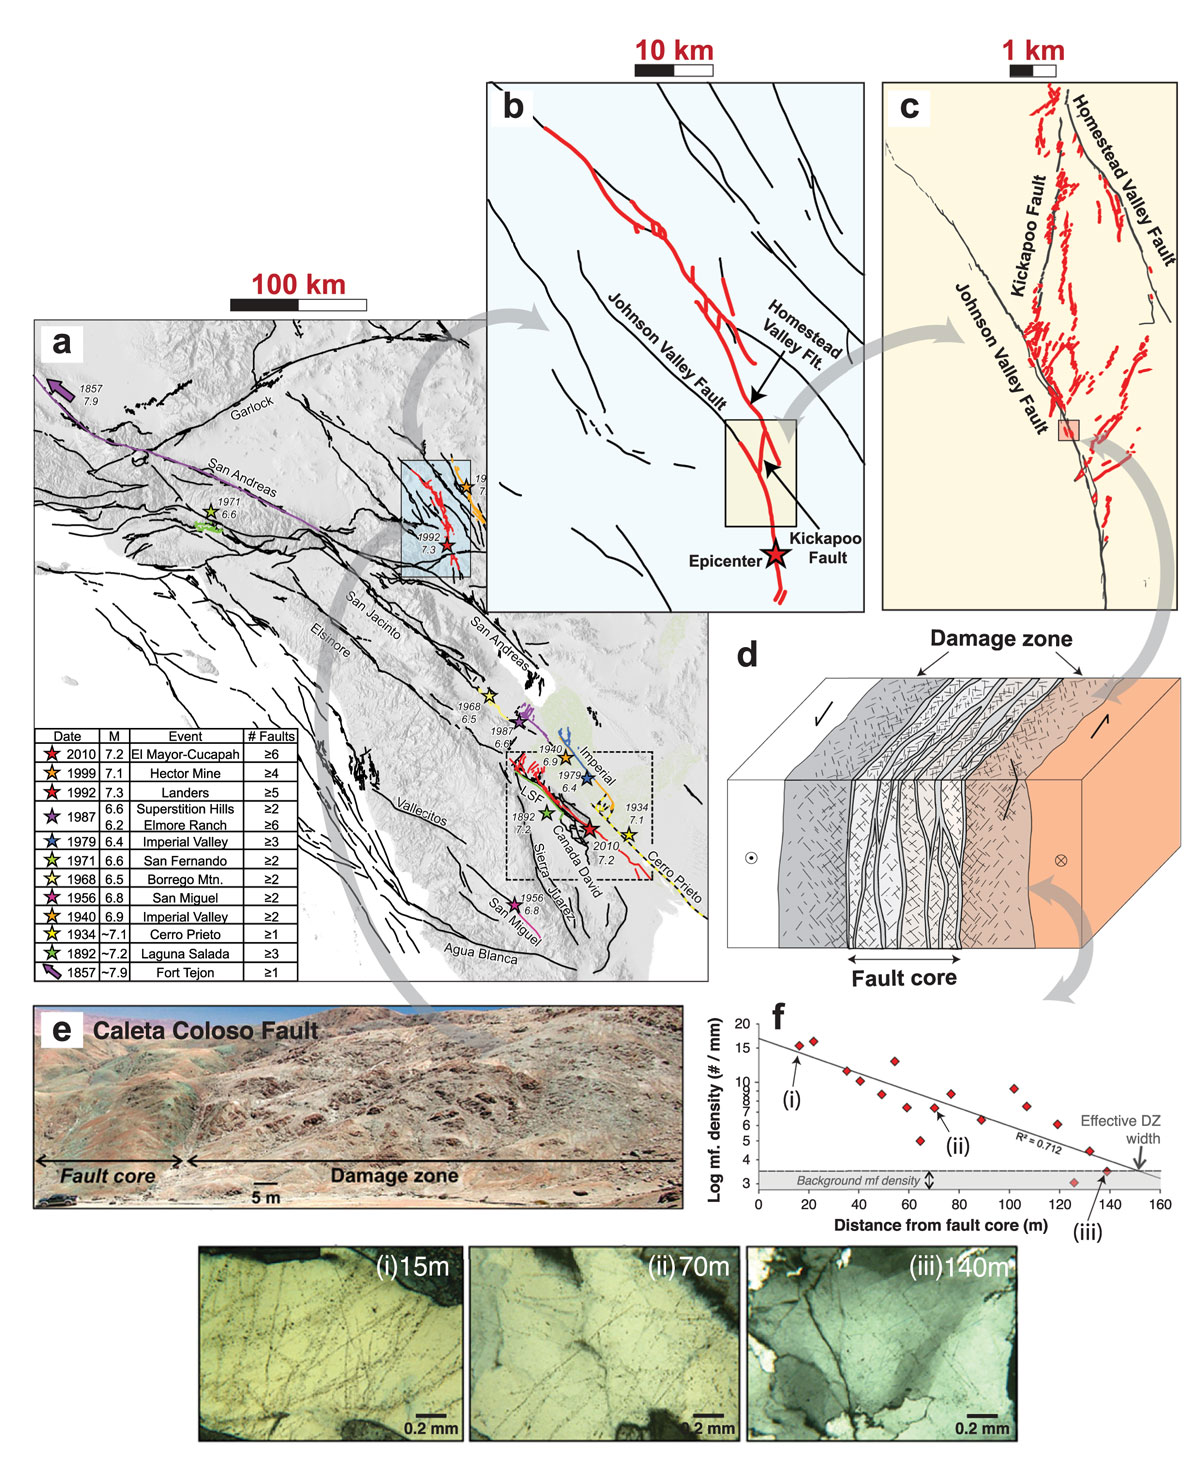
Figure 1 illustrates the schematic of a hierarchical fault structure across length scales ranging from regional fault systems to microfractures. The geometrical complexity of fault system is usually discussed in kilometric scale (Figures 1a and 1b). However, when focusing on a part of a fault system, smaller scale fracture networks are observed around faults after the earthquake rupture propagates on the main faults (Figure 1c). These mesoscopic off-fault fractures also have an effect on the displacement field around the faults (Manighetti et al.,, 2004; Cappa et al.,, 2014). Eventually, Figure 1d shows the fault zone structure involving microscopic fractures around the fault core. Field measurements of the microfracture density as a function of distance in fault-normal direction have been conducted in order to understand the spatial distribution and geometric characteristics of the off-fault damage zones (Shipton and Cowie,, 2001; Mitchell and Faulkner,, 2009; Faulkner et al.,, 2011; Savage and Brodsky,, 2011). Mitchell and Faulkner, (2012) showed that the microfracture density is significantly higher close to the fault and exponentially decreases with distance from the fault core, evidencing the presence of coseismic off-fault damage in microscale (Figures 1e and 1f). Since all these geometrical complexities of fractures in a wide range of length scale play a role in the faulting process, the modeling of coseismic off-fault damage is crucial to better understand the rupture dynamics, the radiation and the overall energy budget associated with earthquakes.
Numerous studies have been performed via theoretical approaches, experiments and numerical modeling to evaluate the effect of coseismic off-fault damage on the earthquake ruptures. Poliakov et al., (2002) and Rice et al., (2005) showed the potential failure area around rupture front with steady-state cracks and pulses based on theoretical formulations. Marty et al., (2019) performed laboratory experiments of labo-scale dynamic ruptures with saw-cut rock specimens. They found enhanced high-frequency radiation in acoustic recordings during stick-slip events, considered to be effected by the coseismic off-fault damage, which is of great interest for understanding the high-frequency components in near-field ground motion (Hanks,, 1982; Castro and Ben-Zion,, 2013).
The numerical modeling of coseismic off-fault damage has been also conducted to demonstrate the evolution of the off-fault damage activated by dynamic earthquake ruptures and its effect on the rupture dynamics (Yamashita,, 2000; Dalguer et al.,, 2003; Andrews,, 2005; Ben-Zion and Shi,, 2005; Ando and Yamashita,, 2007; Templeton and Rice,, 2008; Viesca et al.,, 2008; Ma and Andrews,, 2010; Dunham et al., 2011a, ; Bhat et al.,, 2012; Gabriel et al.,, 2013; Thomas and Bhat,, 2018). However, up to now state-of-the-art numerical techniques used for earthquake rupture modeling were not able to describe detailed off-fault fracturing processes as actual tensile and shear (Mode I and Mode II) fractures mainly due to limitations of computation and model formulations. Hence the role of coseismic off-fault damage activated by the dynamic earthquake ruptures remains to be fully understood. Therefore, our aim in this paper is to model the activation of off-fault fracture networks by dynamic earthquake ruptures to evaluate the effect of coseismic off-fault damage on the rupture dynamics, the radiation and the overall energy budget.
We used the combined finite-discrete element method (FDEM) to model the dynamic earthquake rupture with the coseismic off-fault damage. It allows for the activation of both off-fault tensile and shear fractures based on prescribed cohesion and friction laws so that we can quantify the effect of coseismic off-fault damage on the rupture dynamics, the radiation and the overall energy budget.
We firstly demonstrate the 2-D dynamic earthquake rupture modeling with coseismic off-fault damage. We then show the mechanisms of secondary off-fault fractures, and its effect on the rupture velocity and the radiation. Eventually, we calculate the evolution of energy components associated with the dynamic earthquake rupture to investigate the overall energy budget.
2 Dynamic earthquake rupture modeling with coseismic off-fault damage
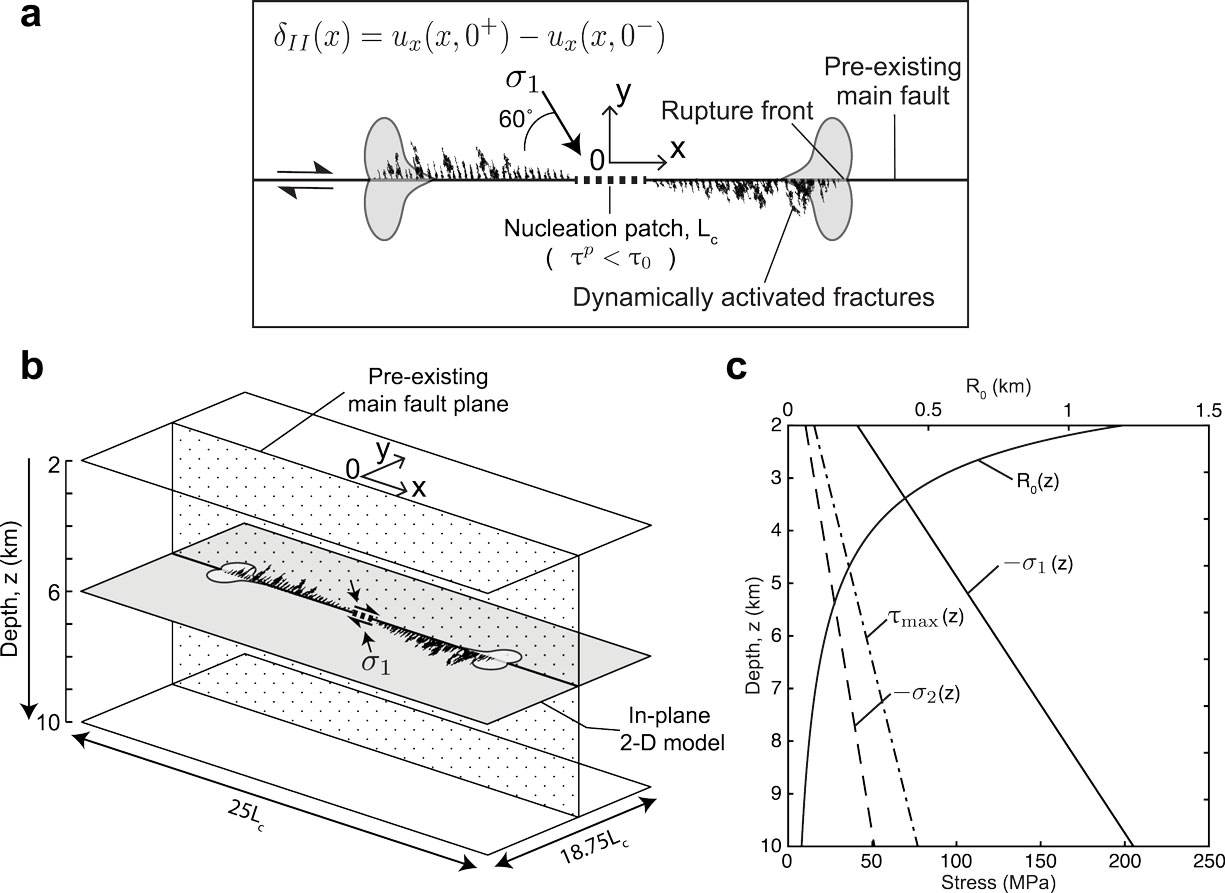
We performed the dynamic earthquake rupture modeling with a planar strike-slip fault in plane strain condition, surrounded by the intact rock, allowing for the activation of off-fault fractures. Figure 2a shows the model description for the 2-D dynamic earthquake rupture modeling. The rupture is artificially nucleated from the nucleation patch, where the peak friction is lower than the initial shear traction on the main fault. The size of nucleation patch is determined by the critical crack length (Palmer and Rice,, 1973). Then it propagates bilaterally on the main fault, dynamically activating off-fault fractures. The x axis is along the fault-parallel direction, while the y axis is along the fault-normal direction. Figure 2b shows the schematic of case study with depth. We performed a set of 2-D dynamic earthquake rupture modeling to investigate the evolution of coseismic off-fault damage and its effect with depth. The z axis is thus along depth. We conducted 2-D simulations at every 1km from z = 2km to 10km depth with corresponding initial stress state as shown in Figure 2c. We assume lithostatic condition with depth so that the confining pressure linearly increases with depth. The quasi-static process zone size (see eq. 29) decreases with depth when the fracture energy on the main fault is kept constant with depth (Figure 2c). Note that the case study does not address the 3-D effect (e.g. free surface) as we model the dynamic ruptures in plane strain condition.
For the sake of fair comparison between different depths, the model parameters are nondimensionalized by scaling factors. [m] and shear wave velocity [m/s] are used to scale the length [m] and the time [s] by and , respectively. Subsequently, other variables are also nondimensionalized by the combination of those two scaling factors. Since the density of medium does not change during simulations, the nondimensionalization of mass is not necessary in our problem.
The methodology of the combined finite-discrete element method (FDEM) is described in Appendix A. More details of the numerical framework to model dynamic earthquake rupture with FDEM can be found in Okubo, (2018). The parameters used for the case study with depth are summarized in Table LABEL:tab:parameters. We used FDEM-based software tool, Hybrid Optimization Software Suite - Educational Version (HOSSedu) for the dynamic earthquake rupture modeling (Knight et al.,, 2015). Before modeling dynamic earthquake ruptures with coseismic off-fault damage, we conducted the cross-validation of the FDEM using purely elastic medium to assess the achievable accuracy of earthquake rupture modeling. The results are summarized in Appendix B.
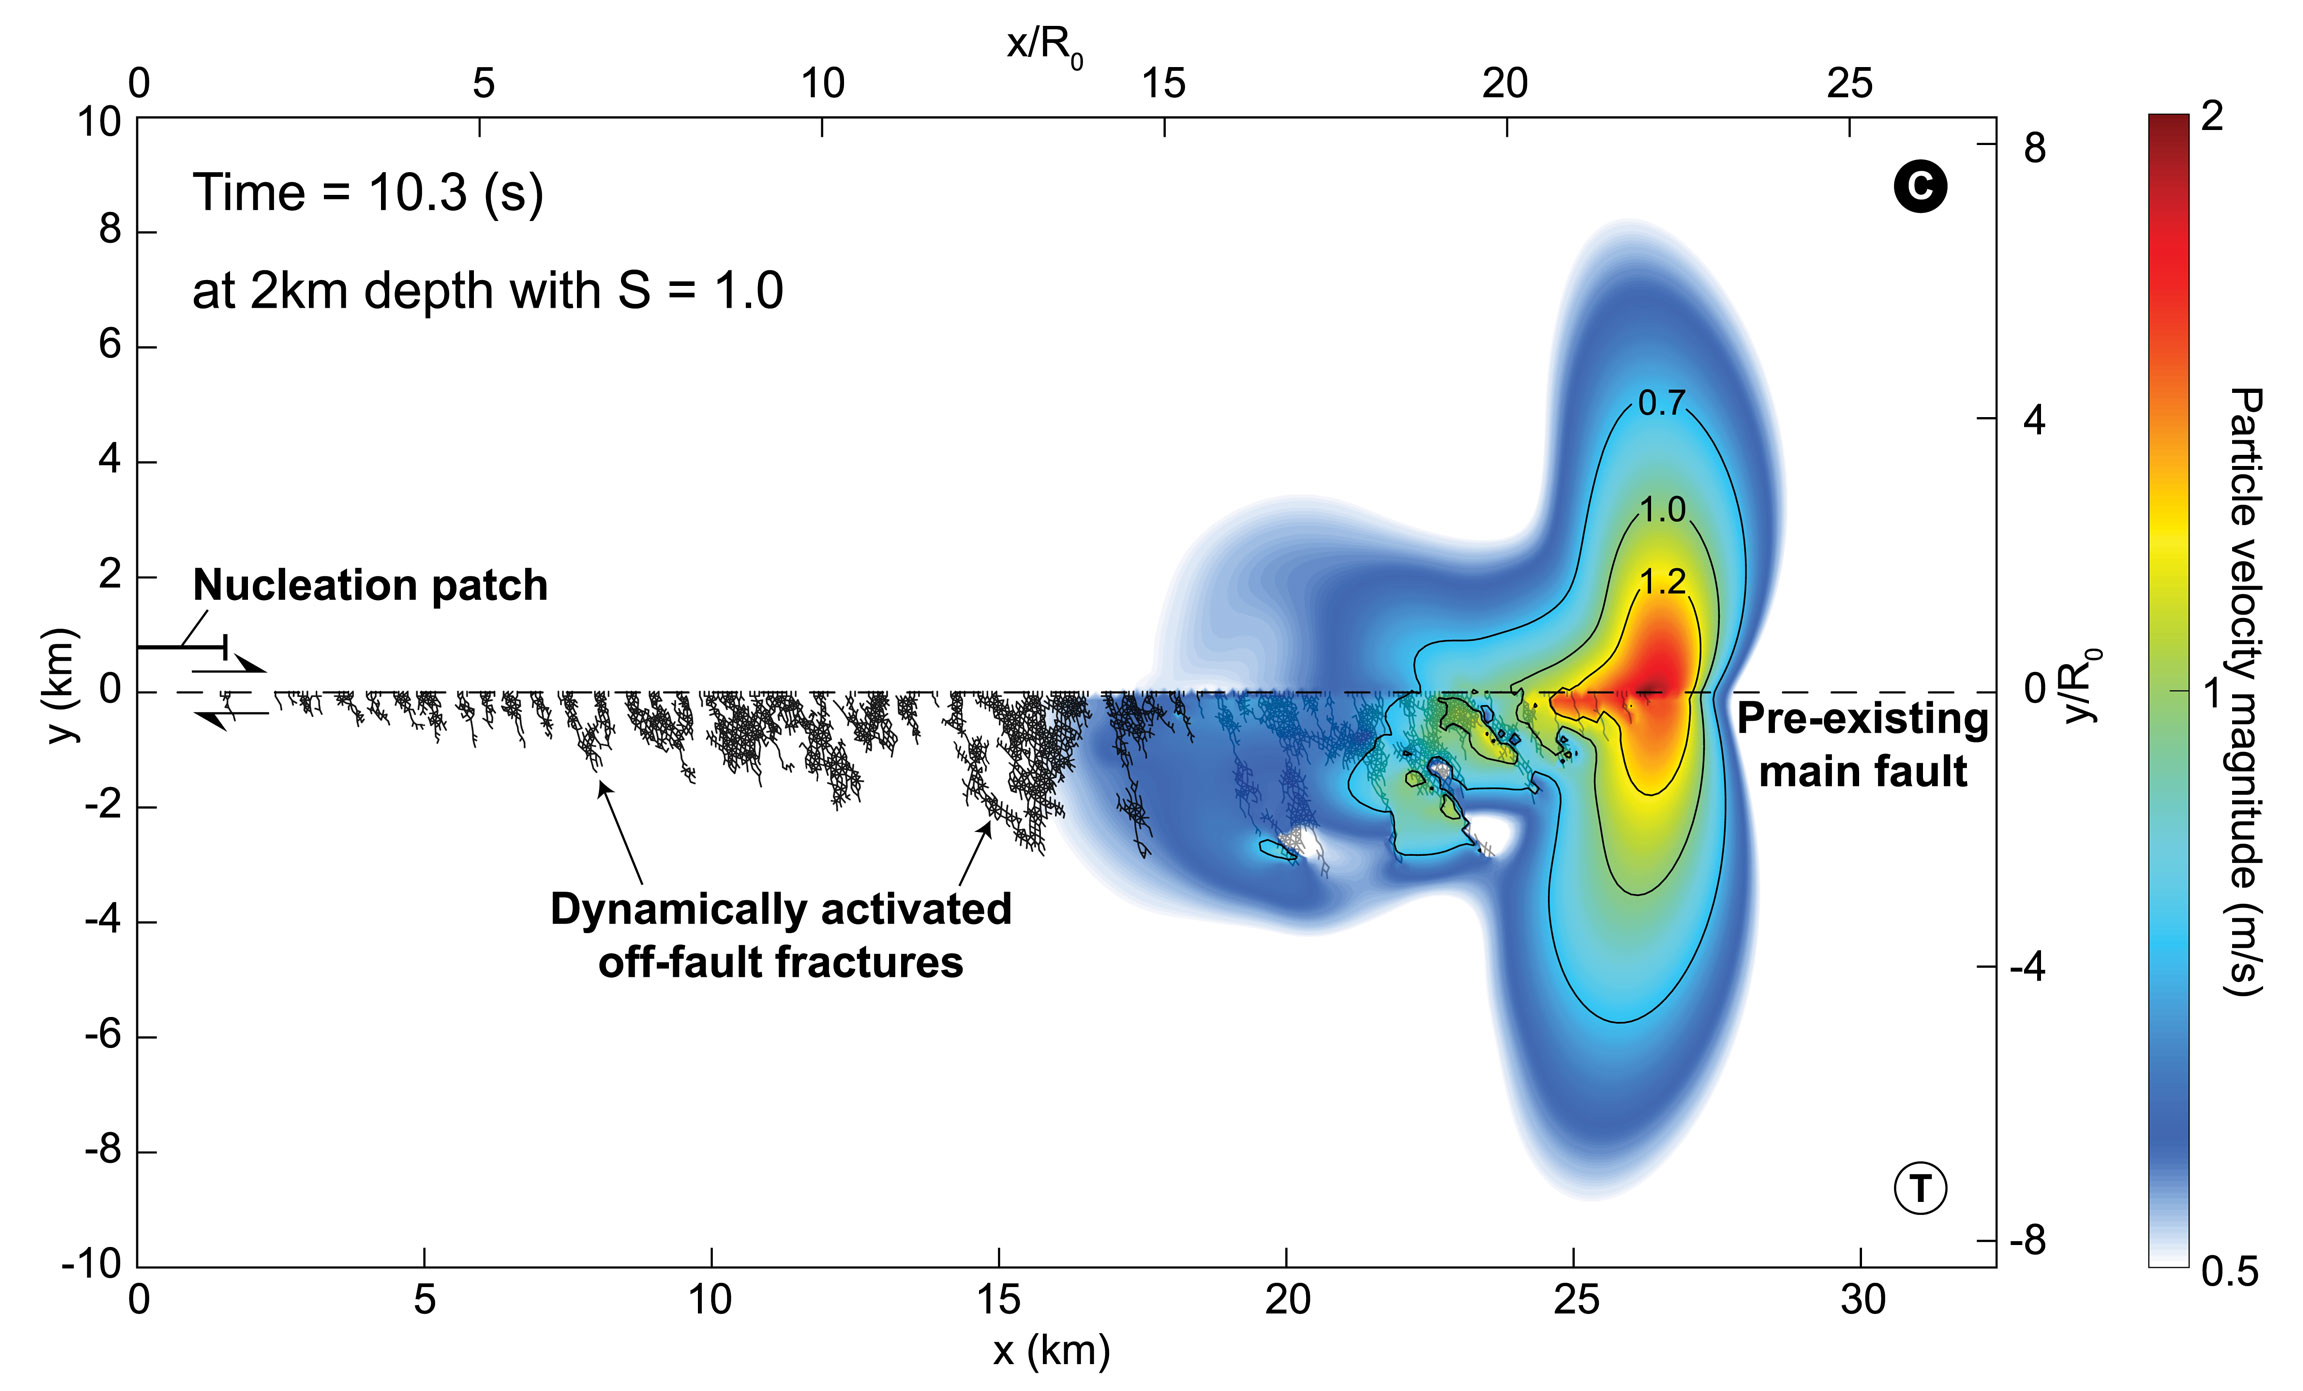
Figure 3 shows a snapshot of dynamic earthquake rupture with dynamically activated off-fault fractures, where particle velocity field and the fracture traces around the main fault are superimposed. The seismic ratio S is equal to 1.0 (see eq. 16), which results in the sub-Rayleigh rupture during the simulation with the coseismic off-fault damage. The off-fault fractures are plotted when the traction applied on the potential failure plane (i.e. boundary of meshes) reaches the cohesive strength and the cohesion starts weakening. Bottom and left axes indicate the fault-parallel and fault-normal distance in physical length scale, while top and right axes indicate the nondimensionalized length scale.
The off-fault fractures are initiated around the rupture tip, and then it forms an intricate fracture network as the main rupture propagates on the main fault. The particle velocity field is significantly perturbed due to the coseismic off-fault damage. The extensional side of the main fault is mostly damaged, which is supported by the theoretical analysis of potential failure area (Poliakov et al.,, 2002; Rice et al.,, 2005) and other simulations (e.g. Andrews,, 2005). The off-fault fractures form an intricate network by means of fracture coalescence, comprised of tensile, shear and mixed mode fractures. We later discuss this off-fault fracturing process under a relatively steep angle of the maximum compressive principal stress to the fault ( = 60∘), and its effect on the radiation in near-field and the overall energy budget.
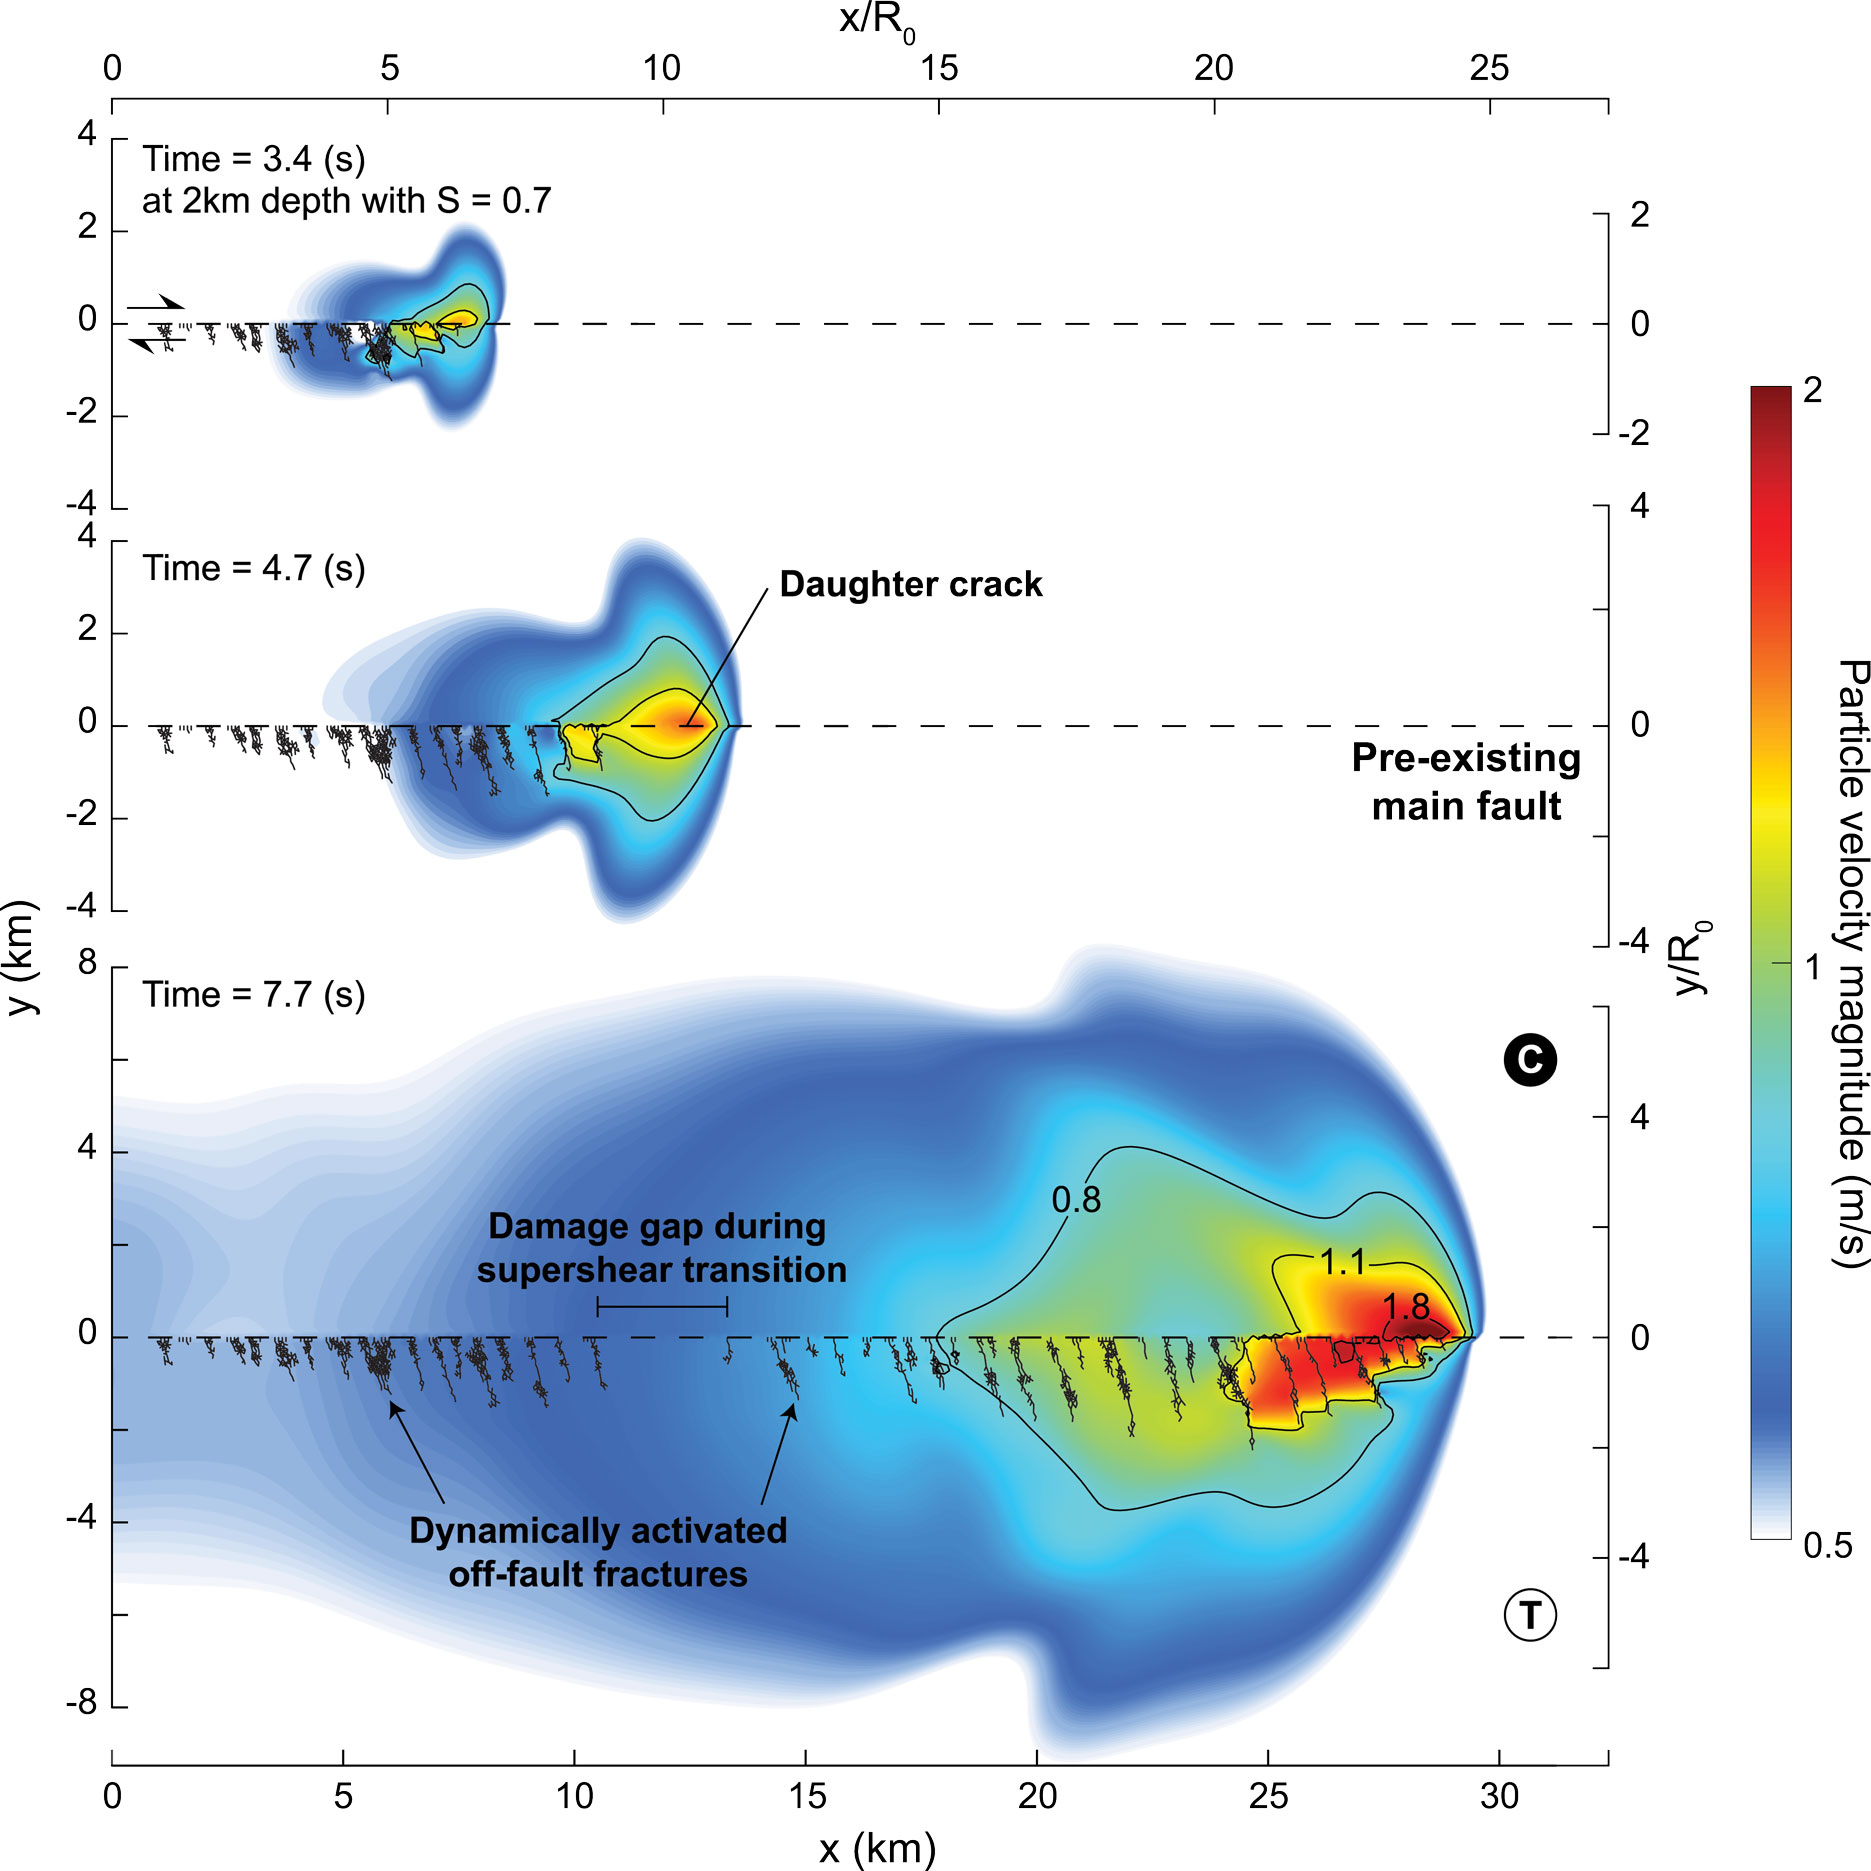
Figure 4 shows a set of snapshots for the supershear case with S = 0.7. The rupture is nucleated and propagates with sub-Rayleigh in the earlier phase. Then a daughter crack is born ahead of the rupture front at T = 4.7 s, which then transitions to supershear rupture. During the rupture transition from sub-Rayleigh to supershear, characteristic damage pattern appears; there is a gap of coseismic off-fault damage around the transition phase (around x = 12km in Figure 4). This characteristic damage gap has been also pointed out by Templeton and Rice, (2008) and Thomas and Bhat, (2018). This can be explained by the Lorentz contraction of the dynamic process zone size (see A.4). The dynamic process zone size asymptotically shrinks at the limiting speed of the rupture. Since the damage zone size is approximated as a same order of the process zone size, the damage gap appears during the supershear transition. Then it resumes the off-fault fracturing after the initiation of supershear rupture. We need to further explore the transition of stress concentration associated with the dynamic rupture during supershear transition in order to better explain the mechanism of damage gap.
3 Mechanism of coseismic off-fault damage
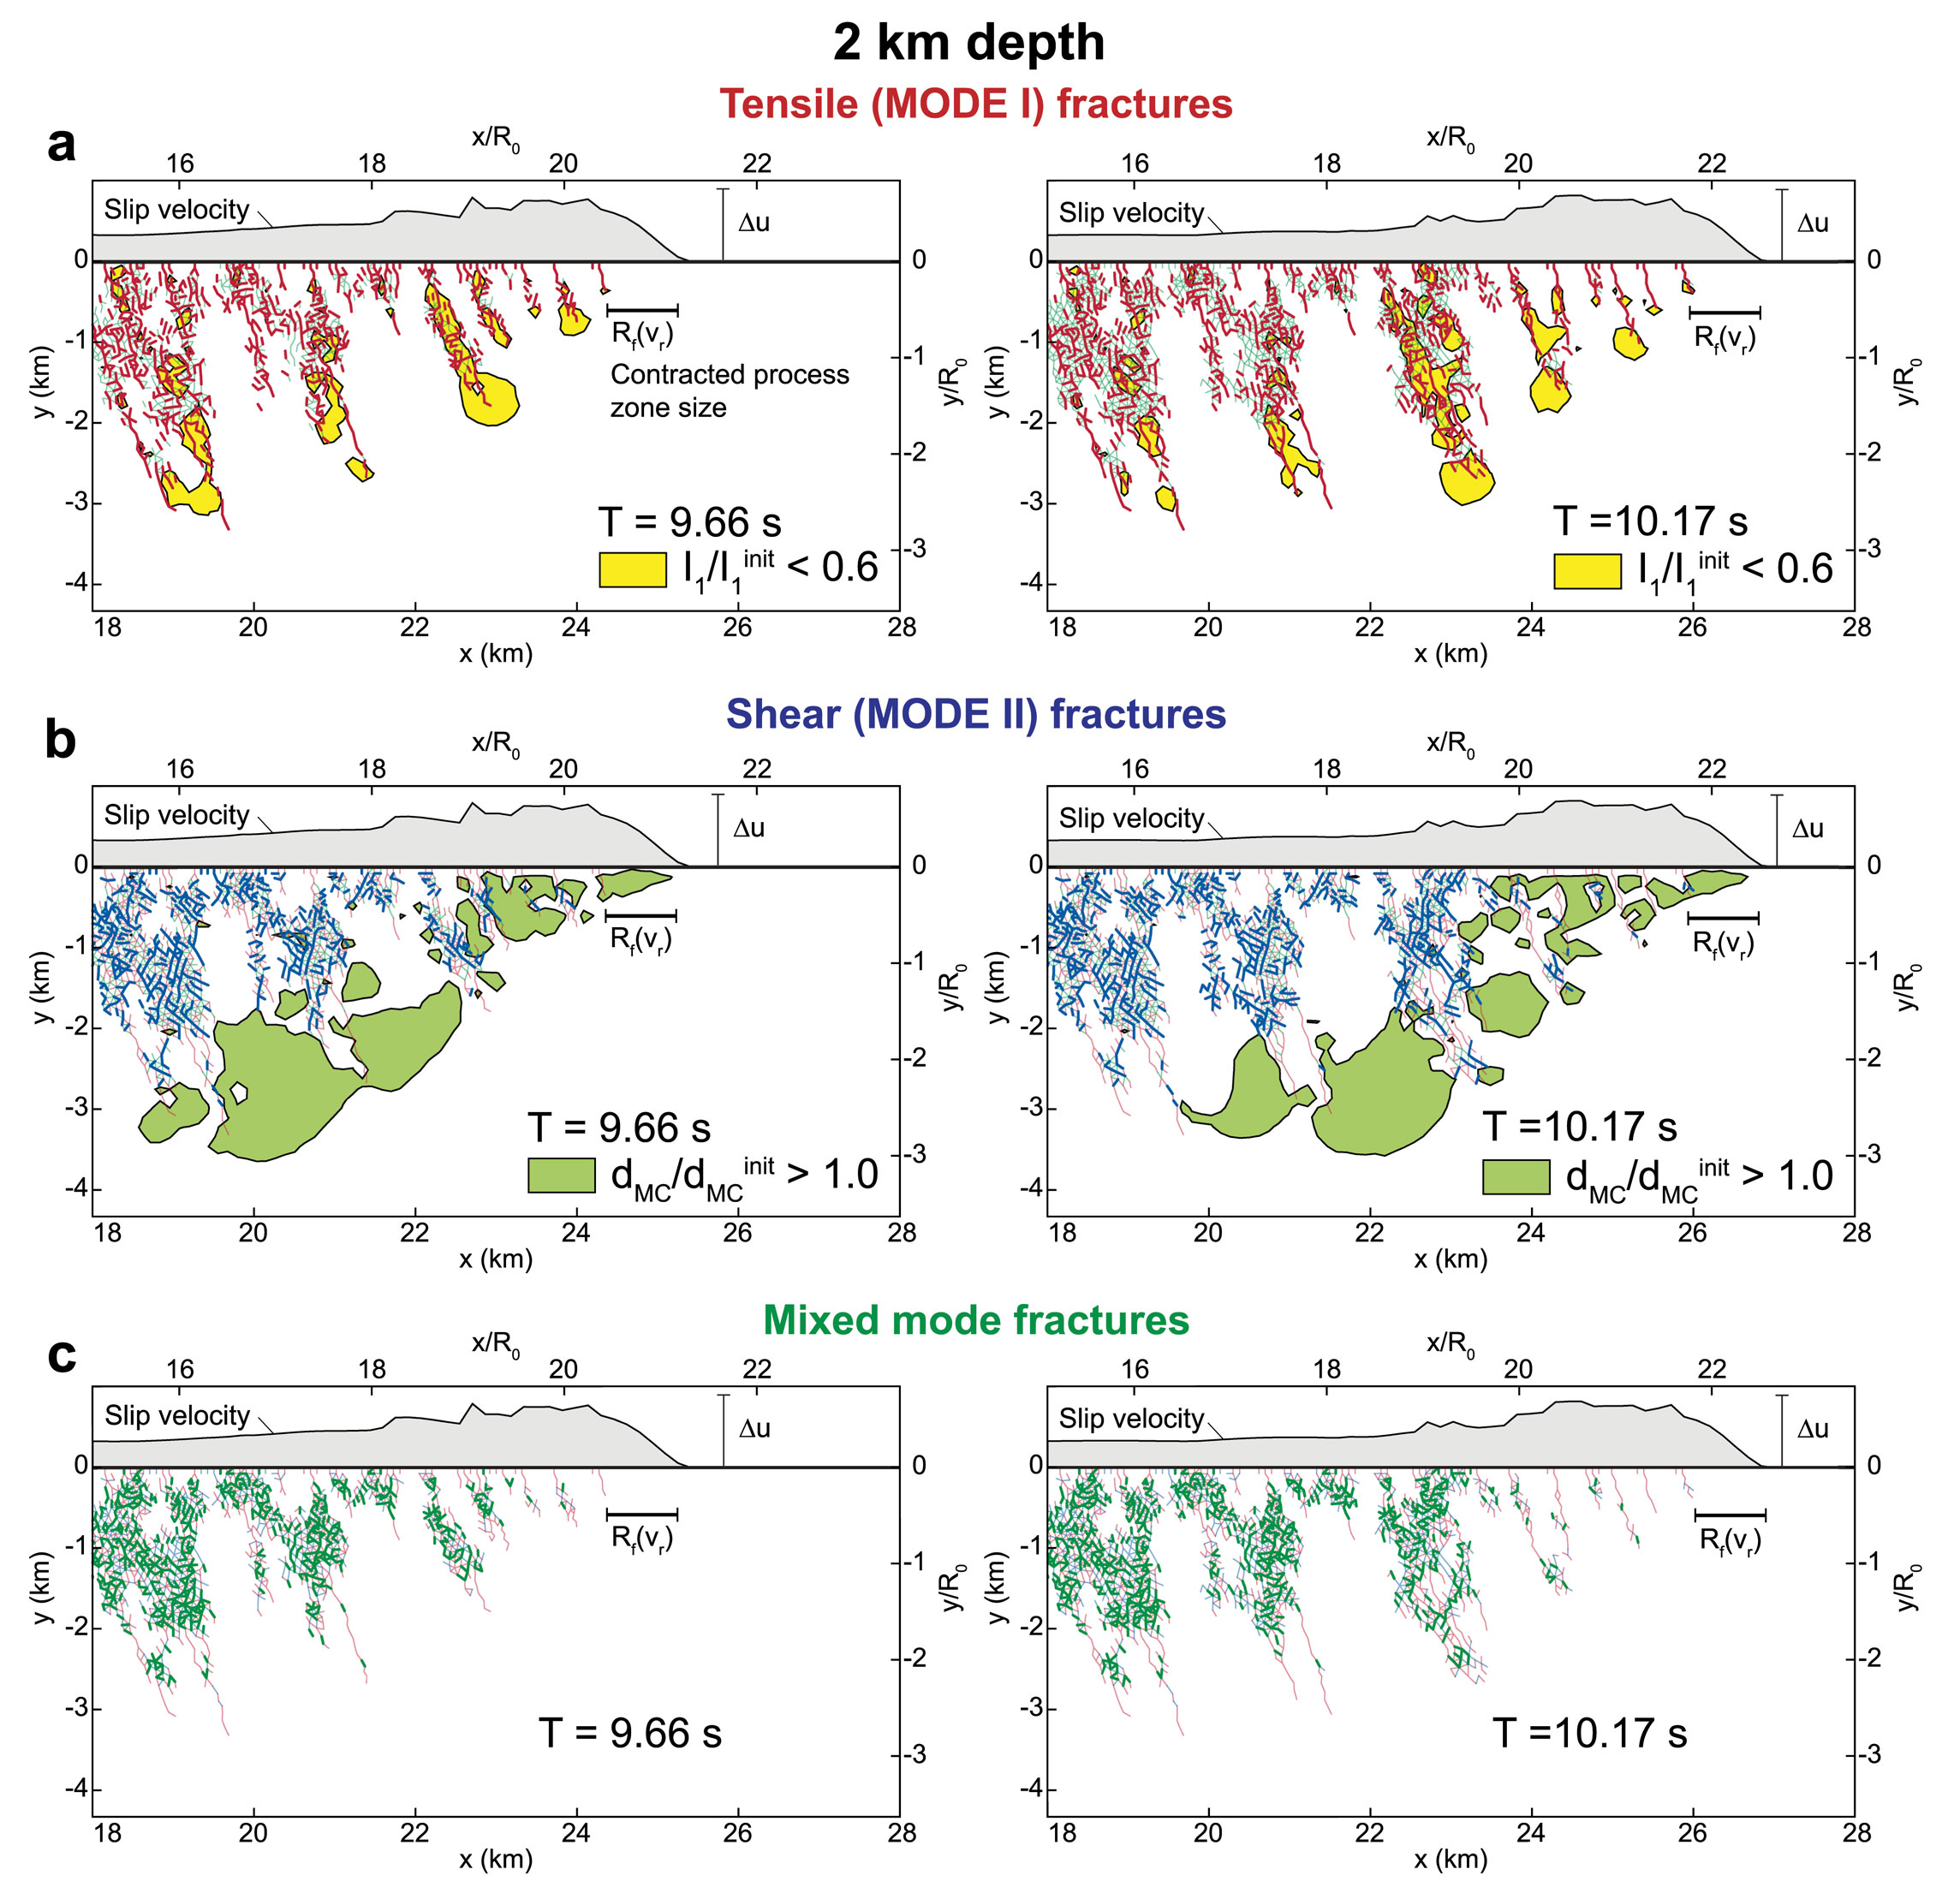
We first investigate the fracturing process in off-fault medium activated by the dynamic rupture propagation. We aim to show how the off-fault fracture network evolves as the dynamic earthquake rupture propagates on the main fault. Figure 5 shows the traces of tensile (dilating), shear and mixed mode fractures in the off-fault medium at two time steps replotted from Figure 3. To highlight the potential failure area, the first stress invariant normalized by its initial value (eq. 30) for tensile fractures and the normalized closeness to failure (eq. 27) for shear fractures are respectively superimposed on the traces of secondary fractures (see A.5). Note that both regions do not assure the traction reaches to the peak cohesion due to the threshold for plotting. Thus the potential failure planes in the regions are not necessarily broken.
The intricate fracture network is formed even after the dynamic earthquake rupture passes because the stress concentration still remains behind the rupture front due to the internal feedback from the off-fault fracture network itself. The stress concentration is then relaxed by the activation of new fractures in the off-fault medium. The tensile fractures are always initiated just behind the rupture front with a certain dominant orientation. This dominant orientation is experimentally and theoretically studied by Ngo et al., (2012), and has a reasonable correspondence with the orientation obtained from our analysis. It is also remarkable that the position of fracture initiation is scaled by the dynamic process zone size (see A.4), which is also pointed out by Viesca et al., (2009).
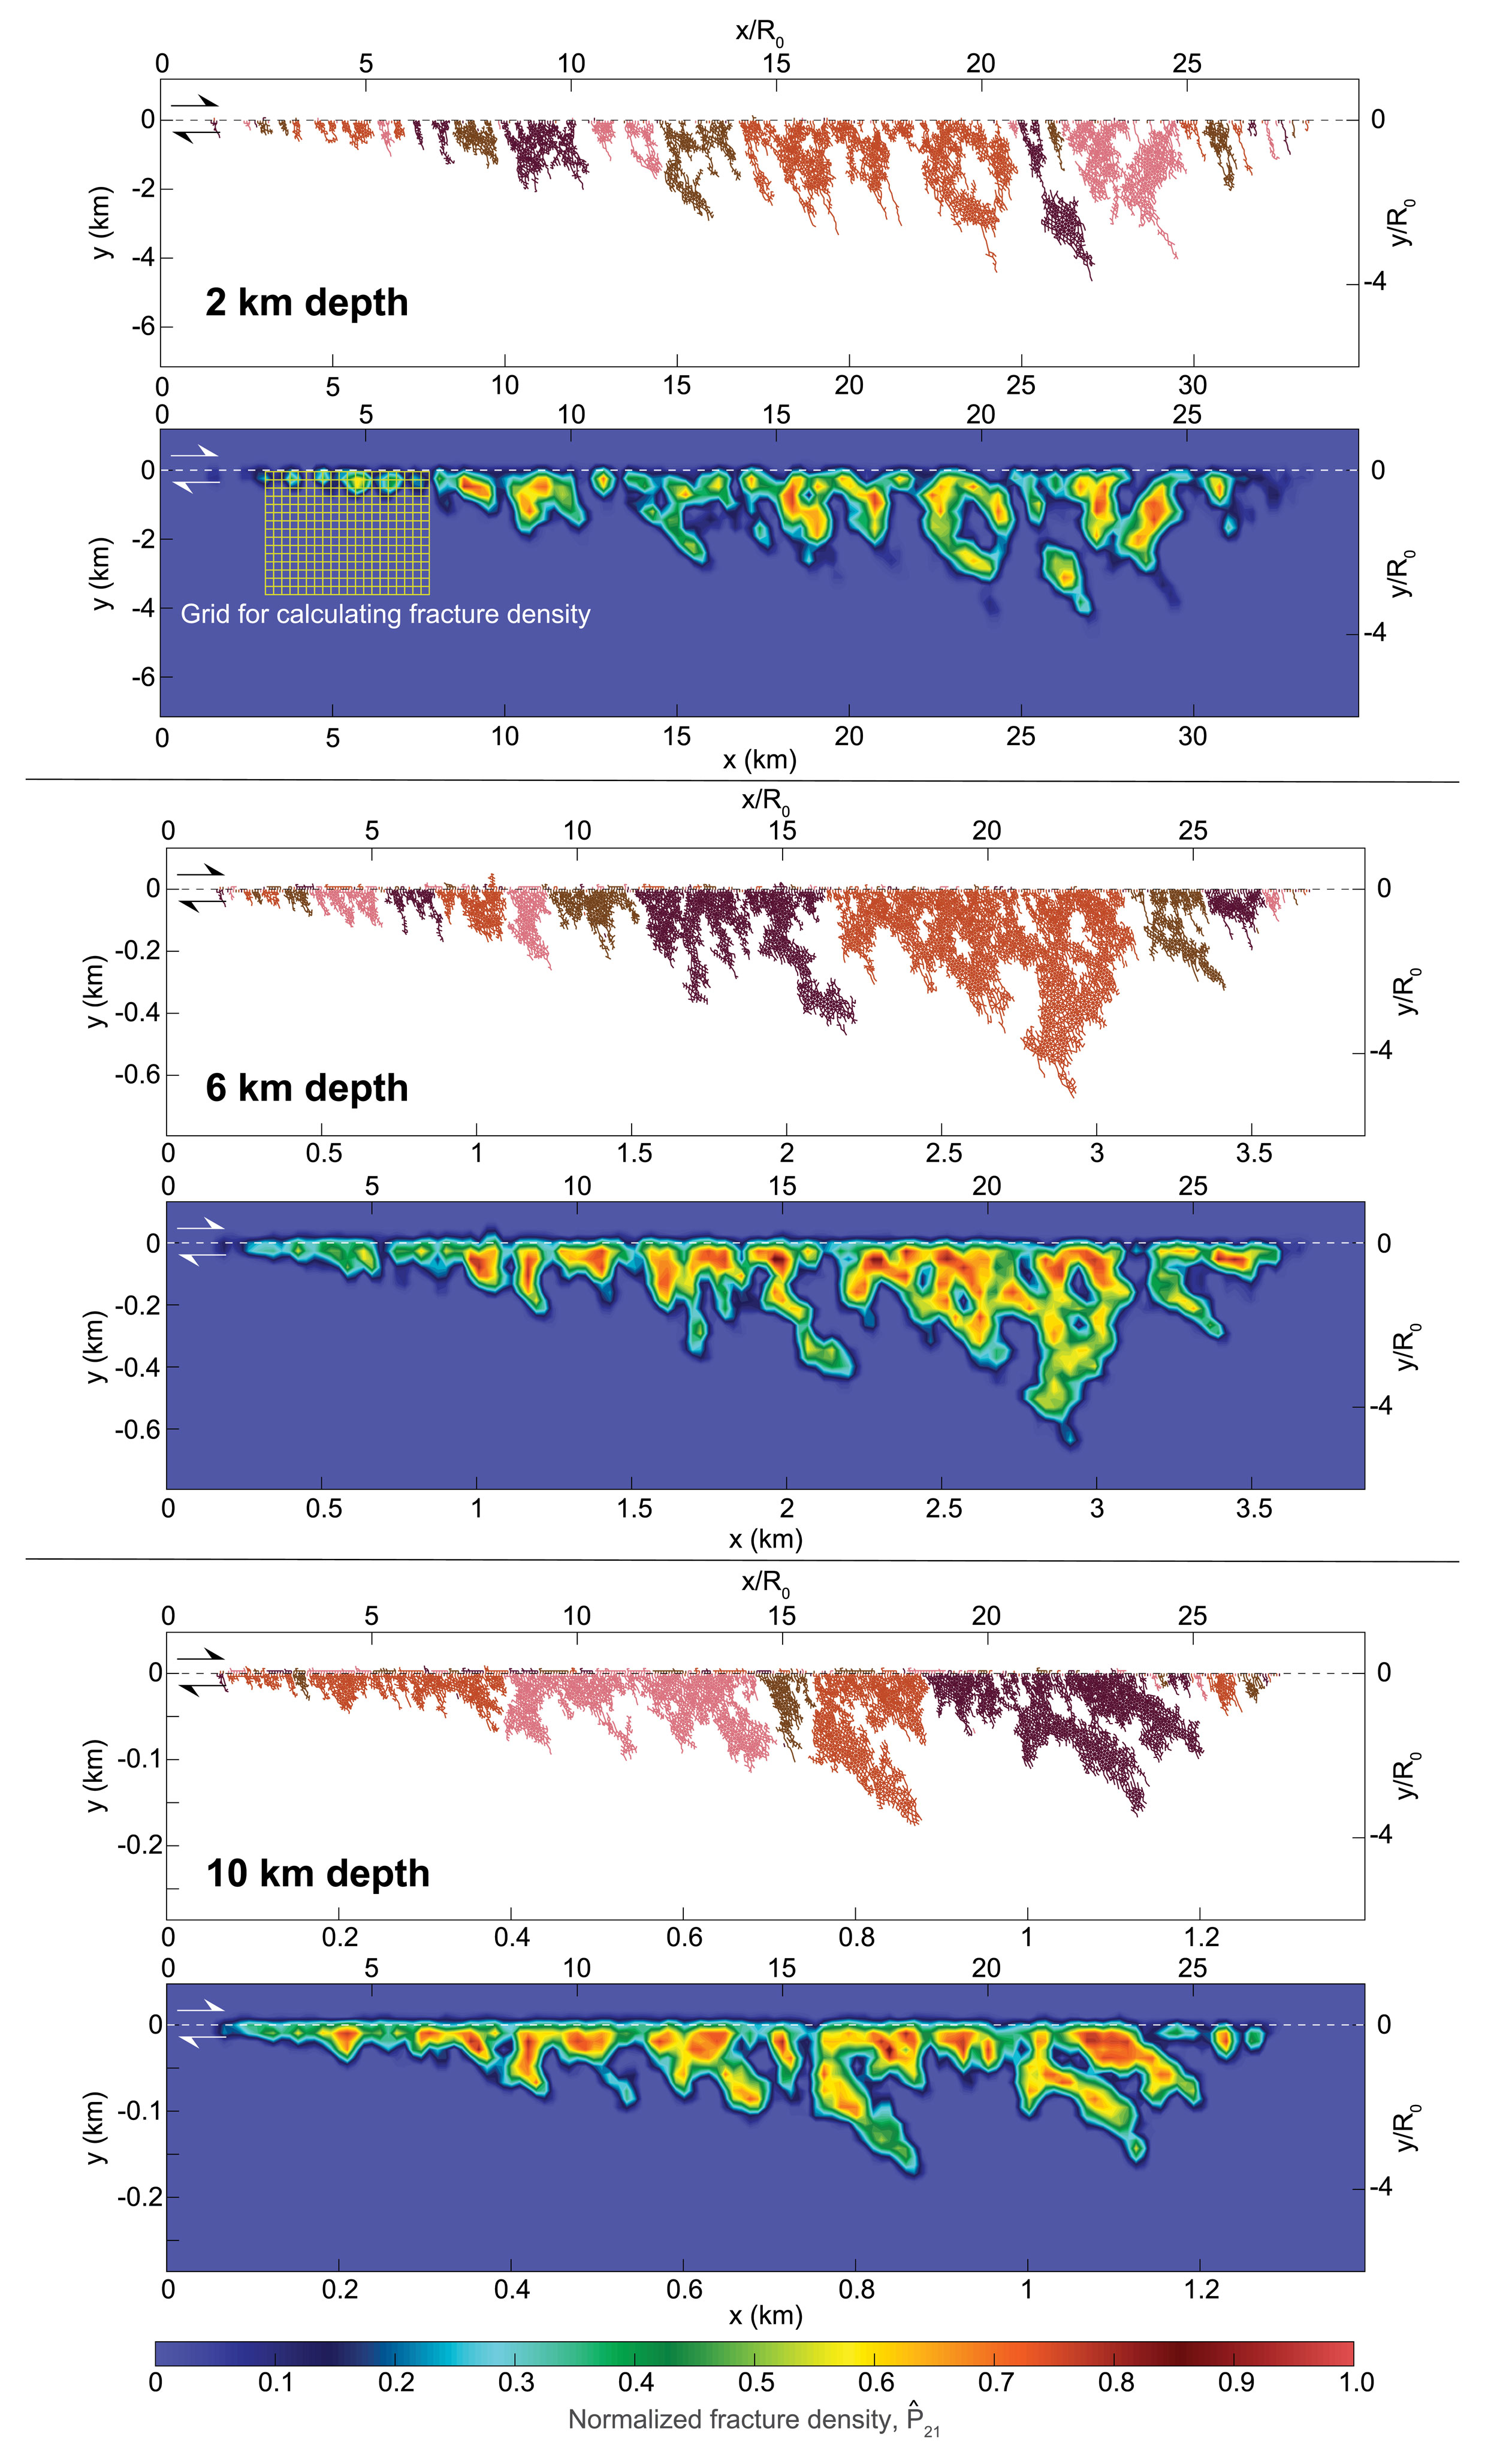
We then examined a set of case study with depth to investigate the evolution of damage pattern, fracture density and the damage zone width with depth. Figure 6 shows the traces of off-fault fracture network and the spatial distribution of fracture density at 2km, 6km and 10km depths. The isolated fracture network, in which all fractures coalesce with each other, is separately plotted with different colors. The dimensions are scaled by so that the size of the fracture network is visually comparable. The number of isolated fracture network is more for the shallower case than the deeper case, implying the off-fault fracture network becomes more intricate and denser with depth. To evaluate the distribution of fracture density, we firstly imposed representative square grids around the fault as shown in Figure 6 at 2km depth, and calculated the normalized fracture density in the each grid defined as
| (1) |
We carefully chose the grid size, which involves a reasonable number of potential failure planes. In this analysis, the grid size is set as 0.2, which is, on average, three times larger than the size of potential failure planes. For the sake of comparison between different depths, the magnitude of is normalized by its maximum value at 10km depth. We found that the fracture density globally increases with depth, though it does not monotonically increase due to complicated internal feedback in the off-fault fracture network. The increase in the normalized fracture density with depth enhances the contribution of coseismic off-fault damage to the overall energy budget, discussed in section 6. Note that the pulverization in the vicinity of main fault is not modeled because of limitations in the size of the potential failure planes. It would be resolved by incorporating with constitutive damage models (Bhat et al.,, 2012).
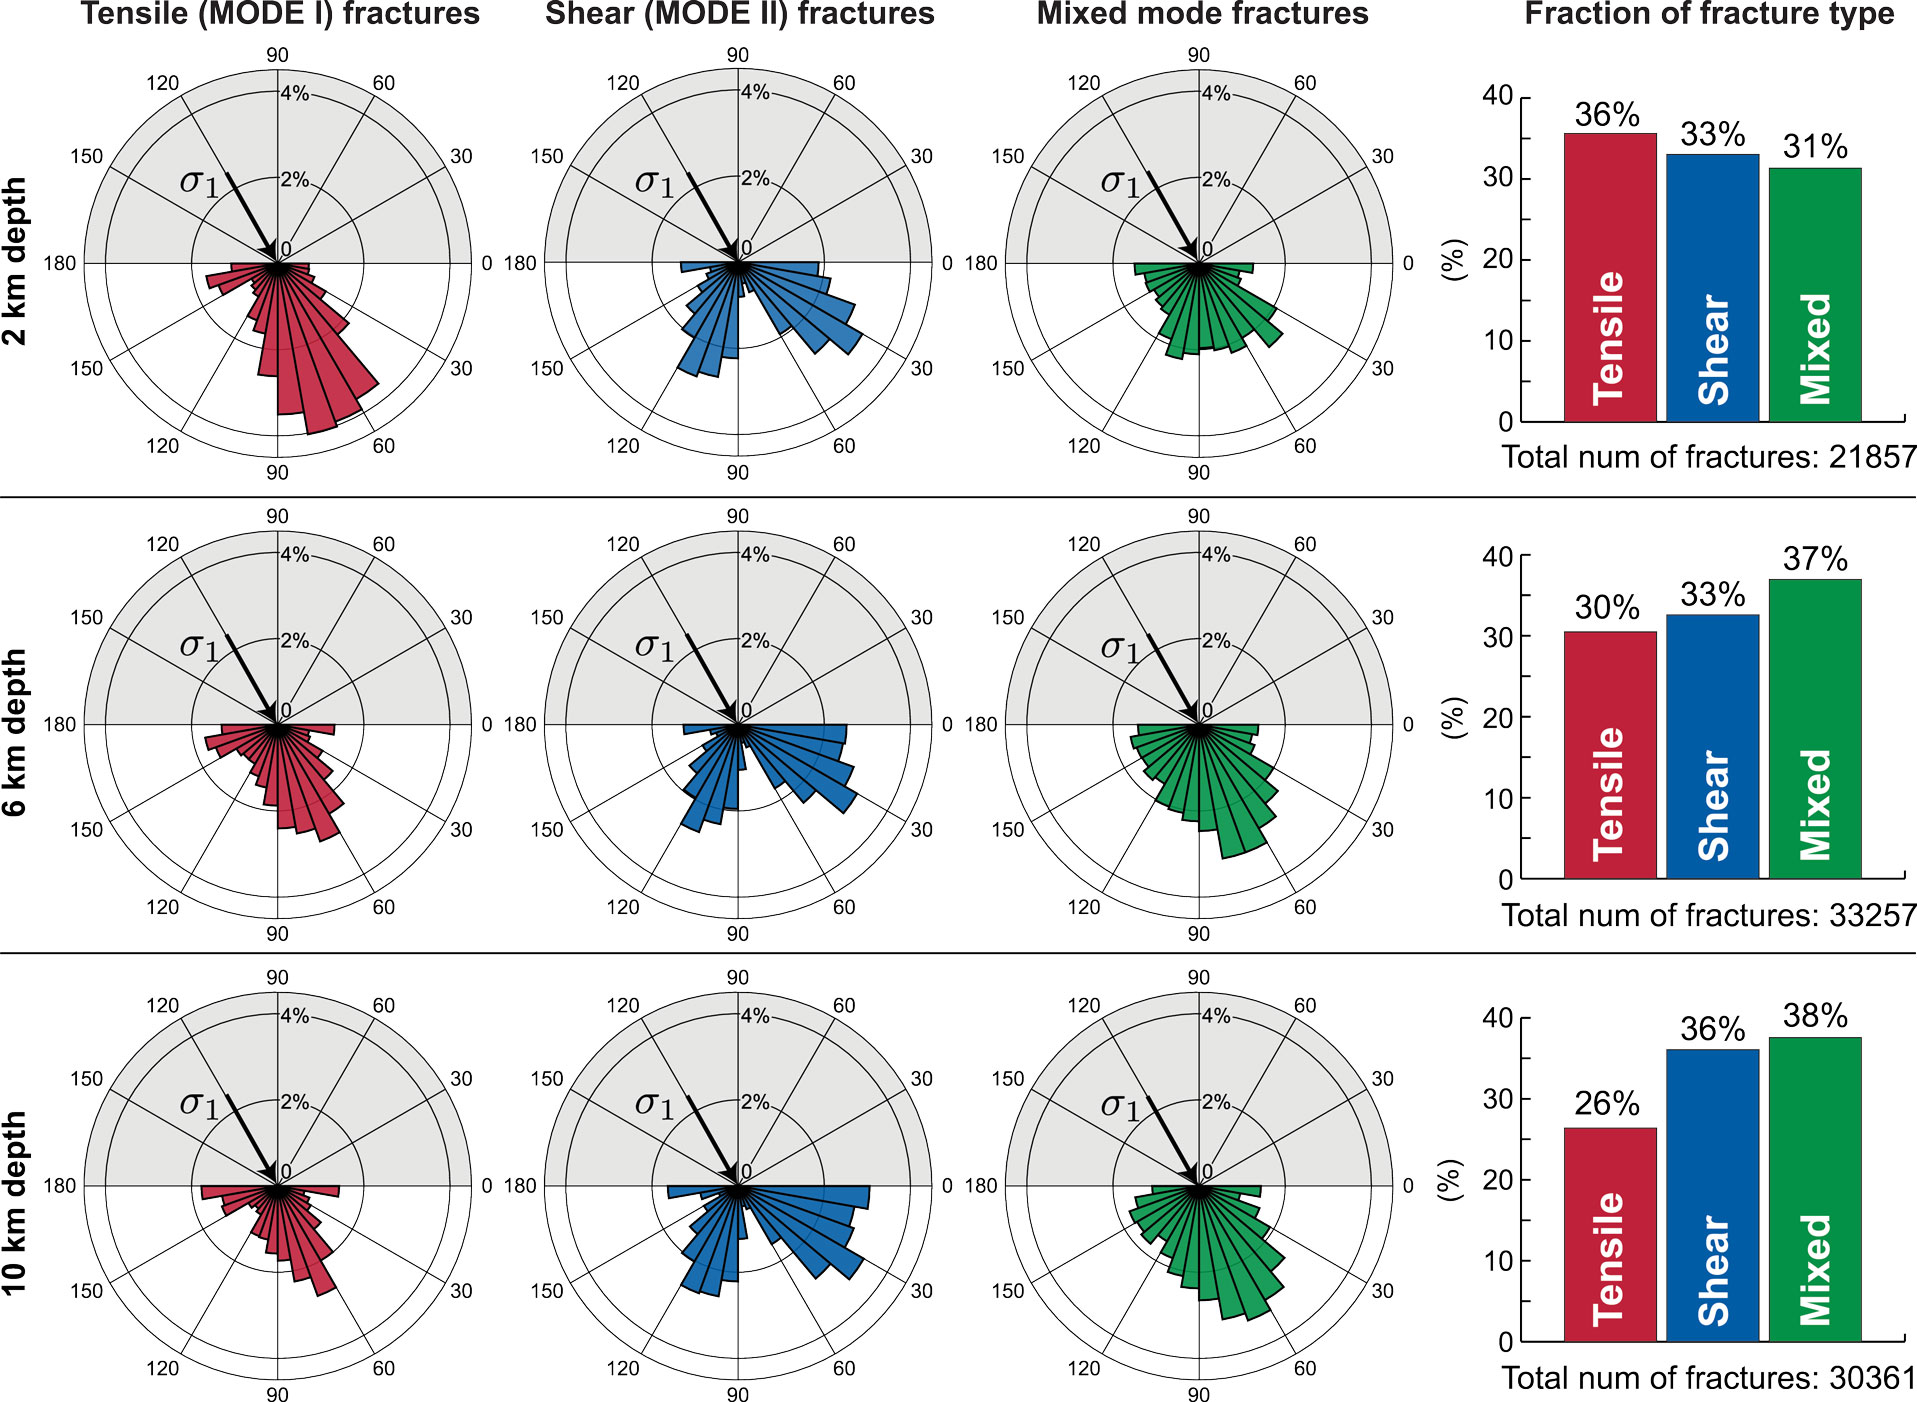
Figure 7 shows the rose diagram showing the orientation of off-fault fractures. The size of bars in the rose diagram is normalized by the sum of all types of fracture. It has a dominant orientation for tensile fractures, which corresponds to the orientation of . The shear fractures also have two dominant orientations, which correspond to the conjugate failure planes inferred from the Mohr-Coulomb failure criterion. There is no dominant orientation for mixed mode fractures. The fraction of the each type of fracture shows that the population is fairly balanced, whereas the fraction of tensile fracture decreases with depth because more intricate fracture network is formed at depth.
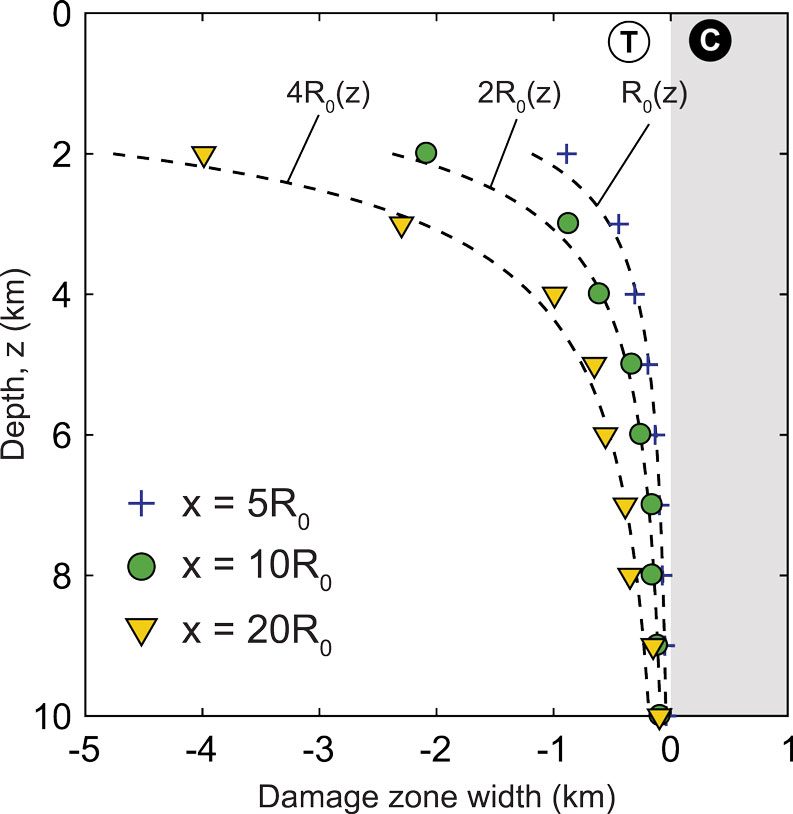
Figure 8 shows the evolution of the damage zone width with depth. The damage zone is inferred from the envelope of secondary fracture network at the scaled rupture length , and to compare at the same stage of dynamic ruptures with depth, and to investigate representative damage zone width associated with the in-situ confining pressure. Since there are few off-fault fractures being activated on the compressional side, we only plot the damage zone width on the extensional side. The damage zone width follows, up to a constant factor, the quasi-static process zone size. Hence the damage zone width decreases with depth, forming the flower-like structure, with fracture connectivity increasing with depth. This structure of damage zone with depth is in agreement with the observations (e.g. Cochran et al.,, 2009).
We here demonstrated the fracturing process of off-fault medium activated by the dynamic earthquake rupture with depth. The dynamic activation of off-fault fracture network has an effect on the rupture dynamics and causes additional radiation, which effects high-frequency components in near-field ground motion discussed in the following section. We also examined the mesh dependency of the fracturing process because the potential failure planes are restricted to the element boundary, which is discussed in Appendix C.
4 Rupture velocity
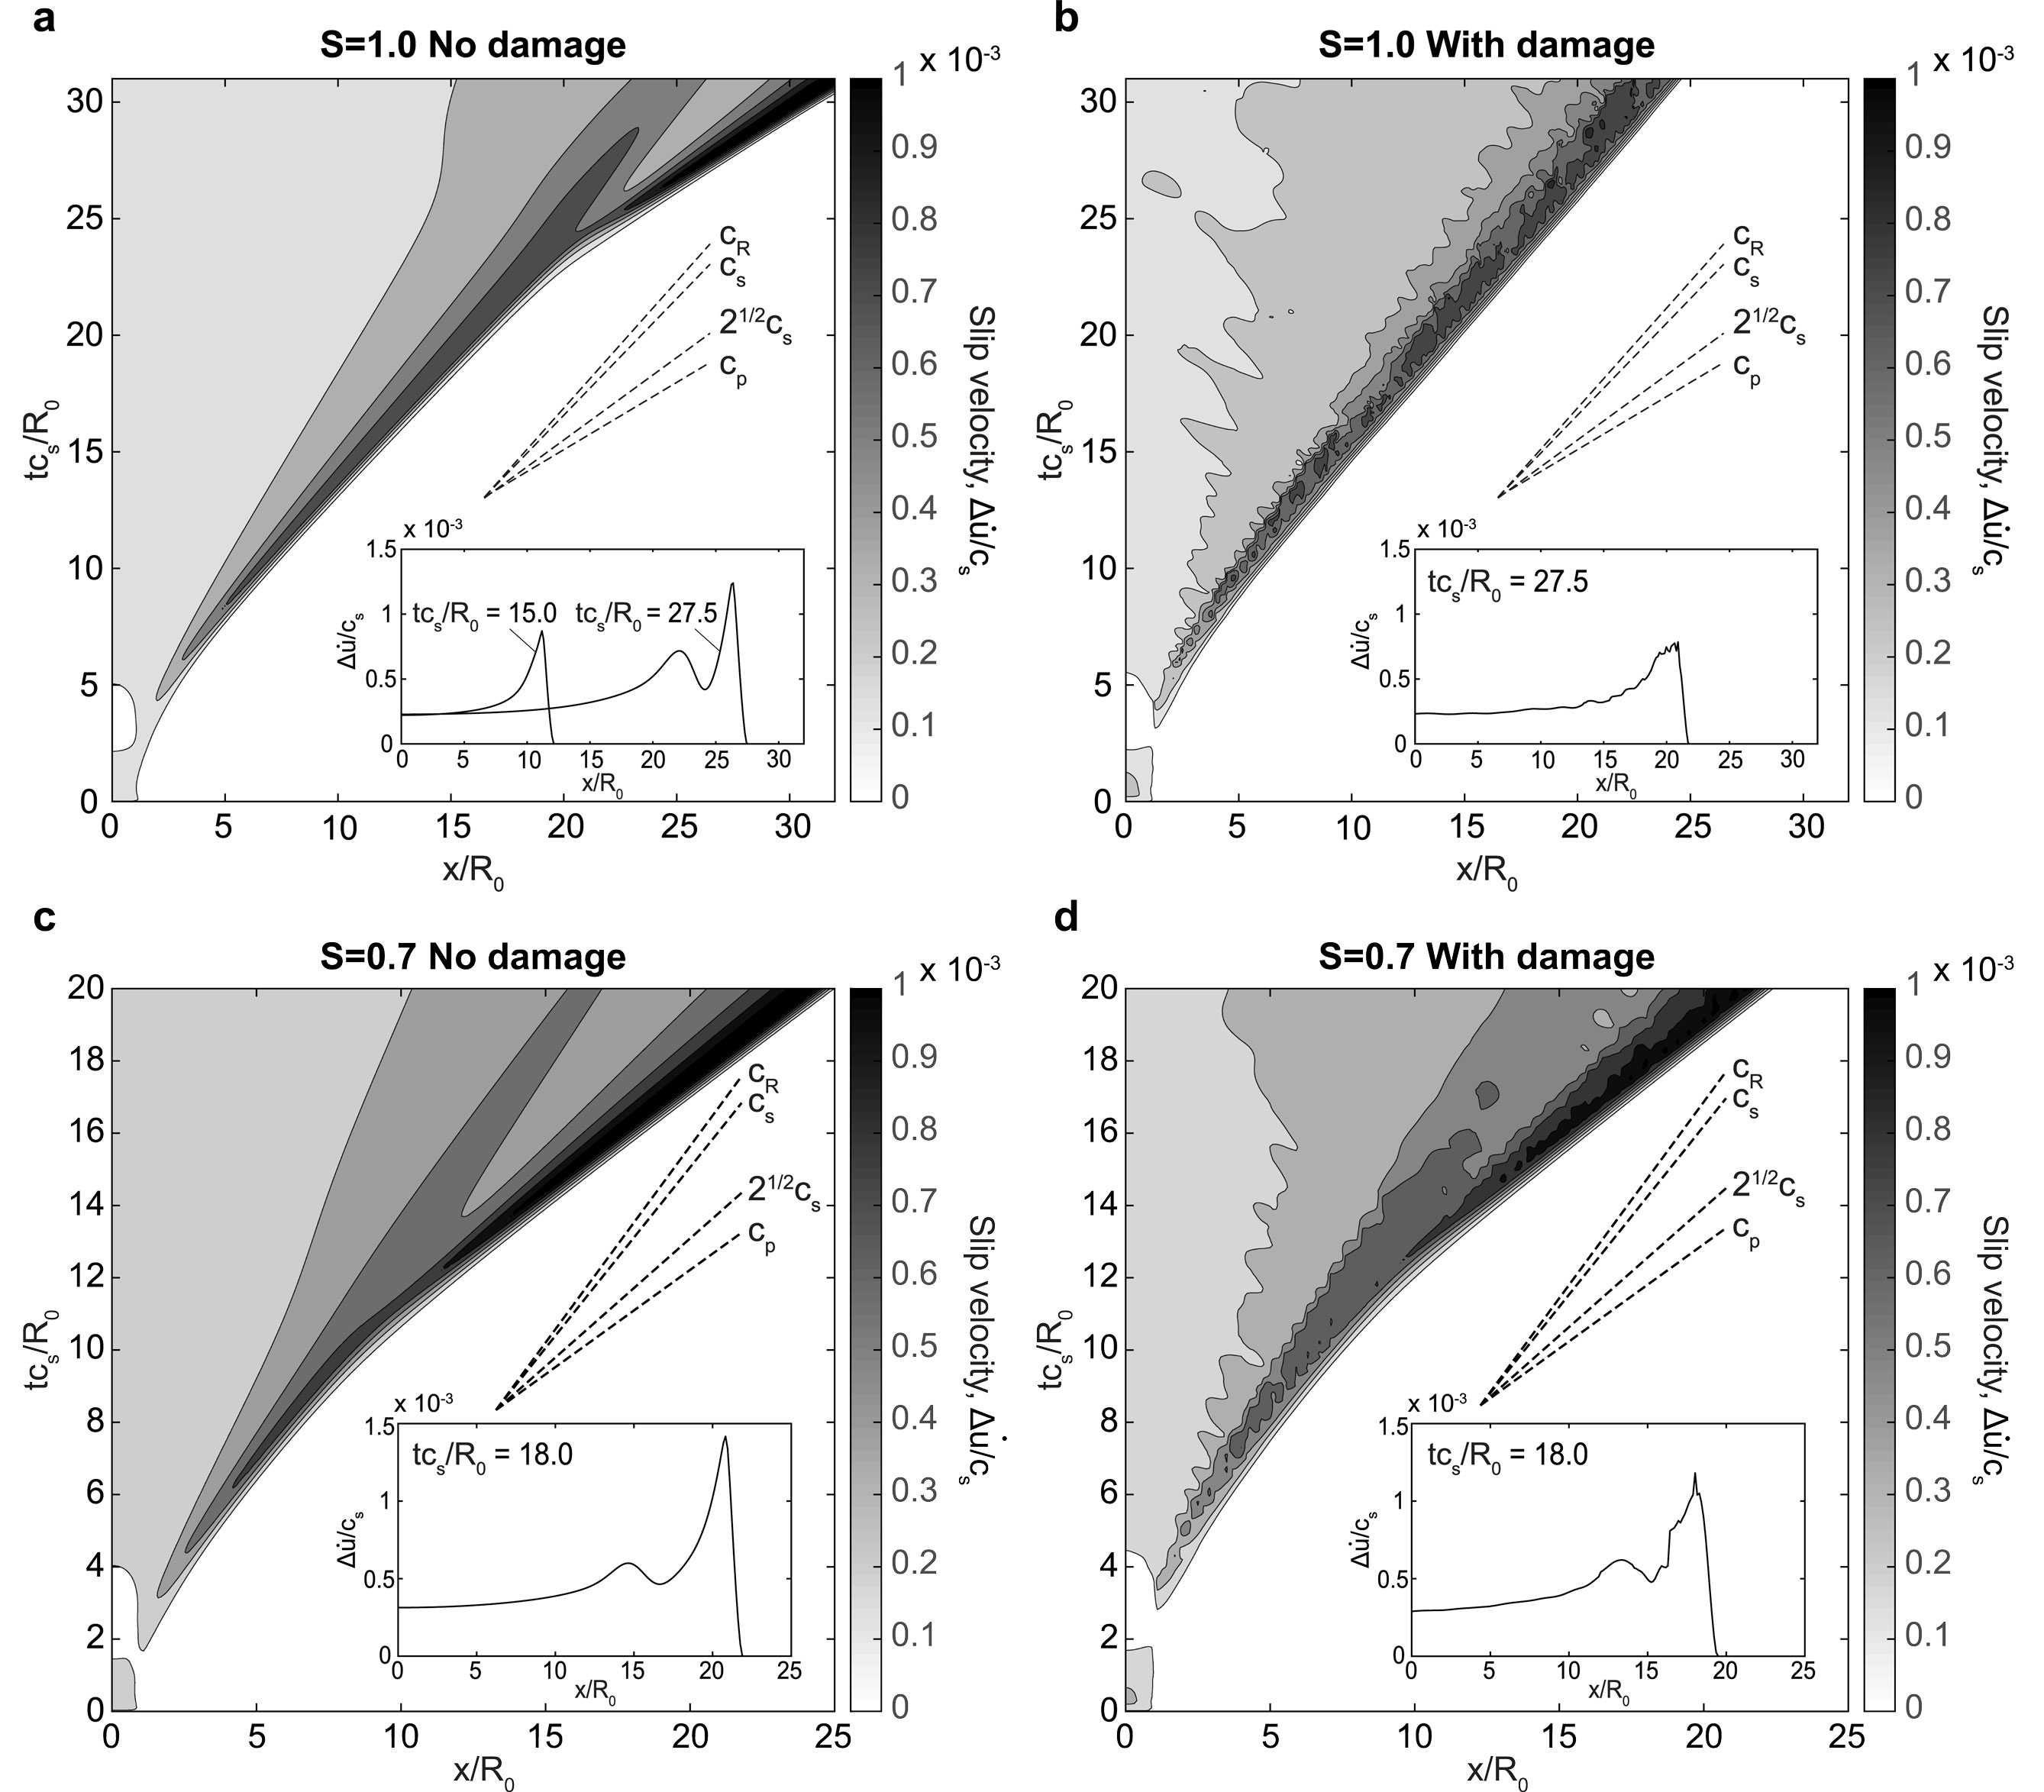
We next focus on the rupture velocity on the main fault. Figure 9 shows the evolution of slip velocity on the main fault with four cases; S = 1.0 or 0.7 at 2km depth, each of which with or without off-fault damage. For the cases without off-fault damage, the activation of secondary fracture is suppressed by the extremely high cohesion for both tensile and shear fractures. Here, we plot the contour of slip velocity in space and time. In Figure 9a, there is a clear transition from sub-Rayleigh to supershear around , which is also shown in the inset. However, when the coseismic off-fault damage is taken into account, the supershear transition is not observed during the simulation as shown in Figure 9b. Hence, the secondary fractures can arrest, or delay, supershear transition in a certain stress conditions. This can be explained by the increase in critical slip distance due to the coseismic off-fault damage. The supershear transition length can be estimated from the Andrews’ result (Andrews,, 1985; Xia et al.,, 2004) as following
| (2) |
where is the threshold for the supershear transition ( for 2-D), is Poisson’s ratio, , and are peak friction (eq. 19), residual friction (eq. 20) and shear traction on the fault, respectively, is shear modulus and is critical slip distance for friction (eq. 26). is initially uniform on the main fault. However, the effective critical slip distance , which takes into account the energy dissipation in the off-fault medium due to the coseismic off-fault damage, increases with the rupture length as discussed in later section (Section 6.1). Therefore, also increases due to the coseismic off-fault damage as it is proportional to .
Figures 9c and 9d show the cases with , where the rupture transitions to supershear for both cases with and without off-fault damage because of the large contrast of the initial shear traction to the normal traction on the main fault. The time of supershear transition is delayed with off-fault damage due to the decrease of rupture velocity, whereas the difference of transition length is still obscure with these results. The two insets in the figures show the clear difference in the peak of slip velocity and the fluctuation. In addition, the rupture arrival is delayed by the coseismic off-fault damage, implying the decrease in rupture velocity.
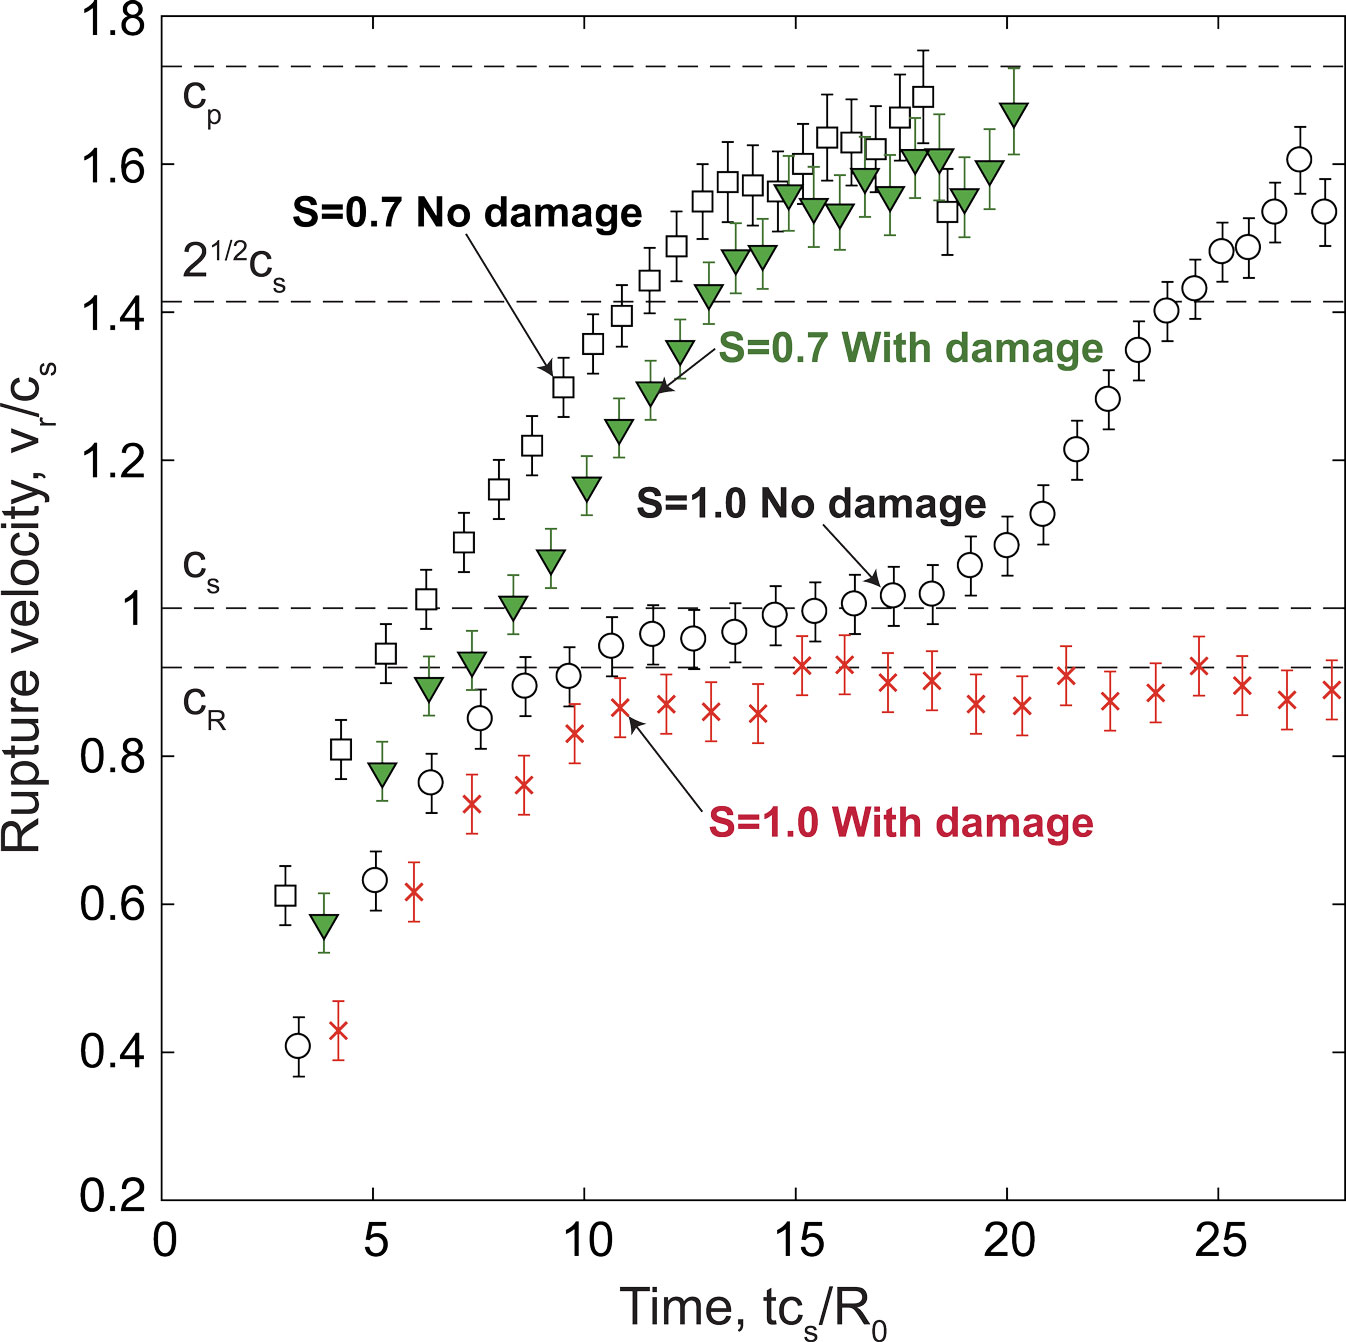
The rupture velocity is calculated from first arrival times along the main fault. Figure 10 shows the evolution of rupture velocity in time. We take the time derivatives of first arrival time in discretized space along the main fault to calculate the representative rupture velocity at a certain position. Since it is difficult to capture the exact time when rupture velocity jumps to supershear, where the curve of first arrival time has a kink and is non-differentiable, the error caused by the smoothing of the rupture velocity is taken into account as shown by the error bars in Figure 10. Therefore, the markers in the forbidden zone do not conclusively indicate that the rupture velocity is between them due to the uncertainty.
Regardless of the uncertainty, the comparison between the cases with and without off-fault damage shows the effect of coseismic off-fault damage on the rupture velocity and the supershear transition. The rupture transitions to supershear for both cases with S=0.7, whereas the rate of increase in rupture velocity is lower for the case with the off-fault damage. However, the supershear transition is suppressed due to the coseismic off-fault damage with S=1.0. Further parametric study would narrow down the criteria of supershear transition and would provede supershear transition length.
5 High-frequency radiation in near-field
The origin of high-frequency radiation has been studied over decades (e.g. Madariaga,, 1977; Hanks and McGuire,, 1981; Hanks,, 1982; Ohnaka et al.,, 1987; Dunham et al., 2011b, ; Castro and Ben-Zion,, 2013; Passelègue et al.,, 2016; Marty et al.,, 2019). There are multiple factors that effect the high-frequency radiation, such as sudden nucleation and arrest of rupture, complex fault geometry, roughness of the fault surface and the nonlinear response in subsurface sedimentary rock. In this study, we propose that the coseismic off-fault damage is also a candidate which effects the high-frequency radiation. When the secondary fracture is activated in the off-fault medium, it behaves as a secondary source to radiate waves, which contributes to the enhancement of high-frequency components in the near-field ground motion. The off-fault fracture network also causes the scattering wave due to the structural heterogeneities.
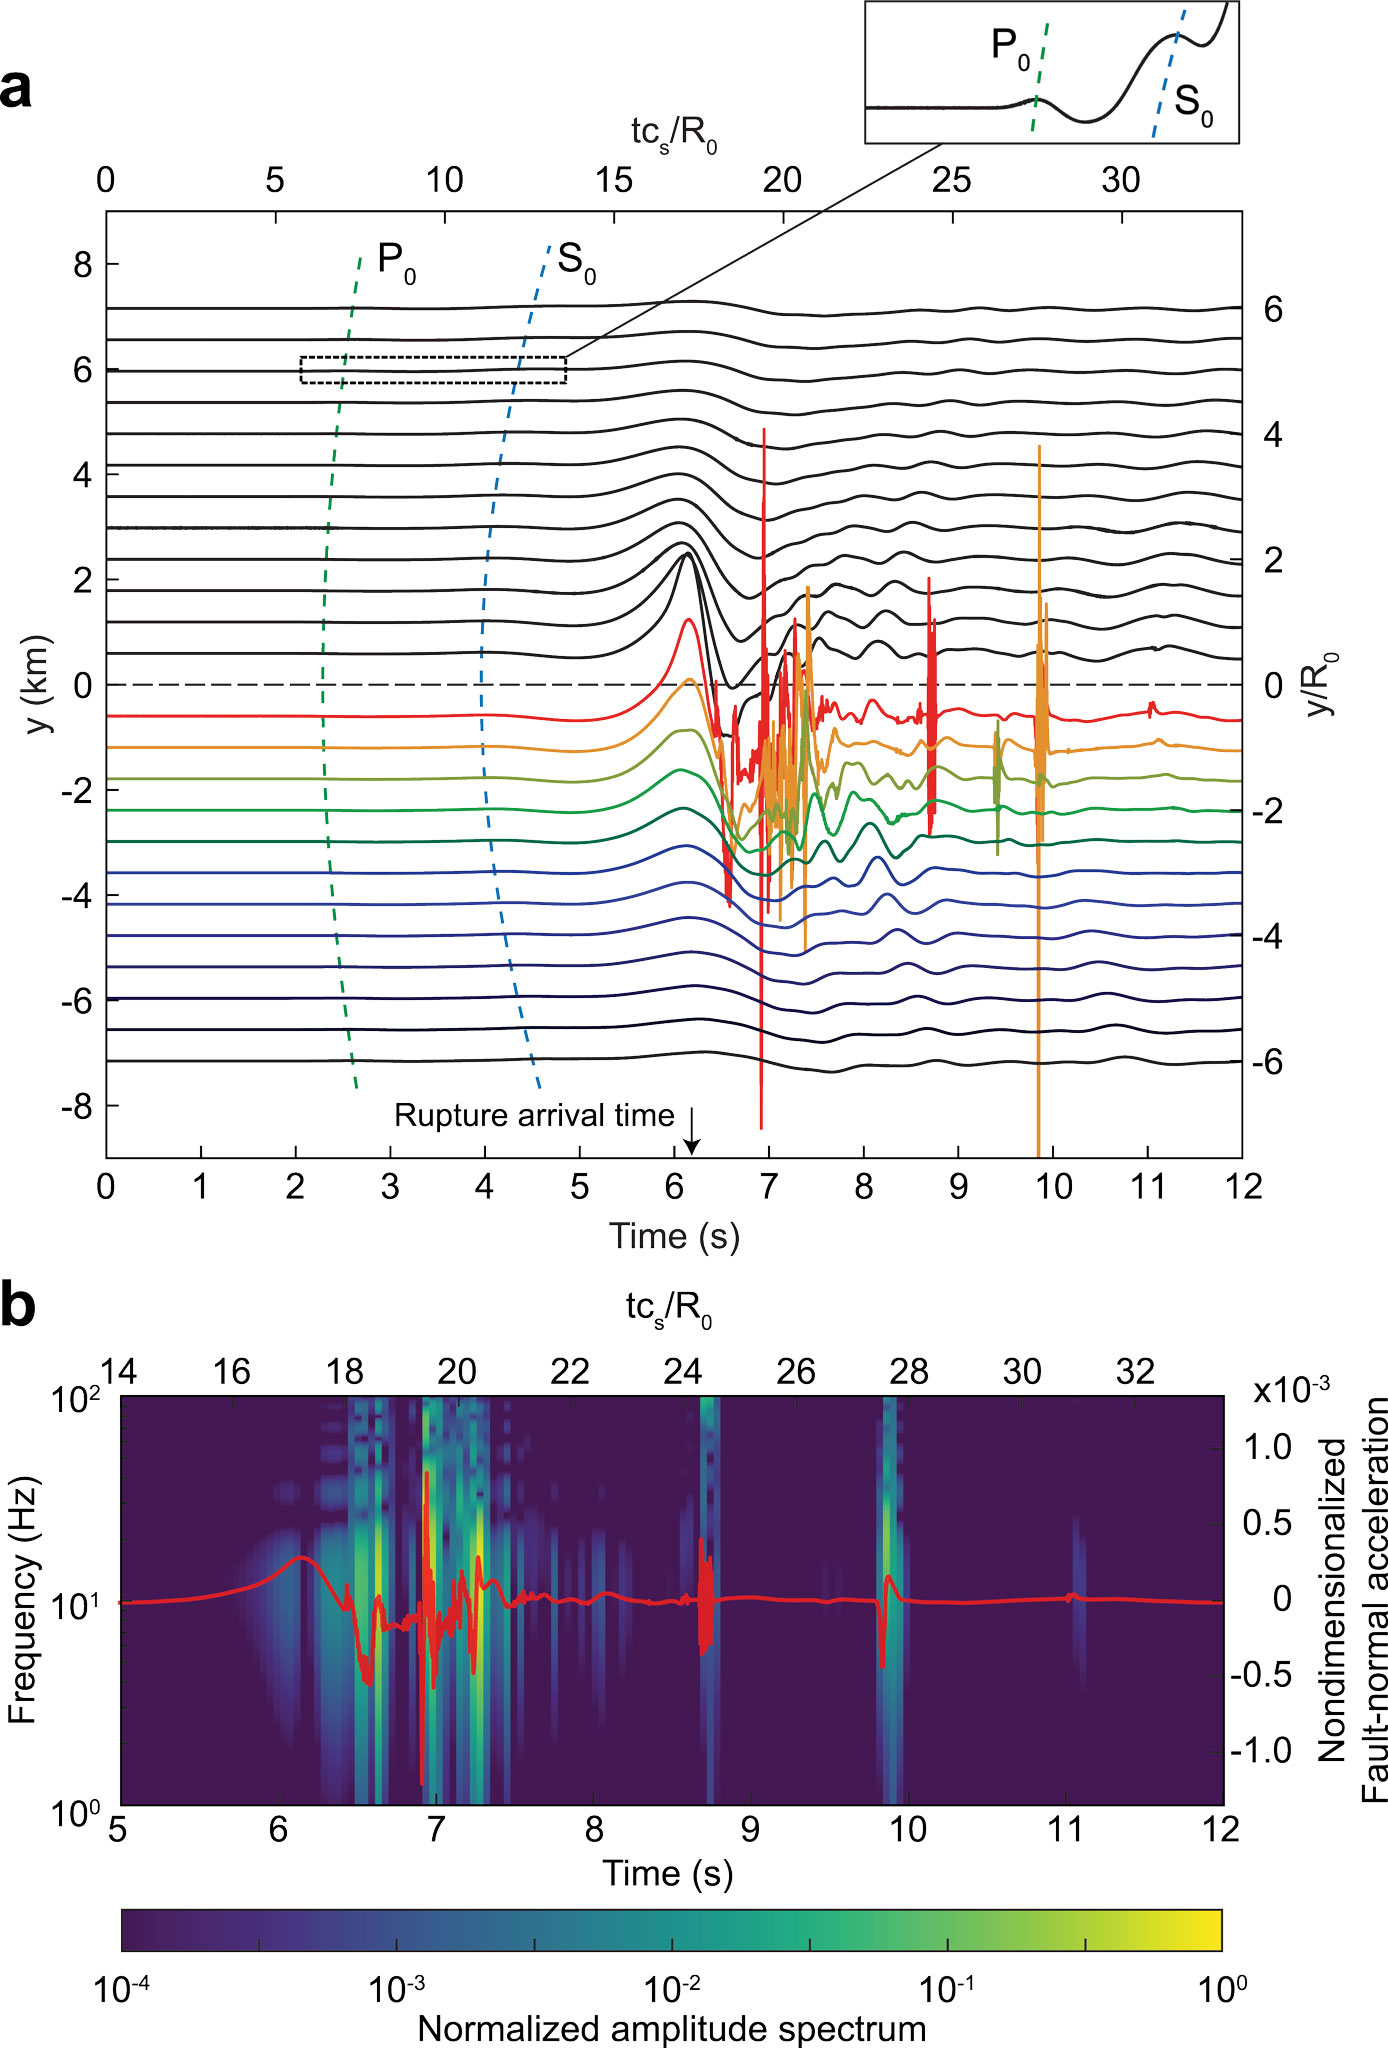
Figure 11a shows the waveforms of the fault-normal acceleration at , 2km depth with S=1.0. The amplitude is compressed to highlight the signals arising from the coseismic off-fault damage. The theoretical P and S wave arrival time and the rupture arrival time at are indicated in Figure 11a. After the P and S wave arrival, there is a well-aligned signal around 6s, which is caused by the stress perturbation around the rupture front. Significant high-frequency spikes then arise after the main rupture arrival, which are caused by the secondary off-fault fracturing, instead of the regular near-field radiation from the main rupture. These spikes are observed up to 2 from the fault, corresponding to the damage zone width at this rupture length. Figure 11b shows the spectrogram of the near-field ground acceleration (). The spikes are observed at t = 8.7s and 9.9s even after the passage of rupture on the main fault due to the secondary fracturing activated by the internal feedback of off-fault fracture network.
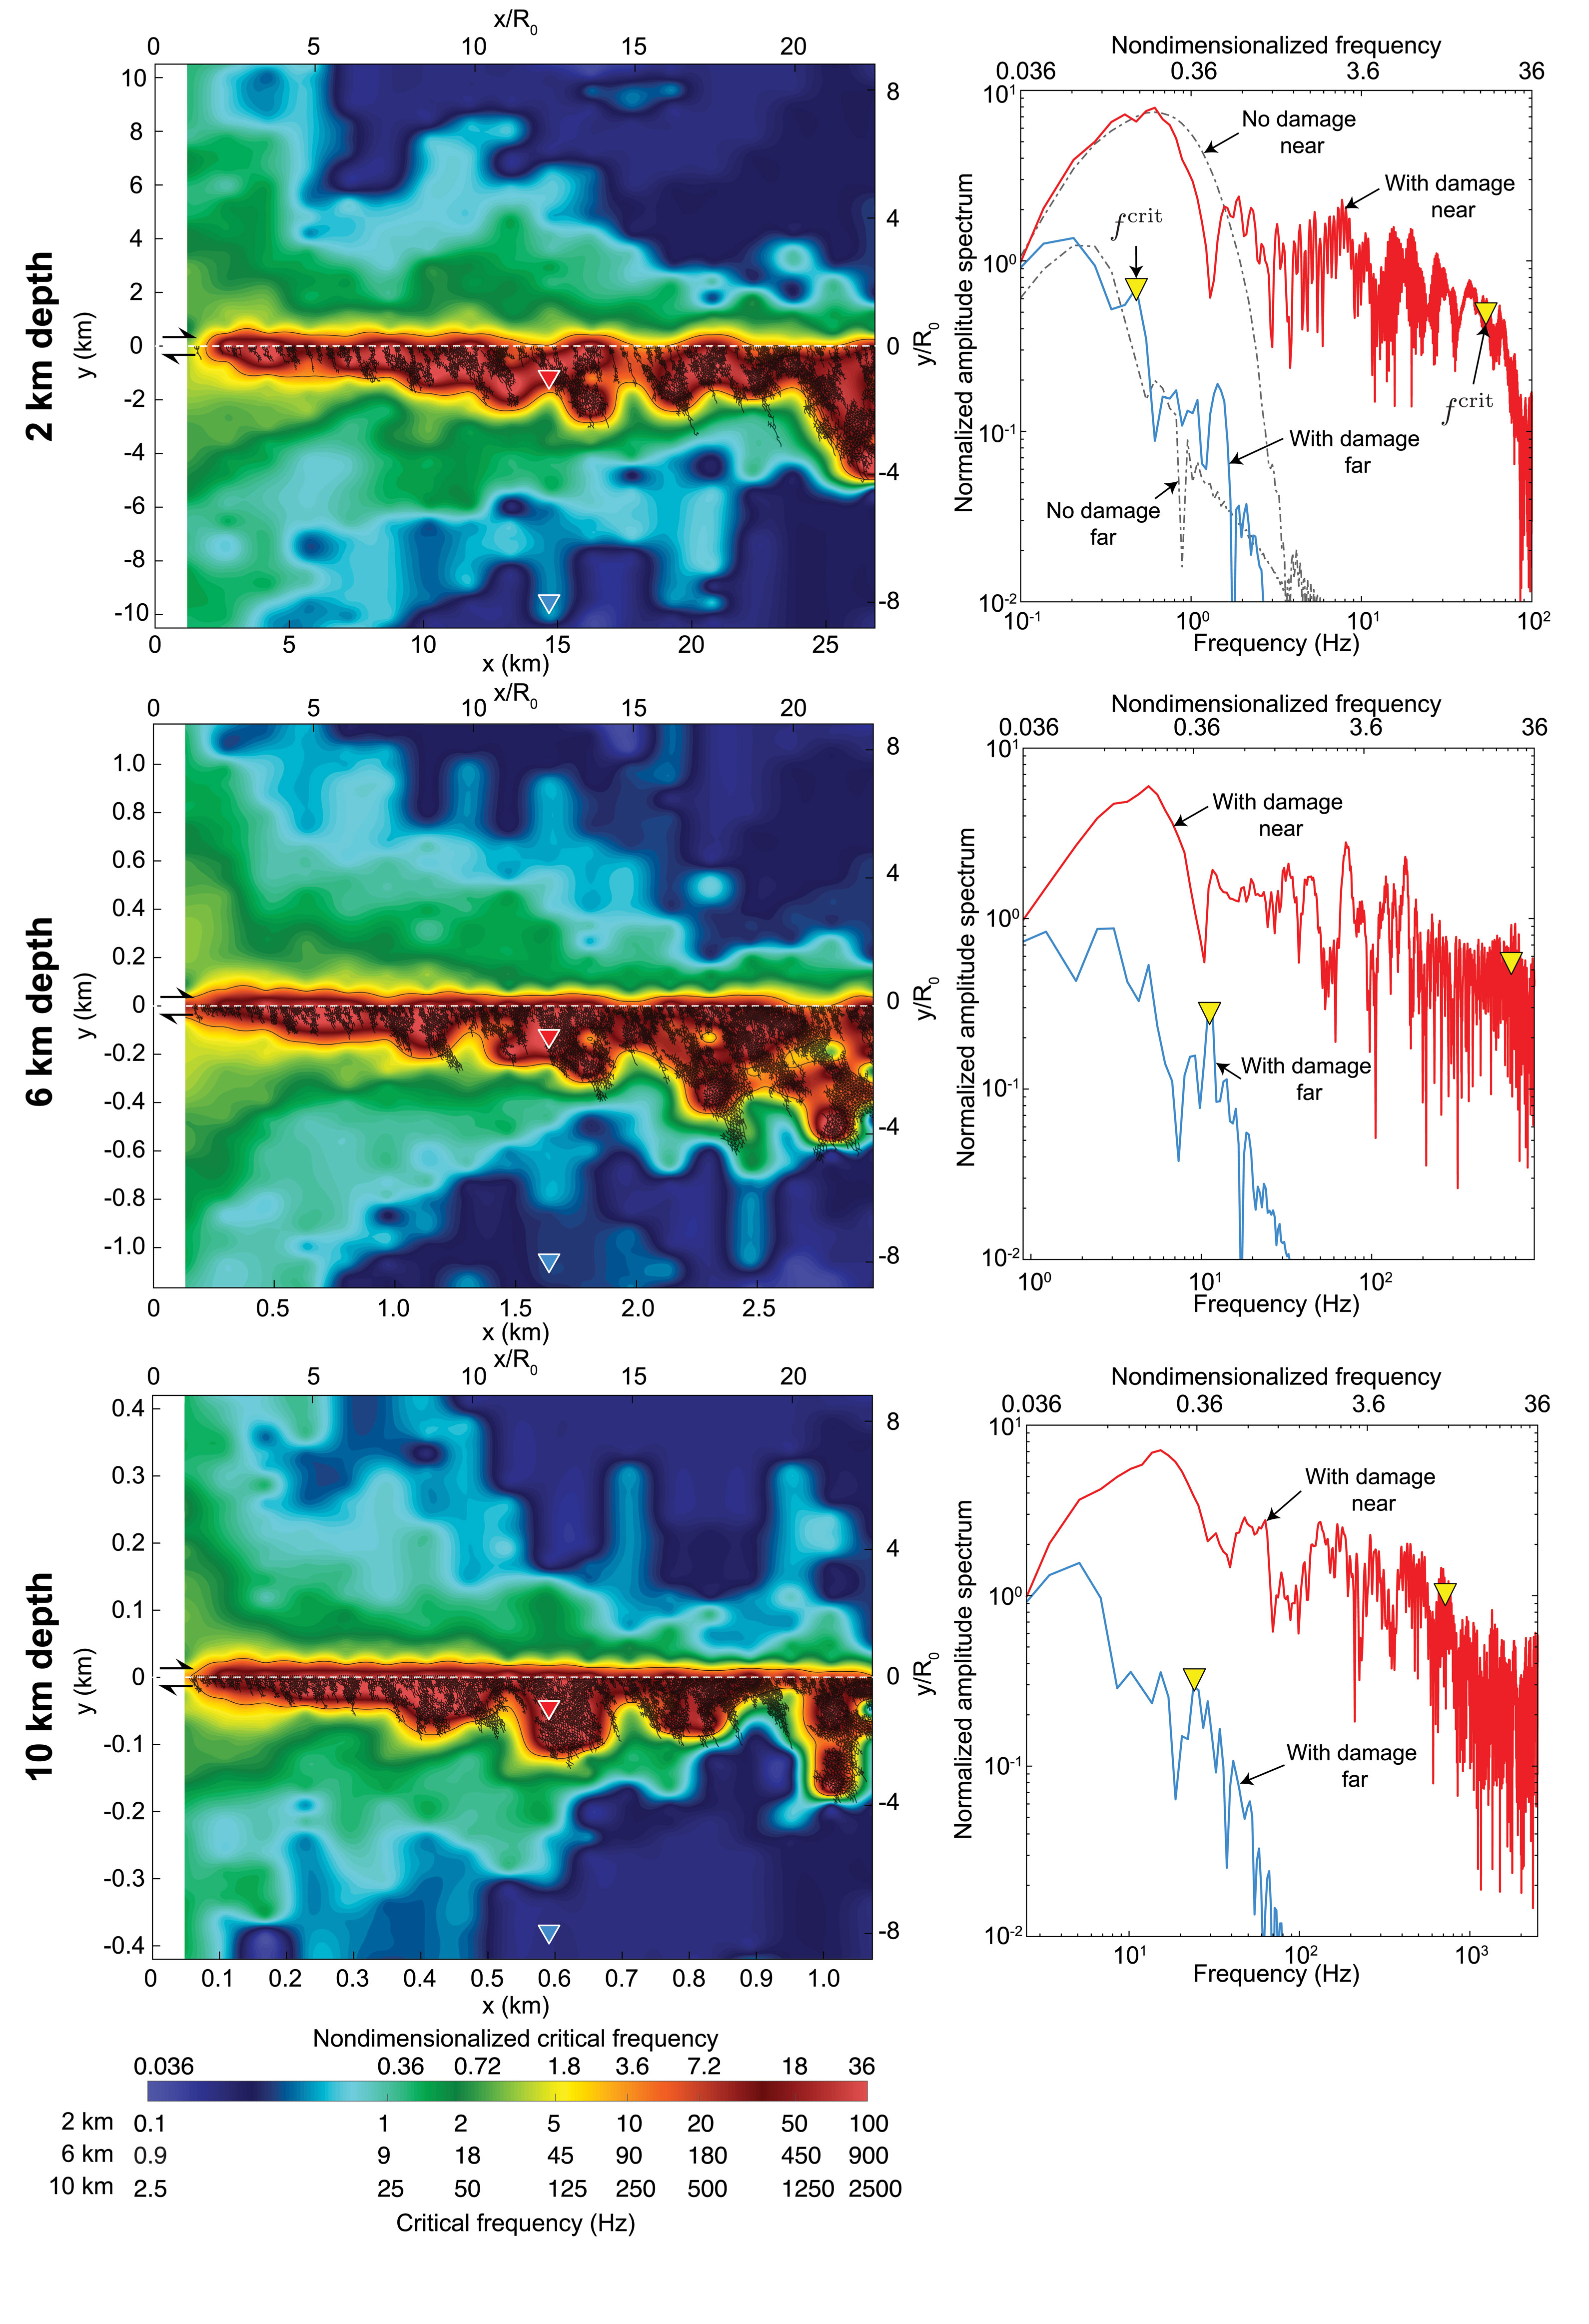
We then investigate the spatial distribution of the high-frequency radiation with depth using the critical frequency , where the amplitude spectrum decays from the mean level of low-frequency band. Figure 12 shows the spatial distribution of , and the near- and far-fault spectra. Note that the far-fault does not mean the far-field ground motion, where the near-field and intermediate-field terms are negligible in point source model. The near-fault amplitude spectrum in the right column of Figure 12 is evaluated within the damage zone, which is not intended for the direct comparison to the observations as there might be technical issues on the implementation of instruments close to the fault.
The signal time window starts from the first arrival time at the location to the end of simulation. We applied a band-pass filter of 0.1-100 Hz and a Tukey window. The spectra for the case without off-fault damage are superimposed at 2km depth for the comparison. The results show significant high-frequency radiation caused by the secondary fractures, which propagates even outward from the damage zone. Therefore, although the high-frequency radiation is quickly attenuated due to the geometric dispersion, the coseismic off-fault damage is clearly one of the factors which effects the high-frequency radiation in the near field.
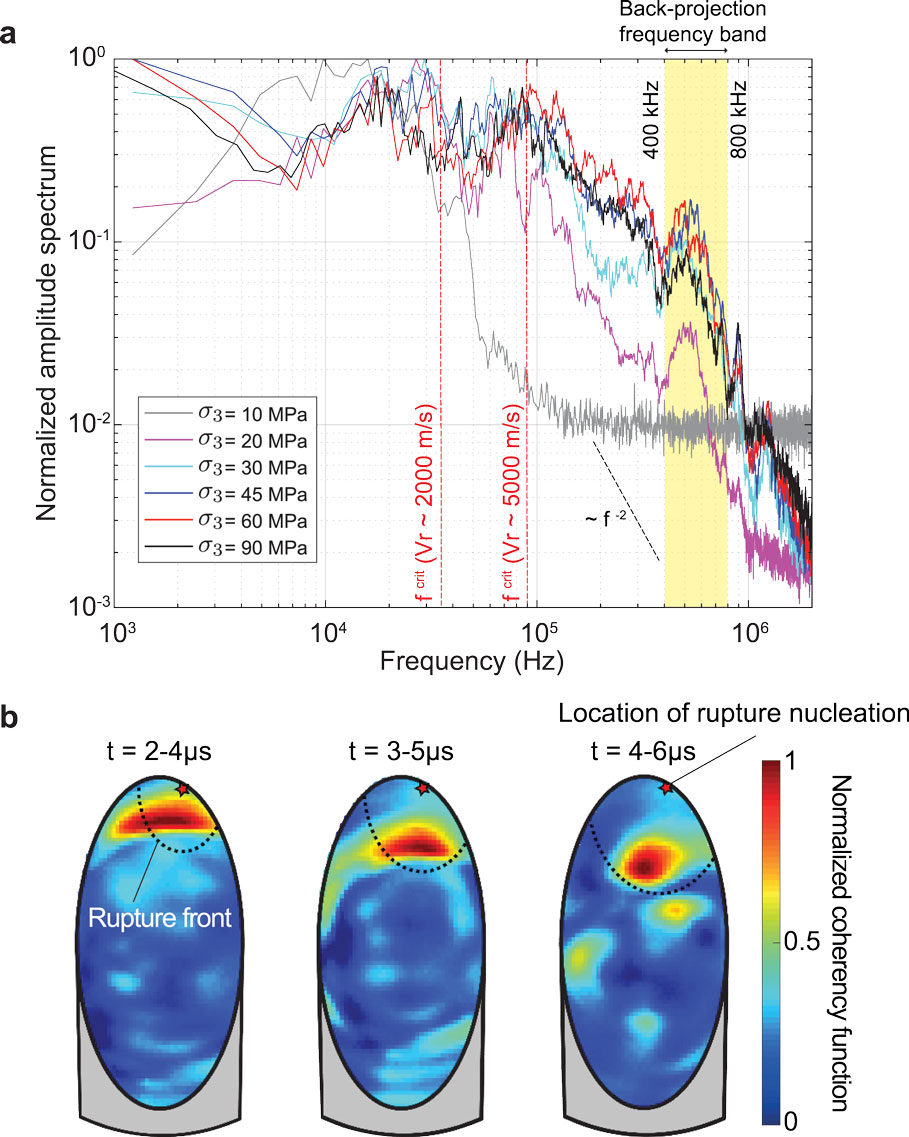
The enhanced high-frequency radiation associated with dynamic ruptures is also studied by experiments. Marty et al., (2019) conducted systematic stick-slip experiments with saw-cut Westerly granites under servo-controlled triaxial loading with the confining pressure ranging from 10 MPa to 90 MPa to investigate the enhanced high-frequency radiation in acoustic recordings of the stick-slip events. The acoustic sensors are externally located on the surface of specimen, which record the motion of the normal component to the surface. The representative Fourier spectra are obtained by taking an average of 13 acoustic sensors on the specimen to get rid of directivity effect. Further information of these experiments can be found in Marty et al., (2019).
Figure 13a shows the Fourier spectra with different confining pressures. Each spectrum amplitude is normalized by its corresponding stress drop in order to compare the high-frequency content. The theoretical critical frequencies for =2000m/s (for sub-Rayleigh) and =5000m/s (for supershear) are indicated, implying the rupture transitions to supershear with MPa. Certainly, one of the possible reasons for the enhanced high-frequency components is the supershear transition. However, there is also an enhanced frequency band from 400 kHz to 800 kHz, which can be caused by the coseismic off-fault damage. Thus they conducted back-projection analysis to investigate the spatiotemporal evolution of seismic energy release in this frequency band.
Figure 13b shows snapshots of back-projection results for a certain stick-slip event with MPa. The color contour indicates the normalized coherency function, which shows the most likely location of the origin of the signal within the frequency band. The rupture is spontaneously nucleated at the edge of the saw-cut surface, and propagates downward. The theoretical rupture front is also superimposed on the fault surface. The results show that the high-frequency signals within this band originate just behind the rupture front, which can be caused by the coseismic off-fault damage as compared to the off-fault fracturing process discussed in section 3. The experimental results demonstrate the first-order analysis of the mechanism of enhanced high-frequency radiation, which is in agreement with the secondary fracturing mechanism as shown in Figure 5
6 Overall energy budget
The overall energy budget of an earthquake event plays a key role in understanding the characteristics of the earthquake source, the change of potential energy and the radiation. Here, we first describe the formulation of energy balance, which can be used to evaluate the overall energy budget associated with the dynamic earthquake rupture with coseismic off-fault damage. Although there are various approaches to derive the energy conservation law of earthquake ruptures (e.g. Rivera and Kanamori,, 2005; Fukuyama,, 2005; Shi et al.,, 2008; Xu et al.,, 2012), we reidentify the energy components in a suitable form for the analysis of the overall energy budget with our numerical framework.
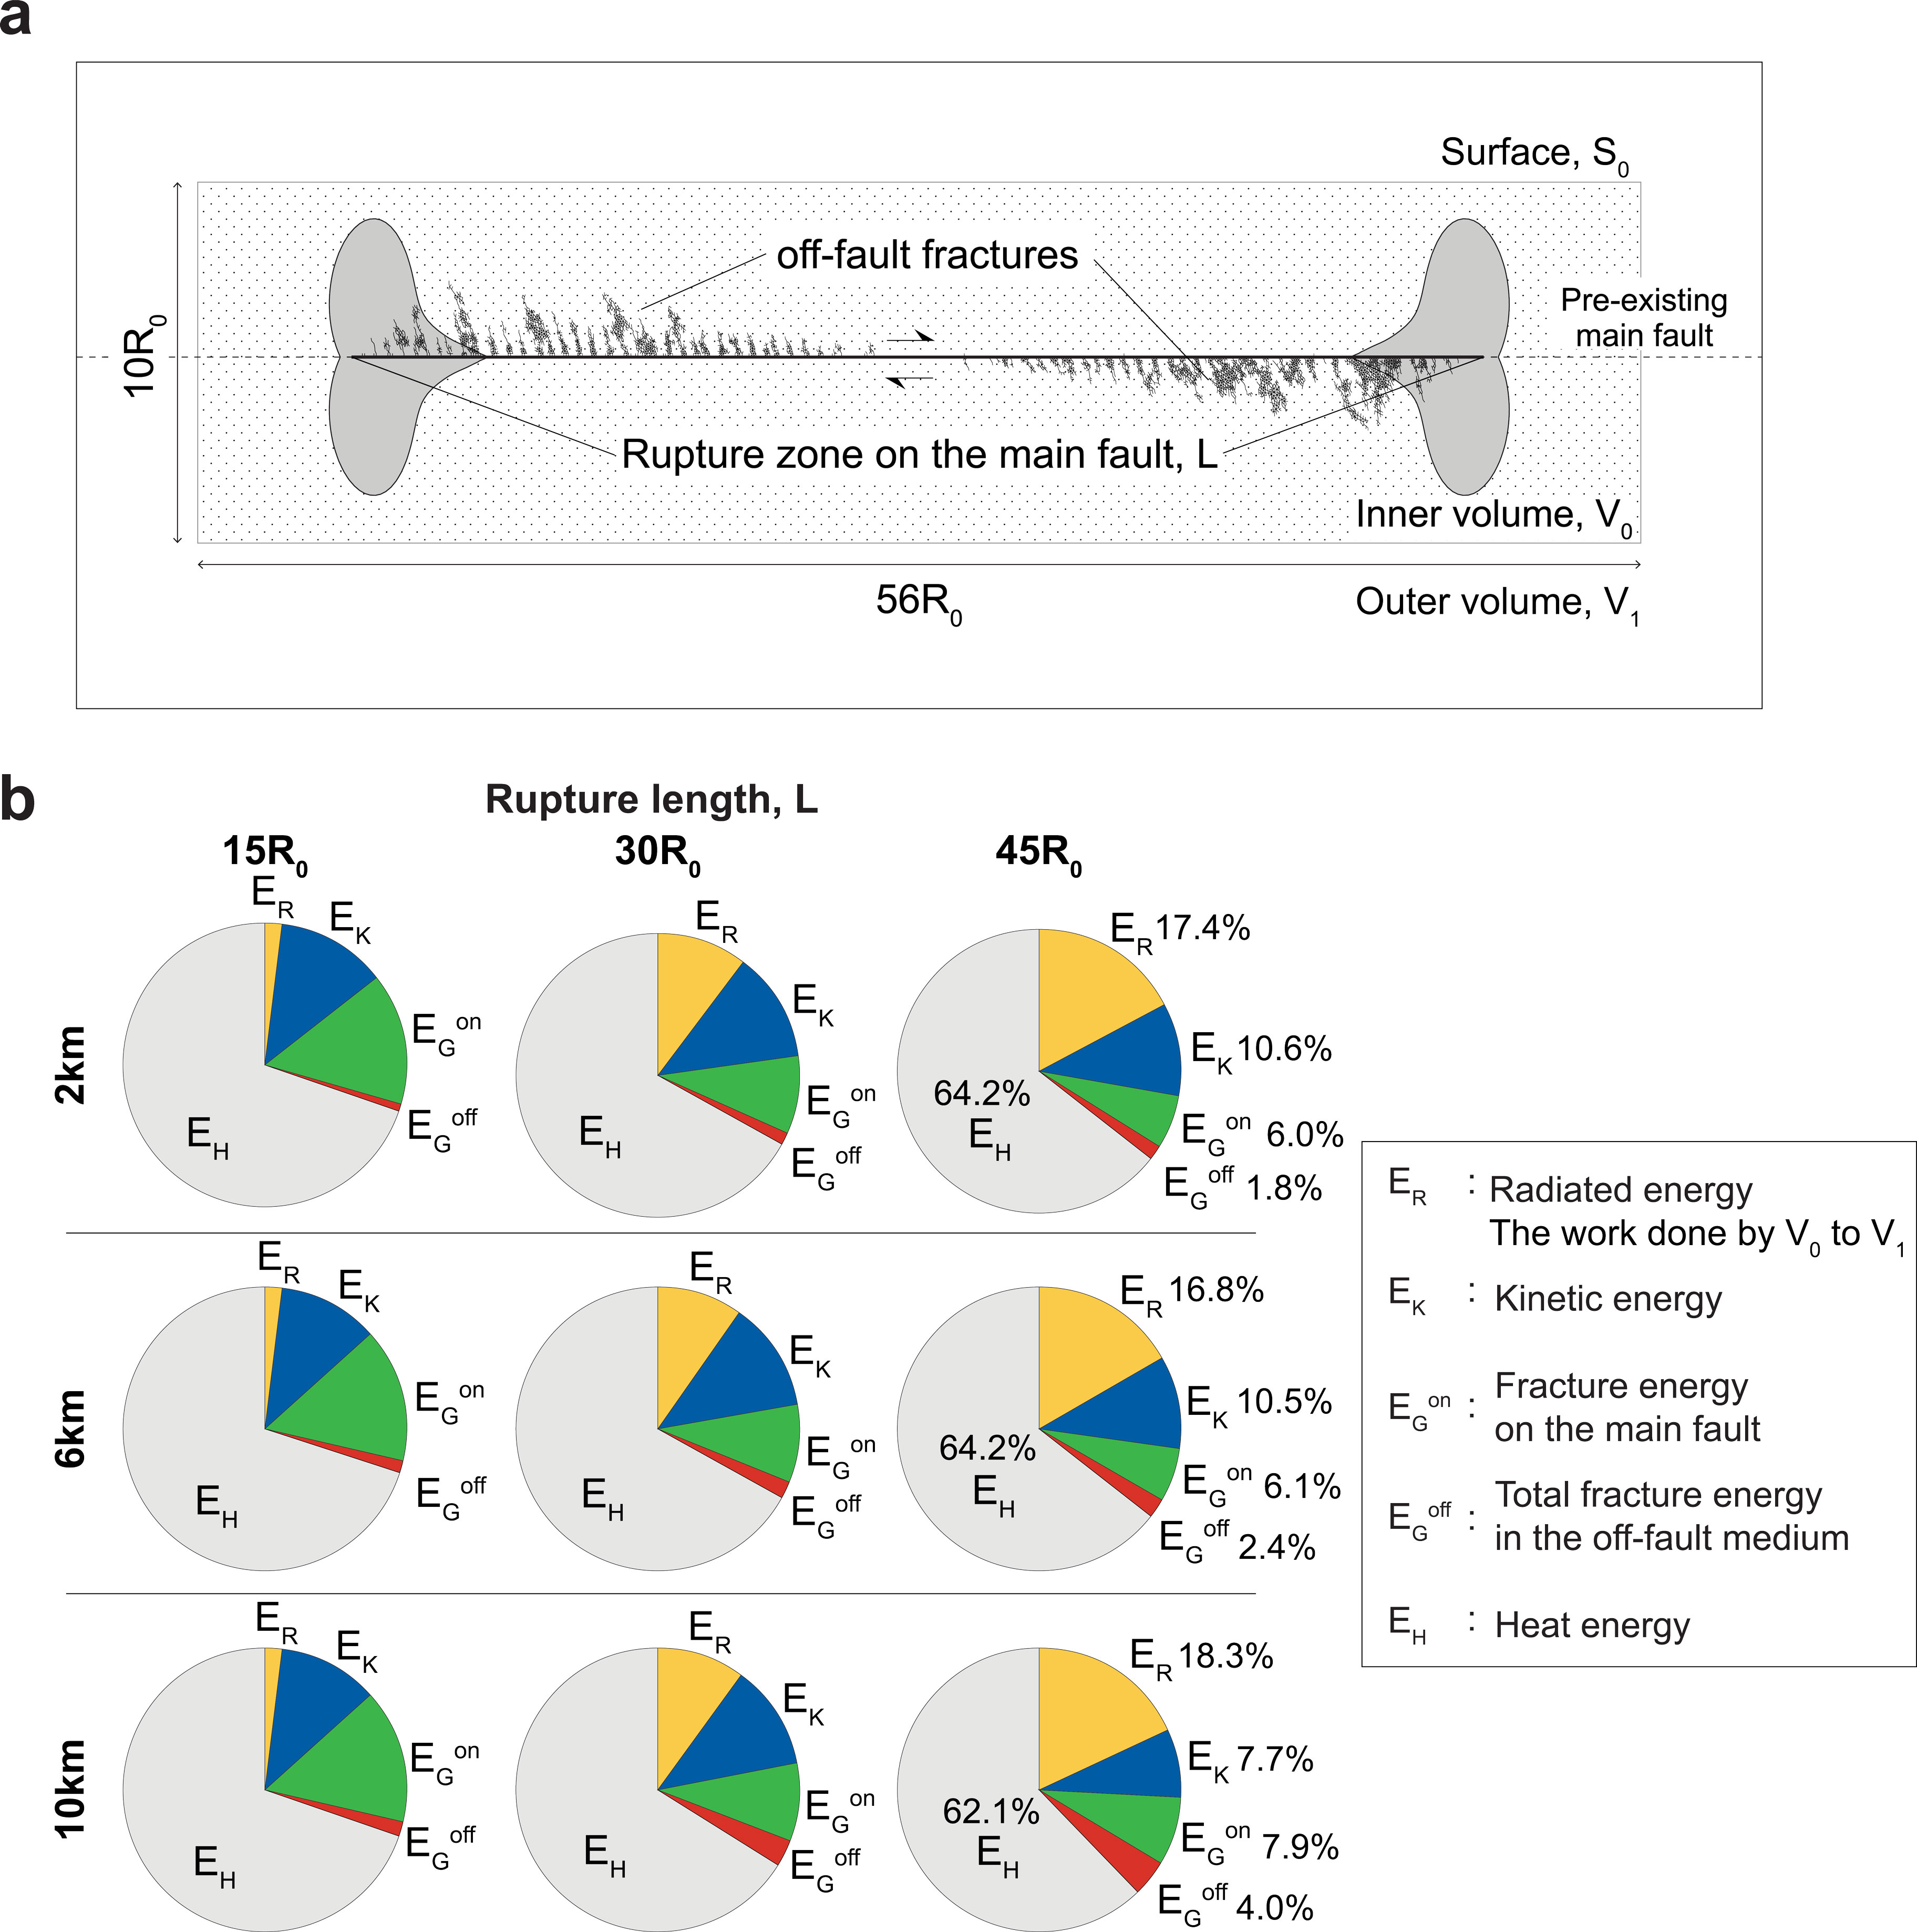
The overall energy budget is evaluated in an inner volume as shown in Figure 14a, which encompassing entire rupture zone and off-fault fractures. Then the energy components associated with the overall energy budget are written as follows:
-
•
Elastic strain energy
(3) where is strain tensor and is stress tensor. Note that the initial strain is defined to be zero, whereas the initial stress is nonzero. This configuration is commonly used in seismology, discussed in Aki and Richards, (2002, BOX 8.5).
-
•
Kinetic energy
(4) where is density and is particle velocity.
-
•
Radiated energy
(5) where is the closed surface of , is the traction on and . is essentially the work done by to outer volume . Note that the canonical is determined at the end of earthquake event, where in (Kostrov,, 1974), whereas defined by equation (5) is a function of time due to our model description with infinite fault length, where the rupture does not cease during simulation.
-
•
Fracture energy on the main fault
(6) where is the surface of main fault, is the critical slip for elastic loading of friction (see A.2), is critical slip distance of slip-weakening law on the main fault, is slip at and is shear traction on the fault. Note that is always positive during the slip-weakening of friction.
-
•
Fracture energy associated with the off-fault damage
(7) where is the surface of off-fault fracture, is the number of off-fault fractures, is the critical slip for elastic loading of tensile and shear cohesion, is the maximum displacement for softening of tensile and shear cohesion, is critical slip distance of slip-weakening law in the off-fault medium, is opening and shear displacement at and is the tensile and shear cohesion.
-
•
Heat energy
(8)
Using the energy components described above, the overall energy budget is written as
| (9) |
where
| (10) |
originates from the definition of radiated energy in equation (5), which does not appear in the conventional energy conservation law on earthquake (e.g. Rivera and Kanamori,, 2005) because of reasonable approximation processes to estimate the radiated energy. In this study, however, we define the overall energy budget with to rigorously estimate the contribution of each energy components to the overall energy budget. Note that we ignore the consumed energies by elastic loading as they are negligible with large stiffness in cohesion and friction law. The detailed derivation of the overall energy budget can be found in Okubo, (2018).
6.1 Energy dissipation in off-fault medium
Figure 14b shows the fraction of each energy components in the left side of equation (9) as a function of rupture length with depth. Each fraction is calculated against . Currently, , , , and are directly calculated from the simulation, whereas and are indirectly evaluated with the assumption of average displacement on the off-fault fractures due to the current limitation of post-processing. Note that the fracture energy is constant along the main fault. More details for the calculation of energy components can be found in Okubo, (2018, section 3.4).
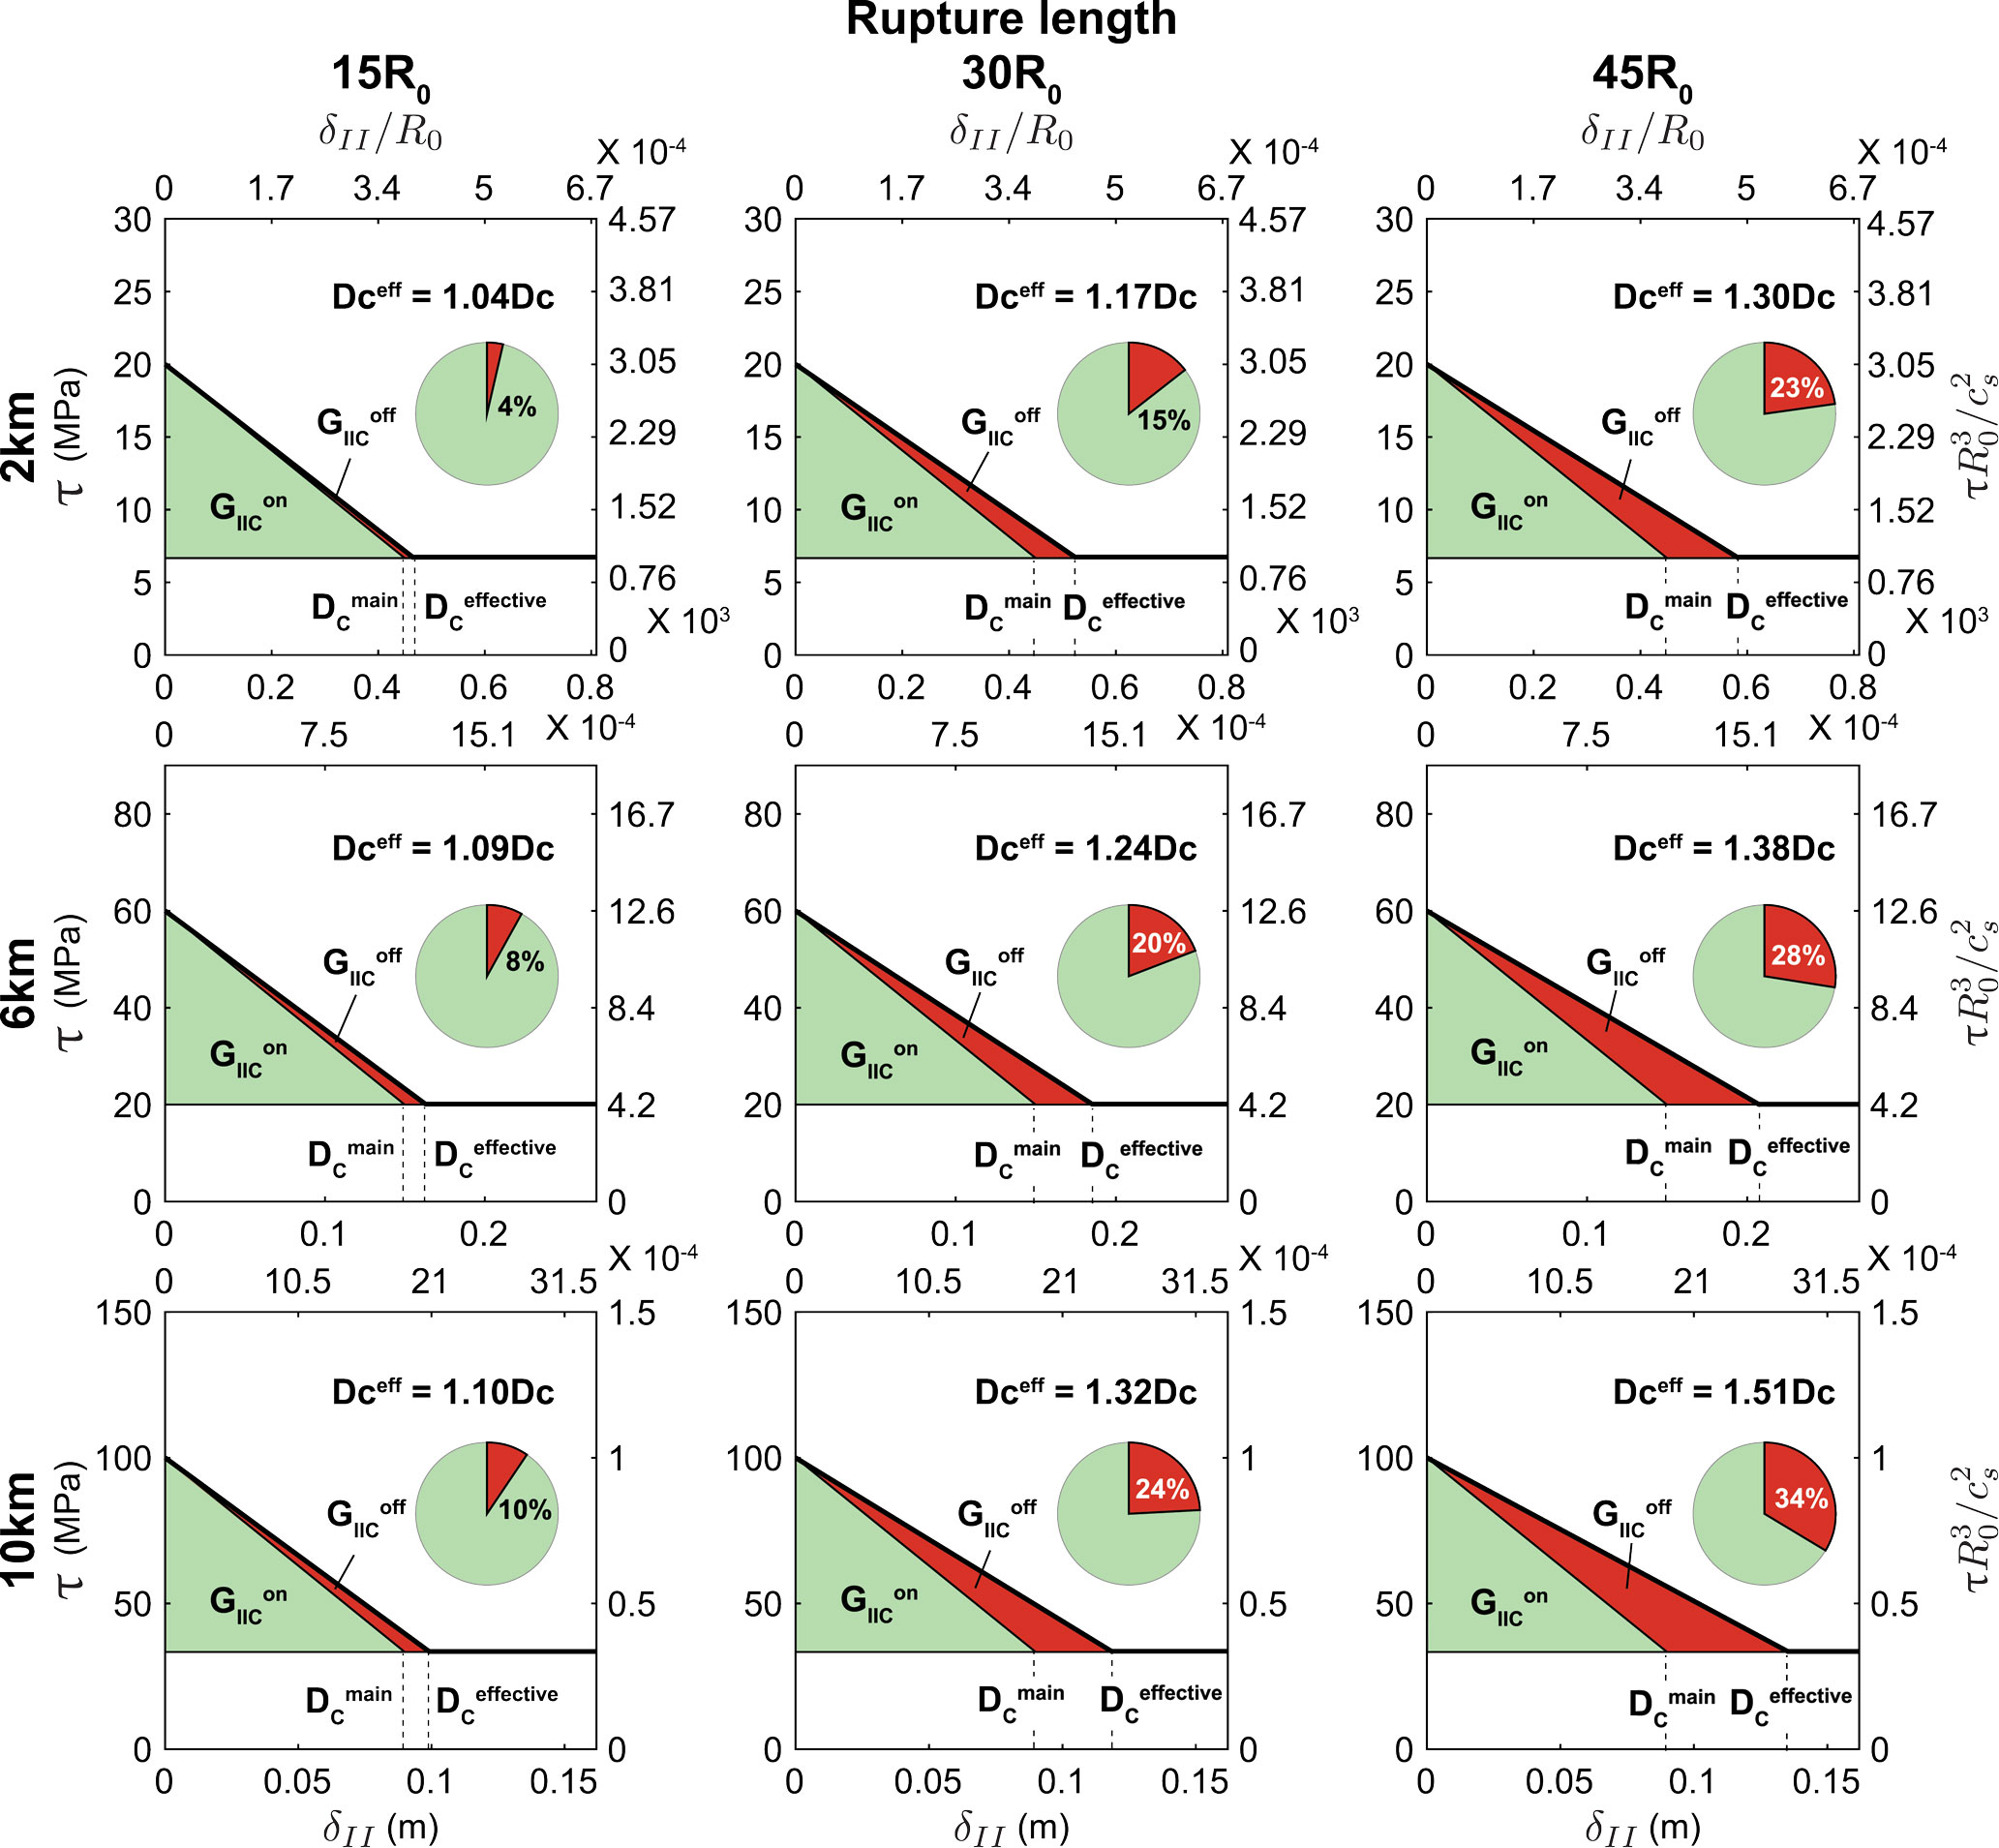
The fraction of fracture energy associated with the off-fault damage increases with the rupture length. Moreover, it also increases with depth even though damage zone width becomes narrower at depth. To highlight the fraction of against , we calculated the effective defined as
| (11) |
where is the rupture length. Note that we assume unit thickness of the fault. Figure 15 shows as a function of rupture length with depth calculated from Figure 14b. increases with the rupture length and with depth, implying more energy dissipation in the off-fault medium with large ruptures at depth. Up to the half amount of the fracture energy on the main fault can be also dissipated in the off-fault medium due to the coseismic off-fault damage at depth.
6.2 Seismic efficiency
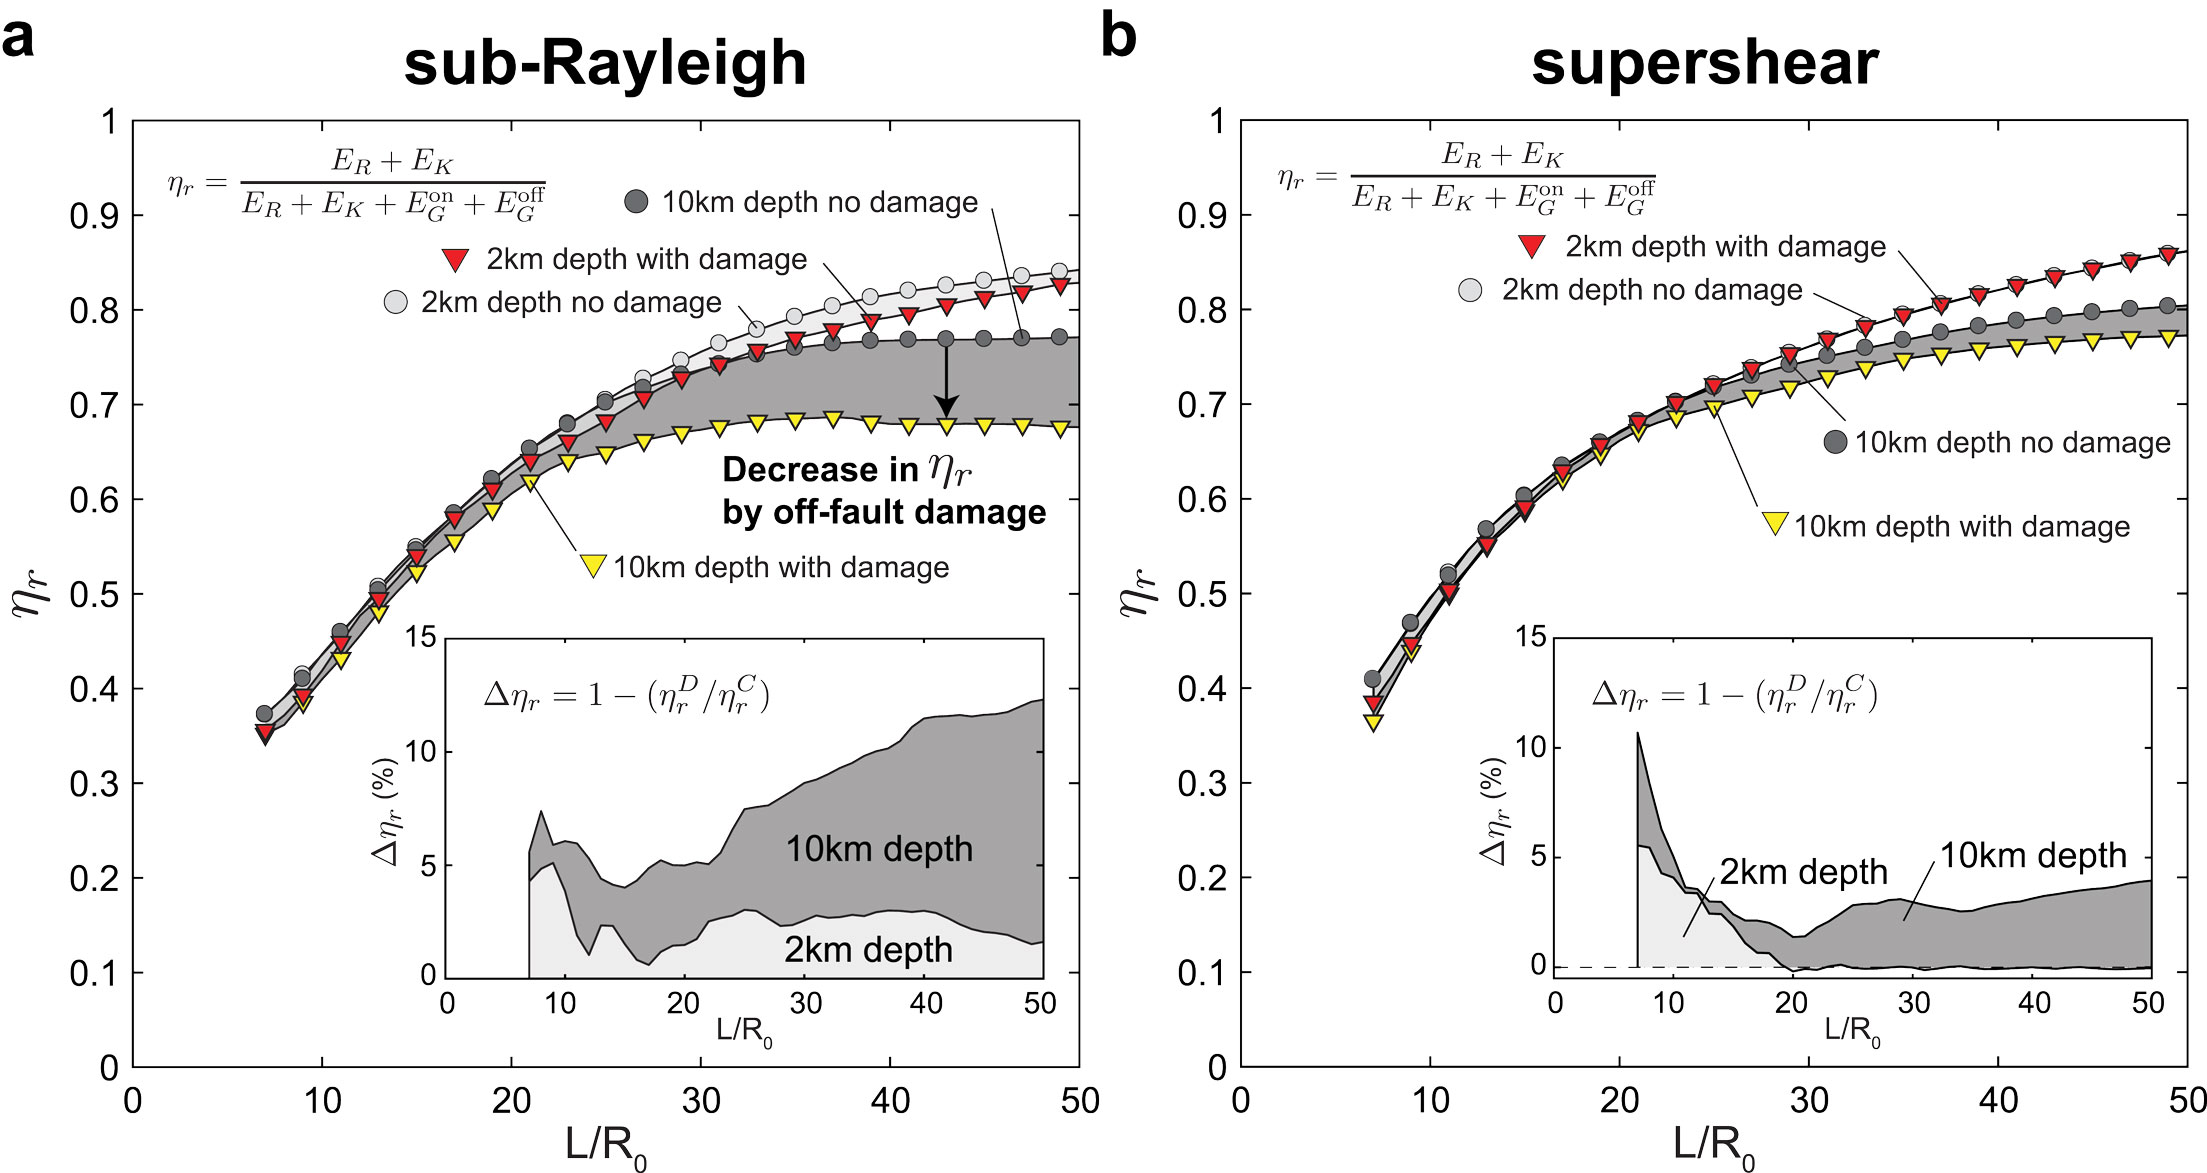
Seismic efficiency is an important parameter to quantify the proportion of radiated energy to the sum of radiated energy and fracture energy, which essentially evaluates the balance between the radiated energy as seismic waves and the dissipated energy due to on- and off-fault fracturing (Kanamori and Brodsky,, 2004). Since we can only evaluate the temporal radiated energy in equation (5) because of the infinite fault length in our model description, we define modified seismic efficiency for this study, given by
| (12) |
The physical interpretation of this quantity is same with the canonical seismic efficiency. We evaluated the evolution of as a function of rupture length at 2km and 10km depths and compared between the cases with and without off-fault damage to investigate the effect of off-fault damage on the seismic efficiency. Figure 16 shows the for the cases with and . The relative difference between the cases with and without off-fault damage is plotted in insets, defined as
| (13) |
where and indicate the with and without off-fault damage, respectively. There is a significant decrease in due to the coseismic off-fault damage, particularly in the deeper case with sub-Rayleigh rupture. This can be explained by the denser and more intricate off-fault fracture network formed with deeper cases. Therefore, although the secondary off-fault fractures effect the additional high-frequency radiation, we maintain that the coseismic off-fault damage absorbs some of available energy, which is inherently converted to the radiated energy for the cases without off-fault damage.
7 Conclusion
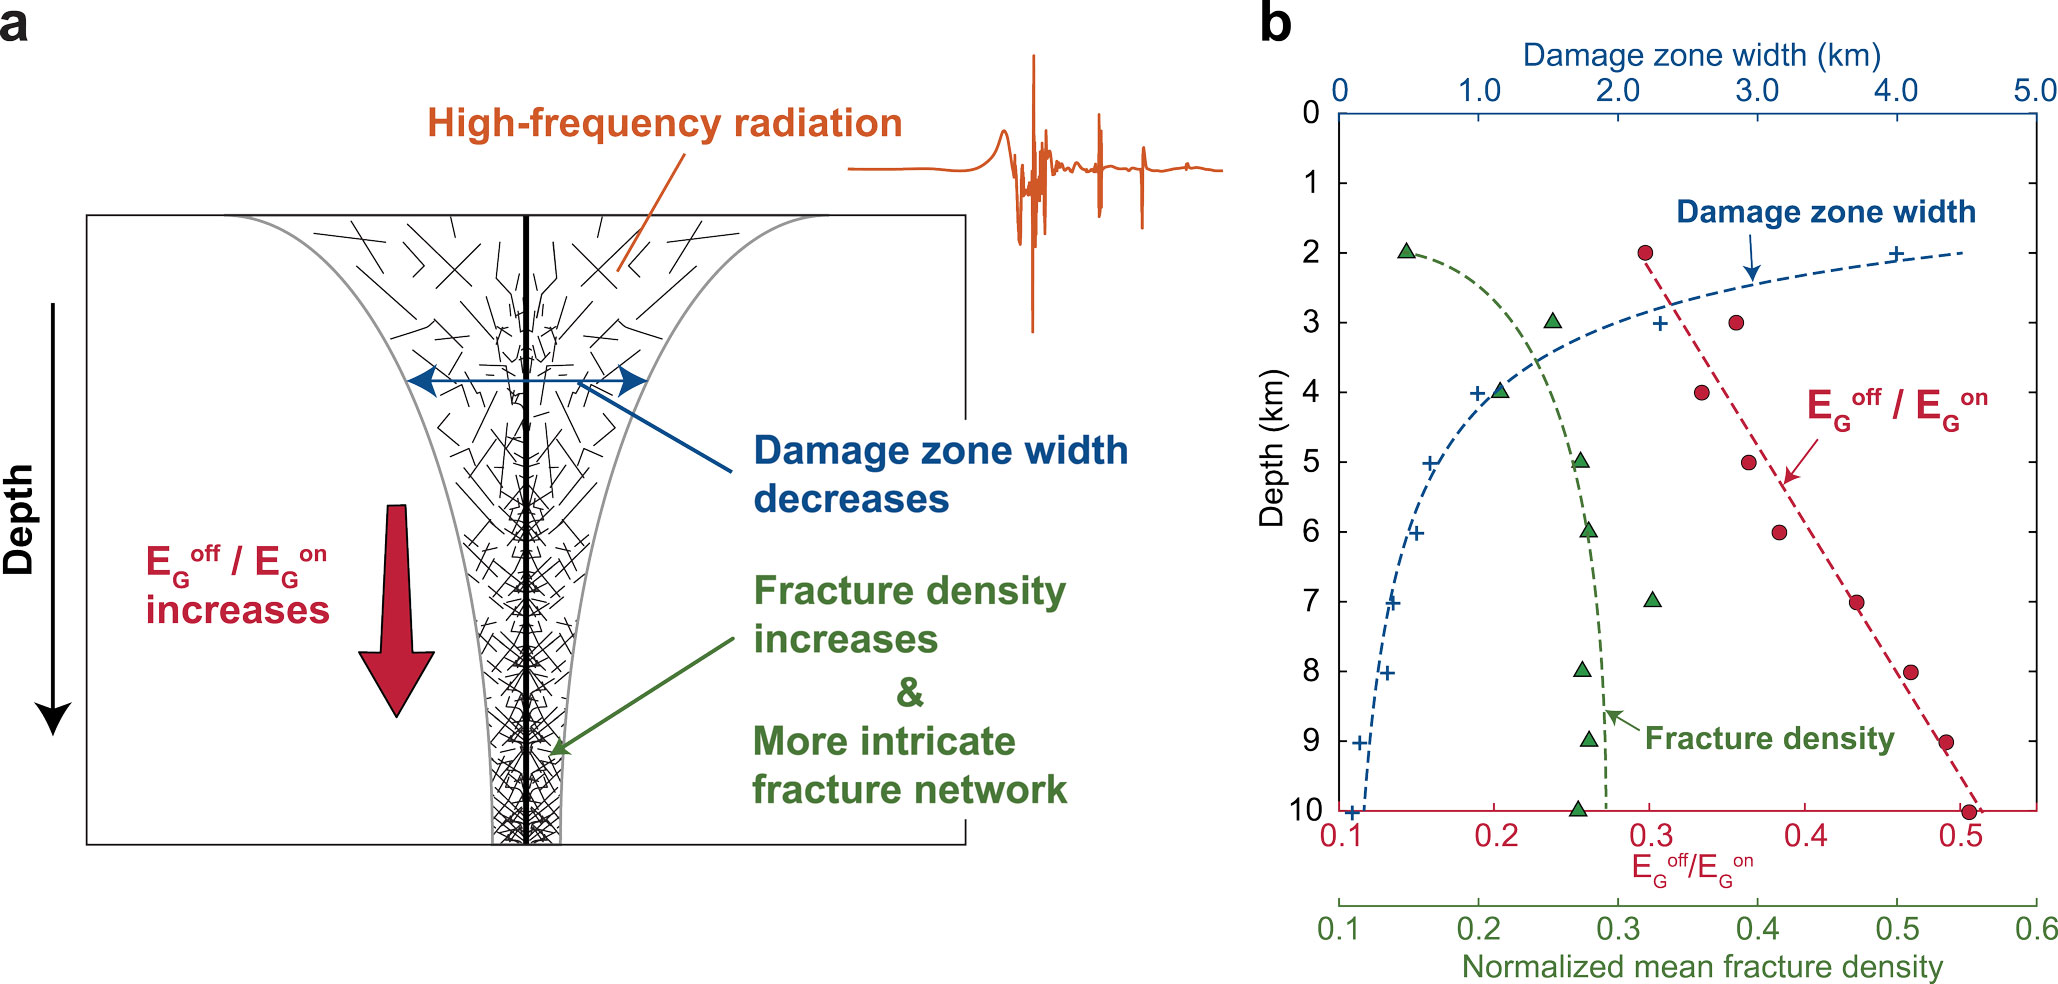
Our systematic case study with depth demonstrated the mechanisms of coseismic off-fault fracturing and its effect on the rupture dynamics, the radiation and the overall energy budget. The damage zone width decreases with depth, whereas the fracture density and the contribution of energy dissipation in off-fault medium globally increases with depth in nondimensional comparison. Overall, Figures 17a and 17b show the schematic of fault structure with depth based on this study and the summary of numerical results, inferred from the sub-Rayleigh cases (). The fracture density is evaluated using a representative value averaged over space with Figure 6. The damage zone width becomes narrower with depth, whereas the contribution of fracture energy to the overall energy budget rather increases with depth due to the increase in fracture density and complexity of off-fault fracture network.
In this study, we conducted simulations with intact rock, and with fixed orientation of principal stress at 60∘. Therefore, we observed the coseismic off-fault damage only in the extensional side of the fault. However, in nature, the off-fault damage is often observed on both sides of the fault. Due to the model constraints above, the present results, such as the damage zone width, do not always provide a close quantitative agreement to the observations.
The preexisting damage of the off-fault medium, the initial cohesion on the main fault, which is assumed to be zero in this study, and the orientation of the maximum principal stress also play a role in the off-fault damage on the compressional side.These need to be investigated by extensive parametric studies.
The present numerical framework is capable of the application to the natural fault system. Klinger et al., (2018) showed the dynamic earthquake rupture modeling on the 2016 Kaikōura earthquake with the same numerical framework we proposed in this study. They used the dynamic earthquake rupture modeling to resolve the most likely rupture scenario by comparing cosesmic off-fault damage pattern to the observations.
This study has opened an avenue to model dynamic earthquake ruptures with FDEM, which allows for modeling dynamic earthquake ruptures with coseismic off-fault damage to better understand the fracturing mechanisms, the radiation and the overall energy budget associated with earthquakes.
Appendix A Methodology for modeling coseismic off-fault damage with FDEM
Geological faults can be defined as discontinuities in a continuum medium. From this perspective, we consider both the faults and the off-fault damage as an aggregation of fractures at different length scales. FDEM is capable of modeling both continuum deformation and fracturing (i.e. dynamic rupture on the main fault and the off-fault damage) within the same numerical framework. In this appendix, we describe the essence of numerical framework for dynamic earthquake rupture modeling with coseismic off-fault damage. A set of detailed model formulation can be found in Okubo, (2018). More details of main algorithmic solutions used within HOSSedu can be found in a series of monographs (Munjiza,, 2004; Munjiza et al.,, 2011, 2015).
A.1 Initial stress state at depth
We follow a similar process to that proposed by Templeton and Rice, (2008) and Xu et al., (2012) to make an assumption of initial stress state as a function of depth. The initial stress state is set for triggering right-lateral strike-slip on the main fault. The initial stress state is uniform in the homogeneous and isotropic elastic medium, given by
| (14) |
Note that we assume plane strain conditions. Let normal stress on the main fault be given by linear overburden effective stress gradient as it provides an approximation of the magnitude of normal stress on the main fault with depth, such that
| (15) |
where is the density of rock, is the density of water, is the gravitational acceleration and is the depth measured from the ground surface. The initial shear stress is estimated in terms of the seismic S ratio, defined by Andrews, (1976), on the main fault such as
| (16) |
where and are the static and dynamic friction coefficients, respectively. The S ratio defines whether the rupture transitions to supershear (), or remains sub-Rayleigh () with 2-D purely elastic model (i.e. no off-fault damage). From equation (16), the initial shear stress on the main fault can be written as
| (17) |
The horizontal compressive stress is then determined by the normal stress , shear stress and the given orientation of initial compressive principal stress to the main fault as follows:
| (18) |
In the present study, we examined the cases with and to simulate sub-Rayleigh and supershear ruptures with coseismic off-fault damage, respectively. However, the examined S ratios are relatively low as both and lead to supershear transition without the off-fault damage as shown in Figure 10. The analysis of the effect of coseismic off-fault damage with larger S () remains to be done as the dominant wing cracks are activated from the edges of nucleation patch during nucleation phase, which prevents the rupture nucleation and the propagation along the main fault. Therefore, to avoid the huge stress concentration at the edge of nucleation patch, we need to improve the nucleation process, e.g. a gaussian distribution of peak strength within the nucleation patch.
A.2 Damage type and fracture energy
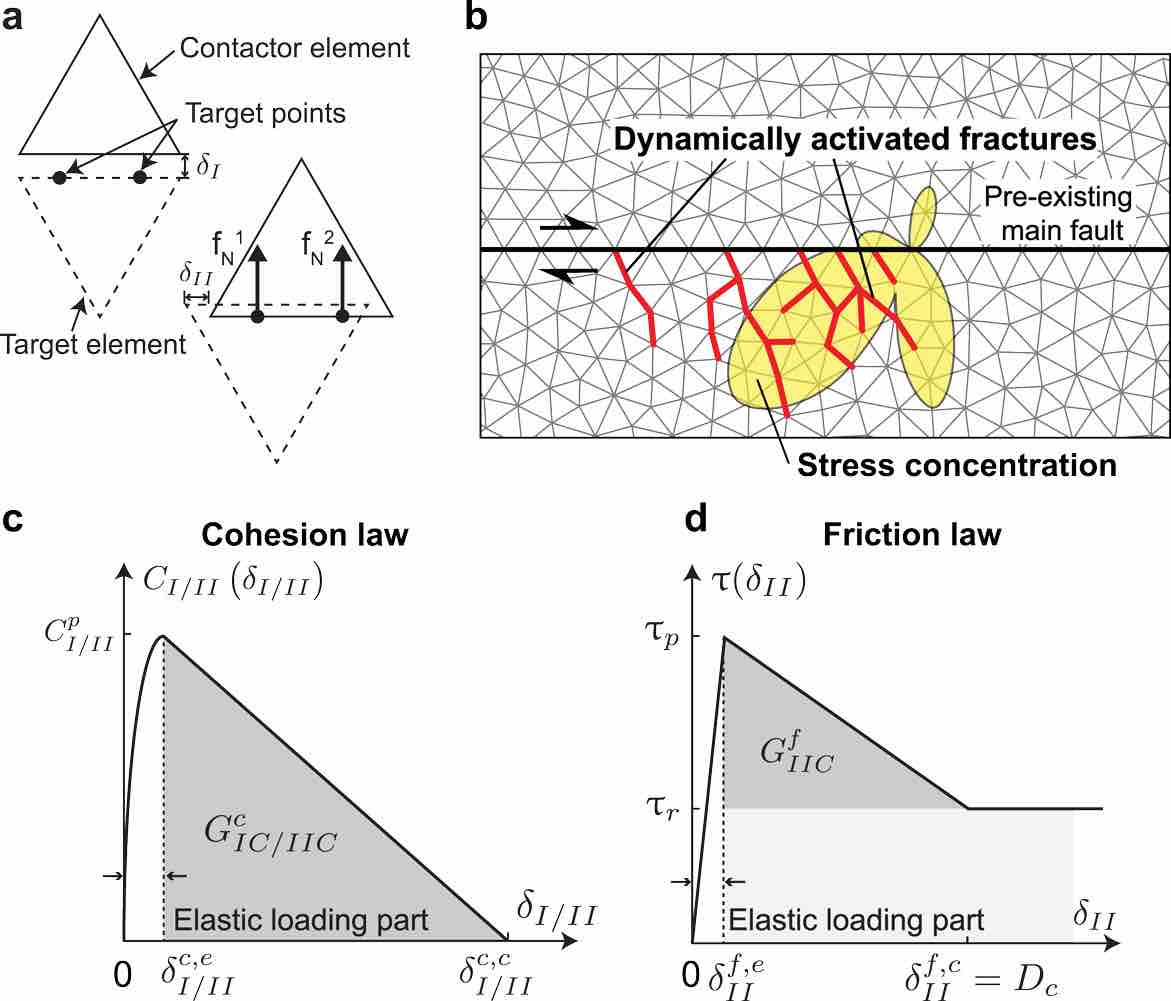
In the FDEM framework, fractures are represented as the loss of cohesion at the interfaces of the finite elements. The cohesion and the friction against the opening or shear motion between contactor and target are a function of displacements defined by the aperture and the slip (Figure A.1a). Figure A.1b shows the mesh discretization and the schematic of off-fault fractures. The cohesive and frictional resistances are applied on every interface between elements, which is regarded as a potential failure plane. Fractures are activated when the cohesion starts to be broken due to the stress concentration of the dynamic earthquake rupture. Both cohesion and friction curves are divided into two parts, an elastic loading part and a displacement-weakening part as shown in Figure A.1c and A.1d. In the elastic loading part, the resistant forces against displacements acting on the interface increase quadratically (for the case of cohesion) or linearly (for the case of friction) with the stiffness of the elastic loading portions. Since this elastic loading part ideally should be zero to represent the material continuity, the stiffnesses are chosen to be much higher than the Young’s modulus of the material to minimize the displacements associated with the elastic loading.
When the traction applied on the interface reaches the peak cohesion for tensile fractures or for shear fractures , the cohesion starts weakening, and eventually it is totally broken, behaving as a secondarily activated fracture (Figure A.1c). The friction curve follows linear slip-weakening law, originally proposed by Ida, (1972) and Palmer and Rice, (1973), which has been widely used for dynamic earthquake rupture modeling (e.g. Andrews,, 1976; Aochi and Fukuyama,, 2002; De La Puente et al.,, 2009). When the shear traction reaches to frictional strength , it decreases down to the residual strength at critical slip distance for friction as shown in Figure A.1d. and are defined as
| (19) |
| (20) |
where is the normal stress on the contact interface. Note that the friction law is operating both on the main fault and the secondary fractures activated in the off-fault medium. The residual traction on the fracture surface is zero for tensile fractures as long as the damage on the fracture surface is equal to one and as long as the fracture remains open, while the residual shear traction is kept at for shear fractures even after the shear cohesion is broken.
The mixed mode fracture is evaluated by a damage parameter, , which is defined as
| (21) |
| (22) |
| (23) |
where () is the components of damage for tensile and shear fractures, is normal and tangential displacement, is the initial critical displacement for elastic loading, is the maximum displacement during linear-softening, where is the initial critical displacement for linear-weakening part, is the degree of damage and indicates the type of damage. Similar expressions can be found in Rougier et al., (2011) and Lisjak et al., (2014).
Since we used a linear softening law, the fracture energy associated with the cohesion for tensile (mode I) and shear (mode II) fractures (i.e., the energy required to completely break the connection of the contact) is evaluated as
| (24) |
The fracture energy for friction is, following Palmer and Rice, (1973), described as
| (25) |
Note that the elastic loading part for friction is much smaller than , so that the representation of fracture energy by equation (25) is acceptable even without the consideration of elastic loading part.
In this study, we assume that the fracture energy on the main fault is kept constant with depth, denoted as . Thus decreases with depth as follows:
| (26) |
and () are derived with the stiffness of elastic loading part and given fracture energy. The shear fracture energy is estimated from the experiments and observations, following the scaling law between the fracture energy and the amount of slip (Viesca and Garagash,, 2015; Passelègue et al.,, 2016). It provides a reasonable assumption of fracture energy on the fault and in the off-fault medium, corresponding to the mean slip on the main fault and on the off-fault fractures during simulation. The fracture energy on the main fault is assigned to be two orders of magnitude higher than that of individual off-fault fractures because the slip on the main fault is larger than that of the off-fault fractures when modeling with a single planar fault. We assume so that the cohesion and the friction start weakening at the same amount of slip. The detailed formulations can be found in Okubo, (2018, Chapter 2).
A.3 Parametrization for peak cohesions
To determine , we used the closeness to failure , which indicates the safety of the initial stress state to the failure of the material represented by the ratio of the radius of the Mohr’s circle to the distance to the Mohr-Coulomb criteria (see also Templeton and Rice,, 2008). Let and be the maximum and minimum compressive principal stresses. Then is derived from geometrical relationships as
| (27) |
where is the friction angle as . means no failure and implies the initiation of failure in shear on the corresponding plane. Note that locally changes due to perturbations of the stress field.
In the case study, initial is kept constant with depth for the fair comparison between the different stress states. By assuming the constant orientation of maximum compressive principal stress and seismic ratio , the ratio of principal stresses is also kept constant with depth. Thus from equation (27), the ratio has to be kept constant to obtain an equal closeness to failure with depth, implying must increase linearly with depth. Therefore we first calculate as described in section A.1, and then we derive as
| (28) |
where should be chosen carefully to avoid being negative. is chosen from the experiments (Cho et al.,, 2003), kept constant with depth. We assume the acceptable range for is between 1-10 MPa.
A.4 Process zone size
The quasi-static process zone size is used to nondimensionalize length scale as it characterizes the scale of dynamic earthquake ruptures (Poliakov et al.,, 2002; Rice et al.,, 2005), which is described as
| (29) |
where is Poisson’s ratio and is shear modulus. decreases with depth as a function of . Since the size of potential failure area is of the same order of magnitude as in the analysis with steady-state crack (Poliakov et al.,, 2002), the damage zone size is also expected to decrease when assuming constant with depth. Although we model a spontaneous rupture propagation, the results of flower-like structure as shown in Figure 8 can be explained by this estimation as the rupture velocity for the case of sub-Rayleigh rupture (S=1.0) with off-fault damage converges to slightly below of its limiting speed (Figure 10).
The dynamic process zone size is generally inversely proportional to the rupture velocity , given by Rice, (1980, eq. 6.16) and Freund, (1990, eq. 6.2.35). gradually shrinks and asymptotically converges to zero as the rupture velocity approaches its limiting speed, which is known as Lorentz contraction.
A.5 Potential failure area
We superimposed the stress concentration in Figure 5 to highlight the potential failure area, where the secondary fractures are likely to be activated. For tensile fracture, we used the normalized first stress invariant
| (30) |
where and , where in plane strain condition. The small thus indicates less confining pressures. For shear fracture, we used the normalized closeness to failure . The large indicates that the stress state is close to shear failure.
Appendix B Cross-validation of 2-D FDEM for earthquake rupture modeling
We performed cross-validation of the FDEM-based software tool, HOSSedu (denoted as HOSS in this section), to assess the achievable accuracy of dynamic earthquake rupture modeling with purely elastic medium, i.e. no off-fault damage, by comparing the results with HOSS to those with other numerical schemes. We chose the finite difference method (FDM), the spectral element method (SEM) and the boundary integral equation method (BIEM) as comparison basis as they have been verified in previous studies (e.g. Koller et al.,, 1992; Day et al.,, 2005; Kaneko et al.,, 2008).
The cross-validation effort for HOSS is based on a similar process to Kaneko et al., (2008). The first arrival time of the rupture is used to evaluate the numerical precision of the rupture solution (Day et al.,, 2005). In this study, the rupture arrival time is defined when the shear traction reaches the peak strength . We followed the version 3 of the benchmark problem proposed by the Southern California Earthquake Center/U.S. Geological Survey (SCEC/USGS) dynamic earthquake rupture code verification exercise (Harris et al.,, 2009), commonly used for cross-validating numerical schemes (Day et al.,, 2005; Kaneko et al.,, 2008; Rojas et al.,, 2008; De La Puente et al.,, 2009). The model is originally described in 3-D so that the 2-D analog model was used in this study, similar to Rojas et al., (2008), Kaneko et al., (2008), and De La Puente et al., (2009).
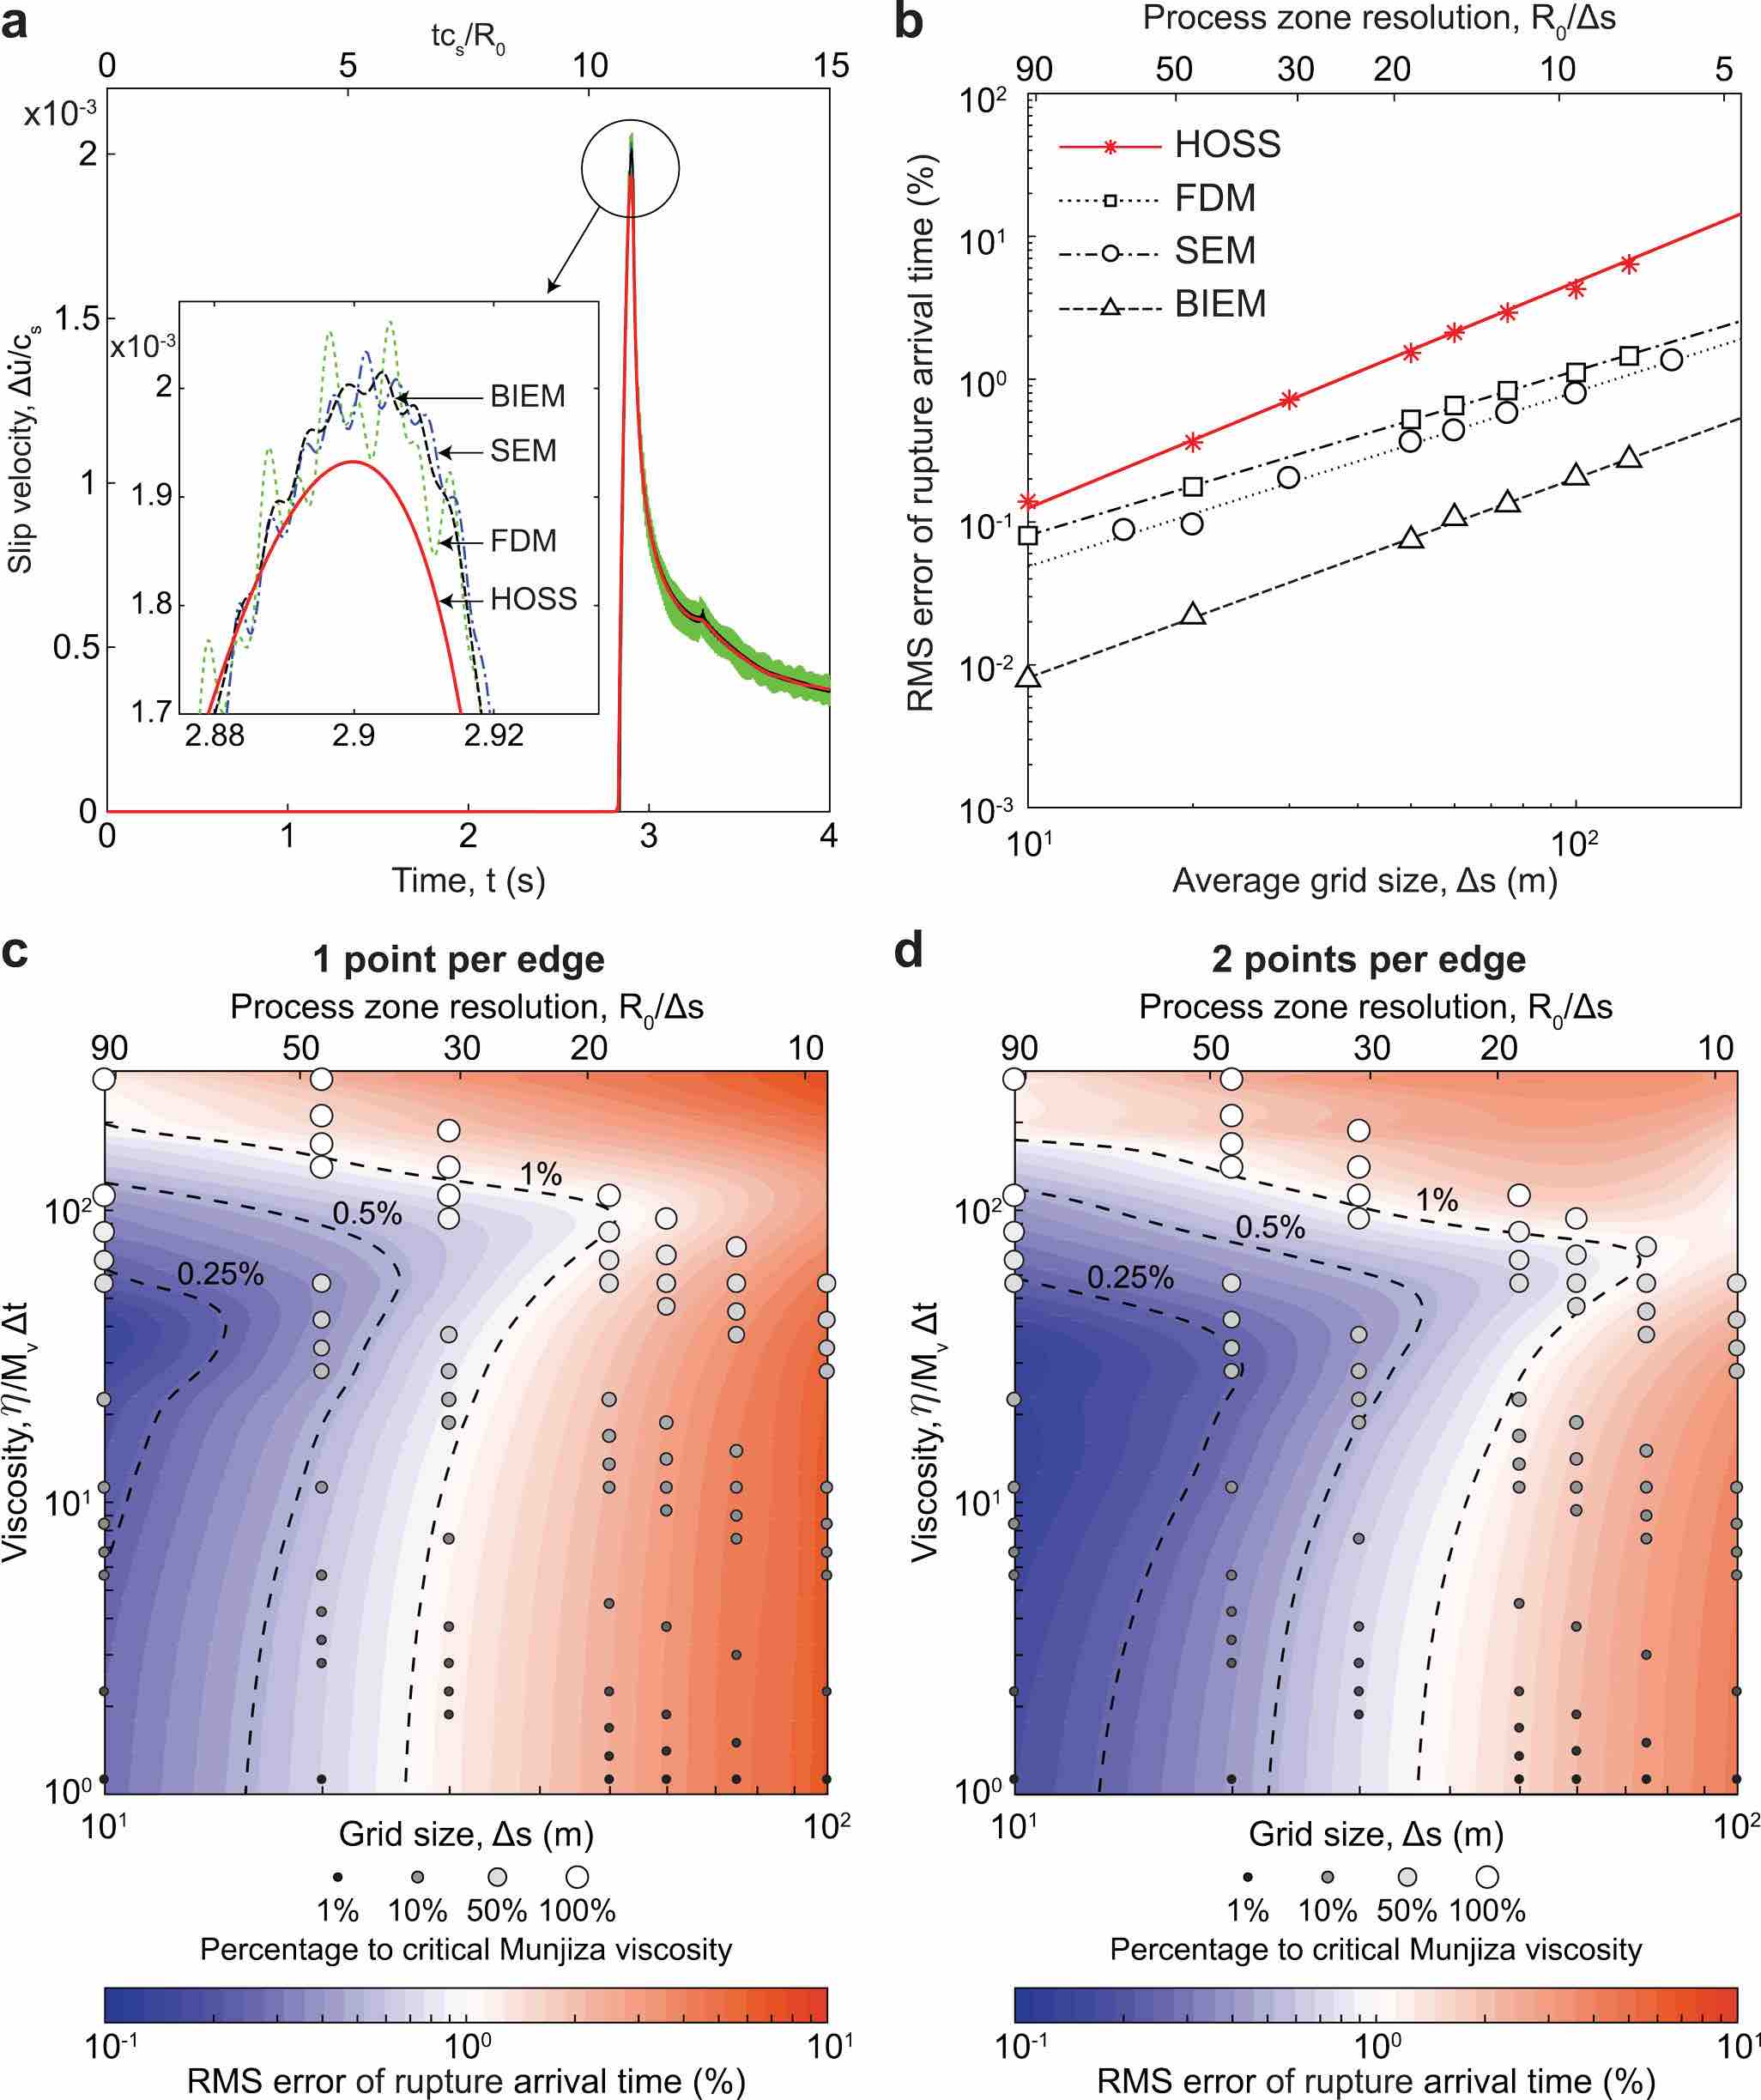
Figure B.1a shows the the comparison of slip velocity history at x = 9 km from the center of the main fault. The results of HOSS are compared to FDM, SEM and BIEM, where the grid spacing on the fault is chosen for the highest resolution as m () for HOSS, FDM and BIEM and m () for SEM. The slip velocity history of HOSS is consistent with the other numerical schemes except for the peak slip velocity. The peak slip velocity of HOSS is 4.1 percent smaller than that of BIEM and the rupture arrival time is slightly faster than the others. Both of the small discrepancies are explained by the artificial viscous damping. There is no viscous damping for BIEM and FDM, whereas the Kelvin-Voigt viscous damping is used for SEM, and the Munjiza viscosity is used for HOSS. Although the viscous damping causes small reduction of the peak velocity and shortens the rupture arrival time, the high-frequency numerical noise is significantly removed for the result with HOSS. It is notable that the comparison of HOSS to BIEM is no longer fair due to the artificial viscous damping, so that the evaluation of the effect of viscous damping on the rupture propagation is worthwhile, discussed later in this section.
Figure B.1b shows the grid convergence of HOSS and the others. The numerical accuracy as a function of grid resolution is evaluated by the root-mean-square (RMS) difference. The RMS error of the rupture arrival time is calculated by the comparison to the benchmark solution provided by BIEM with highest resolution as it is semi-analytical solution. Although the RMS error is slightly higher than the FDM and SEM due to the viscosity, the convergence rate of HOSS is similar to BIEM, following the power law with the scaling exponent of 1.6 for HOSS and 1.4 for BIEM. Thus the numerical accuracy is assured with appropriate for the required error range of earthquake rupture modeling.
Figures B.1c and B.1d show the RMS error of the rupture arrival time with various viscous values, grid resolutions and the number of points per edge. The circles indicate the examined combinations of viscosity and grid resolution, where the size of circles with monochromatic gradation represents the proportion of the viscosity to the theoretically derived critical viscosity (see also Okubo, (2018)). The saddle of the RMS error around , where is viscosity, is the Munjiza constant and t is time step, is explained by the competition between the numerical oscillation and the overdamped system. The convergence of the RMS error is better with two integral points per edge. Hence the grid resolution, viscosity and the number of points per face should be carefully chosen for the required numerical accuracy. Since the number of points per edge has to be more than two in order to allow for the secondary fractures in the off-fault medium due to numerical reasons, we chose the appropriate grid size and viscosity from Figure B.1d for the case study with depth.
Appendix C Mesh dependency
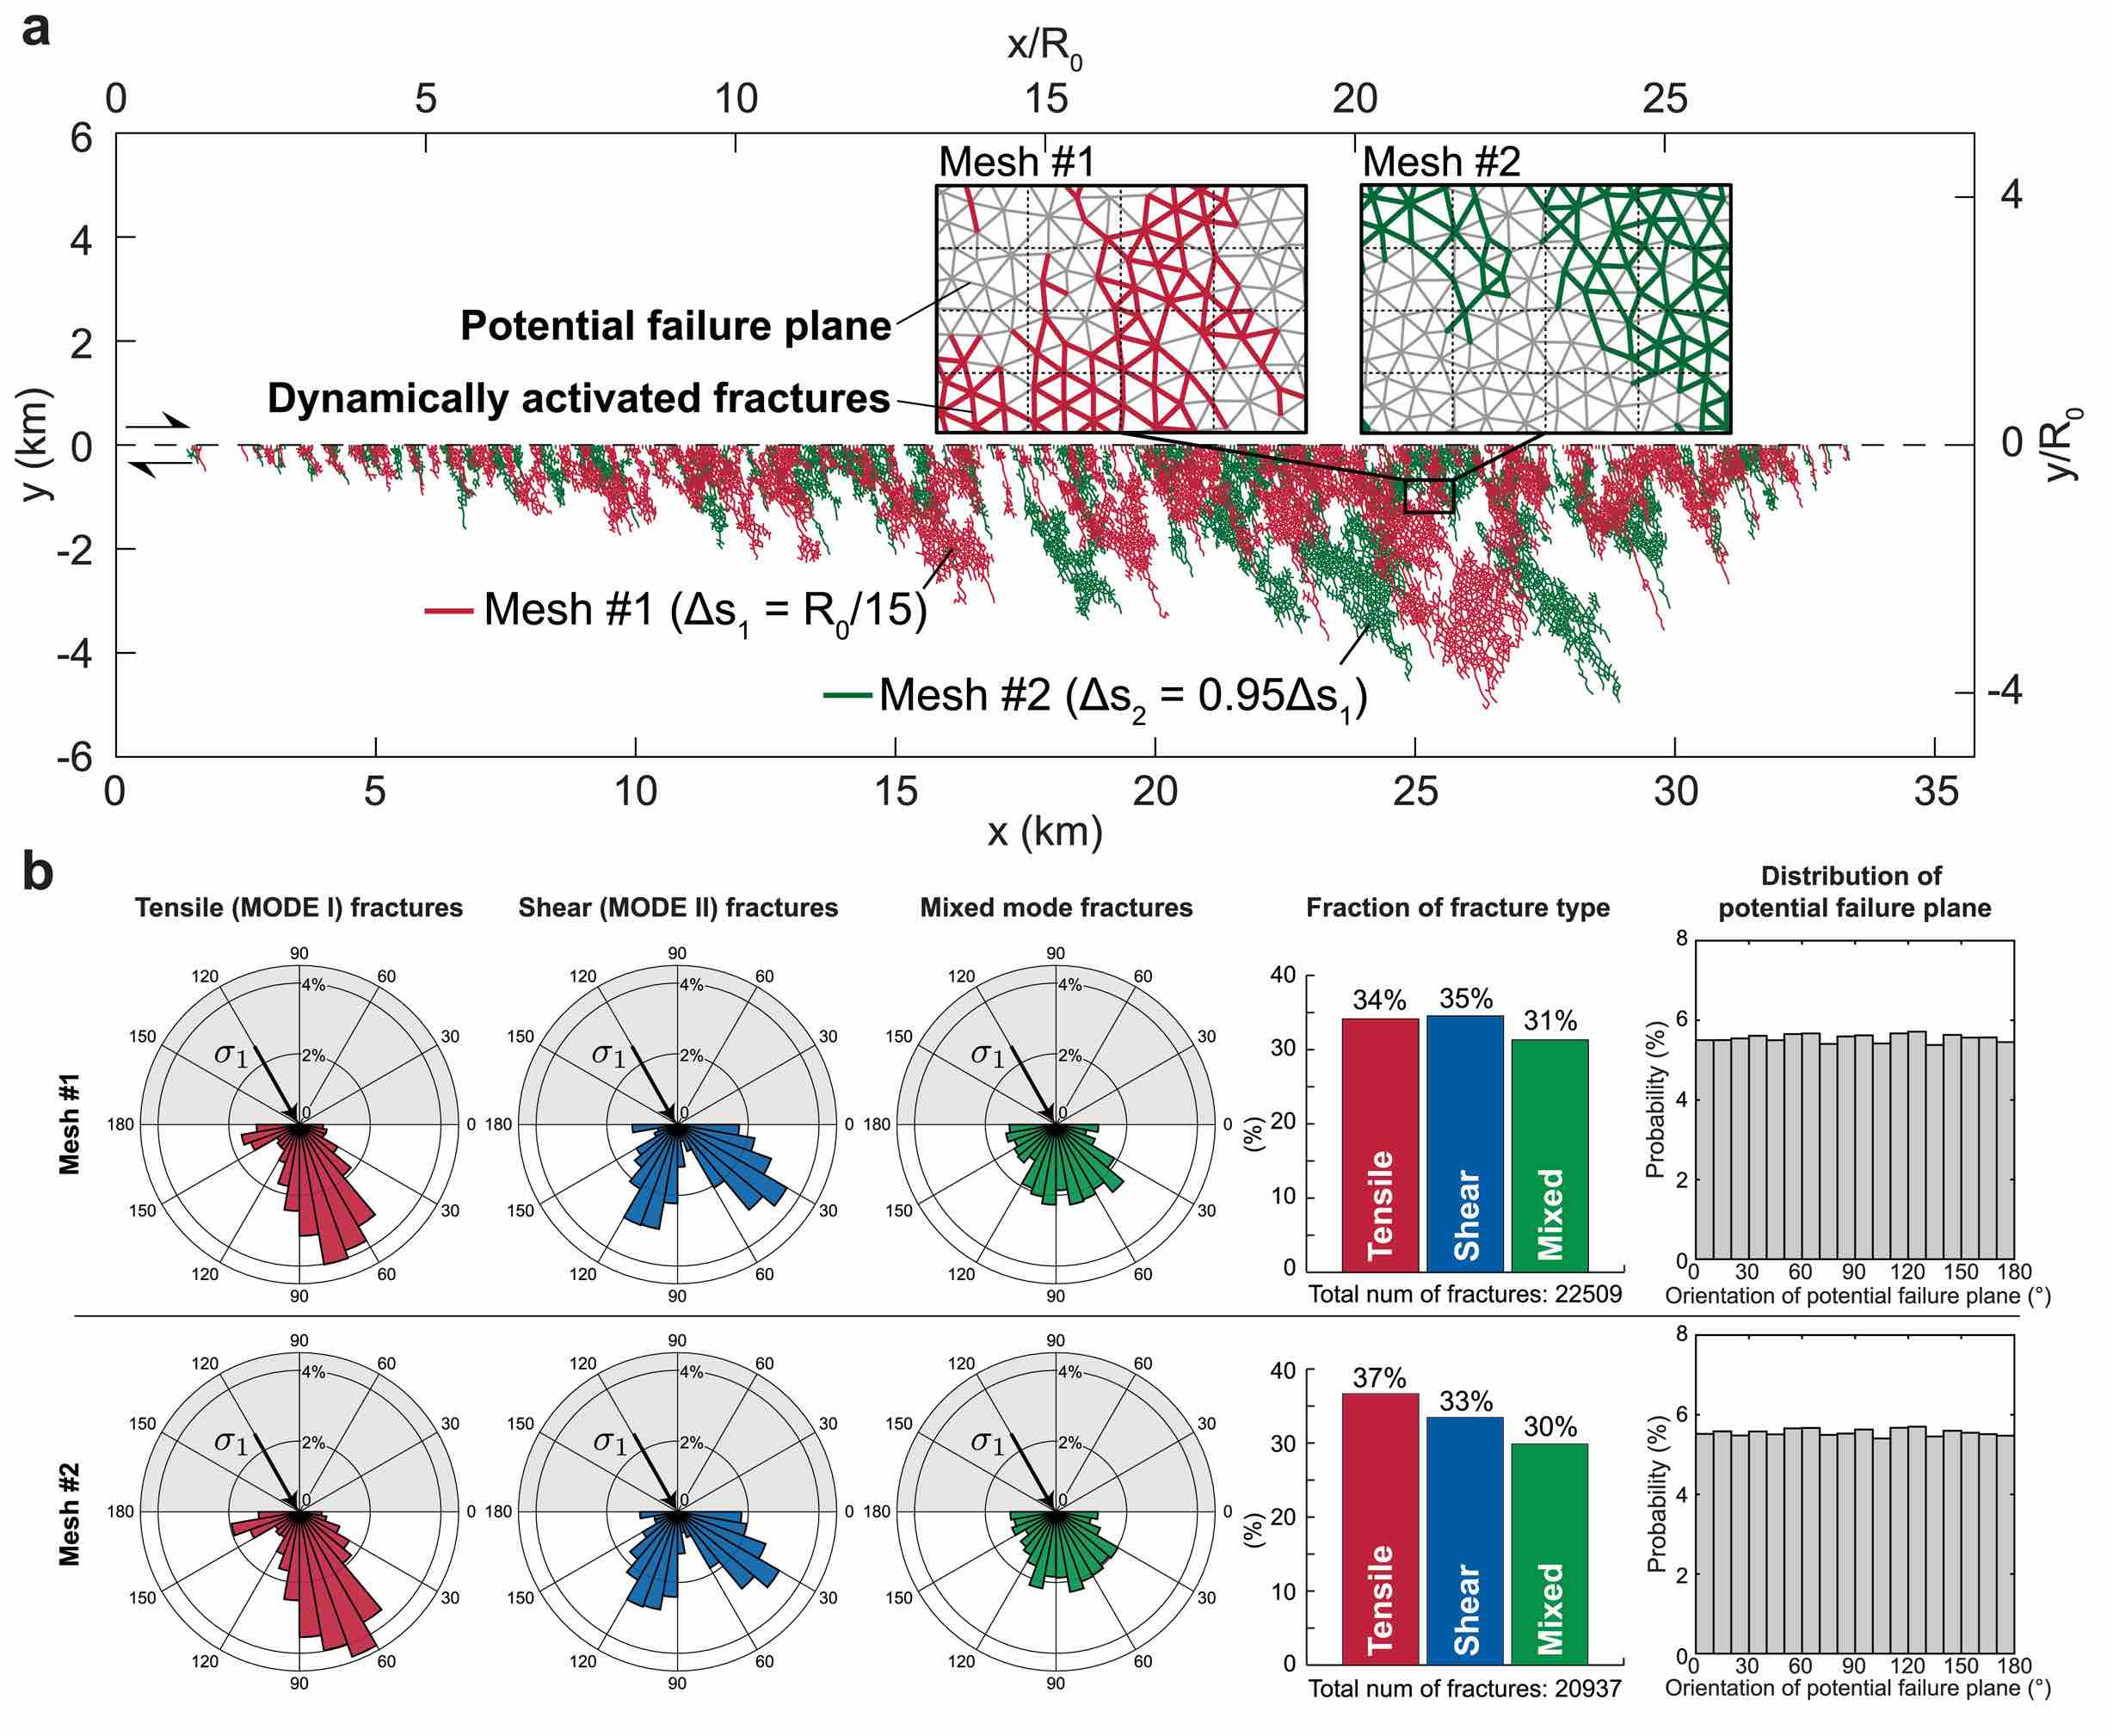
We examined two types of mesh to investigate mesh dependency associated with the coseismic off-fault damage. We made mesh #1, which is used for the case study in main section, and mesh #2, where the grid size on the fault is 5% smaller than the mesh #1 to change the mesh topology. We conducted the dynamic rupture simulation at 2 km depth with S=1.0 using these meshes. Figure C.1a shows the trace of off-fault fractures with each mesh. The damage zone width is consistent between them, whereas the damage pattern varies due to the different arrangement of potential failure planes in the off-fault medium. Small perturbation in the mesh topology thus changes the detailed damage pattern because of its chaotic aspects of the system.
However, statistical quantities are not influenced by the mesh topology. Figure C.1b shows the rose diagram of the orientation of off-fault fractures, which is in agreement between mesh #1 and mesh #2. In addition, the fraction of fracture type is also compatible between them. To realize the independence from the mesh topology, the orientation of potential failure plane is uniformly averaged as shown in the histogram.
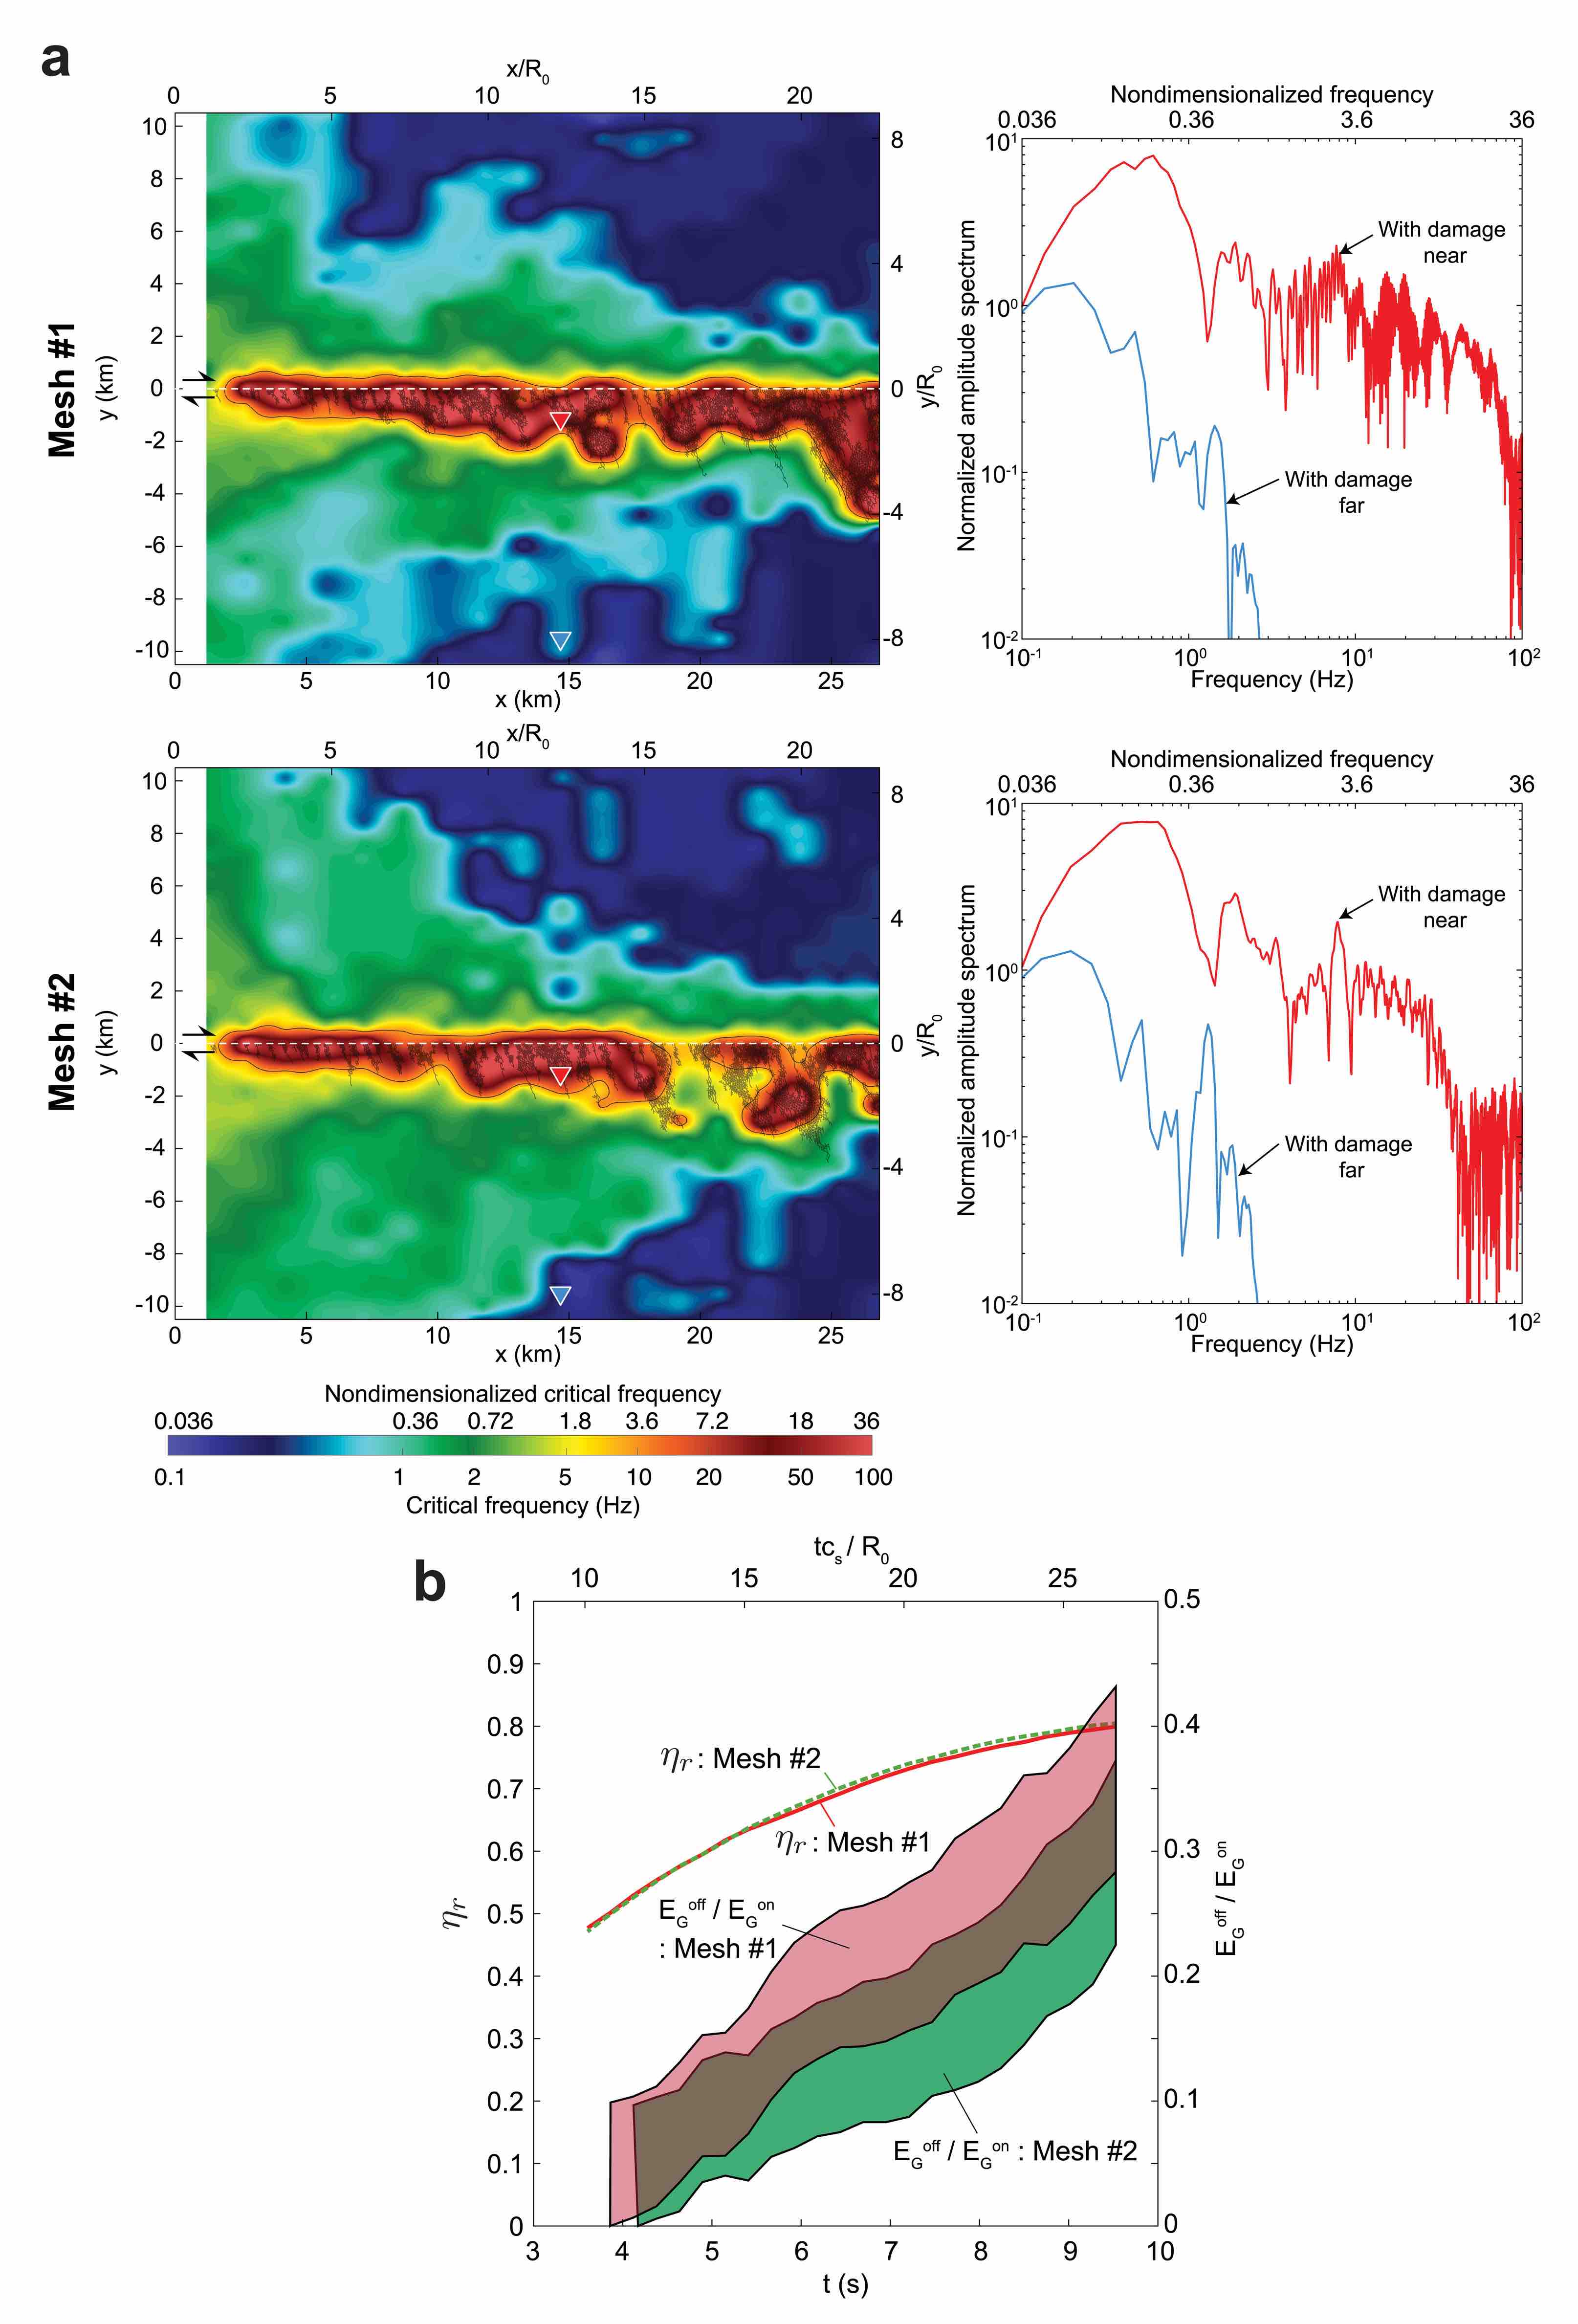
Figure C.2a shows the spatial distribution of critical frequency and spectra associated with those meshes. The spatial distribution varies as it depends on the damage pattern, whereas both spectra show the enhanced high-frequency radiation regardless of mesh topology. Figure C.2b shows the comparison in the seismic efficiency and the contribution of fracture energy in the off-fault medium as a function of time. is well consistent between meshes. Since we indirectly evaluate the with uncertainty of the energy dissipation by numerical viscous damping, we showed the estimation of with error bands. Both results are fairly overlapped, and show the increase in with rupture propagation, which is sufficient for the argument in section 6.
In summary, although the detailed damage pattern depends on the mesh topology, the statistical quantities such as orientation of fractures, radiation and overall energy budget are not so much influenced by the mesh topology. Furthermore, when considering geometrical complexity of the fault system, the damage pattern is dominantly determined by the regional stress and fault geometry due to the stress concentration caused by the geometrical complexity such as fault kinks or fault roughness.
Acknowledgements.
The cross-validation of HOSSedu was performed using the softwares of dynamic earthquake rupture modeling; MultiDimensional Spectral Boundary Integral code (MDSB), available at https://pangea.stanford.edu/~edunham/codes/codes.html, and Spectral Element Method tool for 2D wave propagation and earthquake source dynamics (SEM2DPACK), available at http://web.gps.caltech.edu/~ampuero/software.html. The mesh discretization was performed with the mesh generation toolkit, Trelis Pro. We acknowledge Los Alamos National Laboratory (LANL) Institutional Computing program for the computing resources provided for this work. Part of numerical simulation was also performed on the S-CAPAD platform, IPGP. This work is supported by the LANL LDRD Program (#20170004DR) and the PhD funding from Université Sorbonne Paris Cité (USPC).References
- Aki and Richards, (2002) Aki, K. and Richards, P. G. (2002). Quantitative Seismology. University Science Books.
- Ando and Yamashita, (2007) Ando, R. and Yamashita, T. (2007). Effects of mesoscopic-scale fault structure on dynamic earthquake ruptures: Dynamic formation of geometrical complexity of earthquake faults. J. Geophys. Res., 112(B9).
- Andrews, (1976) Andrews, D. J. (1976). Rupture velocity of plane strain shear cracks. J. Geophys. Res., 81(B32):5679–5689.
- Andrews, (1985) Andrews, D. J. (1985). Dynamic plane-strain shear rupture with a slip-weakening friction law calculated by a boundary integral method. Bull. Seism. Soc. Am., 75:1–21.
- Andrews, (2005) Andrews, D. J. (2005). Rupture dynamics with energy loss outside the slip zone. J. Geophys. Res., 110:1307.
- Aochi and Fukuyama, (2002) Aochi, H. and Fukuyama, E. (2002). Three-dimensional nonplanar simulation of the 1992 landers earthquake. J. Geophys. Res., 107(B2).
- Ben-Zion and Shi, (2005) Ben-Zion, Y. and Shi, Z. (2005). Dynamic rupture on a material interface with spontaneous generation of plastic strain in the bulk. Earth Planet. Sc. Lett., 236(1-2):486–496.
- Bhat et al., (2012) Bhat, H. S., Rosakis, A. J., and Sammis, C. G. (2012). A micromechanics based constitutive model for brittle failure at high strain rates. J. Appl. Mech., 79(3).
- Cappa et al., (2014) Cappa, F., Perrin, C., Manighetti, I., and Delor, E. (2014). Off-fault long-term damage: A condition to account for generic, triangular earthquake slip profiles. Geochem. Geophys. Geosyst., 15(4):1476–1493.
- Castro and Ben-Zion, (2013) Castro, R. R. and Ben-Zion, Y. (2013). Potential signatures of damage-related radiation from aftershocks of the 4 April 2010 (Mw 7.2) El Mayor–Cucapah Earthquake, Baja California, México. Bull. Seism. Soc. Am., 103(2A):1130–1140.
- Chester et al., (1993) Chester, F. M., Evans, J. P., and Biegel, R. L. (1993). Internal structure and weakening mechanisms of the san andreas fault. J. Geophys. Res., 98:771–786.
- Chester and Logan, (1986) Chester, F. M. and Logan, J. M. (1986). Implications for mechanical properties of brittle faults from observations of the punchbowl fault zone, california. Pure Appl. Geophys., 124(1-2):79–106.
- Cho et al., (2003) Cho, S. H., Ogata, Y., and Kaneko, K. (2003). Strain-rate dependency of the dynamic tensile strength of rock. Int. J. Rock Mech. Min. Sci., 40(5):763–777.
- Cochran et al., (2009) Cochran, E. S., Li, Y.-G., Shearer, P. M., Barbot, S., Fialko, Y., and Vidale, J. E. (2009). Seismic and geodetic evidence for extensive, long-lived fault damage zones. Geology, 37(4):315–318.
- Dalguer et al., (2003) Dalguer, L. A., Irikura, K., and Riera, J. D. (2003). Simulation of tensile crack generation by three-dimensional dynamic shear rupture propagation during an earthquake. J. Geophys. Res., 108(B3).
- Day et al., (2005) Day, S. M., Dalguer, L. A., Lapusta, N., and Liu, Y. (2005). Comparison of finite difference and boundary integral solutions to three-dimensional spontaneous rupture. J. Geophys. Res., 110(B12307).
- De La Puente et al., (2009) De La Puente, J., Ampuero, J.-P., and Käser, M. (2009). Dynamic rupture modeling on unstructured meshes using a discontinuous Galerkin method. J. Geophys. Res., 114(B10):B10302.
- (18) Dunham, E. M., Belanger, D., Cong, L., and Kozdon, J. E. (2011a). Earthquake ruptures with strongly rate-weakening friction and off-fault plasticity, part 1: Planar faults. Bull. Seism. Soc. Am., 101(5):2296–2307.
- (19) Dunham, E. M., Belanger, D., Cong, L., and Kozdon, J. E. (2011b). Earthquake ruptures with strongly rate-weakening friction and off-fault plasticity, part 2: Nonplanar faults. Bull. Seism. Soc. Am., 101(5):2308–2322.
- Faulkner et al., (2011) Faulkner, D. R., Mitchell, T. M., Jensen, E., and Cembrano, J. (2011). Scaling of fault damage zones with displacement and the implications for fault growth processes. J. Geophys. Res., 116(B05403).
- Fletcher et al., (2014) Fletcher, J. M., Teran, O. J., Rockwell, T. K., Oskin, M. E., Hudnut, K. W., Mueller, K. J., Spelz, R. M., Akciz, S. O., Masana, E., Faneros, G., et al. (2014). Assembly of a large earthquake from a complex fault system: Surface rupture kinematics of the 4 April 2010 El Mayor–Cucapah (Mexico) Mw 7.2 earthquake. Geosphere, 10(4):797–827.
- Freund, (1990) Freund, L. B. (1990). Dynamic Fracture Mechanics. Cambridge University Press, Cambridge.
- Fukuyama, (2005) Fukuyama, E. (2005). Radiation energy measured at earthquake source. Geophysical research letters, 32(13).
- Gabriel et al., (2013) Gabriel, A.-A., Ampuero, J.-P., Dalguer, L., and Mai, P. M. (2013). Source properties of dynamic rupture pulses with off-fault plasticity. J. Geophys. Res., 118(8):4117–4126.
- Hanks, (1982) Hanks, T. C. (1982). f max. Bull. Seismol. Soc. Am., 72(6A):1867–1879.
- Hanks and McGuire, (1981) Hanks, T. C. and McGuire, R. K. (1981). The character of high-frequency strong ground motion. Bull. Seismol. Soc. Am., 71(6):2071–2095.
- Harris et al., (2009) Harris, R. A., Barall, M., Archuleta, R. J., Dunham, E. M., Aagaard, B., Ampuero, J.-P., Bhat, H. S., Cruz-Atienza, V., Dalguer, L., Dawson, P., Day, S. M., Duan, B., Ely, G., Kaneko, Y., Kase, Y., Lapusta, N., Liu, Y., Ma, S., Oglesby, D. D., Olsen, K. B., Pitarka, A., Song, S., and Templeton, E. L. (2009). The SCEC/USGS dynamic earthquake rupture code verification exercise. Seismol. Res. Lett., 80(1).
- Ida, (1972) Ida, Y. (1972). Cohesive force across tip of a longitudinal-shear crack and griffiths specific surface-energy. J. Geophys. Res., 77:3796–3805.
- Kanamori and Brodsky, (2004) Kanamori, H. and Brodsky, E. E. (2004). The physics of earthquakes. Rep. Prog. Phys., 67(8):1429.
- Kaneko et al., (2008) Kaneko, Y., Lapusta, N., and Ampuero, J. P. (2008). Spectral element modeling of spontaneous earthquake rupture on rate and state faults: Effect of velocity-strengthening friction at shallow depths. J. Geophys. Res., 113(B09317).
- Klinger et al., (2018) Klinger, Y., Okubo, K., Vallage, A., Champenois, J., Delorme, A., Rougier, E., Lei, Z., Knight, E. E., Munjiza, A., Satriano, C., Baize, S., Langridge, R., and Bhat, H. S. (2018). Earthquake damage patterns resolve complex rupture processes. Geophys. Res. Lett.
- Knight et al., (2015) Knight, E. E., Rougier, E., and Lei, Z. (2015). Hybrid optimization software suite (HOSS) – educational version LA-UR-15-27013. Technical report, Los Alamos National Laboratory.
- Koller et al., (1992) Koller, M. G., Bonnet, M., and Madariaga, R. (1992). Modelling of dynamical crack propagation using time-domain boundary integral equations. Wave Motion, 16(4):339–366.
- Kostrov, (1974) Kostrov, B. V. (1974). Seismic moment and energy of earthquakes, and seismic flow of rock. Izv. Acad. Sci. USSR Phys. Solid Earth, 1:23–44.
- Lisjak et al., (2014) Lisjak, A., Grasselli, G., and Vietor, T. (2014). Continuum–discontinuum analysis of failure mechanisms around unsupported circular excavations in anisotropic clay shales. Int. J. Rock Mech. Min. Sci., 65:96–115.
- Ma and Andrews, (2010) Ma, S. and Andrews, D. (2010). Inelastic off-fault response and three-dimensional dynamics of earthquake rupture on a strike-slip fault. J. Geophys. Res., 115(B4).
- Madariaga, (1977) Madariaga, R. (1977). High-frequency radiation from crack (stress drop) models of earthquake faulting. Geophys. J. Roy. Astr. S., 51:625–651.
- Manighetti et al., (2004) Manighetti, I., King, G., and Sammis, C. G. (2004). The role of off-fault damage in the evolution of normal faults. Earth Planet. Sc. Lett., 217(3):399–408.
- Marty et al., (2019) Marty, S., Passelègue, F. X., Aubry, J., Bhat, H. S., Schubnel, A., and Madariaga, R. (2019). Origin of high-frequency radiation during laboratory earthquakes. Geophys. Res. Lett.
- Mitchell and Faulkner, (2009) Mitchell, T. M. and Faulkner, D. R. (2009). The nature and origin of off-fault damage surrounding strike-slip fault zones with a wide range of displacements: a field study from the Atacama fault system, northern Chile. J. Struct. Geol., 31(8):802–816.
- Mitchell and Faulkner, (2012) Mitchell, T. M. and Faulkner, D. R. (2012). Towards quantifying the matrix permeability of fault damage zones in low porosity rocks. Earth Planet. Sc. Lett., 339–340:24–31.
- Munjiza et al., (2015) Munjiza, A., Knight, E. E., and Rougier, E. (2015). Large strain finite element method: a practical course. John Wiley & Sons.
- Munjiza, (2004) Munjiza, A. A. (2004). The combined finite-discrete element method. John Wiley & Sons.
- Munjiza et al., (2011) Munjiza, A. A., Knight, E. E., and Rougier, E. (2011). Computational mechanics of discontinua. John Wiley & Sons.
- Ngo et al., (2012) Ngo, D., Huang, Y., Rosakis, A. J., Griffith, W. A., and Pollard, D. D. (2012). Off-fault tensile cracks: A link between geological fault observations, lab experiments, and dynamic rupture models. J. Geophys. Res., 117:B01307.
- Nur and Simmons, (1969) Nur, A. and Simmons, G. (1969). The effect of saturation on velocity in low porosity rocks. Earth Planet. Sc. Lett., 7(2):183–193.
- Ohnaka et al., (1987) Ohnaka, M., Kuwahara, Y., and Yamamoto, K. (1987). Constitutive relations between dynamic physical parameters near a tip of the propagating slip zone during stick-slip shear failure. Tectonophysics, 144(1-3):109–125.
- Okubo, (2018) Okubo, K. (2018). Dynamic earthquake ruptures on multiscale fault and fracture networks. PhD thesis, Institut de Physique du Globe de Paris, https://hal.archives-ouvertes.fr/tel-02004905.
- Palmer and Rice, (1973) Palmer, A. C. and Rice, J. R. (1973). Growth of slip surfaces in progressive failure of over-consolidated clay. Proc. R. Soc. Lond. Ser-A, 332:527–548.
- Passelègue et al., (2016) Passelègue, F. X., Schubnel, A., Nielsen, S., Bhat, H. S., Deldicque, D., and Madariaga, R. (2016). Dynamic rupture processes inferred from laboratory microearthquakes. J. Geophys. Res., 121.
- Poliakov et al., (2002) Poliakov, A. N. B., Dmowska, R., and Rice, J. R. (2002). Dynamic shear rupture interactions with fault bends and off-axis secondary faulting. J. Geophys. Res., 107(B11).
- Rice, (1980) Rice, J. R. (1980). The mechanics of earthquake rupture. In Dziewonski, A. M. and Boschi, E., editors, Physics of the earth’s interior (Proc. Intn’l. School of Physics ‘Enrico Fermi’, Course 78, 1979), pages 555–649. Italian Physical Society and North-Holland Publishing Co., Amsterdam.
- Rice et al., (2005) Rice, J. R., Sammis, C. G., and Parsons, R. (2005). Off-fault secondary failure induced by a dynamic slip pulse. Bull. Seism. Soc. Am., 95(1):109–134.
- Rivera and Kanamori, (2005) Rivera, L. and Kanamori, H. (2005). Representations of the radiated energy in earthquakes. Geophys. J. Int., 162(1):148–155.
- Rojas et al., (2008) Rojas, O., Day, S., Castillo, J., and Dalguer, L. A. (2008). Modelling of rupture propagation using high-order mimetic finite differences. Geophys. J. Int., 172(2):631–650.
- Rougier et al., (2011) Rougier, E., Knight, E. E., Munjiza, A., Sussman, A. J., Broome, S. T., Swift, R. P., and Bradley, C. R. (2011). The combined finite-discrete element method applied to the study of rock fracturing behavior in 3D. In 45th US Rock Mechanics/Geomechanics Symposium. American Rock Mechanics Association.
- Savage and Brodsky, (2011) Savage, H. M. and Brodsky, E. E. (2011). Collateral damage: Evolution with displacement of fracture distribution and secondary fault strands in fault damage zones. J. Geophys. Res., 116(B03405).
- Shi et al., (2008) Shi, Z., Ben-Zion, Y., and Needleman, A. (2008). Properties of dynamic rupture and energy partition in a solid with a frictional interface. J. Mech. Phys. Solids, 56(1):5–24.
- Shipton and Cowie, (2001) Shipton, Z. K. and Cowie, P. A. (2001). Damage zone and slip-surface evolution over m to km scales in high-porosity navajo sandstone, utah. J. Struct. Geol., 23(12):1825–1844.
- Sibson, (1977) Sibson, R. H. (1977). Fault rocks and fault mechanisms. J. Geol. Soc. (London, U.K.), 133(3):191–213.
- Sowers et al., (1994) Sowers, J. M., Unruh, J. R., Lettis, W. R., and Rubin, T. D. (1994). Relationship of the Kickapoo fault to the Johnson Valley and Homestead Valley faults, San Bernardino county, California. Bull. Seism. Soc. Am., 84(3):528–536.
- Templeton and Rice, (2008) Templeton, E. L. and Rice, J. R. (2008). Off-fault plasticity and earthquake rupture dynamics: 1. dry materials or neglect of fluid pressure changes. J. Geophys. Res., 113(B09306).
- Thomas and Bhat, (2018) Thomas, M. Y. and Bhat, H. S. (2018). Dynamic evolution of off-fault medium during an earthquake: a micromechanics based model. Geophys. J. Int., 214(2):1267–1280.
- Viesca et al., (2009) Viesca, R., Rice, J., and M. Dunham, E. (2009). Plastic deformation at a propagating rupture front: Its coupling to fault pore pressure and influence on the seismic moment tensor. Paper presented at Southern California Earthquake Center Annual Meeting, Palm Springs, CA.
- Viesca and Garagash, (2015) Viesca, R. C. and Garagash, D. I. (2015). Ubiquitous weakening of faults due to thermal pressurization. Nature Geosci., 8(11):875–879.
- Viesca et al., (2008) Viesca, R. C., Templeton, E. L., and Rice, J. R. (2008). Off-fault plasticity and earthquake rupture dynamics: 2. case of saturated off-fault materials. J. Geophys. Res., 113(B09307).
- Wallace and Morris, (1986) Wallace, R. E. and Morris, H. T. (1986). Characteristics of faults and shear zones in deep mines. Pure Appl. Geophys., 124(1):107–125.
- Xia et al., (2004) Xia, K. W., Rosakis, A. J., and Kanamori, H. (2004). Laboratory earthquakes: The sub-rayleigh-to-supershear rupture transition. Science, 303:1859–1861.
- Xu et al., (2012) Xu, S., Ben-Zion, Y., and Ampuero, J.-P. (2012). Properties of inelastic yielding zones generated by in-plane dynamic ruptures—I. Model description and basic results. Geophys. J. Int., 191(3):1325–1342.
- Yamashita, (2000) Yamashita, T. (2000). Generation of microcracks by dynamic shear rupture and its effects on rupture growth and elastic wave radiation. Geophys. J. Int., 143(2):395–406.
| Variables | Values | |
|---|---|---|
| a | Young’s modulus | 75 GPa |
| a | Shear modulus | 30 GPa |
| a | Poisson’s ratio | 0.25 |
| a | Density | 2700 kg m-3 |
| Density of water | 1000 kg m-3 | |
| Orientation of | 60 | |
| Seismic ratio | 0.7, 1.0 | |
| Closeness to failure | 0.4 | |
| Static friction coefficient | 0.6 | |
| Dynamic friction coefficient | 0.2 | |
| Critical slip distance | Estimated from eq. (26) | |
| b | Fracture energy on the main fault | 3 MJ m-2 |
| b | Fracture energy in the off-fault medium | 0.01 MJ m-2 |
| c | Peak cohesion for tensile fractures | 8 MPa |
| Peak cohesion for shear fractures | Estimated from eq. (28) |
