A Fast Very High Energy -ray Flare from BL Lacertae during a Period of Multiwavelength activity in June 2015
The mechanisms producing fast variability of the -ray emission in active galactic nuclei are under debate. The MAGIC telescopes detected a fast very high energy (VHE, E GeV) -ray flare from BL Lacertae on 2015 June 15. The flare had a maximum flux of photons cm-2 s-1 and halving time of minutes. The MAGIC observations were triggered by a high state in the optical and high energy (HE, E MeV) -ray bands. In this paper we present the MAGIC VHE -ray data together with multiwavelength data from radio, optical, X-rays, and HE rays from 2015 May 1 to July 31. Well-sampled multiwavelength data allow us to study the variability in detail and compare it to the other epochs when fast VHE -ray flares have been detected from this source. Interestingly, we find that the behaviour in radio, optical, X-rays and HE -rays is very similar to two other observed VHE -ray flares. In particular, also during this flare there was an indication of rotation of the optical polarization angle and of activity at the 43 GHz core. These repeating patterns indicate a connection between the three events. We also test modelling of the spectral energy distribution, based on constraints from the light curves and VLBA observations, with two different geometrical setups of two-zone inverse Compton models. In addition we model the -ray data with the star-jet interaction model. We find that all of the tested emission models are compatible with the fast VHE -ray flare, but all have some tension with the multiwavelength observations.
Key Words.:
galaxies: active – BL Lacertae objects: individual: BL Lacertae – gamma rays: galaxies1 Introduction
Blazars are jetted active galactic nuclei (AGN) with the relativistic jets closely aligned to the line of sight of the observer. They are the most common extragalactic sources in very high energy (VHE: E 100 GeV) rays111http://tevcat.uchicago.edu.
Blazars show two broad peaks in the spectral energy distributions (SEDs). The lower energy spectral peak in the optical to X-ray range is commonly associated to synchrotron emission from relativistic electrons. The spectral peak in the high-energy (HE: 100 GeV E 100 MeV) to VHE -ray range is widely believed to be produced by inverse Compton (IC) scattering off the synchrotron photons (Synchrotron Self Compton, SSC) (see e.g. Maraschi et al., 1992), and/or IC scattering with photons from outside the jet in the external Compton (EC) scenario (Dermer & Schlickeiser, 1994; Sikora et al., 1994). Hadronic models (e.g. Mannheim, 1993; Mücke et al., 2003), where a significant role is played by relativistic protons in the jet, can not be ruled out at the present state of observations.
Based on their optical spectra, blazars are divided into two classes: flat spectrum radio quasars (FSRQs) that show broad optical emission lines, and BL Lacertae objects (BL Lacs) characterised by the weakness or even absence of such emission lines (Weymann et al., 1991; Stickel et al., 1991). In Ghisellini et al. (2011) a more physical classification scheme between FSRQs and BL Lacs was suggested, based on the luminosity of the broad-line region (BLR) measured in Eddington units. Depending on the peak frequency of the low-energy bump of the SED, BL Lacs are further subdivided into high- (HBL), intermediate- (IBL), and low- (LBL) frequency-peaking BL Lac objects, with log defining a LBL, log an IBL and log for a HBL (Padovani & Giommi, 1995; Abdo et al., 2010).
BL Lacertae (hereafter BL Lac) is a prototype of the BL Lac objects, with a redshift of z=0.069 (Miller et al., 1978), and according to its synchrotron peak frequency is classified as a LBL (Nilsson et al., 2018) or IBL (Ackermann et al., 2011). Hervet et al. (2016) recently suggested a classification based on kinematic features of the radio jets, quasi-stationary or knots, and in their work they classified BL Lac as an intermediate source. BL Lac is well known for its prominent variability in a wide energy range, in particular in optical and radio bands and has been a target of many multiwavelength campaigns (e.g. Hagen-Thorn et al., 2002; Marscher et al., 2008; Raiteri et al., 2009; Abdo et al., 2011; Raiteri et al., 2013; Wehrle et al., 2016). It shows complicated long-term behaviour and has been suggested to show quasi-periodic variability in optical and HE -ray bands (Sandrinelli et al., 2017).
The first detection of VHE rays from BL Lac was reported by the Crimean Observatory with 7.2 significance above 1 TeV in 1998 (Neshpor et al., 2001). In the meantime, HEGRA observed it in the same period and obtained only an upper limit (Kranich et al., 2003). Subsequently, the MAGIC collaboration observed BL Lac for 22.2 h in 2005 and for 26 h in 2006, and a VHE ray signal was discovered in the 2005 data with an integral flux of 3% of the Crab Nebula flux above 200 GeV (Albert et al., 2007). On 2011 June 28, a very rapid TeV -ray flare from BL Lac was detected by VERITAS. The flaring activity was observed during a 34.6 minute exposure, when the integral flux above 200 GeV reached photons m-2 s-1, roughly 125% of the Crab Nebula flux (Arlen et al., 2013). After that, two more fast VHE -ray flares from BL Lac have been observed, one by MAGIC and one by VERITAS (Mirzoyan, 2015; Mukherjee, 2016).
In past years, fast VHE -ray flares have been detected also from many other AGN: from HBLs (Aharonian et al., 2007; Albert et al., 2007), from FSRQs (Aleksić et al., 2011; Zacharias et al., 2017) and from radio galaxies (Aharonian et al., 2006; Aleksić et al., 2014a). Of the IBLs and LBLs observed in the VHE rays, BL Lac is the only one where sub-hour variability has been detected. This sub-hour, even minute scale variability challenges standard models of blazar variability. Many models have been suggested ranging from VHE rays originating close to the black hole magnetosphere (Aleksić et al., 2014a; Hirotani & Pu, 2016), to mini-jets from magnetic reconnection (e.g. Giannios et al., 2009; Morris et al., 2018) or star-jet interactions (e.g. Barkov et al., 2010) to more traditional high Doppler factor small blobs (Begelman et al., 2008) travelling in the jet and possibly interacting with larger emission regions (Tavecchio et al., 2011).
In this paper we report a detection of a fast flare in VHE rays from BL Lac on 2015 June 15 and the quasi-simultaneous multiwavelength observations. Part of these data were already presented by Tsujimoto et al. (2017). Here we report on complete results from this observational campaign, compare them with the other two VHE -ray flares detected from the source and discuss theoretical models that can reproduce the fast variability.

2 Multiwavelength observations
2.1 MAGIC telescopes
The Major Atmospheric Gamma-ray Imaging Chenrenkov (MAGIC) is a system of two 17 m Imaging Atmospheric Cherenkov Telescopes (IACTs) located in the Canary Island of La Palma, Spain, at 2200 m above sea level. The low-energy threshold of the MAGIC telescopes (the standard trigger threshold is 50 GeV) is an advantage to carry out blazar observations with VHE rays. The integral sensitivity for point-like sources with Crab Nebula-like spectra above 218 GeV is (0.66 0.03)% of the Crab Nebula flux in 50 h of observations (Aleksic et al., 2016).
Observations of BL Lac (R.A. 22h02m43.3s, Dec. +42∘16’40”; J2000.0) were performed during 10 nights between 2015 June 15 and June 28 for a total of 8.58 h. The observations were triggered by a high state in HE -ray ( photons cm-2 s-1) and optical bands ( mJy). Data were taken with zenith angles in the range 14∘ to 32∘ that guarantees the lowest energy threshold. Observations were carried out in the so called wobble mode (Fomin et al., 1994), where the telescopes alternated four sky positions every 20 minutes with an offset of 0.4∘ from the source direction.
2.2 Fermi-LAT Data
The Large Area Telescope (LAT) on board the Fermi Gamma-ray Space Telescope is a pair-conversion detector operating from 20 MeV to 300 GeV. Further details about the Fermi-LAT are given by Atwood et al. (2009). BL Lac is included in all LAT catalogues and also the LAT hard-source catalogs 2FHL (above 50 GeV, Ackermann et al. (2016)) and 3FHL (above 10 GeV, Ajello et al. (2017)).
The LAT data used in this paper were collected from 2015 May 1 (MJD 57143) to July 31 (MJD 57234). During this time, the LAT instrument operated almost entirely in survey mode. The Pass 8 data (Atwood et al., 2013), based on a complete and improved revision of the entire LAT event-level analysis, were used. The analysis was performed with the ScienceTools software package version v10r0p5. Only events belonging to the ‘Source’ class (evclass=128, evtype=3) were used. We selected only events within a maximum zenith angle of 90∘ to reduce contamination from the Earth limb rays, which are produced by cosmic rays interacting with the upper atmosphere. The LAT analysis was performed with the instrument response functions P8R2_SOURCE_V6 using a binned maximum-likelihood method implemented in the Science tool gtlike. Isotropic (‘iso_source_v06.txt’) and Galactic diffuse emission (‘gll_iem_v06.fit’) components were used to model the background (Acero et al., 2016)222http://fermi.gsfc.nasa.gov/ssc/data/access/lat/
BackgroundModels.html. The normalization of both components was allowed to vary freely during the spectral fitting.
We analysed a region of interest of radius centred at the location of BL Lac. We evaluated the significance of the -ray signal from the source by means of a maximum-likelihood test statistic (TS) defined as TS = 2(log - log), where is the likelihood of the data given the model with () or without () a point source at the position of BL Lac (e.g., Mattox et al., 1996). The source model used in gtlike includes all the point sources from the 3FGL catalogue (Acero et al., 2015) that fall within of BL Lac. The spectra of these sources were parametrized by a power-law (PL), a log-parabola (LP), or a super exponential cut-off, as in the 3FGL catalogue.
A first maximum likelihood analysis was performed over the whole period to remove from the model the sources having TS . A second maximum likelihood analysis was performed with the updated source model. In the fitting procedure, the normalization factors and the spectral shape parameters of the sources lying within 10∘ of BL Lac were left as free parameters. For the sources located between 10∘ and 40∘ from our target, we kept the normalization and the spectral shape parameters fixed to the values from the 3FGL catalogue.
2.3 Swift Satellite
The Neil Gehrels Swift Observatory (Gehrels et al., 2004) carried out 31 observations of BL Lac between 2015 May 2 (MJD 57144) and July 29 (MJD 57232). The observations were performed with all three instruments on board: the X-ray Telescope (XRT; Burrows et al., 2005, 0.2–10.0 keV), the Ultraviolet/Optical Telescope (UVOT; Roming et al., 2005, 170–600 nm) and the Burst Alert Telescope (BAT; Barthelmy et al., 2005, 15–150 keV).
The hard X-ray flux of this source turned out to be below the sensitivity of the BAT instrument for such short exposures and therefore the data from this instrument are not included in this work.
| Date | Observing time | Significance | F(200 GeV) | Upper limit 95% C.L |
|---|---|---|---|---|
| MJD | h | 10-11 photons cm-2 s-1 | 10-11 photons cm-2 s-1 | |
| 57188.2 | 1.03 | 24.8 | ||
| 57189.2 | 0.73 | 1.8 | 0.5 | |
| 57190.2 | 0.97 | 5.7 | ||
| 57191.2 | 0.82 | 3.3 | 2.4 | |
| 57195.2 | 0.65 | -0.4 | 2.6 | |
| 57196.2 | 1.53 | 5.1 | ||
| 57197.1 | 0.65 | 2.4 | 0.7 | |
| 57199.1 | 0.98 | 1.3 | 1.0 | |
| 57200.1 | 0.56 | -1.3 | 0.7 | |
| 57201.2 | 0.71 | 0.7 | 2.0 |
2.3.1 Swift-XRT data
The raw data of these observations were downloaded from the publicly available SWIFTXRLOG (Swift-XRT Instrument Log)333https://heasarc.gsfc.nasa.gov/W3Browse/swift/swiftxrlog.html. All the observations had been performed in photon counting (PC) mode. Out of the 31 observations, 25 were qualified for further analysis and the data were processed using the procedure described by Fallah Ramazani et al. (2017), assuming a fixed equivalent Galactic hydrogen column density of cm2 (Raiteri et al., 2009).
2.3.2 Swift-UVOT data
During the Swift pointings, the UVOT instrument observed BL Lac in all its optical (, and ) and UV (, and ) photometric bands (Poole et al., 2008; Breeveld et al., 2010). We analysed the data using the uvotsource task included in the HEAsoft package (v6.18). Source counts were extracted from a circular region of 5 arcsec radius centred on the source, while background counts were derived from a circular region of 10 arcsec radius in a nearby source-free region. Following Raiteri et al. (2013), we assumed a flux density of 2.89, 1.30, 0.36, 0.026, 0.020, and 0.017 mJy for the host galaxy in the v, b, u, uvw1, uvm2, uvw2 bands. By considering the source extraction radius used for the UVOT photometry, the host galaxy contribution is about 50 per cent of the total galaxy flux, and it is removed from the magnitude values. Note that the host galaxy contribution in UV is negligible with respect to the source flux, even in the low states. The UVOT flux densities are corrected for dust extinction using the E(B–V) value of 0.291 from Schlafly & Finkbeiner (2011) and the extinction laws from Cardelli et al. (1989).
2.4 Optical data
Optical R-band observations were performed as part of the Tuorla blazar monitoring program 444http://users.utu.fi/kani/1m. The observations were performed using a 35 cm Celestron telescope that is attached to the 60 cm KVA (Kungliga Vetenskapsakademi) Telescope, located at La Palma. The data analysis was performed using standard procedures with a semi-automatic pipeline (Lindfors et al., 2016; Nilsson et al., 2018). The fluxes were corrected for Galactic reddening and the host galaxy contribution was subtracted using values from Schlafly & Finkbeiner (2011); Nilsson et al. (2007).
Optical polarization observations were performed with the Nordic Optical Telescope (NOT) at La Palma, Steward Observatory, Perkins, AZT-8+ST7 and Calar Alto 2.2 m Telescopes. The NOT observations were performed as part of the dedicated observing program to support MAGIC blazar observations. The observations and data analysis were done as in Hovatta et al. (2016). The Steward Observatory data are publicly available; the observations and data analysis methods are described in Smith et al. (2009). Perkins and AZT-8+ST7 data were analyzed as in Jorstad et al. (2013); Larionov et al. (2008). Calar Alto data were acquired as part of the MAPCAT project555http://www.iaa.es/~iagudo/_iagudo/MAPCAT.html, see Agudo et al. (2012).
2.5 Radio data
BL Lac is part of many radio monitoring programs and in this paper data from the Owens Valley Radio Observatory (OVRO), Metsähovi and Boston blazar monitoring programs are included.
OVRO blazar monitoring program observations are performed with the OVRO 40 meter telescope at 15 GHz. The observations program and the data analysis are described by Richards et al. (2011). The Metsähovi radio telescope is 13.7 meters in diameter and located in Kylmälä, Finland. The observations are performed at 37 GHz and data analysis is described by Teraesranta et al. (1998).
The Boston blazar monitoring program uses the Very Long Baseline Array to perform monthly monitoring of a sample of blazars at 43 GHz. The observations and data analysis were done as in Jorstad et al. (2005, 2017). We used a set of calibrated VLBA data at 43 GHz from the Boston University website 666https://www.bu.edu/blazars/VLBA$_$GLAST/bllac.html for eight epochs in 2015 and analyzed both total and polarized intensity images. Note that the polarized intensity images in August and September 2015 have a higher polarized intensity noise level due to poor weather at short baselines.
3 Results
3.1 MAGIC data
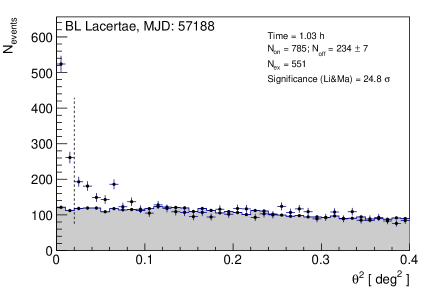
Figure 1 shows the squared angular distance () distribution between the reconstructed event direction and the source position in the camera and the normalized off-source events. For the complete data set (8.58 h), we found an excess of 905 –like events over 2212 21 background events yielding a significance of 16.4 above 70 GeV within 0.02 . The first night alone (2015 June 15, 1.03 h) showed an excess of 551 –like events over 234 7 background events which yields a significance of 24.8 above 70 GeV within 0.02 . The complete dataset without the first night shows a significance of . The significances for the individual nights are listed in Table 1.
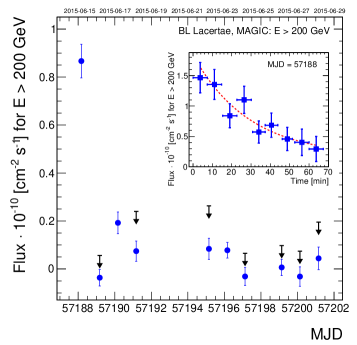
Figure 2 shows the daily light curves of the MAGIC observations, showing the large flare on 2015 June 15. The integral flux above 200 GeV is photons cm-2 s-1 for the first night and photons cm-2 s-1 for the nights 2015 June 16 to June 28. The average integral flux for the whole period is photons cm-2 s-1. The daily fluxes are reported in Table 1. In case of non-detection, we calculated 95% confidence level upper limits of the flux, following Rolke et al. (2005), considering a systematic error on flux estimation of 30% (Aleksic et al., 2016).
We also searched for intranight variability on the first night and re-analyzed the data with a binning of minutes, see inset of Fig. 2. The light curve was fitted with:
| (1) |
where is the peak flux registered on 2015 June 15 and is the halving time scale, which resulted in minutes.
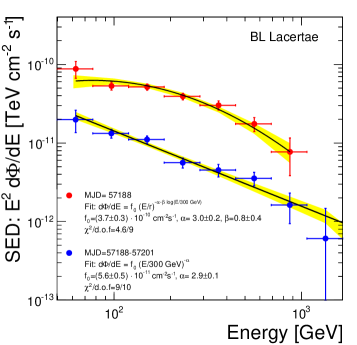
Figure 3 shows the spectrum for the whole period (2015 June between 15 and 28). The average spectrum was corrected for the absorption by extragalactic background photons using the model of Domínguez et al. (2011). The spectrum can be described by a simple power law ()
| (2) |
with flux normalization photon cm-2 s-1 TeV-1 and photon index .
The spectrum which was observed on 2015 June 15 is better described by a log parabola even after the EBL correction (LP vs. PL )
| (3) |
with flux normalization photon cm-2 s-1 TeV-1 , and .
3.2 Fermi-LAT
| Period | Date | Energy range | Photon index | Flux (10-8 ph cm-2 s-1) |
|---|---|---|---|---|
| Total period | 2015 May 1–July 31 | 0.1–300 GeV | 2.20 0.03 | 50.1 1.6 |
| pre-MAGIC period | 2015 May 1–June 14 | 0.1–300 GeV | 2.24 0.04 | 48.0 2.2 |
| MAGIC period | 2015 June 15–June 28 | 0.1–300 GeV | 2.12 0.04 | 76.8 5.0 |
| MAGIC period | 2015 June 15–June 28 | 1.0–300 GeV | 2.22 0.11 | 6.0 0.7 |
| post-MAGIC period | 2015 June 29–July 31 | 0.1–300 GeV | 2.20 0.07 | 43.5 2.6 |
| MAGIC detection | 2015 June 15 | 0.1–300 GeV | 2.29 0.24 | 57.0 15.4 |
Integrating over 2015 May 1–July 31 the fit with a power-law model, , results in TS = 3582 (corresponding to 60) in the 0.1–300 GeV energy range, with an integrated average flux of (50.1 1.6)10-8 ph cm-2 s-1 and a photon index of = 2.20 0.03. In order to test for curvature in the -ray spectrum of BL Lac, an alternative spectral model to the PL, a LP, , was used for the fit. We obtain a spectral slope = 2.13 0.03 at the reference energy = 347.9 MeV, a curvature parameter around the peak = 0.04 0.01, and a TS = 3591. We used a likelihood ratio test to check the PL model (null hypothesis) against the LP model (alternative hypothesis). These values may be compared by defining the curvature test statistic: TScurve=TSLP–TSPL=9, meaning that a curved spectral shape is preferred at the 3- level. The -ray light curve of BL Lac for 2015 May 1–July 31 was derived using a log-parabola model and 1-day time bins. For each time bin, the spectral parameters of BL Lac and all sources within 10∘ of it were frozen to the values resulting from the likelihood analysis over the entire period. When TS 10, 2 upper limits were calculated. The statistical uncertainties in the fluxes are larger than the systematic uncertainty (Ackermann et al., 2012) and only the former are considered in this paper.
The observation period was divided in three sub-periods: pre-MAGIC (2015 May 1–June 14), MAGIC (2015 June 15–28), and post-MAGIC (2015 June 29–July 31) observations. We checked possible spectral changes of the LAT spectrum during the MAGIC observation period with respect to the average spectrum and the spectra collected before and after the MAGIC observation period. In none of the three sub-periods is the LP statistically preferred to the PL model, therefore a PL model is used in the following analysis. We left the photon index free to vary in these three periods and in the night of 2015 June 15 (MJD 57188), at the time of the MAGIC detection of the source at VHE. The results are reported in Table 2.
For the MAGIC period, we investigated the LAT data also with sub-daily time bins. We produced a -ray light curve with 12-hr and 6-hr time bins using a PL model in the 0.1-300 GeV energy range. For each time bin, the spectral parameters of BL Lac and all sources within 10∘ of it were frozen to the values resulting from the likelihood analysis over the entire period, except the normalization was left free to vary. In the following analysis of the sub-daily light curves, we fixed the flux of the diffuse emission components at the value obtained by fitting the data over the respective daily time-bins. No significant flux variability was observed by Fermi-LAT on sub-daily time bins during the MAGIC period.
Analysing the LAT data collected over 2015 June 15–28 in the 1–300 GeV energy range with a PL, the fit yielded a TS = 496 with a photon index of 2.220.11 and a flux of (6.00.7)10-8 photons cm-2 s-1. By means of the gtsrcprob tool, we estimated that the highest energy photon emitted by BL Lac (with probability 90% of being associated with the source) was observed on 2015 June 21 with an energy of 31.9 GeV.
3.3 Multiwavelength light curves
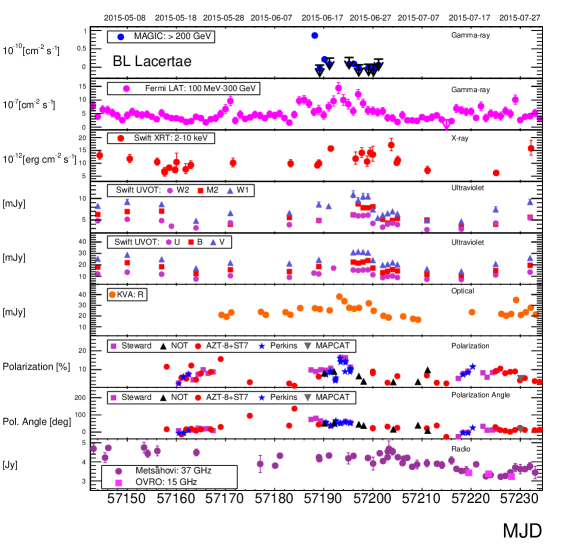
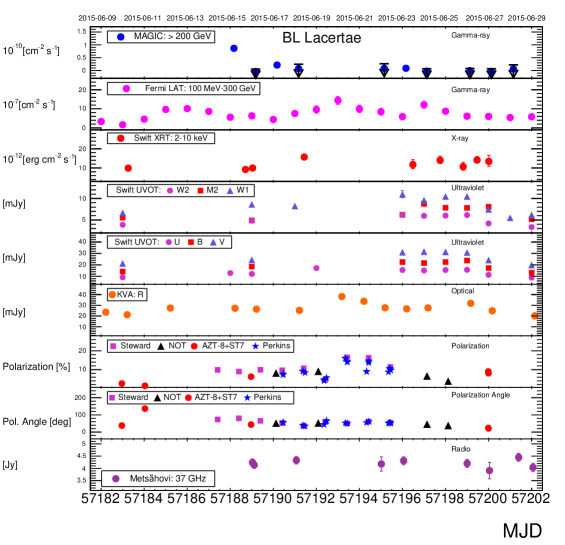
The multiwavelength light curves of BL Lac in 2015 are shown in Figs. 4 and 5. Figure 4 shows an extended period from April to August, while Fig. 5 shows the zoom around the MAGIC observing period. The radio flux is rather low during this period in comparison to its long-term behaviour (see e.g. Nieppola et al., 2009) and shows no major outbursts.
In optical R-band the general flux level is significantly larger than the long-term average of 13.1 mJy (Lindfors et al., 2016). During the campaign the flux doubles from 20 mJy to 40 mJy, reaching the largest flux in late 2015 June. The optical U- B- and V-band as well as the ultraviolet - - and -band light curves follow the same trend as the R-band, even though observations during the largest -band fluxes are not available in other bands. In X-rays the fluxes are also at typical levels for the source. The Fermi-LAT light curve shows multiple flares. For June, during which the optical light curve is well-sampled, the variability seems to be rather simultaneous in HE -ray and optical bands. The variability in these two bands is often correlated in this source (see e.g. Bloom et al., 1997; Ramakrishnan et al., 2016).
As shown in Sect 3.1 the MAGIC light curve shows very high flux on 2015 June 15. We have simultaneous or quasi-simultaneous data from Fermi-LAT, Swift-XRT and KVA, but none of the bands show an increased flux. In particular the Fermi-LAT 6 h and 12 h light curves do not show any significant variability during or around this period. The X-ray data from Swift-XRT are not strictly simultaneous, but were taken 0.5 days later, and taking into account the fast variability in the VHE band, we cannot exclude that a fast flare also happened in X-rays.
3.4 Optical polarization behaviour
We combined the optical polarization observations from five telescopes to investigate the behaviour of optical polarization degree and electric vector position angle (EVPA) during the extended period of activity. As the EVPA has (where 1, 2,…) ambiguity, we selected the values such that the differences between any two positions are minimised. There was one data point (MJD 57184.5) which differed by from the previous observation and can therefore be either or , we have plotted it as .
BL Lac is known to show highly variable degree of polarization (% to 40% Hagen-Thorn et al. (2002)) in timescales of tens of minutes (Covino et al., 2015). During our observations the optical polarization degree varies between 1-20%, which is within the typical range for this source. Four nights before the detection of the VHE -ray flare the polarization degree was very low, , while on the night of the flare it was .
There are two rotations of the EVPA. First rotation starts around MJD 57161 and ends around MJD 57175, few days before the start of the VHE -ray observations, but simultaneous with increasing flux in the Fermi-LAT energy range. The rotation is from to . Length and starting time of the second rotation depends on the data point of MJD 57184.5. Independent of whether we correct the data point of MJD 57184.5 or not (see above), a rotation of EVPA is observed during the VHE -ray flare. In the first case EVPA rotates from to in 27 days with the rotation starting on the night of the detection of the VHE flare. In the second case EVPA rotates from to in 31 days and the rotation starts 5 days before the detection of the VHE flare. Neither rotations are very smooth and they are in opposite directions. Rotations with are rather common in the source, e.g. Jermak et al. (2016) identified four such rotations from their dataset covering four years of data (2008-2012). For single events it is therefore difficult to conclude on the connection of the rotation with the VHE -ray flare.
.
3.5 VLBA 43 GHz results
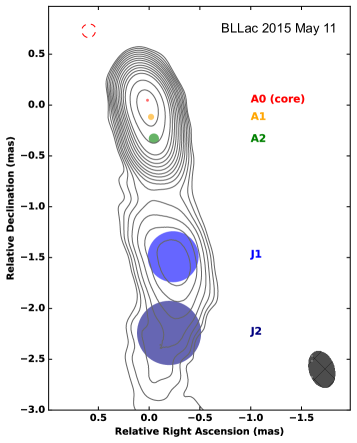
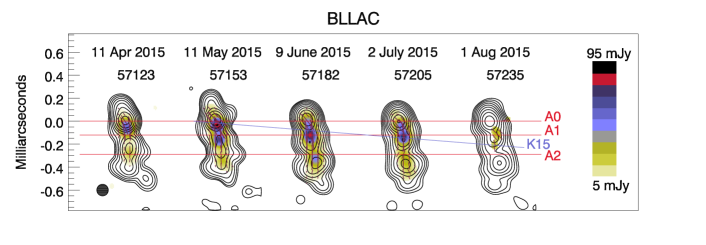
We investigated the jet kinematics of BL Lac in 2015 using eight epochs of 43 GHz VLBA images. The image of 2015 May 11 (MJD 57153) is shown in Fig. 6. It shows the position of the components , , , and .
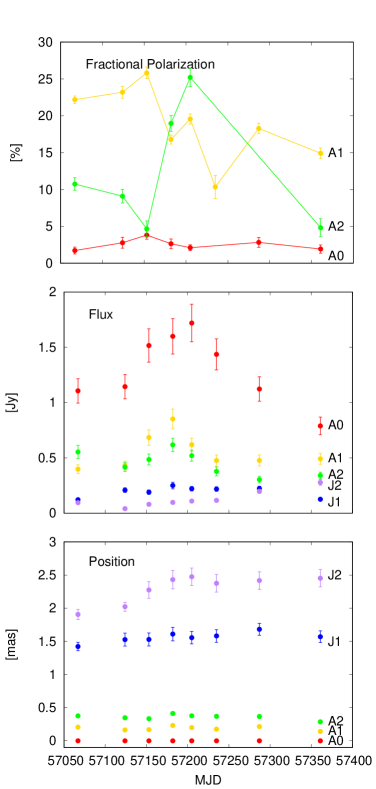
We do not find any clear emergence of new components over the examined period. For all the epochs, the images were similar to that presented in Fig. 6. The positions of the components at different epochs are shown in Fig. 7 (bottom panel), which reveal no successive motion of and with respect to . These three components are well-known stationary components (see e.g. Wehrle et al., 2016) located at the core, 0.14 mas and 0.3 mas from the core. For BL Lac 1 mas corresponds to 1.3 pc in projected distance. Adopting a jet viewing angle of (Wehrle et al., 2016), the deprojected scale results in 1 mas13 pc. So, the components and are at the distance of 1.8 pc and 3.9 pc. Knots and are imaged as a single feature at 15 GHz and have been interpreted as a quasi-stationary recollimation shock (Cohen et al., 2014). As discussed in Jorstad et al. (2017) the stationary features make a detection of moving knots difficult.
While there were no clear ejections, a flux density increase of the core or of the central one-beamsize region is measured from 2015 May to July, as can be seen in Fig. 7 (middle panel). This brightening could be due to a new moving feature (knot). There is also an increase of polarized flux density in the core in May (57153), then in A2 in June and July (57182, 57205), visible in Fig. 7 (top panel). Also Fig. 8 presents variability of the degree of polarization of the core and stationary features. It shows an increase of the fractional polarization in the core and A1 in May (57153), followed by an increase of the degree of polarization in A2 in June (57182). An increase of fractional polarization along with the total flux density is usually interpreted as the result of a shock propagation in the jet (Hughes et al., 1989). Therefore, also polarization observations show a hint of a new moving feature.
If we interpret this as a moving knot, which could cause such a behaviour, it moves with a proper motion of 1.07mas/yr (5c), fairly common for BL Lac (see Fig. 8).
This brightening and increase of polarized flux intensity and degree of polarization are in line with the general brightening of the source in optical and -ray bands and therefore the knot is a likely location of the activity. As it is relevant for the SED, we also estimate the distance from the central black hole for this emission region. The brightening is within 0.2 mas from the radio core (or might be the core itself), which corresponds to 2.6 parsecs. Additionally we have to take into account the location of the radio core relative to the black hole. For BL Lac, Pushkarev et al. (2012) suggest that the deprojected separation between the black hole and the 15 GHz core to be 0.84 pc based on their core-shift measurements. If we assume that the radio core position is inversely proportional to frequency (O’Sullivan & Gabuzda, 2009; Pushkarev et al., 2012), the separation between the black hole and the 43 GHz core would be 0.3 pc. This gives us a range of distances from 0.3 pc to 2.9 pc from the central black hole.
4 Comparison with other VHE flares from BL Lac
In addition to the flare presented here, VERITAS has observed bright, fast VHE -ray flares from this source on two occasions (Arlen et al., 2013; Abeysekara et al., 2018). In the following we compare the VHE -ray and multiwavelength behaviour during these three epochs: 2011 June (hereafter VERITAS flare 1), 2015 June (hereafter MAGIC flare) and 2016 October (hereafter VERITAS flare 2). Observations of the VERITAS flare 1, similarly to the MAGIC flare, were triggered by high state in -ray and optical bands. On the contrary, VERITAS flare 2 was observed as part of the regular monitoring program.
The maximum VHE -ray flux we observed in the night of 2015 June 15 is photons cm-2 s-1. This is only half the flux VERITAS observed from the source on 2011 June 28 (VERITAS flare 1), but was the brightest VHE flux from the source since that observation. However, on 2016 October 5 VERITAS detected yet another bright VHE -ray flare from the source (VERITAS flare 2) (Feng et al., 2017; Abeysekara et al., 2018) with a peak flux of photons cm-2 s-1, which is also significantly brighter than the flux we report. Like in VERITAS flare 1 and 2, also for the MAGIC flare the signal is concentrated on one night. The observations from the following nights do not show significant signal.
During the MAGIC flare the flux decayed with halving time scale of minutes. In VERITAS flare 1, the halving time (also corresponding to decay of the flare) was approximately a factor of two shorter: minutes. For the VERITAS flare 2, the rise time was minutes and the decay time minutes. The value is compatible within the uncertainties with the decay time we measure for the MAGIC flare.
All three detected occasions of fast VHE -ray variability (MAGIC flare and VERITAS flares 1 and 2) have occured during an extended period (lasting some weeks) of high flux in the HE -ray band ( photons cm-2 s-1), even if the -ray flux in the nights of the high VHE -ray flux is not particularly high. The same is true for the optical flux; while long term average R-band flux from Tuorla blazar monitoring program is 13.1 mJy (Lindfors et al., 2016), the optical flux during these three epochs has been between mJy. On the contrary, the X-ray flux did not show any long term high states during any of the three flaring epochs. Note that high optical and -ray states can be due to an observational bias, because the high states in these bands were used to trigger the observations in the VHE ray band by MAGIC and by VERITAS (flare 1).
In all three cases the polarization degree drops to rather low values during or just before the observation of the VHE -ray flare. As discussed in Section 3.3, rotations of the optical polarization angle are rather common in this source and seem to have occured around the time of the three VHE -ray flares. The rotation during VERITAS flares 1 and 2 and the MAGIC flare are not particularly smooth nor long, unlike the rotation shown in Marscher et al. (2008). Therefore it is very difficult to conclude on a connection between the optical polarization behaviour and the VHE -ray flares in BL Lac and more data are certainly needed. However, the observed behaviour (drop in polarization degree and rotating EVPA) is in agreement with the model of Marscher (2014) as suggested by Feng et al. (2017); Abeysekara et al. (2018). In this model, the VLBA core is interpreted as a conical shock through which turbulent shells of plasma pass creating an environment for an efficient acceleration of electrons.
The radio fluxes in 15 GHz or 37 GHz are not particularly high during the onset of the -ray flaring activity. However, around all the three epochs some activity was detected in 43 GHz VLBA data; during the VERITAS flares 1 and 2, a new component was ejected from the core. For VERITAS flare 2 the ejection of the component is tentative (Feng et al., 2017; Abeysekara et al., 2018) and the case observed for the MAGIC flare is very similar to that one. There are clear indications of new component, but due to the standing features very close to core, the analysis is inconclusive. Overall, our observations are in agreement with the connection between the VHE -ray flares and the activity in the 43 GHz VLBA core suggested in Feng et al. (2017); Abeysekara et al. (2018).
It is very suggestive that all three VHE -ray flares show similar multiwavelength variability patterns. However, as discussed above, there are significant uncertainties and observational biases that must be understood with more observations before any firm conclusions on such patterns can be made.
5 Multiwavelength SED modelling
The SED of BL Lac has been modelled several times in the past. First ones were homogeneous, one-zone synchrotron self Compton models (see e.g. Ghisellini et al., 1998; Ravasio et al., 2002). However, it was noted already in the EGRET era that modelling the high flux states above 100 MeV required external seed photons for Compton scattering (Sambruna et al., 1999; Madejski et al., 1999; Böttcher & Bloom, 2000). Ever since, the SED of BL Lac has been conventionally modelled with an external Compton model (see e.g. Böttcher et al., 2013) using external photons from the BLR as seed photons.
Böttcher et al. (2013) also considered a hadronic model to describe the SED. As is generally the case, also for BL Lac the hadronic model would require magnetic field strength of Gauss and very large power in relativistic protons.
The early SED modellings did not include the VHE -ray data, but it was shown in Albert et al. (2007) that the one-zone SSC model of Ravasio et al. (2002) could also describe the observed VHE -ray data. However, the observed VHE -ray flux in 2015 is much larger ( 10 times) than the one presented in Albert et al. (2007) and in addition a fast variability gives additional constraints to the model. Very recently, Morris et al. (2018) presented first SED modelling attempt, including the VHE -ray data from fast flare of 2016 (VERITAS flare 2). The model computes the time evolution of a reconnecting plasmoid whose radius and velocity evolve as it travels through the reconnection layer. The model can produce the profile of the fast flare, but overproduces the optical to X-ray part of the SED very significantly.
In the following we consider different models to account for the observed SED and the variability patterns discussed in Sect. 3.3 and Sect. 3.5.
| model | component | |||||||||
|---|---|---|---|---|---|---|---|---|---|---|
| [G] | [cm | cm] | ||||||||
| BLR | Blob | 1.0 | 1.0 | 2.0 | 2.0 | 3.0 | 0.14 | 45 | 0.1 | 25 |
| Jet | 5.0 | 0.3 | 0.3 | 1.9 | 3.9 | 0.12 | 0.4 | 30 | 7 | |
| Interaction | Blob | 50.0 | 4.0 | 0.9 | 2.0 | 3.2 | 0.013 | 300 | 0.17 | 60 |
| Jet | 3.0 | 0.9 | 0.3 | 2.0 | 3.7 | 0.05 | 0.8 | 30 | 7 |
5.1 Two-zone modelling of the SED
We reconstructed the multi-band SED of BL Lac for the flare night (MJD 57188, 2015 June 15) only ( days).
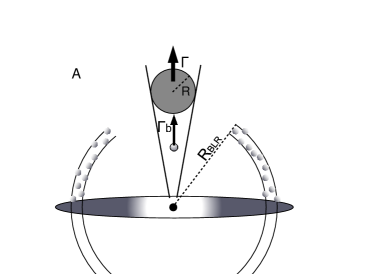
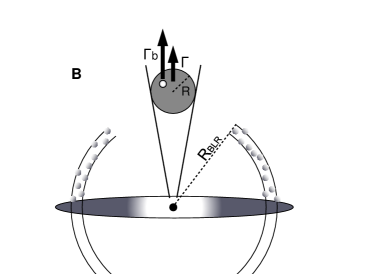
The observed common trends in HE -rays, optical and 43 GHz radio core suggest that the emission in these bands comes from the 43 GHz radio core. On the other hand, the VHE -ray emission shows fast variability and must originate from a very small component for which we do not have constraints on the location from the light curves. For these two components, we adopt a leptonic model similar to one presented in Tavecchio et al. (2011), which assumes two emission components: a small blob, emitting the rapidly variable VHE emission, and a larger jet (which in our case is the 43 GHz VLBA core, see above) responsible for the slower variability in the other bands (see Fig. 9). In the model both of these regions are filled with electrons distributed in energy according to a smoothed broken power law:
| (4) |
The distribution has normalization between and and slopes and below and above the break, (Maraschi & Tavecchio, 2003). The emission regions have magnetic fields , sizes and Doppler factors for which we looked for constraints from observations:
-
•
The MAGIC observations on 2015 June 15 show variability timescale of 26 minutes, which constraints the size of the emission region to be cm for the blob.
-
•
For the larger region, we estimate the size of the emission region from the variability timescale of optical and light curves (time scale is order of 2 days) to be cm.
-
•
Magnetic field strength and Doppler factor can be constrained from the VLBA observations. For the magnetic field we use 0.11 G (Pushkarev et al., 2012). For the Doppler factor we use =7 (Jorstad et al., 2005; Wehrle et al., 2016; Jorstad et al., 2017). We use these values for the larger emission region, i.e the VLBA core.
Tavecchio et al. (2011) suggested two different geometrical arrangements for the positions of the small and large emission regions: i) co-spatiality outside the BLR, and ii) a geometry where the larger emission region is inside the BLR and the small emission region is outside the BLR to avoid the absorption of VHE rays. In BL Lac, however, the observed emission lines are rather weak (L erg/s) (Corbett et al., 1996, 2000; Capetti et al., 2010), which gives us, using the standard scalings L erg/s and Rcm pc (see e.g. Ghisellini & Tavecchio, 2009). The scaling relation is based on very luminous quasars and therefore not directly applicable to fainter objects like BL Lac, but the estimated size is at least orders of magnitude smaller than the distance of the 43 GHz VLBA core to the black hole (at least 0.3 pc see Sect. 3.5), therefore, the large emission region is clearly outside the BLR see Fig. 9). Another source of external photons that is nowadays commonly considered in the case of FSRQs is the dusty torus (Sikora et al., 2008), but there is no observational evidence of the existence of such structure in the lower luminosity objects such as BL Lac. Therefore no external seed photons are considered for the large emission region.
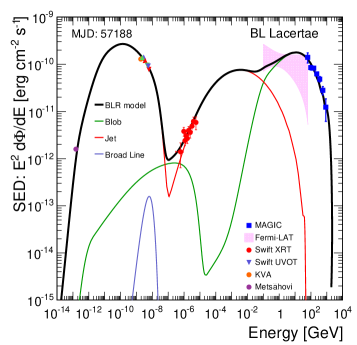
For the small region we do not have constraints on the location from the variability patterns. In general, as discussed in Böttcher & Els (e.g. 2016); Abolmasov & Poutanen (e.g. 2017), in order to avoid significant - absorption the VHE -ray emission region must be located near the outer boundary of the BLR or beyond it. The BLR in BL Lac is too weak (see above) to absorb the VHE -rays, but can provide additional seed photons to the Compton scattering. Therefore, in the first setup, we consider the small blob to be located inside the radius of the BLR (see Fig. 9 panel A). Our modelling represents only one possible set of parameters; but all observational constraints have been taken into account and the model well reproduces the observed SED (see Fig. 10 left panel). However, if the BLR is indeed as small as suggested by the scaling relation (see above), then in 30 minutes the blob would travel a distance greater than the size of the BLR. Again, as the size of the BLR is very uncertain, we still consider the model feasible.
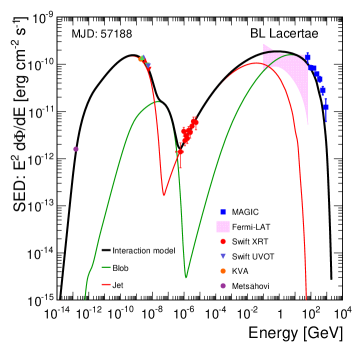
The other possible model setup is that the two emission regions are co-spatial and interact with each other, the larger (jet) providing additional seed photons for inverse Compton scattering (see Fig. 9 panel B). To model this case, we adopt the case B setup of Tavecchio et al. (2011), but without external seed photons from the torus. The same model was used in Ahnen et al. (2018). In order to reproduce the high flux in VHE -rays, we have to use lower magnetic field than suggested by Pushkarev et al. (2012) based on the VLBA measurements and assuming equipartition between the energy carried by particles and the magnetic field. The set of parameters shown in Table 3 reproduces the SED acceptably (see Fig. 10 right panel), but:
-
•
As the shape of the highest energy component derived with the interaction model is wide (similar to SSC) it is difficult to fit the highest MAGIC spectral points without overproducing the Fermi-LAT spectrum.
-
•
It would require deviation from equipartition condition at least for the smaller component () as is generally found for BL Lacs when one-zone models are considered (Tavecchio & Ghisellini, 2016). However, unlike the conclusions in that paper, the deviation from equipartition is required even in the two-zone modelling taking into account the interaction between the two zones. We suggest that this is due to an extreme flaring activity that took place in BL Lac during the epoch considered here.
Again the modelling uses a single parameter set only out of many different possibilities.
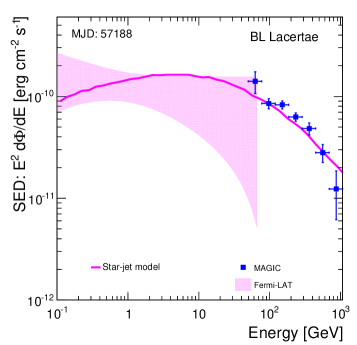

5.2 Star-jet interaction model
An alternative explanation of the fast variability can involve interactions of the ultrarelativisitic particles with compact objects entering the jet, e.g. stars or clouds (Bednarek & Protheroe, 1997; Barkov et al., 2010; Bosch-Ramon et al., 2012; Araudo et al., 2013; Wykes et al., 2014; Bosch-Ramon, 2015; Bednarek & Banasiński, 2015; de la Cita et al., 2016; Banasiński et al., 2016). In order to investigate if such a scenario can explain the fast variability observed in BL Lac in June 2015, we apply the model presented in Banasiński et al. (2016). An emission region, i.e. the blob, filled with electrons is moving along the jet with a Lorentz factor . It encounters and sweeps over a star that has entered the jet. The electrons propagating in the radiation field of the star produce rays via inverse Compton process. Such a scenario can produce an orphan (VHE emission without any increase of optical flux), or nearly-orphan (sudden increase of VHE emission during a higher optical state without simultaneous increase of optical flux) VHE -ray flare.
The observed time scale of the emission is limited by two factors: the size of the region around the star, and the vertical dimensions of the blob, normally the latter one being the dominating one. In the model we assume that a star with a temperature K and radius cm falls inside the jet. It is intercepted by a blob moving with . The blob occupies a cross-section of the jet with a radius of cm. These are similar to the values used for the blob in two zone modelling. Its vertical size is described by a Gaussian profile with an RMS measured in the frame of the star of cm (i.e. in the frame of the jet both perpendicular and vertical sizes are comparable). The blob is filled with electrons injected with a power-law spectrum with an index of and the energy density of the electrons measured in the blob is . The electrons interact with the stellar radiation field producing rays. The rays of high-enough energy crossing close to the star can be absorbed producing pairs, which can in turn produce further rays in an electomagnetic cascade. We calculate the spectra and light curves of the photons escaping at the typical observing angle of . The model is then compared with the SED of MAGIC integrated in the 1.2 h observations of the flare. Due to limited statistics and visibility window, it is not possible to use strictly simultaneous Fermi-LAT data. Instead, we use a contemporaneous Fermi-LAT data using the spectral index estimation from 12 hrs around the MAGIC flare and absolute flux estimation for a 6-hr period. Longer integration time, combined with a vast variability of the source, can introduce an additional systematic uncertainty in the modelling; however the Fermi-LAT and MAGIC spectra connect smoothly within the statistical uncertainties.
In Fig. 11 we show the comparison of the model with the -ray measurements. Within the statistical and systematic uncertainties the model can describe well the GeV-TeV spectrum and the light curve. The values of the Lorentz factor and the energy density in the blob, while large, are still less extreme than in the case of the PKS 1222+21 flare (Aleksić et al., 2011; Banasiński et al., 2016). We conclude that an interaction of a blob filled with relativistic electrons with the radiation field of a star is a viable explanation for the observed BL Lac flare.
6 Summary and Conclusions
In this paper we have reported the detection of a fast VHE -ray flare from BL Lac with halving time of minutes. The observations were triggered by a high state of the source in the HE -ray (detected by Fermi-LAT) and optical bands. We presented the MAGIC VHE -ray data together with multiwavelength data from 2015 May 1 (MJD 57143) to July 31 (MJD 57234).
The multiwavelength behaviour in this period is rather similar to the behaviour that is typically observed in this source during high flux states; the optical and -ray emission correlate, while X-ray variability is less prominent. The optical polarization angle is rotating 90∘ and we also detect a brightening in the VLBA 43 GHz core around the time of the -ray flare, locating the active region there. The fast VHE -ray flare is not accompanied by a significant brightening in -ray, X-ray or optical bands; even though we have observations from the same day in all of these bands. We note that, the X-ray observation is not strictly simultaneous.
We also compare the multiwavelength behaviour to the two epochs around the fast VHE -ray flares observed by VERITAS. We find that the lower frequency patterns seem to repeat during the three fast VHE -ray flares. As discussed in Feng et al. (2017); Abeysekara et al. (2018), the occurence of VHE -ray flares during the activity in VLBA core is in agreement with a model proposed by Marscher (2014). In that model the VLBA core is a conical shock. Turbulent shells of plasma pass through that conical shock and electrons are accelerated. As the turbulent shells are small, they would naturally also explain the fast VHE -ray flares. However, there is a significant observational bias involved in two of the three VHE -ray observations as they have been triggered by high optical and -ray fluxes. We therefore considered three models to reproduce the SED in this paper.
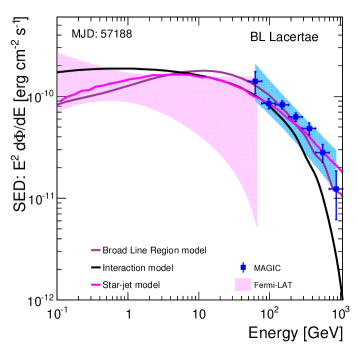
The models we consider (see Fig. 12), namely a fast blob inside the BLR, a fast blob interacting with a larger component and star-jet interaction, can all reproduce the observed SED during the 2015 June 15 flare. All of the models have some caveats. In the first model (small blob inside BLR), there is large uncertainty about the parameters used for the BLR, which is known to be weak in this source. In addition, there is no spatial connection between the two emission regions, even if in all observed cases of fast VHE -ray flares, we have seen activity also in the VLBA 43 GHz core. In the second model, where the emission regions are co-spatial it is challenging to match the model with the highest energy MAGIC data without overproducing the flux in the Fermi-LAT band. The model also requires us to use a lower magnetic field than what VLBA observations would indicate (assuming equipartition condition). This was also found for PKS 1510-089 (Aleksić et al., 2014b) when adopting a similar modelling. The star-jet model has the same caveat as the small blob inside the BLR model; there is no connection between the generally increased flux levels in the other bands and the fast VHE -ray flare. Furthermore, fast VHE -ray flares seem to be rather common in BL Lac, as three have already been observed. It is rather unlikely that all three would have been produced by star-jet interaction (Aleksić et al., 2014a, see discussion in).
In summary, we have tested three models to explain the fast variability of VHE -ray flux in BL Lac, but were not able to settle on preferred model. The interaction model is preferred as it matches the observed repeating multiwavelength patterns best, but in our simple blob-in-blob model it gives the worst description of the -ray band data. Further observations during VHE -ray flares are required with strictly simultaneous optical and X-ray high cadence data. Repeating MWL patterns could play a key role in constraining the site and mechanism of fast -ray flares. This gives a strong motivation to have an intense long-term monitoring of BL Lac, regardless of its VHE -ray state.
Acknowledgements.
We would like to thank the Instituto de Astrofísica de Canarias for the excellent working conditions at the Observatorio del Roque de los Muchachos in La Palma. The financial support of the German BMBF and MPG, the Italian INFN and INAF, the Swiss National Fund SNF, the ERDF under the Spanish MINECO (FPA2015-69818-P, FPA2012-36668, FPA2015-68378-P, FPA2015-69210-C6-2-R, FPA2015-69210-C6-4-R, FPA2015-69210-C6-6-R, AYA2015-71042-P, AYA2016-76012-C3-1-P, ESP2015-71662-C2-2-P, FPA2017‐90566‐REDC), the Indian Department of Atomic Energy and the Japanese JSPS and MEXT is gratefully acknowledged. This work was also supported by the Spanish Centro de Excelencia “Severo Ochoa” SEV-2016-0588 and SEV-2015-0548, and Unidad de Excelencia “María de Maeztu” MDM-2014-0369, by the Croatian Science Foundation (HrZZ) Project IP-2016-06-9782 and the University of Rijeka Project 13.12.1.3.02, by the DFG Collaborative Research Centers SFB823/C4 and SFB876/C3, the Polish National Research Centre grant UMO-2016/22/M/ST9/00382 and by the Brazilian MCTIC, CNPq and FAPERJ. The work of the author M. Vazquez Acosta is financed with grant RYC-2013-14660 of MINECO. F. D’Ammando is grateful for support from the National Research Council of Science and Technology, Korea (EU-16-001). The Fermi LAT Collaboration acknowledges generous ongoing support from a number of agencies and institutes that have supported both the development and the operation of the LAT as well as scientific data analysis. These include the National Aeronautics and Space Administration and the Department of Energy in the United States, the Commissariat à l’Energie Atomique and the Centre National de la Recherche Scientifique / Institut National de Physique Nucléaire et de Physique des Particules in France, the Agenzia Spaziale Italiana and the Istituto Nazionale di Fisica Nucleare in Italy, the Ministry of Education, Culture, Sports, Science and Technology (MEXT), High Energy Accelerator Research Organization (KEK) and Japan Aerospace Exploration Agency (JAXA) in Japan, and the K. A. Wallenberg Foundation, the Swedish Research Council and the Swedish National Space Board in Sweden. Additional support for science analysis during the operations phase is gratefully acknowledged from the Istituto Nazionale di Astrofisica in Italy and the Centre National d’Études Spatiales in France. This work performed in part under DOE Contract DE-AC02-76SF00515. Based on observations made with the Nordic Optical Telescope, operated by the Nordic Optical Telescope Scientific Association at the Observatorio del Roque de los Muchachos, La Palma, Spain, of the Instituto de Astrofisica de Canarias. Acquisition and reduction of the MAPCAT data was supported in part by MINECO through grants AYA2010-14844, AYA2013-40825-P, and AYA2016-80889-P, and by the Regional Government of Andalucía through grant P09-FQM-4784. The MAPCAT observations were carried out at the German-Spanish Calar Alto Observatory, which is jointly operated by the Max-Plank-Institut für Astronomie and the Instituto de Astrofísica de Andalucía-CSIC. The St.Petersburg University team acknowledges support from Russian Science Foundation grant 17-12-01029. This publication makes use of data obtained at the Metsähovi Radio Observatory, operated by Aalto University, Finland. This study makes use of 43 GHz VLBA data from the VLBA-BU Blazar Monitoring Program (VLBA-BU-BLAZAR; http://www.bu.edu/blazars/VLBAproject.html), funded by NASA through the Fermi Guest Investigator Program. The VLBA is an instrument of the National Radio Astronomy Observatory. The National Radio Astronomy Observatory is a facility of the National Science Foundation operated by Associated Universities, Inc. The BU group acknowledges support from NASA Fermi GI program grant 80NSSC17K0694 and US National Science Foundation grant AST-1615796. The OVRO 40-m monitoring program is supported in part by NASA grants NNX08AW31G, NNX11A043G and NNX14AQ89G, and NSF grants AST-0808050 and AST-1109911.References
- Abdo et al. (2010) Abdo, A. A., Ackermann, M., Agudo, I., et al. 2010, ApJ, 716, 30
- Abdo et al. (2011) Abdo, A. A., Ackermann, M., Ajello, M., et al. 2011, ApJ, 730, 101
- Abeysekara et al. (2018) Abeysekara, A. U., Benbow, W., Bird, R., et al. 2018, ApJ, 856, 95
- Abolmasov & Poutanen (2017) Abolmasov, P., & Poutanen, J. 2017, MNRAS, 464, 152
- Acero et al. (2015) Acero, F., Ackermann, M., Ajello, M., et al. 2015, ApJS, 218, 23
- Acero et al. (2016) Acero, F., et al. 2016, ApJS, 223, 26
- Ackermann et al. (2011) Ackermann, M., Ajello, M., Allafort, A., et al. 2011, ApJ, 743, 171
- Ackermann et al. (2012) Ackermann, M., et al. 2012,ApJS, 203, 4
- Ackermann et al. (2016) Ackermann, M., Ajello, M., Atwood, W. B., et al. 2016, ApJS, 222, 5
- Agudo et al. (2012) Agudo, I., Molina, S. N., Gómez, J. L., et al. 2012, International Journal of Modern Physics Conference Series, 8, 299
- Aharonian et al. (2006) Aharonian, F., Akhperjanian, A. G., Bazer-Bachi, A. R., et al. 2006, Science, 314, 1424
- Aharonian et al. (2007) Aharonian, F., Akhperjanian, A. G., Bazer-Bachi, A. R., et al. 2007, ApJ, 664, L71
- Ahnen et al. (2018) Ahnen, M. L., Ansoldi, S., Antonelli, L. A., et al. 2018, A&A, in press
- Ajello et al. (2017) Ajello, M., Atwood, W. B., Baldini, L., et al. 2017, ApJS, 232, 18
- Albert et al. (2007) Albert, J., Aliu, E., Anderhub, H., et al. 2007, ApJ, 669, 862
- Albert et al. (2007) Albert, J., et al., 2007, ApJ, 666, L17
- Aleksić et al. (2011) Aleksić, J. et al. 2011, ApJ, 730, L8
- Aleksić et al. (2014a) Aleksić, J., Ansoldi, S., Antonelli, L. A., et al. 2014, Science, 346, 1080
- Aleksić et al. (2014b) Aleksić, J., Ansoldi, S., Antonelli, L. A., et al. 2014, A&A, 569, A46
- Aleksic et al. (2016) Aleksić J., et al., 2016, Astroparticle Physics, 72, 76
- Araudo et al. (2013) Araudo, A.T., Bosch-Ramon, V., Romero, G.E. 2013, MNRAS, 436, 3626
- Arlen et al. (2013) Arlen, T., et al., 2013, The Astrophysical Journal, 762, 2
- Atwood et al. (2009) Atwood, W. B., et al. 2009, ApJ, 697, 1071
- Atwood et al. (2013) Atwood, W. B., et al. 2013, 2012 Fermi Symposium proceedings - eConf C121028 (arXiv:1303.3514)
- Banasiński et al. (2016) Banasiński, P., Bednarek, W., & Sitarek, J. 2016, MNRAS, 463, L26
- Barkov et al. (2010) Barkov, M.V., Aharonian, F.A., Bosch-Ramon, V. 2010, ApJ, 724, 1517
- Barthelmy et al. (2005) Barthelmy, S. D., et al. 2005, Space Sci. Rev., 120, 143
- Bednarek & Protheroe (1997) Bednarek, W., Protheroe, R.J. 1997, MNRAS, 287, L9
- Bednarek & Banasiński (2015) Bednarek, W., Banasiński, P. 2015 ApJ 807, 168
- Begelman et al. (2008) Begelman, M. C., Fabian, A. C., & Rees, M. J. 2008, MNRAS, 384, L19
- Bloom et al. (1997) Bloom, S. D., Bertsch, D. L., Hartman, R. C., et al. 1997, ApJ, 490, L145
- Bosch-Ramon et al. (2012) Bosch-Ramon, V., Perucho, M., Barkov, M. V. 2012, A&A, 539,69
- Bosch-Ramon (2015) Bosch-Ramon, V. 2015 A&A 575, A109
- Böttcher & Bloom (2000) Böttcher, M., & Bloom, S. D. 2000, AJ, 119, 469
- Böttcher et al. (2013) Böttcher, M., Reimer, A., Sweeney, K., & Prakash, A. 2013, ApJ, 768, 54
- Böttcher & Els (2016) Böttcher, M., & Els, P. 2016, ApJ, 821, 102
- Breeveld et al. (2010) Breeveld, A. A., et al. 2010, MNRAS, 406, 1687
- Burrows et al. (2005) Burrows, D. N., et al. 2005, Space Sci. Rev., 120, 165
- Burrows et al. (2004) Burrows, D. N., Hill, J. E., Nousek, J. A., et al. 2004, Proc. SPIE, 5165, 201
- Capetti et al. (2010) Capetti, A., Raiteri, C. M., & Buttiglione, S. 2010, A&A, 516, A59
- Cardelli et al. (1989) Cardelli, J. A., Clayton, G. C., Mathis, J. S. 1989, ApJ, 345, 245
- Cohen et al. (2014) Cohen, M. H., Meier, D. L., Arshakian, T. G., et al. 2014, ApJ, 787, 151
- Corbett et al. (1996) Corbett, E. A., Robinson, A., Axon, D. J., et al. 1996, MNRAS, 281, 737
- Corbett et al. (2000) Corbett, E. A., Robinson, A., Axon, D. J., & Young, S. 2000, MNRAS, 319, 685
- Covino et al. (2015) Covino, S., Baglio, M. C., Foschini, L., et al. 2015, A&A, 578, A68
- Dermer & Schlickeiser (1994) Dermer, C. & Schlickeiser, R., 1994, ApJS, 90, 945
- Domínguez et al. (2011) Domínguez, A., et al. 2011, MNRAS, 410, 2556
- de la Cita et al. (2016) de la Cita, V.M., Bosch-Ramon, V., Paredes-Fortuny, X., Khangulyan, D., Perucho, M. 2016, A&A, submitted (arXiv:1604.02070)
- Fallah Ramazani et al. (2017) Fallah Ramazani, V., Lindfors, E., & Nilsson, K. 2017, A&A, 608, A68
- Feng et al. (2017) Feng, Q., for the VERITAS Collaboration, Jorstad, S. G., et al. 2017, Proceedings of the 35th International Cosmic Ray Conference (ICRC 2017), Busan (South Korea), arXiv:1708.06386
- Fomin et al. (1994) Fomin, V., et al., 1994, Astroparticle Physics, vol. 2, p. 137
- Gehrels et al. (2004) Gehrels, N., et al. 2004, ApJ, 611, 1005
- Giannios et al. (2009) Giannios, D., Uzdensky, D. A., & Begelman, M. C. 2009, MNRAS, 395, L29
- Ghisellini et al. (1998) Ghisellini, G., Celotti, A., Fossati, G., Maraschi, L., & Comastri, A. 1998, MNRAS, 301, 451
- Ghisellini & Tavecchio (2009) Ghisellini, G., & Tavecchio, F. 2009, MNRAS, 397, 985
- Ghisellini et al. (2011) Ghisellini, G., Tavecchio, F., Foschini, L., & Ghirlanda, G. 2011, MNRAS, 414, 2674
- Hagen-Thorn et al. (2002) Hagen-Thorn, V. A., Larionova, E. G., Jorstad, S. G., Björnsson, C.-I., & Larionov, V. M. 2002, A&A, 385, 55
- Hirotani & Pu (2016) Hirotani, K., & Pu, H.-Y. 2016, ApJ, 818, 50
- Hervet et al. (2016) Hervet, O., Boisson, C., & Sol, H. 2016, A&A, 592, A22
- Hovatta et al. (2016) Hovatta T., et al., 2016, A&A, 596, A78
- Hughes et al. (1989) Hughes, P. A., Aller, H. D., & Aller, M. F. 1989, ApJ, 341, 68
- Jermak et al. (2016) Jermak, H., Steele, I. A., Lindfors, E., et al. 2016, MNRAS, 462, 4267
- Jorstad et al. (2005) Jorstad, S. G., Marscher, A. P., Lister, M. L., et al. 2005, AJ, 130, 1418
- Jorstad et al. (2013) Jorstad, S. G., Marscher, A. P., Smith, P. S., et al. 2013, ApJ, 773, 147
- Jorstad et al. (2017) Jorstad, S. G., Marscher, A. P., Morozova, D. A., et al. 2017, ApJ, 846, 98
- Kranich et al. (2003) Kranich, D., et al., 2003, ASP Conference Proceeding, 299, 3
- Larionov et al. (2008) Larionov, V. M., Jorstad, S. G., Marscher, A. P. et al. 2008, A&A, 492, 389
- Lindfors et al. (2016) Lindfors E. J., et al., 2016, A&A, 593, A98
- Madejski et al. (1999) Madejski, G. M., Sikora, M., Jaffe, T., et al. 1999, ApJ, 521, 145
- Mannheim (1993) Mannheim, K. 1993, A&A, 269, 67
- Maraschi et al. (1992) Maraschi, L., Ghisellini, G., & Celotti, A. 1992, ApJ, 397, L5
- Maraschi & Tavecchio (2003) Maraschi, L., & Tavecchio, F. 2003, ApJ, 593, 667
- Marscher et al. (2008) Marscher, A. P., Jorstad, S. G., D’Arcangelo, F. D., et al. 2008, Nature, 452, 966
- Marscher (2014) Marscher, A. P. 2014, ApJ, 780, 87
- Mattox et al. (1996) Mattox, J. R., et al. 1996, ApJ, 461, 396
- Miller et al. (1978) Miller, J. S, French, H. B. and Hawley, S. A., 1978, Astrophysical Journal, vol. 219, p. L85
- Mirzoyan (2015) Mirzoyan, R. 2015, The Astronomer’s Telegram, 7660
- Moralejo et al. (2009) Moralejo, et al., 2009, arXiv:0907.0943
- Morris et al. (2018) Morris, P. J., Potter, W. J., & Cotter, G. 2018, MNRAS, submitted, arXiv:1810.04139
- Mücke et al. (2003) Mücke, A., Protheroe, R. J., Engel, R., Rachen, J. P., & Stanev, T. 2003, Astroparticle Physics, 18, 593
- Mukherjee (2016) Mukherjee, R., & VERITAS Collaboration 2016, The Astronomer’s Telegram, 9599
- Neshpor et al. (2001) Neshpor, Y. I, Chalenko, N. N, Stepanian, A. A., Kalekin, O. R, Jogolev, N. A, Fomin, V. P. and Shitov, V. G., 2001, Astronomy Reports, vol. 45, p. 249
- Nieppola et al. (2009) Nieppola, E., Hovatta, T., Tornikoski, M., et al. 2009, AJ, 137, 5022
- Nilsson et al. (2007) Nilsson K., Pasanen M., Takalo L. O., Lindfors E., Berdyugin A., Ciprini S., Pforr J., 2007, A&A, 475, 199
- Nilsson et al. (2018) Nilsson K., Lindfors, E., Takalo L. O., 2018, A&A, 620, A185
- O’Sullivan & Gabuzda (2009) O’Sullivan, S. P., & Gabuzda, D. C. 2009, MNRAS, 400, 26
- Padovani & Giommi (1995) Padovani, P. and Giommi, P., 1995, Astrophysical Journal, vol. 444, p. 567
- Poole et al. (2008) Poole, T. S., et al. 2008, MNRAS, 383, 627
- Pushkarev et al. (2012) Pushkarev, A. B., Hovatta, T., Kovalev, Y. Y., et al. 2012, A&A, 545, A113
- Raiteri et al. (2009) Raiteri, C. M., Villata, M., Capetti, A., et al. 2009, A&A, 507, 769
- Raiteri et al. (2013) Raiteri, C., et al. 2013, MNRAS, 436, 1530
- Ramakrishnan et al. (2016) Ramakrishnan V., et al., 2016, MNRAS, 456, 171
- Ravasio et al. (2002) Ravasio, M., Tagliaferri, G., Ghisellini, G., et al. 2002, A&A, 383, 763
- Richards et al. (2011) Richards, J. L., Max-Moerbeck, W., Pavlidou, V., et al. 2011, ApJS, 194, 29
- Roming et al. (2005) Roming, P. W. A., et al. 2005, Space Sci. Rev., 120, 95
- Rolke et al. (2005) Rolke, W. A., López, A. M., & Conrad, J. 2005, Nuclear Instruments and Methods in Physics Research A, 551, 493
- Sambruna et al. (1999) Sambruna, R. M., Ghisellini, G., Hooper, E., et al. 1999, ApJ, 515, 140
- Sandrinelli et al. (2017) Sandrinelli, A., Covino, S., Treves, A., et al. 2017, A&A, 600, A132
- Schlafly & Finkbeiner (2011) Schlafly E. F., Finkbeiner D. P., 2011, ApJ, 737, 103
- Smith et al. (2009) Smith, P. S., Montiel, E., Rightley, S., et al. 2009, arXiv:0912.3621
- Stickel et al. (1991) Stickel, M., Padovani, P., Urry, C. M., Fried, J. W., & Kuehr, H. 1991, ApJ, 374, 431
- Sikora et al. (1994) Sikora, M., Begelman, M. C., Rees, M. J. 1994, ApJ, 421, 153
- Sikora et al. (2008) Sikora, M., Moderski, R., & Madejski, G. M. 2008, ApJ, 675, 71-78
- Tavecchio et al. (2011) Tavecchio, F., Becerra-Gonzalez, J., Ghisellini, G., et al. 2011, A&A, 534, A86
- Tavecchio & Ghisellini (2016) Tavecchio, F., & Ghisellini, G. 2016, MNRAS, 456, 2374
- Teraesranta et al. (1998) Teraesranta, H., Tornikoski, M., Mujunen, A., et al. 1998, A&AS, 132, 305
- Tsujimoto et al. (2017) Tsujimoto, S., Vazquez Acosta, M., Lindfors, E., et al. 2017, Proceedings of the 35th International Cosmic Ray Conference (ICRC2017), Bexco, Busan, Korea, arXiv:1709.05063
- Wehrle et al. (2016) Wehrle, A. E., Grupe, D., Jorstad, S. G., et al. 2016, ApJ, 816, 53
- Weymann et al. (1991) Weymann, R. J., Morris, S. L., Foltz, C. B., & Hewett, P. C. 1991, ApJ, 373, 23
- Wykes et al. (2014) Wykes, S., Hardcastle, M.J., Karakas, A.I., Vink, J.S. 2014, MNRAS, 442, 2867
- Zanin et al. (2013) Zanin, R., Carmona, E., Sitarek, J., et al., 2013, Proc of 33rd ICRC, Rio de Janeiro, Brazil, 773
- Zacharias et al. (2017) Zacharias, M., Sitarek, J., Dominis Prester, D., et al. 2017,Proceedings of 35th ICRC, Busan (Korea) 2017, arXiv:1708.00653