Supernova Neutrino Process of Li and B Revisited
Abstract
We reinvestigate effects of neutrino oscillations on the production of 7Li and 11B in core-collapse supernovae (SNe). During the propagation of neutrinos from the proto-neutron star, their flavors change and the neutrino reaction rates for spallation of 12C and 4He are affected. In this work corrected neutrino spallation cross sections for 4He and 12C are adopted. Initial abundances involving heavy -nuclei and other physical conditions are derived in a new calculation of the SN 1987A progenitor in which effects of the progenitor metallicity are included. A dependence of the SN nucleosynthesis and final yields of 7Li and 11B on the neutrino mass hierarchy are shown in several stellar locations. In the normal hierarchy case, the charged-current (CC) reaction rates of are enhanced, and yields of proton-rich nuclei, along with 7Be and 11C, are increased. In the inverted hierarchy case, the CC reaction rates of are enhanced, and yields of neutron-rich nuclei, along with 7Li and 11B, are increased. We find that variation of the metallicity modifies the yields of 7Li, 7Be, 11B, and 11C. This effect is caused by changes in the neutron abundance during SN nucleosynthesis. Therefore, accurate calculations of Li and B production in SNe should take into account the metallicity of progenitor stars.
https://stellarcollapse.org/snec), TALYS-1.8 (2015) (Koning et al., 2008, http://www.talys.eu/home),
MA38 sparse-matrix package (Davis & Duff, 1995, http://www.hsl.rl.ac.uk/catalogue/ma38.html)
1 Introduction
Lithium, beryllium, and boron are fragile light elements with very small solar abundances (Lodders et al., 2009). For the most part they are destroyed during the stellar evolution (Pagel, 1997), although some 7Li could be made in red giant stars, while 7Li and 11B can be made by the -process in SNe. One important mechanism for the production of LiBeB isotopes is via cosmic ray nucleosynthesis. The nuclear spallation of CNO by protons and 4He nuclei generates all 6,7Li, 9Be, and 10,11B isotopes, and reactions generate 6,7Li (Reeves, 1970; Meneguzzi et al., 1971). Also, the neutrino spallation process of He and C in massive stars during SN explosions contributes to the production of 7Li and 11B (Domogatskii et al., 1978; Woosley et al., 1990). In addition, the 3He(,)7Be reaction (Cameron, 1955; Cameron & Fowler, 1971) operates in asymptotic giant branch stars (Ventura & D’Antona, 2010), red giants (Sackmann & Boothroyd, 1999), novae (Hernanz et al., 1996) as well as in SNe. All of these processes contribute at some level to the Galactic chemical evolution of Li, Be, and B (Prantzos, 2012).
Because of the small yields for these light elements by astrophysical processes, observations of their primordial abundances can test cosmological models that predict changes in the abundances from that of standard big bang nucleosynthesis (SBBN). Lithium abundances on metal-poor stars have been measured by spectroscopic astronomical observations. Inferred abundances are somewhat smaller than the SBBN prediction (Spite & Spite, 1982; Ryan et al., 2000; Aoki et al., 2009; Sbordone et al., 2010). Some hypothetical BBN models involving exotic long-lived particles can explain the observed lithium abundance. For example, negatively-charged and/or strongly-interacting particles can decrease the primordial Li abundance (Bird et al., 2008; Kawasaki & Kusakabe, 2011) and enhance the primordial abundances of 9Be and/or 10B (Kusakabe et al., 2014, 2009). Thus, the primordial LiBeB abundance is a unique probe to explore the physics of the early universe.
SN explosions are energized by neutrinos emitted from the proto-neutron star (NS), and neutrino reactions with nuclei in the stellar interior produces a number of rare stable nuclei including 7Li, 11B, 138La, and 180Ta (Domogatskii et al., 1978; Woosley et al., 1990; Heger et al., 2005; Yoshida et al., 2005) as well as short-lived nuclei 92Nb and 98Tc (Cheoun et al., 2012; Hayakawa et al., 2013; Sieverding et al., 2015, 2016, 2018a; Hayakawa et al., 2018), and 26Al and 22Na (Sieverding et al., 2015, 2016, 2018a, 2018b). Among them, the production of the light elements Li and B occurs in the C- and He-rich layers inside of which neutrino flavor mixing can effectively occur due to the influence of the stellar electrons. Effects on the Li and B yields from the neutrino temperature and the total neutrino energy emitted from the NS have been studied previously (Yoshida et al., 2004, 2005). In addition, effects of neutrino oscillations have been clarified and Li and B yields have been calculated as functions of neutrino mixing angle for both cases of the normal and inverted mass hierarchy (Yoshida et al., 2006a, b).
Detailed results of the SN neutrino process for Li and B yields have been obtained adopting neutrino-nucleus reaction cross sections for 4He and 12C based on shell model calculations that explain the spin properties of -shell nuclei (Yoshida et al., 2008). Larger total neutrino energy or neutrino temperature enhances the Li and B yields, and the yield ratio of 7Li/11B are different between the normal and inverted mass hierarchy. The 7Li and 11B abundances are also affected by collective neutrino oscillation effects in the inner region of SNe (Ko et al., 2019a). Based on time-dependent neutrino spectra, effects of neutrino flavor changes on SN nucleosynthesis have been studied (Wu et al., 2015). Although collective effects on 7Li and 11B have not yet been analyzed, it has been found that collective neutrino oscillations enhance the yields of 138La and 180Ta. In their model, the Mikheyev-Smirnov-Wolfenstein (MSW) flavor oscillations are expected to have a stronger impact on the production of Li and B than the collective oscillations.
It has also been pointed out that by considering the ratios Li/Si and B/Si that are larger than the solar value and isotopic ratios 7Li/6Li and 11B/10B measured in SiC X grains, an upper limit on the yield ratio 7Li/11B can be derived (Mathews et al., 2012). This could be a method to constrain the neutrino mass hierarchy from meteoritic measurements.
Uncertainties in nuclear reaction rates, however, make yields of presupernova stellar nucleosynthesis ambiguous. Effects on Li and B synthesis from variations of rates of the triple-alpha reaction and 12C(,)16O have been investigated (Austin et al., 2011). It was found that the uncertainty in the reaction rate of 12C(,)16O leads to a difference in the 11B yield by a factor of up to two. However, constraints from solar system abundances of the intermediate-mass isotopes (O to Ca) and -only isotopes can limit the possible variations in rates of the triple-alpha reaction and 12C(,)16O (Austin et al., 2014). Austin et al. (2014) found that the yields of 7Li and 11B can change by at most 10 %. If progenitor stars experience convective mixing of O- and C-rich layers, SN nucleosynthesis is affected via changes in the neutron and proton abundances (Nadyozhin & Panov, 2014). Recently, based on a two-dimensional SN explosion model, it has been suggested that the very inner region of -rich nucleosynthesis freezeout can contribute to the Li and B yields since part of the nuclei in that region can escape from fallback onto the NS (Sieverding et al., 2018c).
Thus, to study the neutrino oscillation effects by comparing theoretical results with observations of 7Li and 11B abundances an effort is needed to improve knowledge on: (1) neutrino spectra and reaction cross sections; (2) nuclear reaction rates and stellar evolution; and (3) multi-dimensional effects of SN explosions. The neutrino spallation of He in the He-rich layer of low metallicity stars can induce -process nucleosynthesis on a relatively long time scale and low temperature only for the inverted mass hierarchy case (Banerjee et al., 2016a). Also, 9Be production via 7Li(,)8Li(,)9Li(,)9Be and 7Li(,)9Be can operate in such a metal-poor condition (Banerjee et al., 2016a). It has been suggested that the solar system formation was triggered by a low mass supernova with a low explosion energy. This event can explain the solar abundances of stable nuclei and the abundances of short-lived nuclei when meteorites formed. It can also explain the existence of short-lived 10Be produced via the neutrino spallation of 12C (Banerjee et al., 2016b).
In this paper, we study effects of the initial nuclear abundances and new reaction rates on the SN nucleosynthesis of 7Li and 11B. Production of those light nuclei in SNe is important because of the potential for constraining conditions of stellar evolution, and neutrino emission from NSs, and SN explosions. Therefore, we also make a detailed analysis of the results of neutrino process nucleosynthesis. In Sec. 2 a description of our model is given for the presupernova evolution, the SN explosion, the nucleosynthesis, neutrino cross sections, and neutrino reaction rates with the flavor change taken into account. In Sec. 3 effects of neutrino flavor changes are shown in the time evolution of nuclear abundances. Final yields are derived as a function of the Lagrangian mass coordinate. In Sec. 4 effects of initial nuclear abundances are investigated. In Sec. 5 the total yields of 7Li and 11B are listed, and the possible range of Li/B ratios in SN grains is discussed. In Sec. 6 we summarize this study. In Appendix A we add a note on the time evolution of nuclear production rates taking the JINA REACLIB functions as an example. In Appendices B and C we identify which reactions operate in different layers of the star, along with a study of the effects of neutrino oscillations and the initial nuclear abundances on the reaction rates.
2 Model
2.1 Presupernova
Neutrino oscillations occur during transport from the neutrino-sphere through the stellar envelope. In core-collapse SNe, a shock wave develops, and the temperature and density are changed once the shock arrives at a given radius. The changes of temperature and density can induce nucleosynthesis, and the nuclear abundances and electron fraction are changed. The neutrino oscillations which depend on the electron density are then different between epochs before and after the arrival of the shock. However, most of the neutrinos emitted from the proto-neutron star are produced soon after the stellar core bounce. Most neutrinos pass through before the shock wave reaches to the radial region where the neutrino flavor changes significantly. Therefore, we neglect the effect of the shock on the neutrino oscillations (Yoshida et al., 2008)111Because of a shock, we can have a situation in which neutrinos experience the MSW H resonance more than once during their propagation. This shock effect on the neutrino process will be reported elsewhere (Ko et al., 2019b).
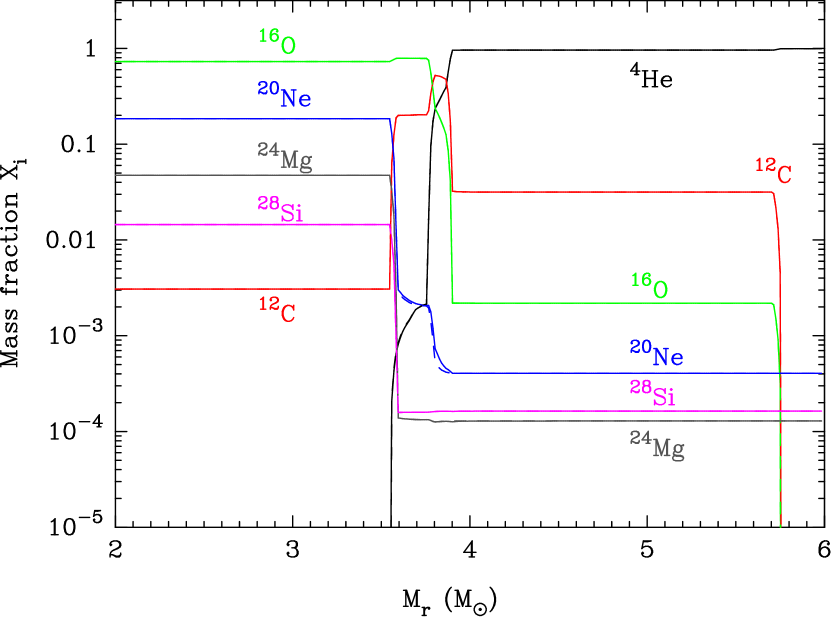
We adopt the presupernova density, temperature, and abundance profiles from a new calculation using the method of (Kikuchi et al., 2015) where the initial metallicity is taken to be appropriate to that of the Large Magellanic Cloud. The density and temperature profiles are very similar to that used previously in the SN explosion calculation of model 14E1 for SN1987A (Shigeyama & Nomoto, 1990). This star corresponds to the last evolution stage of a progenitor star, with an initial mass of which has evolved to a helium core of just prior to collapse.
Figure 1 shows the mass fractions of abundant nuclei as a function of the Lagrangian mass coordinate, before the neutrinos arrive (dashed lines) and after the shock passes (solid lines). The 7Li and 7Be are predominantly produced in the He-rich layer, while the 11B and 11C are produced in both the He- and C-rich layers. In these layers, the main nuclear components are not altered by the passage of the shock. The solid and dashed lines almost completely overlap except for 20Ne at the base of the 4He shell.
2.2 Hydrodynamics
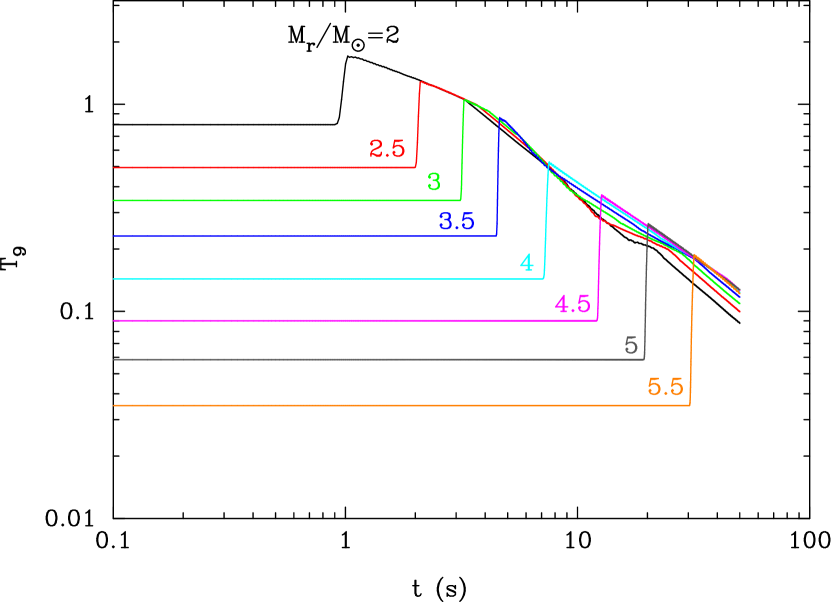
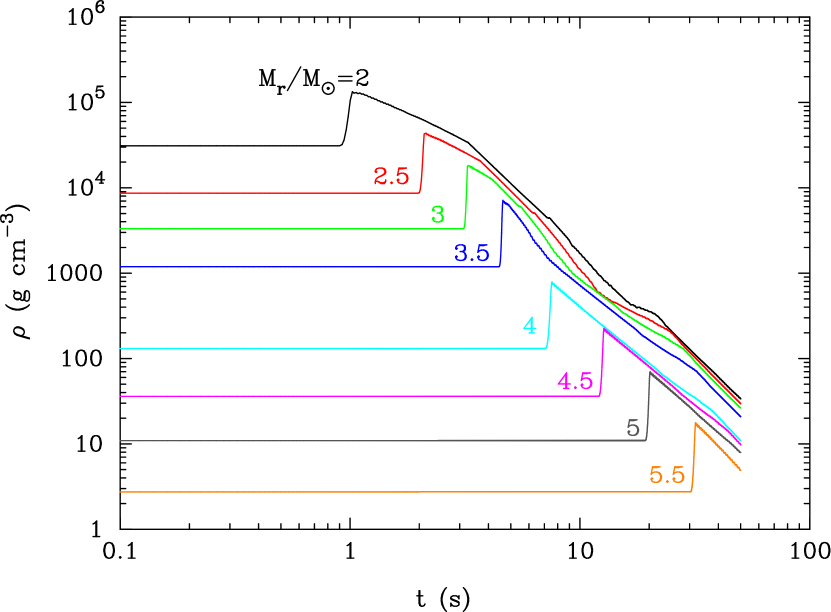
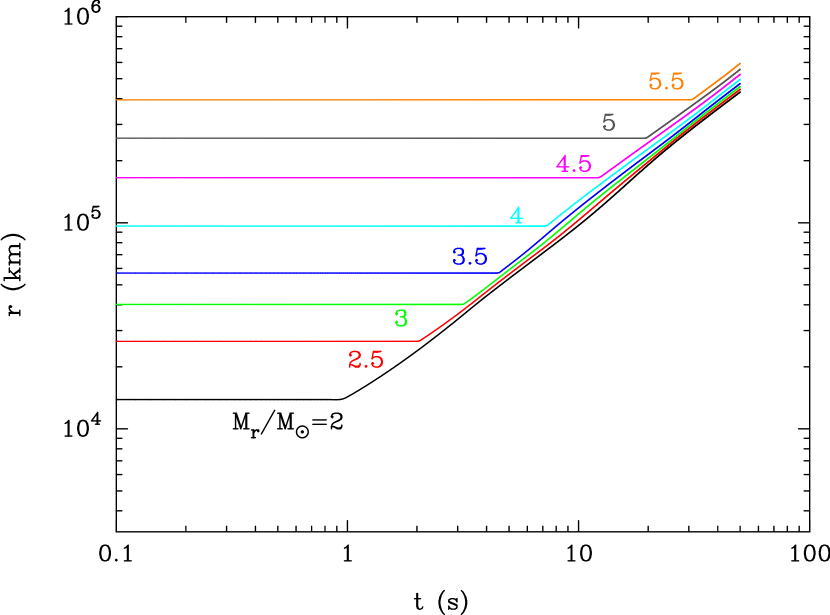
Hydrodynamical data for the SN explosion are derived using the public code (blcode) (Christian Ott, Viktoriya Morozova, and Anthony L. Piro; https://stellarcollapse.org/snec). The density and temperature profiles of the presupernova stellar model are adopted for the initial state of the star, and a thermal bomb type explosion is evolved. We adopt a simple setup for the explosion, i.e., a constant luminosity for 3 s with a total explosion energy of erg. This is consistent with the neutrino luminosity described below. The calculation is stopped at 50 s after the start of the calculation, and the output is recorded every 0.02 s. An equal interval in mass of 360 zones is adopted for the stellar grid. The explosion energy is injected at the innermost five grid points above the mass cut at . After s, we switched off two-body reactions by setting the temperature and density low enough that only one-body decay can operate.
Figures 2, 3, and 4 show the time evolution of the temperature, density, and radius, respectively, for Lagrangian masses e.g. of , 2.5, 3, 3.5, …, and 5.5 as labeled.
2.3 Nuclear reaction network
We have constructed a code for the calculation of the SN nucleosynthesis including neutrino reactions as well as nuclear reactions, -decay, and -decay. We adopt nuclear data and reaction rates from the JINA REACLIB database (Cyburt et al., 2010, JINA REACLIB V2.0, 2014) 222The data file erroneously included two different rates for the -decay of (ga85 ge85) and (mo111 tc111), respectively. We should use only one rate for each reaction, and the latest rates from wc12w were chosen for the both reactions (Richard Cyburt, Priv. Comm. April, 2014).. Information on REACLIB rates and nuclear partition functions are available in the README file by Rauscher 333http://download.nucastro.org/astro/reaclib. The -decay reactions of unstable nuclides with half lives Gyr are added with rates taken from National Nuclear Data Center, Brookhaven National Laboratory 444http://www.nndc.bnl.gov. Elements up to 87Fr, involving 3080 nuclides and 38197 reactions are included in the network.
The latest evaluated values (Lodders et al., 2009)555Mo, Dy, Er, Yb and Lu have updated isotopic compositions. of solar abundances 4.56 Gyr ago, i.e., at the solar birth, are adopted. To solve for the abundance evolution the variable order Bader-Deuflhard time integration method is adopted coupled with the MA38 sparse-matrix package (Davis & Duff, 1995)666http://www.hsl.rl.ac.uk/catalogue/ma38.html. This is one of the best methods investigated in Timmes (1999). The subroutines METANI (Bader & Deuflhard, 1983) and STIFBS (Press et al., 1992) are used. The theoretical tolerance in final abundances of major nuclei associated with this numerical integration is set to be less than 1 %. The method used in this paper is adopted for controlling numerical errors by a real error estimate, not by error expectation. Also, the variable order method adopted here minimizes the computational time while keeping the required numerical accuracy.
One should include all possible important reactions of the light nuclides, Li, Be, and B, to derive their yields accurately. In addition to the JINA REACLIB database, we include the reaction 10B(, )10Be ( MeV) with a rate estimated with the TALYS-1.8 code (2015) (Koning et al., 2008)777http://www.talys.eu/home. The thermally averaged reaction rate in the range of is fitted with the JINA REACLIB function [Eq. (A10)] with fixed . The result is , , , , , and . The rate for the reverse reaction 10Be(, )10B is given by the same coefficients (, …, ) with and . It is noted, however, that this reaction has a negligible effect on the evolution of nuclear abundances in the present calculation of SN nucleosynthesis. Rates of other final states, i.e., 10B(, )11B and 10B(, )7Li, derived with the TALYS code agree with those in JINA REACLIB database to within a factor of three in the relevant temperature region.
2.4 Neutrino flavor change probability
The neutrino oscillations in matter are described by the mixing matrix
| (14) | |||||
| (15) |
where is the radius from the center of the proto-neutron star, is the difference of mass squared with the neutrino mass of eigenstate , is the Fermi constant, is the electron number density, and while . Plus and minus signs in the second term in the square brackets of the RHS in Eq. (14) correspond to neutrinos and anti-neutrinos, respectively.
It has been clearly demonstrated (Kuo & Pantaleone, 1987; Yokomakura et al., 2002) that the CP violation will not be seen in any observables when - and -neutrino energy spectra and those of anti-neutrinos are degenerate, as expected to be the case approximately for the neutrinos emitted from core-collapse supernovae. Therefore, we set the CP phase equal to be zero.
The central values of the particle data group, 2015 (Olive & Particle Data Group, 2014) are adopted for the parameters of this equation as follows: , , , eV2, and eV2. Our calculation completely reproduces Figs. 1a and 2a of Yoshida et al. (2006b) when adopting the same values for neutrino parameters.
Probabilities of neutrino flavor change are then calculated for the parameter set of neutrino energy and radius . The probabilities do not depend on the time of neutrino emission from the neutrino sphere since we have assumed steady-state density, temperature, and abundances for the presupernova.
2.5 -reaction rate
The number flux of neutrinos with flavor (=, , ) and energy coming from the proto-NS is described (Balantekin & Yüksel, 2005; Yoshida et al., 2006b) by
| (16) |
with,
| (17) |
where is the luminosity of the neutrino , is the Boltzmann constant, is the temperature of neutrino , and is defined in terms of the chemical potential .
The reaction rate of neutrino (Yoshida et al., 2006b) is given by
where is the probability of neutrino flavor change from to during the propagation of a neutrino with energy from to . is the cross section for neutrino reactions as a function of , and the thermal average value of the product of the flavor-change-probability and the cross section is defined in the last equality by
Specific values of the function include with and . Reaction rates of antineutrinos can be formulated similarly to those of neutrinos. In this study, we assume for all flavors [see (Yoshida et al., 2005) for effects of chemical potentials].
2.5.1 Neutral current reaction rate
The total neutral current (NC) reaction rate is given by
| (20) | |||||
where is used in the last equality. This rate is thus independent of the flavor-change-probabilities, and the average cross section is independent of radius.
2.5.2 Charged current reaction rate
Only the electron-type neutrinos (and antineutrinos) can react with nuclei via charged current (CC) interactions. This is because of the low neutrino energies, MeV. The charged current reaction rates are then given by
Note that neglecting the neutrino oscillation effect corresponds to assuming the condition . The charged current reaction rate is then given by
| (22) |
2.5.3 Neutrino parameters
The time evolution of the neutrino luminosity is adopted from Yoshida et al. (2004)
| (23) | |||||
where is the total energy of the emitted neutrinos, is the light speed, and is the step function in .
We assume the following values for parameters from Yoshida et al. (2006b): The total energy is erg. The decay time of the neutrino luminosity is s. Neutrino temperatures are , , and MeV (for =, , , and ), which have been constrained by consideration of the Galactic chemical evolution of B (Yoshida et al., 2004, 2005, 2006a, 2006b, 2008).888Neutrino energy spectra and their evolution as well as the explosion energy affect the production of 7Li and 11B. Accurate calculations for realistic neutrino spectra are desired to improve the calculation of 7Li and 11B yields.
The numerical values of Eqs. (LABEL:nu3) and (20) for are given by
| (24) | |||||
and
| (25) | |||||
respectively, where the physical quantities () are normalized to typical values for the SN neutrino process in the He-rich layer (), i.e., .
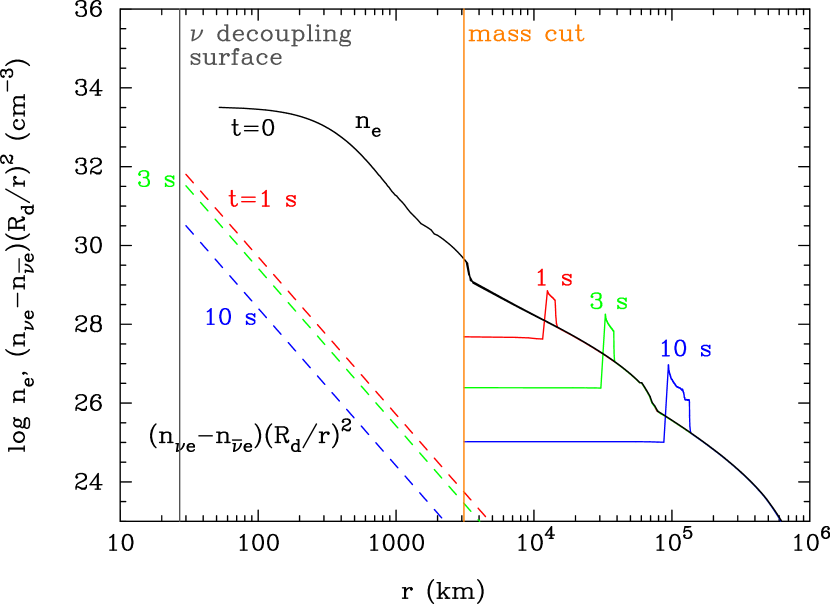
Figure 5 shows the electron number density and the quantity as a function of radius, where and are the number densities of neutrinos and antineutrinos, respectively, of flavor , and is the decoupling radius of neutrinos. We assume spherical symmetry in the electron number density and the azimuthal () symmetry in the neutrino number density for any fixed angle along a line from the stellar center to the neutrino decoupling surface. In this case, the effective Hamiltonians for neutrino-electron forward scattering and neutrino-neutrino forward scattering are, respectively, roughly proportional to and . For large radii of , it approximately follows that . In addition, under the present assumption, we have for and . Then, the above two quantities provide information on the order of magnitude of respective potential terms.
The inner vertical line is located at in the model of Wu et al. (2015). The outer vertical line is at the position of the mass cut at . Material inside this radius is assumed to collapse to the NS. Solid lines show the values at , 1, 3, and 10 s, respectively. Dashed lines show the effective neutrino number density at , 3, and 10 s, respectively. It is seen that above the mass cut, the condition is always satisfied. Therefore, the neutrino-neutrino forward scattering term is unimportant in this region. However, it is not clear whether the opposite condition is realized in the inner region since the inner region is not treated in the present hydrodynamical calculation. The role of collective oscillations cannot be assessed with the current model and therefore is neglected. A sensitivity of the flavor change to SN explosion models should be studied in detail in the future. In order to obtain a realistic result on the neutrino forward scattering effect, one needs results of consistent calculations including the NS formation, matter heating by neutrinos and the explosion dynamics.
2.6 reaction cross sections
2.6.1 Light nuclides
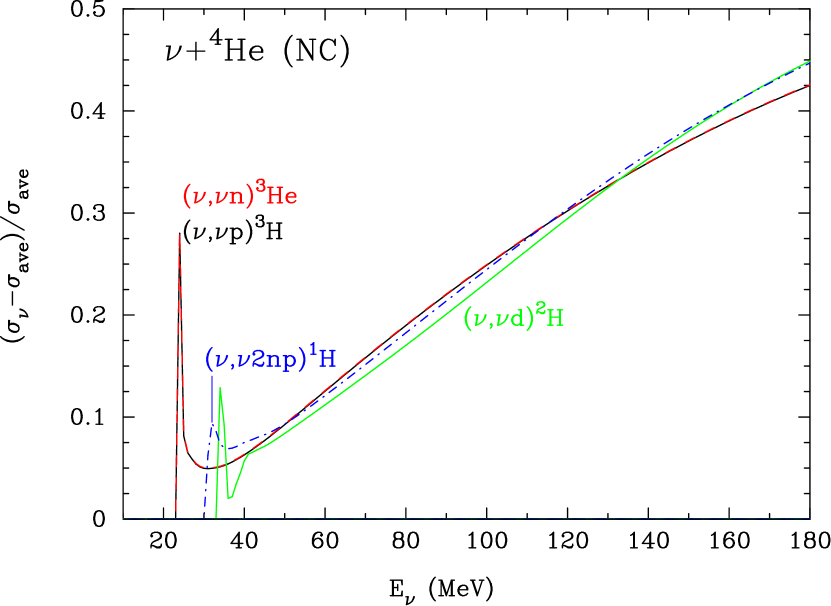
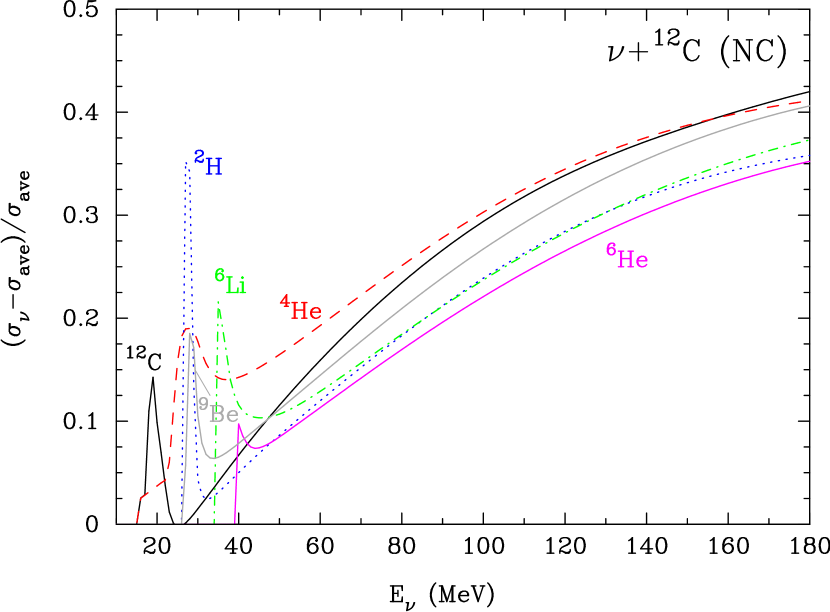
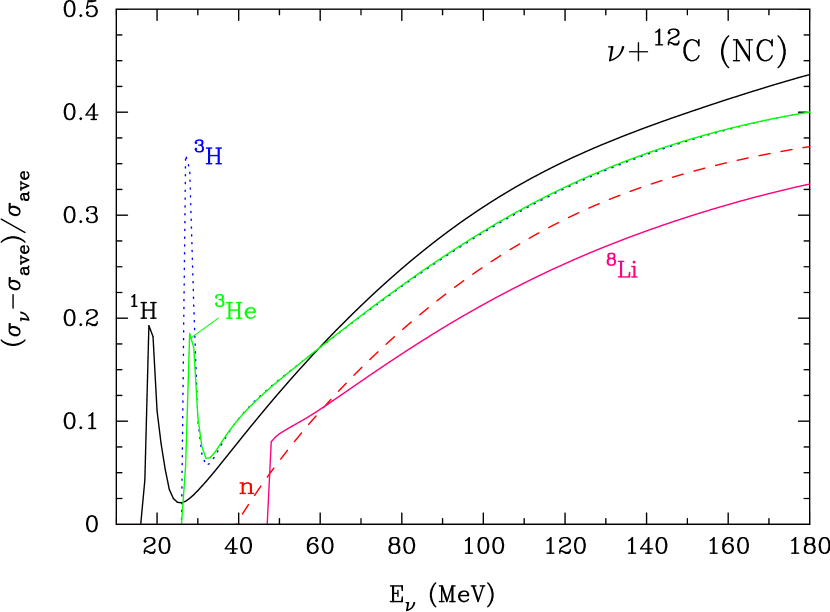
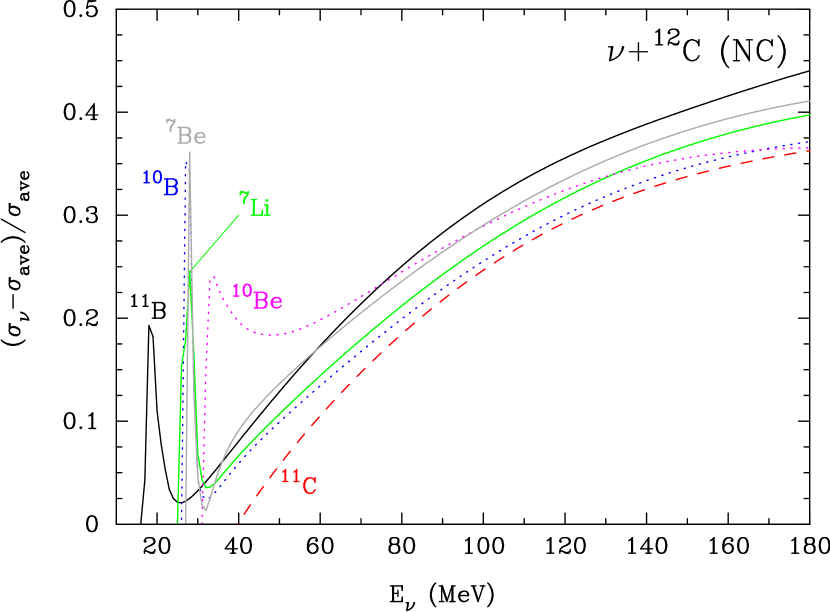
We adopt NC cross sections for the spallation of 4He and 12C by neutrinos and antineutrinos separately based upon the models WBP and SFO (Yoshida et al., 2008), respectively (calculated in Yoshida et al., 2008, but separate data have not been published). NC cross sections for neutrinos and antineutrinos differ from each other by up to a factor of 2. Since the spectra of and are different in general, we need to analyze the cross sections of neutrinos and antineutrinos separately. In previous studies (Yoshida et al., 2008), average values of the NC cross sections for neutrinos and antineutrinos were used. However, calculations with those average values are inaccurate.
Figures 6 and 7 show the fractional differences of neutrino NC cross sections for 4He and 12C, i.e., , respectively, as a function of the neutrino energy , where is the cross section of neutrinos and is the average cross section of neutrinos and antineutrinos. Here we see that the difference can be as large as a factor of 0.4 particularly at the highest energies corresponding to a factor of .
2.6.2 Heavy nuclei
We use averaged cross sections (Cheoun et al., 2012) 999We note typographical errors related to the 92Nb production in Table 1 in Cheoun et al. (2012), assuming that flavor-changes do not occur. This assumption is rather good since destruction via the -process operates in relatively high temperature environments realized in the inner stellar region. On the other hand, neutrino flavor changes occur for typical neutrino energies in the region outside of where the MSW resonance occurs.
Neutrino spallation of nuclides can affect the abundances of and during the SN nucleosynthesis. The rates of neutrino reactions on nuclei with other than 4He and 12C are adopted from Hoffmann and Woosley 101010http://dbserv.pnpi.spb.ru/elbib/tablisot/toi98/www/astro- /hw92_1.htm. We take their data for MeV and MeV for , , , and . The branching ratios for the NC reactions of and are not available. Hence, we take the branching ratios at MeV also for and .
There are several possible reaction pathways for 98Tc production: 97Mo(, )98Tc, 97Tc(, )98Tc, 98Mo(, )98Tc, 98Mo(, )98Tc, 99Ru(, )98Tc, and 99Tc(, )98Tc. The reaction 98Ru(, )98Tc is also possible. However, the abundance of 98Ru (a -nuclide) is much smaller than that of 98Mo, so that the production of 98Tc via this reaction is negligible. Also, the photodisintegration reaction 102Rh(, )98Tc is negligible since the initial abundance of the unstable isotope 102Rh is small. Results for the production of heavy nuclei including 98Tc based upon this network code are published elsewhere (See Hayakawa et al. (2018) for 98Tc production and Ko et al. (2019a) for general nucleosynthesis taking into account neutrino self-interaction effects).
2.7 Adopted models
We adopt five models for SN nucleosynthesis. First, for the standard model of initial nuclear abundances based on a presupernova stellar model (Sec. 2.1), the following three cases are adopted: (1) the neutrino oscillations are taken into account in the normal mass hierarchy; (2) the neutrino oscillations are taken into account in the inverted mass hierarchy; and (3) the neutrino oscillation is neglected 111111We also calculated for the case in which all neutrino reactions are neglected. In this case, however, yields of 7Li and 11B are negligibly low, and we can safely consider that their SN yields are effectively zero.. A comparison of results for these cases shows the effect of neutrino flavor change on SN nucleosynthesis. Second, for the case of an inverted mass hierarchy, we have two additional cases of initial abundances that are different from case (2) above: (4) abundances of elements heavier than 40Ca are proportional to the metallicity, i.e., (this setup roughly corresponds to that of the previous studies; Yoshida et al., 2005, 2006a, 2006b, 2008, 2004); (5) abundances of elements heavier than 40Ca are equal to solar abundances. Thus, in Cases 4 and 5, initial abundances of the heavy nuclides are not the presupernova abundances calculated for Cases 1 to 3. We can deduce effects of a presupernova -process and metallicity on the SN nucleosynthesis by comparing results of Cases 2, 4, and 5. For each model we divide the nucleosynthesis discussion into results in five Lagrangian grid zones centered at: 1) ; 2) ; 3) ; 4) ; and 5) .
3 effect of neutrino oscillations
3.1 Li and B yields
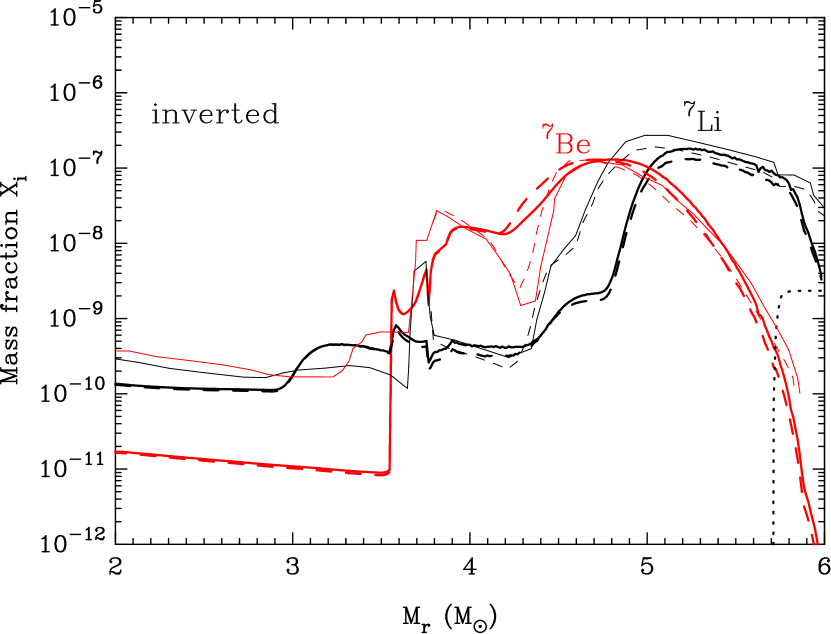
Figure 8 shows the calculated final mass fractions of 7Li and 7Be (left panels), and 11B and 11C (right panels), respectively at 50 s after the start of explosion as a function of Lagrangian mass coordinate (thick lines). Also plotted are the previous results (Yoshida et al., 2006b) (thin lines) taken from figure 3 of that paper for a model with neutrino flavor change probabilities. Solid lines show results of the normal mass hierarchy (upper panels) and the inverted mass hierarchy (lower panels), respectively. Dashed lines correspond to the case in which the neutrino oscillations are neglected.
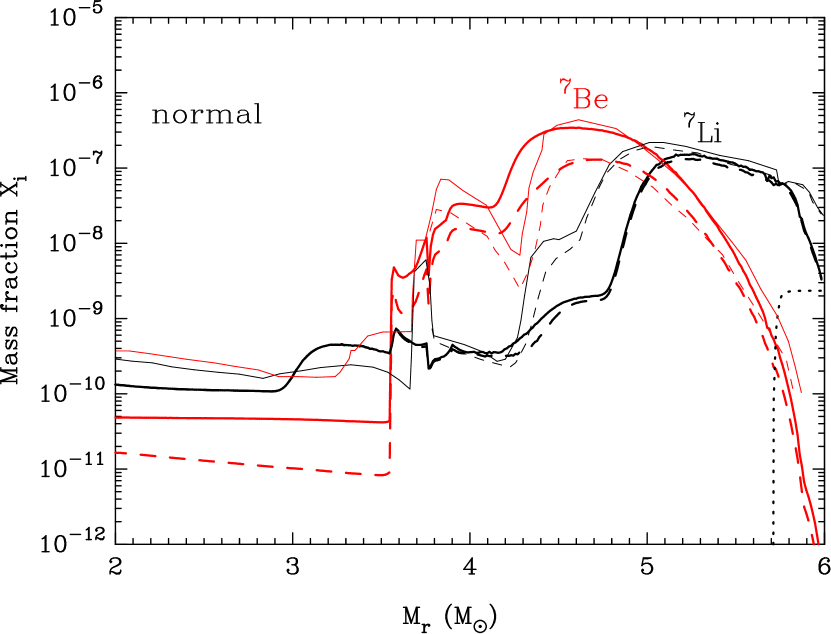
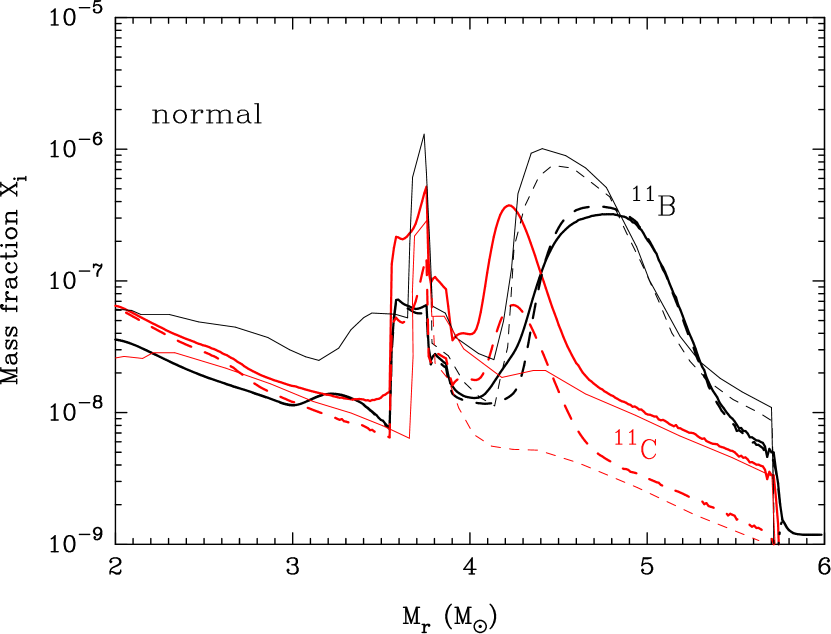
3.1.1 Normal hierarchy
In the He-rich layer, the global trends of 7Li and 7Be abundances are similar to the previous results. Especially, the 7Be yields at are very similar. However, there are differences. In our results, there are small peaks of 11C yields at .
Inside the O-rich layer at , abundances are not much different from those of the previous calculation (Yoshida et al., 2008). However, the 7Be abundance differs the most. Our results for the inverted hierarchy and no oscillation cases are more than one order of magnitude smaller than the previous results.
The main region for 7Li and 11B production is the He-rich layer. Differences in abundances between different cases in that region are observed for all nuclides. These differences come from the different hydrodynamical results and initial nuclear abundances adopted here. Our use of realistic light- and -process nuclear abundances lead to a more accurate evolution of the and abundances that affects the -process nucleosynthesis.
One difference in the innermost region from previous results (Yoshida et al., 2008) is that the abundances of 7Be and 11C depend on the neutrino oscillations in our calculation. We checked the abundance evolution at (see Sec. 3.2), and found that this difference occurs at a late time of s. At s, the radius has increased from cm to cm. When this shell expands to the MSW resonance location for typical neutrino energies, the neutrinos effectively change their flavors. Therefore, an observable effect is seen in the figure. However, since the yields of 7Be and 11C are very small in this innermost region, this difference is negligible in the total SN yields.
In this layer, the final abundances of 7Li and 7Be are contributed to by the late production after shock heating. A large difference between cases is seen for 7Be, while no large difference is seen for 7Li. There are also slight differences in the abundance of 11C.
There is the following general effect of the He reactions: The MSW effect increases the rates. Yields of 3He and are then increased. As a result, the production of 7Be and 11C via 3He(,)7Be(,)11C becomes stronger. In addition, the destruction of 11B is stronger due to the enhanced rate of 11B(,2)4He. There is also a slight increase in the 11B abundance at and a slight decrease at .
11B is burned via the 11B(,2)4He reaction from protons produced by the reactions on 4He and 12C (shells 2–4 in Sec. 3.2). The 1H abundance is the highest in the normal hierarchy case (shells 2–5). This enhanced 1H abundance leads to effective 11B burning. An enhancement of the 7Li destruction via 7Li(,)4He occurs also (shells 2–4) although the reaction 7Li(,)11B is the main channel for 7Li destruction.
3.1.2 Inverted hierarchy
The total abundance of nuclei is slightly larger in the inverted mass hierarchy case than in the case of no oscillations. The region of 7Be production is shifted to the outer region. On the other hand, the 7Li production region does not change, and yields are enhanced globally. The total abundance of mass-11 nuclei is also slightly larger. The 11B abundance is larger in the whole He-rich layer. The peak 11C yield at –4.3 is smaller than that of the no oscillation case.
In the range of –4.7 (shell 4), the 7Be abundance is smaller than in the no oscillation case, while the 7Li abundance is the same. Neutrino oscillations enhance the reaction rates. The 3He abundance is slightly smaller than that of the no oscillation case before the shock heating. This is because of the more effective operation of the 3He(,)3H reaction by the enhanced abundance. As a result, the production of 7Be is smaller than in the no oscillation case, and the resultant 7Be abundance is smaller. After the shock heating, 7Be nuclei are produced via the 3He(,)7Be reaction and destroyed by the 7Be(,)7Li reaction. During the temperature peak of the shock, the 3He abundance is smaller than that of the no oscillation case, and the 7Be production is slightly weaker. In addition, the destruction rate of 7Be(,)7Li is slightly larger. As a result, the final abundance of 7Be is smaller than that of the no oscillation case (cf. Fig 12).
In the region of , there are slight differences in the abundances of 11B and 11C. The reaction rates are enhanced by the MSW effect. In general, in the region of where the altered spectrum arrives, the 11B abundance is increased. The 11B nuclei are produced via the CC C reaction only, while 11C nuclei are produced via the CC C reaction only. Therefore, the change of the spectrum affects the 11B abundance preferentially. The 11C abundance is smaller at and higher for .
3.2 Abundance evolution
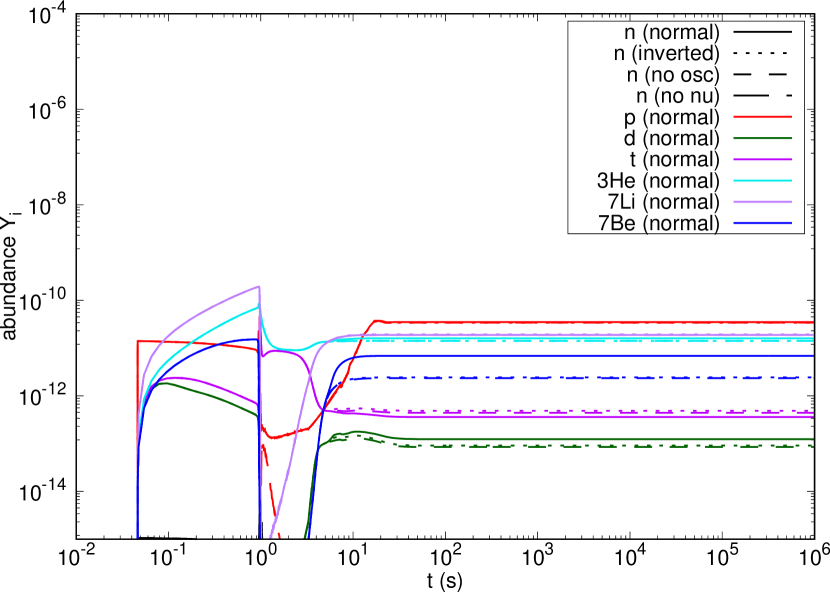
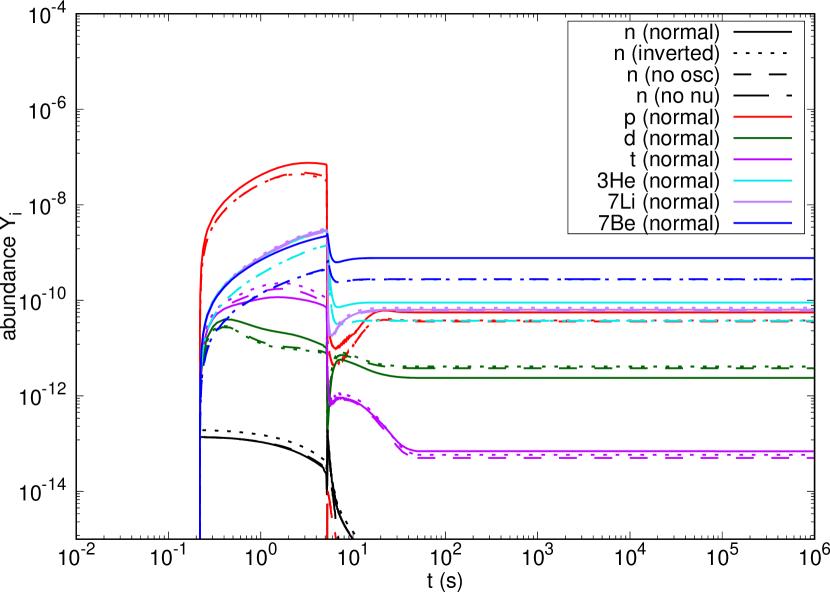
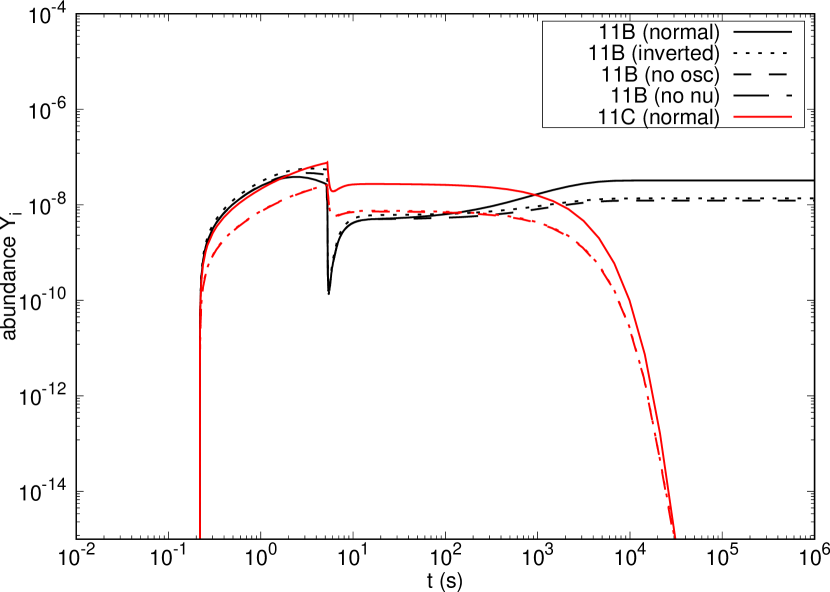
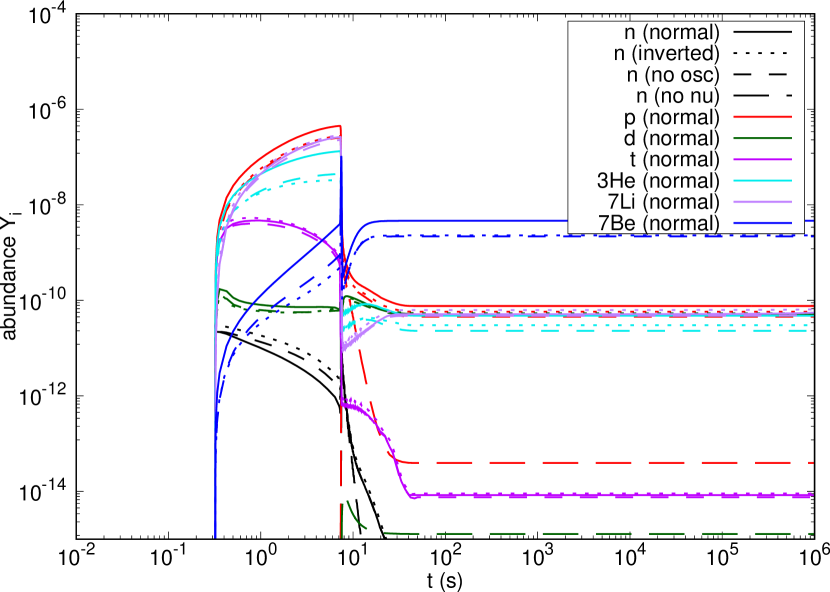
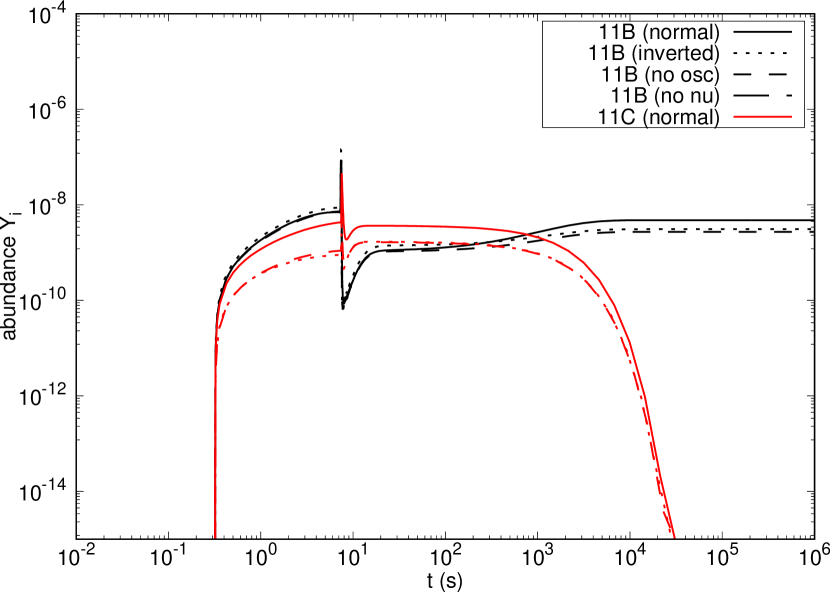
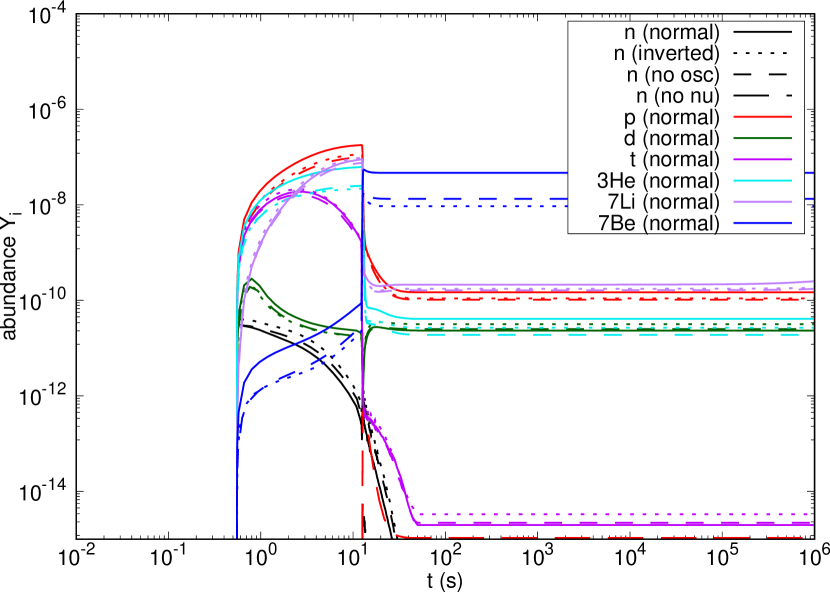
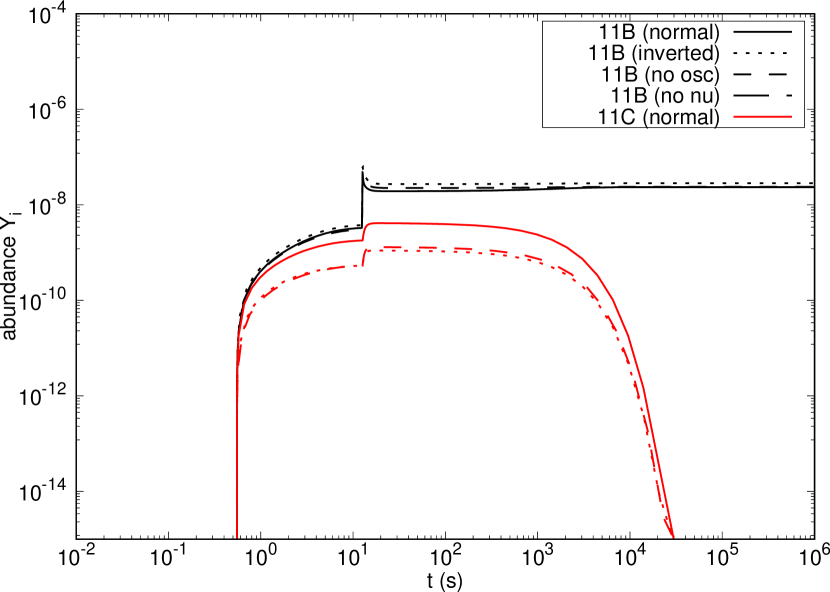
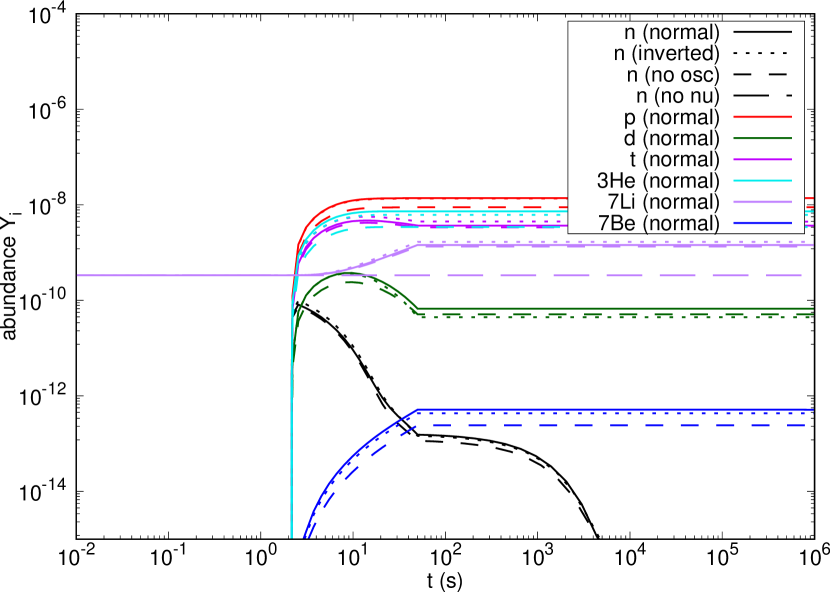
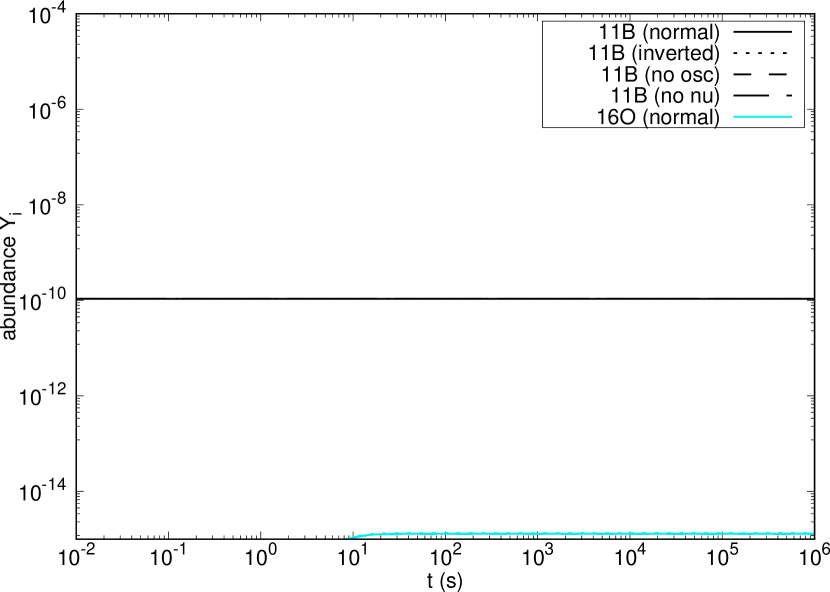
Figures 9–13 show nuclear abundances as functions of time for shells 1–5, respectively. The left panels show abundances of , , , , 3He, 7Li, and 7Be while the right panels show those of 11B, 11C, and 4He. Solid, dotted, and dashed lines correspond to the normal, inverted hierarchy, and no neutrino oscillation cases, respectively. Long dashed lines correspond to results in the case of no neutrino flux.
Table 1 shows the highest yield cases for respective nuclides and shells: NH, IH, and “no” refer to the normal hierarchy, inverted hierarchy, and the no oscillation cases, respectively. They are evaluated before the decay of unstable 7Be and 11C. If there are significant differences in yields between the second highest and lowest yield cases, the second highest yield case is indicated in brackets. Blanks indicate that yields are not much different between the three cases.
| nuclide \shell | 1 () | 2 () | 3 () | 4 () | 5 () |
|---|---|---|---|---|---|
| 3H | IH | NH (IH) | IH (NH) | IH (no) | IH (NH) |
| 3He | NH | NH | NH (IH) | NH (IH) | NH (IH) |
| 7Li | IH (NH) | IH | NH (IH) | IH (NH) | |
| 7Be | NH | NH | NH | NH (no) | NH (IH) |
| 11B | IH | IH | IH | ||
| 11C | NH | NH | NH |
3.2.1 Shell 1
At s, neutrinos from the proto-NS arrive to this layer, and light nuclides are produced via neutrino spallation reactions on 16O and 12C. At s, the SN shock arrives and the temperature increases. Then, the destruction of these light nuclides occurs. After the temperature decreases due to the expansion, light nuclides are produced again via neutrino reactions. In this late epoch, differences in the abundances of 3H, 3He and 7Be are seen between the different mass hierarchy cases. The production of 4He by the neutrino spallation of 12C does not occur in the case of no neutrino flux (see long dashed lines in Fig. 9, right panel).

3.2.2 Shell 2
For , neutrinos arrive at s, and the shock arrives at s. This region is out of the MSW high resonance region even before the explosion for a typical SN neutrino energy. Therefore, the flavor change effect appears after the neutrino arrival time, and there are differences in the light nuclear abundances. Before the shock arrives, the temperature in this region is low. Therefore, a significant fraction of protons generated by neutrino spallation survive, and the proton abundance is high. On the other hand, neutrons from the spallation can be easily captured by nuclei because there is no Coulomb penetration factor. The neutron abundance is then kept low. Large abundances of 11B and 11C are produced via the C reaction. A smaller but significant abundance of 7Be is also produced via C and survives. One can see large differences in the 7Be and 11C abundances, while no large differences are seen in the 7Li and 11B abundances.
3.2.3 Shell 3
Shell 3 () is in the He-rich region. The spallation of 4He nuclei produces large abundances of 3H and 3He. These 3H nuclei are then processed into 7Li via 3H(,)7Li. A fraction of the 3He nuclei are also processed into 7Be via the 3He(,)7Be reaction. 7Be is also produced via C spallation. 11B and 11C nuclei are produced from the neutrino spallation of 12C. The shock arrives to this region after the neutrino flux becomes somewhat diminished. After shock heating, 7Be nuclei are produced via the 3He(,)7Be reaction. Production of 11B and 11C via 7Li(,)11B and 7Be(,)11C also operates in this shell.
3.2.4 Shell 4
In shell 4 (), the trend of nucleosynthesis is similar to that of the inner shell. In this region, the 7Be yields from the 3He(,)7Be reaction are very large. The temperature is increased sufficiently that the 7Li(,)11B reaction is effective while the 7Be(,)11C reaction is not. Thus, the 7Be nuclei survive and the 11B yields in this layer are large.
3.2.5 Shell 5
In shell 5 (), the shock wave does not arrive during the hydrodynamics calculation. Similarly to the inner layers, a part of the 3H and 3He nuclei produced by the neutrino spallation of 4He are burned via the 3H(,)7Li and 3He(,)7Be reactions, respectively. However, the 11B and 11C yields from the C spallation reactions are very small due to the small 12C abundance.
The 7Be abundances in the normal and inverted hierarchy cases are larger than in the no oscillation case. The 7Li abundance is highest in the inverted hierarchy case. Because of the MSW resonance effect, the reaction rate is enhanced. Therefore, more 7Li is produced.
4 effects of initial abundances
4.1 Li and B yields
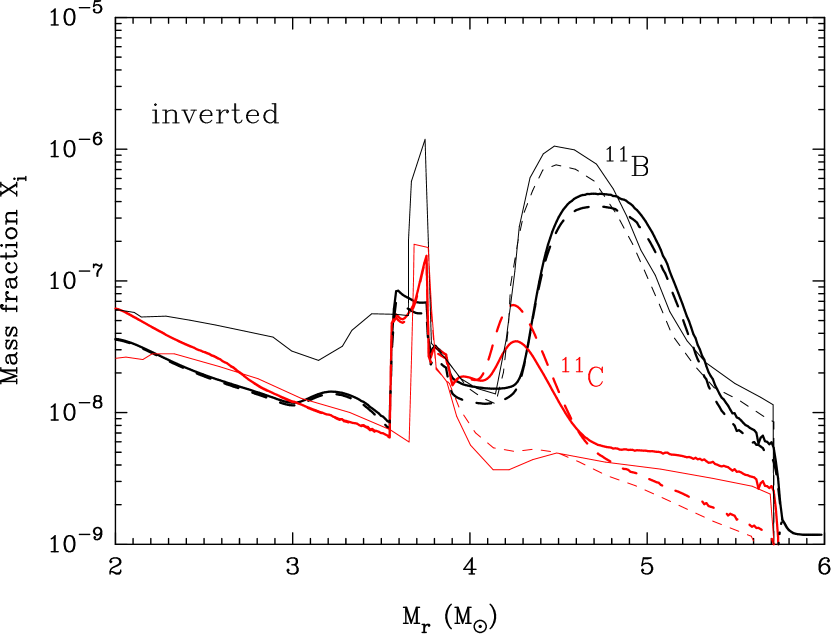
Figure 14 shows calculated final mass fractions of 7Li and 7Be (left panel) and 11B and 11C (right panel), respectively as a function of the Lagrangian mass coordinate (thick lines). The inverted hierarchy has been assumed for three of the models. Also plotted are the previous result (Yoshida et al., 2006b) for the inverted hierarchy case (thin lines). Solid and dashed lines correspond to Case 2 (the presupernova -abundances for ) and Case 5 (solar abundances), respectively. Although dotted lines are plotted for Case 4 (1/4 of solar abundances), they are overlapping with the solid lines.
The abundances of 7Li and 11B in the He-rich layers () are almost the same among the three cases, while the difference in the 7Be abundance is rather large. At the peak of the yield, the 7Be abundance is largest in Case 5.
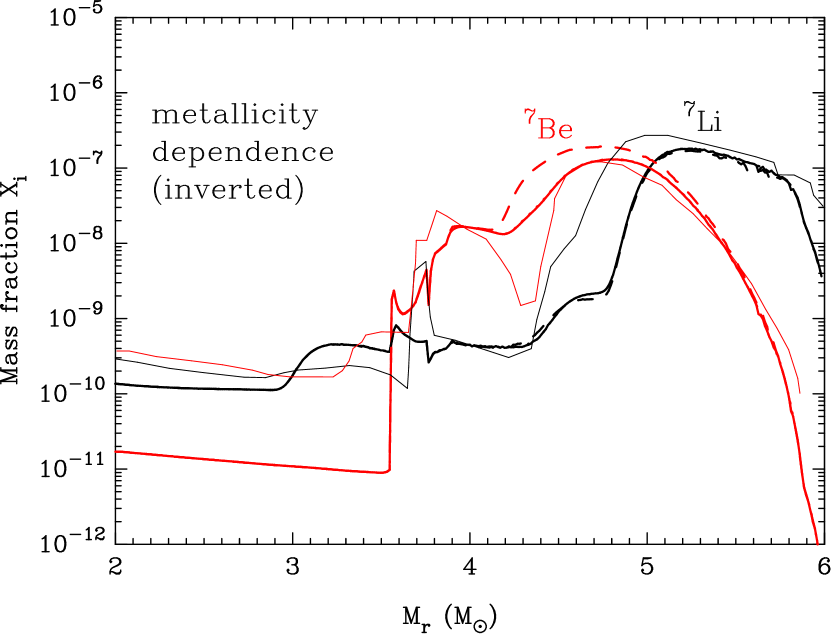
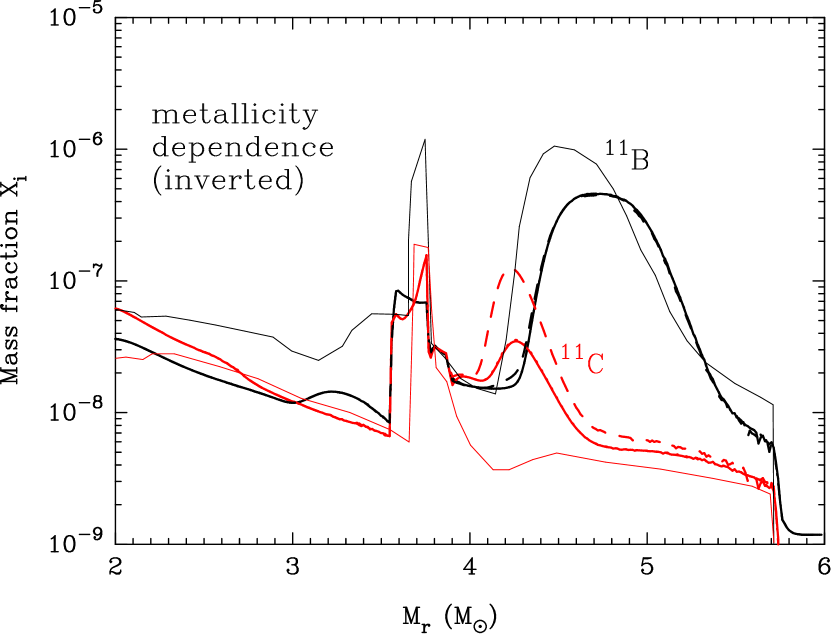
At the small peak of the 11C abundance at , the 11C abundance is largest in Case 5, similar to the 7Be abundance. Differences between Cases 2 and 4 are very small. Thus, the 7Li and 11B yields are not affected by changes in abundances of heavy nuclides during the presupernova evolution that experience neutron capture and photodisintegration reactions during the SN.
4.2 Abundance evolution
In the O-rich layer (shell 1), there is no difference in abundances of major nuclei. The abundances evolve in all three cases as shown in Figure 9 (dotted lines).
Figure 15 shows nuclear abundances as a function of time for shell 4. Abundances of , , , , 3He, 7Li, and 7Be (left panel) and 11B and 11C (right panel) are plotted. The inverted hierarchy has been assumed. Solid, dotted, and dashed lines correspond to results for heavy elemental abundances taken from the standard -abundances after stellar evolution in the case of (Case 2), solar abundances divided by 4 (Case 4), and solar abundances (Case 5), respectively.
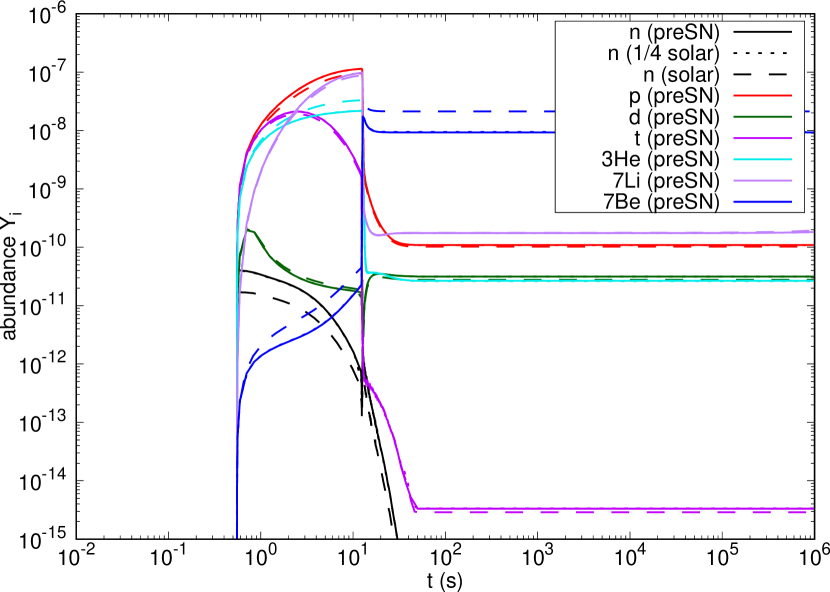
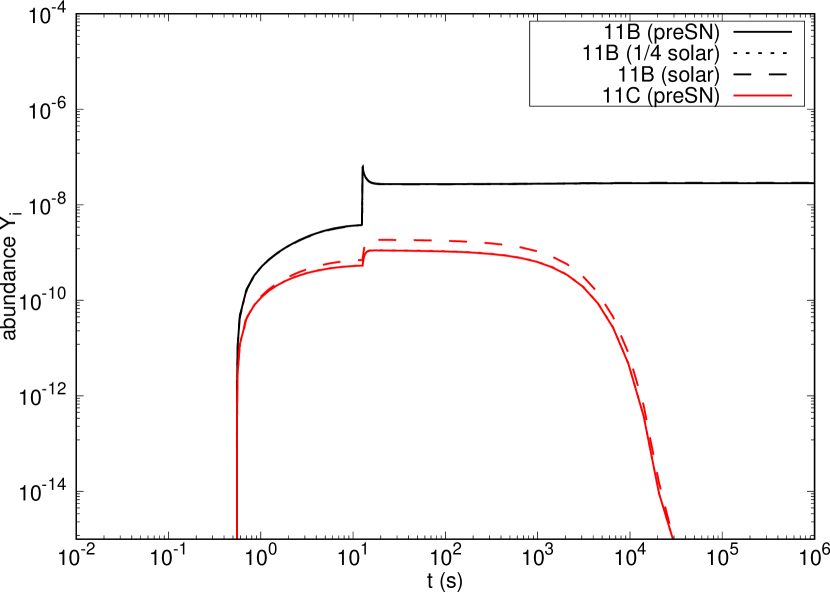
Before the shock arrives, the abundances of 3He and 7Be are largest and those of protons and neutrons are smallest in Case 5. After shock heating, significant differences in abundances only exist for 7Be and 11C. The 7Be and 11C abundances are largest in Case 5. The neutron abundance is determined by the abundance of neutron absorbers, i.e., the metallicity. In a metal-rich environment, the neutron abundance is small. This is consistent with the results shown in Fig. 15. These trends in abundance evolution are observed in shells 2–5 although the magnitude of the differences depends upon location.
4.3 Neutron absorption
Effects of neutron absorption reactions on the abundances of 7Li, 7Be, 11B and 11C are not large. Our analysis shows that in an inner region with large abundances of C (shells 1–3), the strongest neutron capture reaction is 12C(,)13C (cf. Fig. 22). The second largest reaction rate is 11C(,)11B, but it is subdominant. Therefore, only a small fraction of neutrons produced via the neutrino reactions or nuclear reactions are available for the conversion of 11C to 11B.
In the region of (shell 4), the 7Be(,)7Li reaction is the dominant neutron capture reaction, and the 12C(,)13C reaction is subdominant. The reason for that is the large 7Be abundance and the small 12C abundance. The operation of the reaction 7Be(,)7Li has been mentioned in Yoshida et al. (2006b). In the outermost region in the He-rich layer (shell 5), the reaction 3He(,)3H is the strongest neutron capture reaction. Here, only products of the C reactions participate in nucleosynthesis.
5 Contribution to Galactic chemical evolution
Table 2 shows yields of the light nuclides 7Li, 7Be, 11B and 11C for respective models at 50 s after the SN. NH, IH, no, no-, and no- () correspond to Cases 1 to 5, respectively, and no- corresponds to the case in which the neutrino reactions are switched off. Also shown are yields of 16O whose solar abundance is believed to be predominantly contributed from SNe II (e.g., Tsujimoto et al., 1995). The seventh column lists the number ratio 7Li/11B, and the eighth and ninth columns show the ratios of the overproduction factors (7Li/16O) and (11B/16O), respectively, which are evaluated after the decay of 7Be and 11C into 7Li and 11B, respectively. The ratio is given by
| (26) |
where and are the yield from SNe and the solar mass fractions, respectively, of species .
| model | 7Li/11B | (7Li/16O) | (11B/16O) | |||||
|---|---|---|---|---|---|---|---|---|
| NH | ||||||||
| IH | ||||||||
| no | ||||||||
| no- | ||||||||
| no- | ||||||||
| no- () |
It can be seen that the light nuclear yields significantly depend on the neutrino mass hierarchy and the initial nuclear abundances. In the normal mass hierarchy case, both 7Li and 11B overproduction factors are largest, and a significant contribution is expected to the Galactic chemical evolution and the solar abundance. In this case, the 7Li/11B ratio is also the highest. In the inverted mass hierarchy case, although the 7Li and 11B overproduction factors are larger than those in the no oscillation case, they are significantly smaller than in the normal hierarchy case. The 7Li/11B ratio is slightly larger than that of the no oscillation case. These enhancements of 7Li/11B by the neutrino flavor change are consistent with the previous study of Yoshida et al. (2008). However, in this calculation, the ratio in all the three cases are 30–45 % larger than the previous result (Yoshida et al., 2008).
Obviously, if neutrino reactions are nonexistent in SNe, yields of 7Li and 11B are negligibly small (see the row of no-). One may consider some exotic situation in which neutrinos energize SN explosions but they change their form or disappear before they travel to the outer region. However, that scenario induces a problem in explaining the Solar 10B/11B isotopic ratio in a Galactic chemical evolution model (see e.g., Prantzos, 2012).
Effects of the -process on heavy nuclei during the presupernova evolution is small as seen in a comparison of Cases 2 and 4 (fifth row). An increase of metallicity (no- case) leads to an enhancement of the 7Be yield from that of the no- case while not affecting other light nuclear yields much. Then, the (7Li/16O) ratio is increased by % and the 7Li/11B ratio increases by %.
Standard theories of grain formation from SN ejecta suggest that mixing of SN ejecta within layers is difficult (Deneault et al., 2003) 121212For effects of the mixing on the dust abundances, see Nozawa et al. (2003). although a convective overturn, i.e. a change of position of materials with different compositions, is possible. Therefore, it is expected that local elemental and isotopic abundances could remain in presolar grains if they originate in SN ejecta, rather than the ratio of total yields from SNe. In this case, as seen in Figs. 8 and 14, the final abundances of 7Li+7Be and 11B+11C significantly depend on location, i.e., . Therefore, assuming grain formation in the Li and B production region, we can deduce expected ranges of the 7Li/11B ratio in SN grains.
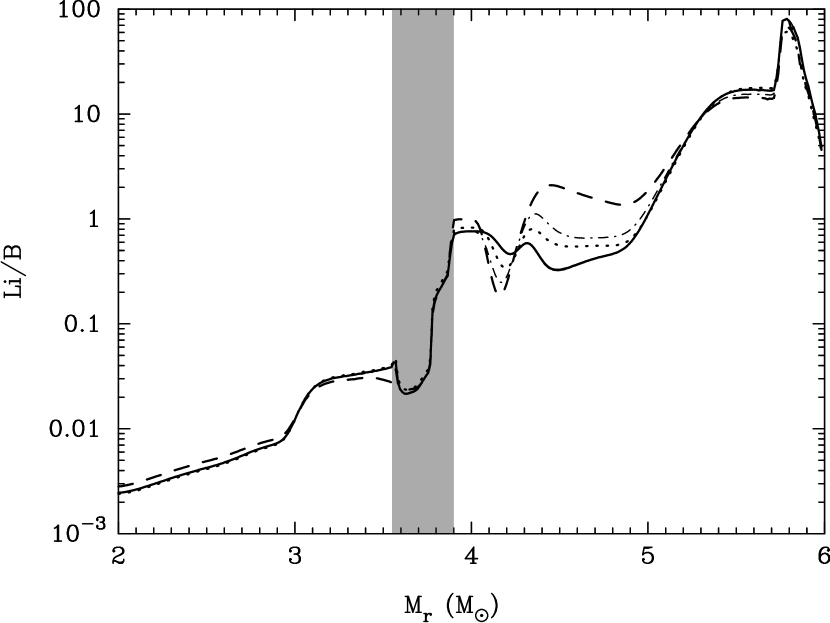
Figure 16 shows the Li/B number ratio as a function of . Thick dashed and solid lines correspond to Cases 1 and 2, respectively, while the dotted line shows the result of Case 3. Thin dot-dashed line corresponds to Case 5. The result of Case 4 is indistinguishable from that of Case 2. The Li/B ratio ranges over many orders magnitudes, i.e., Li/B to . The vertical band indicates the C-rich region. Since the Li and B production is only important in the C-rich and He-rich regions, dust grains containing Li and B from SNe can have a wide range of Li/B ratios, i.e., Li/B(0.01). If some grains include abundant C as well as Li and B, a possible site of their production is the C-rich layer of SNe. There, the ratio is Li/B(0.01)–1.
An observational test of our theoretical prediction of the SN -process nucleosynthesis is critical. Fujiya et al. (2011) reported on enhanced Li and B isotopic abundances in a number of SiC X grains from the Murchison meteorite. Such grains are presumed to arise directly from SN ejecta. Since 11B and 7Li are expected to be the main products of -process nucleosynthesis (e.g. Yoshida et al., 2005, 2008), they could be used as a tracer to find evidence for the neutrino oscillations and their associated mass hierarchy.
The possible isotopic anomaly found in their analysis (Fujiya et al., 2011; Mathews et al., 2012) is still subject to possible laboratory and/or meteoritic contamination that includes other sources of these elements such as Galactic cosmic-ray spallation processes or stellar nucleosynthesis in asymptotic giant branch stars producing light elements after the SiC X grains condensed in the SN ejecta in the early solar system (see e.g. Hayakawa et al., 2013, for the contribution of interstellar matter to meteorites). Another possible test would be the spectroscopic observation of Li and B in SN remnants. A high-dispersion spectrograph equipped on a space telescope like the Hubble Space Telescope might be used to detect 11B absorption lines at UV wavelengths (Duncan et al., 1997; Garcia Lopez et al., 1998; Primas et al., 1999; Cunha et al., 2000). It is also possible to detect 7Li in spectroscopic absorption lines using ground-based large telescopes like SUBARU, EUSO-VLT or KECK. Observational tests probing these light-mass isotopes in SN ejecta or remnants is highly desirable in order to establish this mechanism of Li and B nucleosynthesis and to study the neutrino oscillations.
The main production of 7Li and 11B occurs outside of the MSW H resonance region in core-collapse SNe. This characteristic is different from the production of heavy nuclei by the neutrino process. Therefore, 7Li and 11B abundances are unique tools to constrain the physical processes operating in SNe, such as neutrino spectra and their luminosity evolution, the matter density, and the initial nuclear abundances. In the future, it would be desirable to clarify the dependence of those yields on the initial metallicity, stellar mass, explosion energies, etc. Although nucleosynthesis results (e.g., Sukhbold et al., 2016) are available, the neutrino flavor change in SNe should be taken into account.
The ultimate goal is to understand the contribution of the neutrino process to the Galactic chemical evolution of 7Li and 11B. The dependence of the 19F yield on stellar parameters has been studied in Izutani et al. (2012). They also considered the Galactic chemical evolution based upon the SN nucleosynthesis result. Observations of the stellar F abundance are consistent with the theoretical result although observational data have a large dispersion (Kobayashi et al., 2011).
6 conclusions
We have revisited the effects of neutrino oscillations on the 7Li and 11B production in core-collapse SNe. Neutrinos emitted from the proto-NS propagate through stellar regions from the neutrino-sphere to the interstellar region. When they pass through the region with a density of g cm-3, there is a resonance in the flavor change probability of neutrinos, i.e., the H resonance. Since the neutrino freezeout temperatures are different between the electron neutrinos, antineutrinos, and other types, the resonant flavor change results in changes of the neutrino energy spectra. The neutrino spallation reaction rates are then significantly affected by the flavor change.
In this paper, we have used a new nuclear reaction network code in which neutrino cross sections for 4He and 12C spallation are corrected. Initial nuclear abundances in SNe were calculated with a model for the SN 1987A progenitor, which includes heavy -nuclei. We then analyzed the 7Li and 11B production in SN nucleosynthesis in detail. Effects of neutrino oscillations and the initial nuclear abundances are clearly observed for respective stellar layers. Especially, the effects in the important 7Li and 11B production site at are summarized as follows:
-
1.
oscillations
The neutrino oscillations in the normal hierarchy case increase the CC reaction rates for . Then, yields of proton-rich nuclides, e.g., 3He (via the He reaction) as well as 7Be and 11C (via the C reaction) are increased. Since the 7Be yield is predominantly contributed to by the reaction 3He(,)7Be after the shock heating, the enhancement of the 3He production rate also results in an enhanced final 7Be abundance. For , the 7Be nuclei are destroyed via the reaction 7Be(,)7Li followed by the 7Li(,)4He. The final abundance of 7Be is then small. For the outer region, , the temperature is not high and the neutrino flux is smaller. Therefore, the 7Be abundance is small in this region, and a peak of the 7Be yield appears inside. There are two peaks in the curve of 11C abundance versus . The inner one is at – from the C spallation reaction and the outer one is at – from the 7Be(,)11C reaction. Both peaks are much larger than those of the no oscillation case.
In the inverted hierarchy case, on the other hand, the CC reaction rate of is enhanced by the neutrino oscillations. As a result, neutrino spallation products are enriched in neutron-rich nuclei, i.e., 3H, 7Li, and 11B. The main reaction for 7Li synthesis, 3H(,)7Li, contributes to larger yields of 7Li because of an enhanced 3H abundance. In the inner region, , 7Li nuclei are produced before the shock arrival. However, the shock heating triggers 7Li destruction via the 7Li(,)4He reaction, and the final yield of 7Li is diminished.
-
2.
initial abundances
The -process during the presupernova stellar evolution changes the abundances of nuclei with . Then, the neutron abundances during the SN are affected by the -process since the abundances of neutron poisons are different. However, this effect of the seed abundances on the production of 7Li and 11B is found to be unimportant for the metallicity of the Large Magellanic Cloud. When the metallicity is increased, the total abundance of nuclei that can capture neutrons is larger. Then, the neutron abundance during SN nucleosynthesis becomes smaller. Therefore, the dependence of yields of 7Li and 11B on the initial stellar metallicity must be considered in future studies of Galactic chemical evolution. The initial metallicity does not affect the 7Li production much, while they do affect the 7Be production. When a higher metallicity, e.g., is assumed, the neutron abundance is smaller than in our standard case and the 7Be production rate is increased. The final abundance is then significantly higher than that of the standard case in the region with –.
The 11C production is significantly affected by the initial metallicity, while 11B production is not sensitive. In the 11C production layer of –, the 11C yield is enhanced by increasing the metallicity. A smaller neutron abundance leads to a smaller rate of 3He(,)3H. Then, the 3He abundance is larger and the 7Be production rate is also larger via the 3He(,)7Be reaction. As a result, a larger 7Be abundance is obtained. Therefore, the production of 11C via 7Be(,)11C is more effective.
Appendix A partial time derivative of reaction rates
The rate equation has the form of
| (A1) |
where is the vector of nuclear mole fractions and is a function describing the abundance evolution. When this is solved with a semi-implicit extrapolation method (Press et al., 1992), we need to evaluate . The rate of any reaction is given by
| (A2) |
where and are indexes for the nuclide and reaction, respectively. The plus and minus signs correspond to the production and destruction terms, respectively. is the Avogadro number, is the baryonic density, is the number of nuclear species involved in the reaction, is the number of nuclide reacting in one reaction event, and is the reaction rate in units of [(cm3) s-1]. The total reaction rate of species is then given by summing this term over all reactions :
| (A3) |
The time derivative of the abundance change rate is given by
| (A4) |
where the derivatives , , and are given as trajectories from the hydrodynamics calculation.
A.1 Neutrino reactions
In the region above the mass cut of a SN, the average kinetic energy of nuclides is MeV. On the other hand, the average kinetic energy of neutrinos propagating from the surface of the NS is MeV. Since velocities of the nuclides are much smaller than light speed, the kinetic energies of neutrinos in the rest frame of nuclides are unchanged from those in the fluid rest frame, i.e., . Therefore, the rates for reactions of neutrinos and nuclei do not depend on the ambient temperature. Thus, it follows that . In addition, in the SN nucleosynthesis, only two-body neutrino reactions, , are important. Then, the sum of the numbers of reacting nuclides is . As a result, we obtain
| (A5) | |||||
| (A6) |
The time derivative is then given by this equation with neutrino reaction rates (Equation (LABEL:nu3)).
In the present study, we adopted the approximate probability of neutrino flavor change evaluated at . Then, the probability is independent of , and dependent only on . In addition, the neutrino energy spectra are assumed to be constant, and the luminosity evolution is given by Equation (23). In this case, the time derivative for a reaction of neutrino flavor has an analytic form:
| (A7) | |||||
| (A8) |
We note that for the neutral current reactions, the term is zero.
A.2 Nuclear reactions
Except for reactions triggered by neutrinos, the term does not explicitly depend on and . Therefore, Equation (A4) reduces to
| (A9) |
A.3 Nuclear reaction rates of JINA REACLIB
For example, we show the specific form of for the JINA REACLIB data adopted in this paper.
A.3.1 Forward rates
The forward reaction rates are expressed in the form
| (A10) |
where (, …, 6) are fitted parameters, and , and (for , …, 5) are fixed power law indexes.
The derivative of the rates with respect to are given by
| (A11) |
The specific equation for the JINA REACLIB rates is then given by
| (A12) |
A.3.2 Reverse rates
The reverse reaction rates are given by
| (A13) |
where is given by the function defined in Eq. (A10), and is a multiplication factor for the reverse rates. The factor is given for the reaction :
| (A14) |
where is the nuclear partition function of . The derivative of this factor is given by
| (A15) |
The temperature derivative of the reverse reaction rates of the JINA REACLIB database is then given by
| (A16) |
Appendix B effects of neutrino flavor change on abundance change rates
Table 3 shows the 13 nuclear reactions relevant to 7Li, 7Be, 11B and 11C synthesis in SNe. The following reactions occur via He spallation: 1) NC reactions 4He(,)3H, 4He(,)3He, 4He(,)2H, 4He(,)1H; 2) CC reactions 4He(,)3He, 4He(,2)2H, 4He(,)3H, and 4He(,2)2H. Also 12C spallation reactions involve the production of 3H, 3He, 7Li, 7Be, 11B, 11C, and 11Be (which are produced only via CC reactions) (Yoshida et al., 2008).
| reaction | remark |
|---|---|
| 3He(,)3H | conversion 3HeH |
| 3H(,)7Li | 7Li production |
| 7Li(,)4He | 7Li destruction |
| 7Li(,)11B | 7Li destruction & 11B production |
| 3He(,)7Be | 7Be production |
| 7Be(,)11C | 7Be destruction & 11C production |
| 7Be(,)7Li | conversion 7BeLi |
| 11B(,2)4He | 11B destruction |
| 11B(,)14C | 11B destruction |
| 11B(,)14N | 11B destruction |
| 11C(,)11B | conversion 11CB |
| 12C(,)13N | capture |
| 12C(,)13C | capture |
B.1 Trends of He reactions
Because of the MSW resonance effect, CC reaction rates are enhanced in the normal and inverted hierarchy cases. In the normal hierarchy case, the rate is enhanced so that 3He and are produced in a greater abundance. In the inverted hierarchy case, the rate is enhanced and the production rates of 3H and are larger. In this case there is a tendency for 7Li and 11B to be produced via the 3H(,)7Li(,)11B reaction sequence.
B.2 Trends of C reactions
B.2.1 7Li
The cross section for the CC 7Li production via the reaction 12C+ is much larger than that of 12C+ (Yoshida et al., 2008). Therefore, the neutrino oscillations increase the 7Li yield in the inverted hierarchy case (shells 2, 3, and 5; Sec. 3.2). The 7Li production cross section of the NC 12C+ reaction is close to that of the CC 12C+ reaction. Therefore, the change in the CC rate of 12C+ does not much affect the 7Li yield.
B.2.2 7Be
The effective energy threshold for the CC 7Be production is lower for the reactions than for the reactions (cf. Tables 4 and 5 in Yoshida et al., 2008). Therefore, when the flux of energetic is increased by the flavor change, the 7Be production is more effective. In the normal hierarchy case, a complete transition occurs (See Fig. 1 of Yoshida et al., 2006b). Therefore, the 7Be yield is larger. In the inverted hierarchy case, the transition is incomplete (See Fig. 2 of Yoshida et al., 2006b). Thus, the 7Be yield is not changed much from the no oscillation case. The 7Be production cross section of the NC 12C+ reaction is smaller than that of the CC 12C+ reaction. Therefore, the effect of flavor change is relatively large.
B.2.3 11B and 11C
The MSW effect changes the spectrum (for shells 2–5). The 11B nuclei are produced by the CC 12C+ reaction only, while 11C nuclei are produced by the CC 12C+ reaction only. Then, the 11C abundance is affected. The CC cross section is somewhat larger than the NC cross section. An enhancement of the 11C abundance is then apparent.
B.3 Analysis
Figures 17–21 show the rates of the abundance change versus time for shells 1–5, respectively. Solid, dotted, and dashed lines correspond to the normal hierarchy, inverted hierarchy, and no neutrino oscillation cases, respectively. Long dashed lines (not always visible in these figures) correspond to results of the no neutrino flux case. Respective panels show values for (a) nuclei in the initial states of the two-body nuclear reactions; (b) 4He via the He reactions; (c) products of C reactions.
B.3.1 Shell 1
2-body nuclear reactions:
Before the shock passage at s, the 12C(,)13N and 11B(,2)4He reactions are operative. After the shock arrives, the 11B(,)14N and 11B(,)14C reactions are also activated. It is found that the 12C(,)13N reaction is much weaker in the no neutrino flux case except during the shock passage epoch. This reaction is driven by protons generated from -spallation reactions.
+4He
Although the 4He spallation proceeds, its effect is very small because of the small 4He abundance (Fig. 9).
+12C
All products (11B, 11C, 7Li, 7Be, …) are produced. At the late time of s, 11C and 7Be production is more efficient in the normal case, while the 11Be production is more efficient in the inverted case. This is because this shell passes through the MSW resonance density at about that time.
B.3.2 Shell 2
2-body nuclear reactions:
Similar to the shell 1, before the shock passage, the 11B(,2)4He and 12C(,)13N reactions are operative. After the shock arrival, the 12C(,)13N and 11B(,)14N reactions are strong. The 12C(,)13N reaction is much weaker in the no neutrino flux case except during the shock passage epoch. This reaction is the most efficient in the normal hierarchy case. This is related to a larger proton production by after the neutrino flavor change.
+4He
The 4He spallation is unimportant in this shell also.
+12C
In the normal hierarchy case, the yields of 11C and 7Be are enhanced via the change of the spectrum. In the inverted hierarchy case, the yields of 11B and 7Li are slightly enhanced via the increased reaction rates. Although the 11Be yield is also enhanced, it is much smaller than those of 11B and 11C.
B.3.3 Shell 3
2-body nuclear reactions:
Before the shock passage at s, the 7Li production reaction 3H(,)7Li and the charge exchange reaction 3He(,)3H are strong. During the shock heating, the 7Li(,)11B, 12C(,)13N, 3H(,)7Li, 3He(,)7Be, 11B(,)14N, and 12C(,)13C reactions effectively operate. In the normal hierarchy, the rates of the 3He(,)7Be and 12C(,)13N reactions are the largest due to the enhanced proton richness in the neutrino spallation products. In the inverted hierarchy, the rates of the 3H(,)7Li and 7Li(,)11B reactions are enhanced due to the neutron richness.
+4He
The NC reactions are effective independently of the neutrino oscillations. Rates of the CC reactions 4He(,)3He and 4He(,2)2H are extremely spectrum-dependent. The decreasing order of rate is the normal, inverted hierarchy, and no oscillation cases. On the other hand, rates for 4He(,)3H and 4He(,2)2H are enhanced only in the inverted hierarchy case.
+12C
The trends of reaction rates are the same as those of shell 2.
B.3.4 Shell 4
2-body nuclear reactions:
Before the shock passage, rates of 3H(,)7Li and 3He(,)3H are large. During the shock heating, the 11B(,)14N, 7Li(,)11B, 7Be(,)7Li, 11B(,2)4He, 11B(,)14C, 7Be(,)11C, 12C(,)13C, 12C(,)13N, 3H(,)7Li, and 3He(,)7Be reactions become effective. In the normal hierarchy, the rates of 12C(,)13N and 3He(,)7Be are largest, while in the inverted hierarchy, the rates of 11B(,)14N, 3H(,)7Li, and 12C(,)13C are enhanced for the same reason explained for shell 3.
+4He
Reaction rates behave similarly to those of shell 3.
+12C
Reaction rates behave similarly to those of shell 2.
B.3.5 Shell 5
2-body nuclear reactions:
The shock does not reach to this shell. Before the shock passage, only the rates of the 3H(,)7Li, 3He(,)7Be and 3He(,)3H reactions are significant. The rate of 3H(,)7Li is enhanced in the inverted hierarchy because of the enhanced 3H yield or neutron richness. The rate of 3He(,)3H is enhanced in the normal and inverted hierarchy cases because of the enhanced 3He yields.
+4He
The trends for the CC rates of 4He(,)3He and 4He(,2)2H are similar to those of shell 3. However, in this shell, the differences of the rates between the normal and inverted hierarchy cases are small. We can interpret that this is because the flavor change at the low MSW resonance is complete, and the spectrum has changed in the inverted hierarchy case also (cf. Fig. 2 (left panel) in Yoshida et al., 2006b). Enhancements of the rate for the 4He(,)3H and 4He(,2)2H reactions in the inverted hierarchy case are, on the other hand, larger than those in the normal hierarchy case.
+12C
Reaction rates are too small to affect light element yields.
Appendix C effects of initial abundances on abundance change rates
In the inner region (shell 1), there is no difference in production rates of light nuclides, and obtained rates of Cases 4 and 5 are the same as those of Case 2 (Fig. 17). No effects of different -nuclear abundances are expected to be seen since light nuclides including 16O, 20Ne, 24,25Mg, and 28Si as the main components are predominant in this inner region of the presupernova stars. Their compositions do not depend on the metallicity or the -nuclear abundances, and determine the neutron abundances.
Figure 22 shows the rates of abundance changes similar to Fig. 20 for shell 4. Solid and dashed lines correspond to results for Cases 2 and 5, respectively. The result for Case 4 is almost the same as that for Case 4 in the whole stellar region.
Immediately after the arrival of the neutrinos at s, all neutron capture reaction rates shown in Fig. 22 are smaller in Case 5. In Case 5, the abundance of neutron poisons including heavy -nuclei are larger, and the neuron abundance is kept lower.
The rate of the 3He(,)7Be reaction is larger in Case 5 because of a difference in the 3He abundance (Fig. 15), that is controlled by the reaction 3He(,)3H.
All proton capture reactions are faster in Case 2. This reflects differences in the proton abundances. Once the differences in the 7Be abundance becomes significant, the 7Be(,)7Li rate follows that of the 3He(,)7Be reaction as well as the neutron abundance.
After the shock passage, all neutron capture reaction rates are larger in Case 2 reflecting the different neutron abundances. All proton capture reaction rates are larger in Case 2 because of the larger proton abundances.
We note that the 7Li nuclei are violently burned during the shock passage and their abundance decreases significantly. The rate of 7Be(,)7Li differs within % between the models. Since this rate is marginally effective and near the freeze-out, this small difference results in a significant difference in the survival probability of 7Be after the shock. Once 7Be nuclei are converted to 7Li, they are quickly burned. The more effective conversion in Case 5 leads to a small final 7Be abundance.
Since the 4He abundance does not change between the three models, the differences in the -capture reaction rates reflect the number abundances of target nuclei.
In shell 2–4, trends of reaction rates are similar although the sizes of differences depend on the location.
In the outermost region of the He-layer (shell 5), the main nuclear components are 4He that has been produced from the initial hydrogen and 14N from the initial CNO elements. Therefore, this region does not experience an effective -process before the SN. Then, the heavy nuclear abundances are almost the same in Cases 2 and 4. The neutron abundances in these two models are the same, while those in Case 5 are smaller because of the larger abundance of neutron absorbers.
The only significant difference is in the rate of 3He(,)3H, which is proportional to the neutron abundance. This rate is the smallest in Case 5.
References
- Aoki et al. (2009) Aoki, W., Barklem, P. S., Beers, T. C., et al. 2009, ApJ, 698, 1803
- Austin et al. (2011) Austin, S. M., Heger, A., & Tur, C. 2011, Physical Review Letters, 106, 152501
- Austin et al. (2014) Austin, S. M., West, C., & Heger, A. 2014, Physical Review Letters, 112, 111101
- Bader & Deuflhard (1983) Bader, G., & Deuflhard, P. 1983, Numerische Mathematik, 41, 373
- Balantekin & Yüksel (2005) Balantekin, A. B., & Yüksel, H. 2005, New Journal of Physics, 7, 51
- Banerjee et al. (2016a) Banerjee, P., Qian, Y.-Z., Heger, A., & Haxton, W. 2016, European Physical Journal Web of Conferences, 109, 06001
- Banerjee et al. (2016b) Banerjee, P., Qian, Y.-Z., Heger, A., & Haxton, W. C. 2016, Nature Communications, 7, 13639
- Bird et al. (2008) Bird, C., Koopmans, K., & Pospelov, M. 2008, Phys. Rev. D, 78, 083010
- Cameron (1955) Cameron, A. G. W. 1955, ApJ, 121, 144
- Cameron & Fowler (1971) Cameron, A. G. W., & Fowler, W. A. 1971, ApJ, 164, 111
- Cheoun et al. (2012) Cheoun, M.-K., Ha, E., Hayakawa, T., et al. 2012, Phys. Rev. C, 85, 065807
- Cunha et al. (2000) Cunha, K., Smith, V. V., Boesgaard, A. M., & Lambert, D. L. 2000, ApJ, 530, 939
- Cyburt et al. (2010) Cyburt, R. H., Amthor, A. M., Ferguson, R., et al. 2010, ApJS, 189, 240
- Davis & Duff (1995) Davis, T. A., & Duff, I. S. 1995, HSL. A collection of Fortran codes for large scale scientific computation.
- Deneault et al. (2003) Deneault, E. A.-N., Clayton, D. D., & Heger, A. 2003, ApJ, 594, 312
- Domogatskii et al. (1978) Domogatskii, G. V., Eramzhian, R. A., & Nadezhin, D. K. 1978, Ap&SS, 58, 273
- Duncan et al. (1997) Duncan, D. K., Primas, F., Rebull, L. M., et al. 1997, ApJ, 488, 338
- Fujiya et al. (2011) Fujiya, W., Hoppe, P., & Ott, U. 2011, ApJ, 730, L7
- Garcia Lopez et al. (1998) Garcia Lopez, R. J., Lambert, D. L., Edvardsson, B., et al. 1998, ApJ, 500, 241
- Hayakawa et al. (2018) Hayakawa, T., Ko, H., Cheoun, M. K., Kusakabe, M., Kajino, T., Usang, M. D., Chiba, S., Nakamura, K., Tolstov, A., Nomoto, K., Hashimoto, M.-a., Ono, M., Mathews, G. J. 2018, Phys. Rev. Lett., 121, 102701.
- Hayakawa et al. (2013) Hayakawa, T., Nakamura, K., Kajino, T., et al. 2013, ApJ, 779, L9
- Heger et al. (2005) Heger, A., Kolbe, E., Haxton, W. C., et al. 2005, Physics Letters B, 606, 258
- Hernanz et al. (1996) Hernanz, M., Jose, J., Coc, A., & Isern, J. 1996, ApJ, 465, L27
- Izutani et al. (2012) Izutani, N., Umeda, H., & Yoshida, T. 2012, Death of Massive Stars: Supernovae and Gamma-Ray Bursts, 279, 339
- Kawasaki & Kusakabe (2011) Kawasaki, M., & Kusakabe, M. 2011, Phys. Rev. D, 83, 055011
- Kikuchi et al. (2015) Kikuchi, Y., Hashimoto, M.-a., Ono, M., & Fukuda, R. 2015, Progress of Theoretical and Experimental Physics, 2015, 063E01
- Ko et al. (2019a) Ko, H., Cheoun, M.-K., Ha, E., et al. 2019a, arXiv:1903.02086
- Ko et al. (2019b) Ko, H., Cheoun, M.-K., et al., 2019b, in preparation.
- Kobayashi et al. (2011) Kobayashi, C., Izutani, N., Karakas, A. I., et al. 2011, ApJ, 739, L57
- Koning et al. (2008) Koning, A. J., Hilaire, S., & Duijvestijn, M. C., Proceedings of the International Conference on Nuclear Data for Science and Technology, April 22-27, 2007, Nice, France, editors O. Bersillon, F. Gunsing, E. Bauge, R. Jacqmin, and S. Leray, EDP Sciences, 2008, p. 211-214.
- Kuo & Pantaleone (1987) Kuo, T. K., & Pantaleone, J. 1987, Physics Letters B, 198, 406
- Kusakabe et al. (2009) Kusakabe, M., Kajino, T., Yoshida, T., & Mathews, G. J. 2009, Phys. Rev. D, 80, 103501
- Kusakabe et al. (2014) Kusakabe, M., Kim, K. S., Cheoun, M.-K., et al. 2014, ApJS, 214, 5
- Lodders et al. (2009) Lodders, K., Palme, H., & Gail, H.-P. 2009, Landolt Börnstein, 712
- Mathews et al. (2012) Mathews, G. J., Kajino, T., Aoki, W., Fujiya, W., & Pitts, J. B. 2012, Phys. Rev. D, 85, 105023
- Meneguzzi et al. (1971) Meneguzzi, M., Audouze, J., & Reeves, H. 1971, A&A, 15, 337
- Nadyozhin & Panov (2014) Nadyozhin, D. K., & Panov, I. V. 2014, MNRAS, 441, 733
- Nozawa et al. (2003) Nozawa, T., Kozasa, T., Umeda, H., Maeda, K., & Nomoto, K. 2003, ApJ, 598, 785
- Olive & Particle Data Group (2014) Olive, K. A., & Particle Data Group 2014, Chinese Physics C, 38, 090001
- Ott et al. (2014) Ott, C. Morozova, V., & Piro, A. L. 2014
- Pagel (1997) Pagel, B. E. J. 1997, Nucleosynthesis and Chemical Evolution of Galaxies, by Bernard E. J. Pagel, pp. 392. ISBN 0521550610. Cambridge, UK: Cambridge University Press, October 1997., 392
- Prantzos (2012) Prantzos, N. 2012, A&A, 542, A67
- Press et al. (1992) Press, W. H., Teukolsky, S. A., Vetterling, W. T., & Flannery, B. P. 1992, Numerical recipes in FORTRAN. The art of scientific computing (2nd ed.; Cambridge: Cambridge Univ. Press)
- Primas et al. (1999) Primas, F., Duncan, D. K., Peterson, R. C., & Thorburn, J. A. 1999, A&A, 343, 545
- Reeves (1970) Reeves, H. 1970, Nature, 226, 727
- Ryan et al. (2000) Ryan, S. G., Beers, T. C., Olive, K. A., Fields, B. D., & Norris, J. E. 2000, ApJ, 530, L57
- Sackmann & Boothroyd (1999) Sackmann, I.-J., & Boothroyd, A. I. 1999, ApJ, 510, 217
- Sbordone et al. (2010) Sbordone, L., Bonifacio, P., Caffau, E., et al. 2010, A&A, 522, A26
- Shigeyama & Nomoto (1990) Shigeyama, T., & Nomoto, K. 1990, ApJ, 360, 242
- Sieverding et al. (2015) Sieverding, A., Huther, L., Langanke, K., Martínez-Pinedo, G., & Heger, A. 2015, arXiv:1505.01082
- Sieverding et al. (2016) Sieverding, A., Huther, L., Martínez-Pinedo, G., Langanke, K., & Heger, A. 2016, European Physical Journal Web of Conferences, 109, 06004
- Sieverding et al. (2018a) Sieverding, A., Huther, L., Martínez-Pinedo, G., Langanke, K., & Heger, A. 2018, Journal of Physics Conference Series, 940, 012054
- Sieverding et al. (2018b) Sieverding, A., Martínez-Pinedo, G., Huther, L., Langanke, K., & Heger, A. 2018, ApJ, 865, 143
- Sieverding et al. (2018c) Sieverding, A., Martínez Pinedo, G., Langanke, K., Harris, J. A., & Hix, W. R. 2018, European Physical Journal Web of Conferences, 165, 01045
- Spite & Spite (1982) Spite, F., & Spite, M. 1982, A&A, 115, 357
- Sukhbold et al. (2016) Sukhbold, T., Ertl, T., Woosley, S. E., Brown, J. M., & Janka, H.-T. 2016, ApJ, 821, 38
- Timmes (1999) Timmes, F. X. 1999, ApJS, 124, 241
- Tsujimoto et al. (1995) Tsujimoto, T., Nomoto, K., Yoshii, Y., et al. 1995, MNRAS, 277, 945
- Ventura & D’Antona (2010) Ventura, P., & D’Antona, F. 2010, MNRAS, 402, L72
- Woosley et al. (1990) Woosley, S. E., Hartmann, D. H., Hoffman, R. D., & Haxton, W. C. 1990, ApJ, 356, 272
- Wu et al. (2015) Wu, M.-R., Qian, Y.-Z., Martínez-Pinedo, G., Fischer, T., & Huther, L. 2015, Phys. Rev. D, 91, 065016
- Yokomakura et al. (2002) Yokomakura, H., Kimura, K., & Takamura, A. 2002, Physics Letters B, 544, 286
- Yoshida et al. (2005) Yoshida, T., Kajino, T., & Hartmann, D. H. 2005, Physical Review Letters, 94, 231101
- Yoshida et al. (2006a) Yoshida, T., Kajino, T., Yokomakura, H., et al. 2006a, Physical Review Letters, 96, 091101
- Yoshida et al. (2006b) Yoshida, T., Kajino, T., Yokomakura, H., et al. 2006b, ApJ, 649, 319
- Yoshida et al. (2008) Yoshida, T., Suzuki, T., Chiba, S., et al. 2008, ApJ, 686, 448
- Yoshida et al. (2004) Yoshida, T., Terasawa, M., Kajino, T., & Sumiyoshi, K. 2004, ApJ, 600, 204