First long-term activity study of AU Microscopii: a possible chromospheric cycle.
Abstract
M stars are ideal targets to search for Earth-like planets. However, they usually have high levels of magnetic activity, which could affect their habitability and make difficult the detection of exoplanets orbiting around them. Unfortunately, long-term variability of dM stars has not been extensively studied, due to their low intrinsic brightness. For this reason, in 1999 we started the HK project, which systematically observes the spectra of a large number of stars, in particular dM stars, at the Complejo Astronómico El Leoncito (CASLEO). In this work, we study the long-term activity of the young active dM1 star AU Microscopii. We analyze the Mount Wilson index derived from CASLEO spectra obtained between 2004 and 2016, which we complement with the -index derived from HARPS, FEROS and UVES public spectra. We also analyze the simultaneous photometric counterpart provided by the ASAS public database for this star between 2000 and 2009, and our own photometry. In both totally independent time series, we detect a possible activity cycle of period 5 years. We also derived a precise rotation period for this star days, consistent with the literature. This activity cycle reflects that an dynamo could be operating in this star.
keywords:
stars: activity, chromosphere, low-mass, rotation – stars: individual: AU Microscopii.1 Introduction
M stars, which represent 70% of the stars in our Galaxy, have become relevant targets for different exo-planetary surveys during the last decade (e.g. Mayor et al. 2009; Zechmeister & Kürster 2009; Amado et al. 2013; France et al. 2016). These projects were mainly motivated by the fact that, due to their low mass, M stars are favorable targets to detect Earth-like planets around them. Furthermore, such planets seem to be frequent in the solar neighborhood. By exploring the Kepler transiting exoplanets database (Borucki et al., 2010), Dressing & Charbonneau (2015) estimated a high occurrence rate of Earth and Super Earth-like planets around M stars (2.50.2 planets per M star with radius between 1 and 4 Earth radii and period less than 200 days). Similar results were also obtained from Radial Velocities (RV) surveys (Bonfils et al., 2013).
Another motivation to study red dwarfs is that several active M stars are remarkably variable due to flare events (e.g. Moffett 1974; Hilton et al. 2011; Kowalski et al. 2013). In these stars, a flare represents an appreciable variation in luminosity with higher contrast than in solar-type stars. The released energy during a flare event could be eventually higher than 1034 erg (Hawley & Pettersen, 1991; Mauas & Falchi, 1996). A well-known tendency is that energetic flares are less frequent than small flares (e.g. Lacy et al. 1976; Hilton et al. 2011). The Kepler mission, designed to obtain high-precision and long-baseline light curves of numerous stars, brought further statistics to this field. Hawley et al. (2014) found a strong correlation between flare energy, amplitude, duration, and decay time, with only a weak dependence on rise time. Furthermore, they found that flares from inactive stars, though relatively rare, can be very energetic. Therefore, a terrestrial planet around an M star could be continuously affected by small short flares and eventually by high-energy long flares constraining its habitability (Buccino et al., 2007; Vida et al., 2017). On the other hand, small flares from M dwarfs could play an important role in the atmospheric chemistry of orbiting planets (e.g. Miguel et al. 2015).
Recently, several authors (e.g. Shibata et al. 2013; Kitchatinov & Olemskoy 2016; Chang et al. 2017; Yang et al. 2017) have explored the role of flare activity as a stellar activity indicator and thus its connection with the stellar dynamo, responsible for the generation and amplification of stellar magnetic fields. The dynamo is thought to be driven by differential rotation (-effect) and turbulent convection (-effect) in the stellar interior (Parker, 1955, 1963; Steenbeck & Krause, 1969). Several authors suggest that the tachocline - a narrow layer between the radiative core, which rotates rigidly, and the convection zone - is substantial in the solar dynamo to strengthen the magnetic field and to avoid magnetic field dissipation (e.g. Spiegel & Zahn 1992).
In particular, it is believed that an -dynamo could be operating in the Sun and other late-F to mid-M stars (Durney & Robinson, 1982) and this model could successfully reproduce the global magnetic activity in solar-type stars (e.g. Sraibman et al. 2017). On the other hand, M dwarf stars with masses lower than 0.35M⊙ (i.e. later than spectral type M4) are believed to be fully convective (Chabrier & Baraffe, 1997). Therefore, their dynamo mechanism is expected to be different from a solar-type dynamo, as they do not have a tachocline (Chabrier & Küker 2006; Browning 2008; Reiners & Basri 2010). However, Wright & Drake (2016) studied the X-ray activity-rotation relationship, which is a well-established proxy for the behaviour of the magnetic dynamo, for a set of purely convective low-rotators stars. They observed that the X-ray emission from these stars correlates with their rotation periods in the same way as in Sun-like stars. One of the conclusions of that work is that the tachocline might not be a critical ingredient in the solar dynamo. Nevertheless, from spectroscopic and spectropolarimetric observations, several authors infer that the magnetic topologies could change at the full convection boundary (Donati et al., 2008; Morin et al., 2008; Reiners et al., 2009). Therefore, M stars are also interesting targets for the dynamo theory, as they bring the opportunity to explore if a solar-type dynamo could still operate beyond the convective threshold and also explore the magnetic topologies resulting from dynamo models.
Although M dwarfs have been widely studied for their flare activity during decades, their long-term activity is rather unexplored. For this reason, in 1999 we started the HK Project at the Complejo Astronómico El Leoncito (CASLEO), mainly dedicated to study the long-term chromospheric activity in bright partially and fully convective M stars. One of the main objectives of this project is to explore the stellar dynamo beyond the convective limit. From our data, we detected evidences of cyclic chromospheric activity in the early-M stars GJ 229 A and GJ 752 A (Buccino et al., 2011), in three partially convective stars near the convective threshold; the binary system GJ 375 (Díaz et al., 2007) and GJ 388-AD Leo (Buccino et al., 2014) and the fully-convective active star Proxima Centauri (Cincunegui et al., 2007a). The exoplanetary survey High Accuracy Radial velocity Planet Searcher (HARPS) expanded the detection of activity cycles in low-mass stars (e.g. Gomes da Silva et al. 2012; Díaz et al. 2016) in the southern neighborhood. By using spectroscopic and photometric observations, other programs also contributed to the detection of magnetic cycles in dM stars (Robertson et al., 2013; Suárez Mascareño et al., 2016; Wargelin et al., 2017). Furthermore, theoretical and numerical studies also reproduce magnetic cycles in M stars (eg. Kitchatinov et al. 2014; Yadav et al. 2016; Küker et al. 2018). However, the statistics is still low in comparison to solar-type stars (Baliunas et al., 1995; Hall et al., 2007; Lovis et al., 2011; Egeland et al., 2017; Flores et al., 2017). Therefore, the detection of new accurate activity cycles for low-mass stars could bring valuable observational evidence to explore the dynamo theory in this spectral class.
One of the targets extensively observed during the HK Project is the M1Ve star AU Microscopii (GJ 803). AU Mic is a member of the Pictoris association, as inferred from space and Galactic velocity components, Lithium abundance and rotation period (Messina et al., 2017). The association has a quoted age of 253 Myr, which was recently derived by Messina et al. (2016) with the lithium depletion boundary (LDB) method, and found to be in agreement with respect to the estimates from earlier works (e.g. Mamajek & Bell 2014; Bell et al. 2015). It is a fast-rotator star with a 4.847 day-period (Hebb et al., 2007) and high-energy flares (Cully et al., 1993). AU Mic is surrounded by an edge-on circumstellar debris disk that extends from 50 AU to 210 AU (Kalas et al., 2004; Liu, 2004; Krist et al., 2005).
Since 2004, we have been continuously observing this star as part of the ongoing HK project. This data-set allows us to have a unique long time-series of Mount Wilson indexes, which is the most extended activity indicator used to detect stellar activity cycles (Baliunas et al., 1995; Metcalfe et al., 2013). The main purpose of the present work is to study for the first time the long-term chromospheric activity of AU Mic. In particular, in Section 2 we present an overview of our spectroscopic observations, which are complemented by public spectroscopic data obtained form the European Southern Observatory (ESO) as well as from public photometry. We also obtained our own photometry with the Magnetic Activity and Transiting Exoplanets (MATE) telescope to acquire a precise rotation period for AU Mic. In Section 3 we describe our results, and finally we outline our discussion in Section 4.
2 Observations
The HK Project is mainly dedicated to systematically obtain mid-resolution echelle spectra () of a set of 150 dF5 to dM5.5 stars. The observations are obtained with the REOSC111http://www.casleo.gov.ar/instrumental/js-reosc.php spectrograph, which is mounted on the 2.15 m Jorge Sahade telescope at the Complejo Astronómico El Leoncito Observatory (CASLEO) in the Argentinian Andes. These echelle spectra were optimally extracted and flux calibrated using IRAF222The Image Reduction and Analysis Facility (IRAF) is distributed by the Association of Universities for Research in Astronomy (AURA), Inc., under contract to the National Science Foundation routines (see Cincunegui & Mauas 2004, for details). At present, our database contains near 6000 mid-resolution spectra covering a wavelength range between 3800 to 6900 Å.
| Label | xJD | Label | xJD | ||
|---|---|---|---|---|---|
| 0904 | 3275 | 1009 | 5107 | ||
| 0605 | 3543 | 0610 | 5357 | ||
| 0805 | 3599 | 0910 | 5456 | ||
| 1105 | 3698 | 0611 | 5730 | ||
| 0906 | 3990 | 0911 | 5820 | ||
| 0607 | 4281 | 0612 | 6089 | ||
| 0907 | 4369 | 0912 | 6171 | ||
| 0608 | 4638 | 0614 | 6833 | ||
| 0908 | 4732 | 0914 | 6905 | ||
| 0609 | 4990 | 0816 | 7614 |
In Table 1 we show the observation logs of AU Mic from CASLEO. The first and third column shows the date (month and year) of the observation and the second column lists , where JD is the Julian date at the beginning of the observation. There is a total of 20 individual observations distributed over twelve years between 2004 and 2016. Specific details of the observations are described in Cincunegui & Mauas (2004).
We complement our data with public high-resolution spectra () obtained with the HARPS spectrograph attached to the 3.6 m ESO telescope. These observations, taken during two time intervals, and , correspond to the ESO programs 072.C-0488(E), 075.C-0202(A) and 192.C-0224(A,B,C,H). These spectra have been automatically processed by the HARPS pipeline333http://www.eso.org/sci/facilities/lasilla/instruments/harps/.
In addition, we also included the Mount Wilson indexes obtained with the FEROS spectrograph on the 2.2 m ESO telescope and the UVES spectrograph mounted at the Unit Telescope 2 (UT2) of the Very Large Telescope (VLT). The FEROS high-resolution spectra () were obtained during the programs 072.A-9006(A), 075.A-9010(A), 178.D-0361(D) and 077.D-0247(A), already processed by the FEROS pipeline444http://www.eso.org/sci/facilities/lasilla/instruments/feros/. We also incorporated the UVES high-resolution spectra () of the programs 088.C-0506(A), 082.C-0218(A) and 075.C-0321(A) all reduced with the UVES procedure555http://www.eso.org/sci/facilities/paranal/instruments/uves/.
To perform a long-term analysis with an independent database, we also employed photometric observations provided by the All Sky Automated Survey (ASAS, Pojmanski 2002). AU Mic was extensively observed between 2000 and 2009 by the ASAS-3 program. Similarly to our previous works (Díaz et al., 2007; Buccino et al., 2011, 2014), we choose the mean magnitude of each observing season as an activity proxy. We retained only the best quality data, and we discarded all observations that were not qualified as either A or B in the ASAS database.
Understanding the relationship between rotation and activity is important in the study and interpretation of stellar dynamos. In order to study the rotation and flare activity in AU Mic, we carried out a photometric study of AU Mic during 2017, using a MEADE Ritchey-Chretien 16" telescope installed in the Carlos U. Cesco Height Station at the Observatorio Felix Aguilar (OAFA) in the Argentinian Andes in San Juan. This telescope, called MATE (Magnetic Activity and Transiting Exoplanets), is currently equipped with an SBIG STL11000M camera and Johnson BVRI filters. The effective CCD area is of 4008 2672 9m pixels (Schwartz et al., 2013). The CCD scale is 0.47 arcsec per pixel and, thus, the resulting Field of View is 31 arcmin 21 arcmin.
Since AU Mic is a bright star (), it is hard to find suitable comparison stars in the Field of View (FoV). In this work, thanks to the wide field of the camera installed in MATE, we were able to simultaneously observe AU Mic and the A9V star HD 197673 of similar brightness (), centering the field at RA=20:45:44 DEC=-31:35:40 (J2000). We estimated the formal error for each observation as the sum in quadrature of the errors of the fluxes of the target and the reference star. After discarding saturated images and those with low signal-to-noise, we obtained 1902 images between February and November 2017, over non- consecutive nights to have a near uniform sampling throughout the expected rotation phase. During each observing night, we obtained science images every five minutes.
We also obtained 5 to 8 sky flats at the sunset and 20 bias every night. We did not need to correct images by subtracting darks as their contribution was negligible after bias subtraction. We perform aperture photometry with the package killastro developed by our group. This package is based on the IRAF tasks ccdproc, zerocombine, flatcombine, cosmicray, xregister and phot. It performs the aperture photometry for 10 different apertures ranging from 0.7 to 4 FWHM in each images. We chose an aperture of 1.36 FWHM, which minimizes the -dispersion.
3 Results
3.1 CASLEO -index
The Mount Wilson -index is defined as the ratio between the chromospheric Ca II H and K line-core emissions, integrated with a triangular profile of 1.09 Å FWHM and the photospheric continuum fluxes integrated in two 20 Åpassband centred at 3891 and 4001 Å(Duncan et al., 1991). We used this expression to compute the index for the CASLEO spectrum, and we calibrated to the Mount Wilson index with Eq. (6) in Cincunegui et al. (2007b).
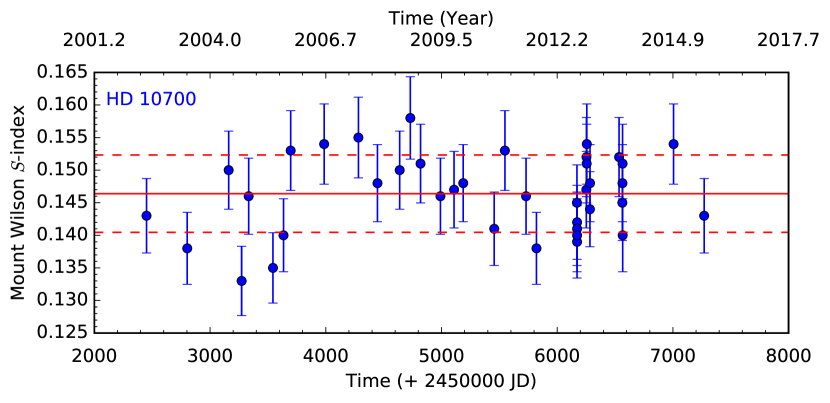
To quantify the typical dispersion of our observations, we studied the long-term activity of the solar-type star G8.5V Ceti (HD 10700) classified as a flat star by Baliunas et al. (1995). In Fig. 1 we plot the time series of the index of HD 10700 derived from CASLEO spectra between 2002 and 2015. We show the mean value with a solid line and the levels with dashed lines. We consider the dispersion of this series as an estimation of the typical error of the activity index derived from CASLEO observations.
3.2 Long-term activity of AU Mic
All HARPS, FEROS and UVES Ca II indexes were computed following Duncan et al.’s expression. We derived the Mount Wilson -index for the 31 HARPS spectra by using the calibration procedure explained in Lovis et al. (2011), while for the 6 FEROS spectra we employed the Jenkins et al. (2008) calibration. To calibrate the 3 UVES indexes, we calculate the difference between indexes of simultaneous observations with respect to HARPS. In the case of CASLEO the calibration of the spectra is done with the Cincunegui & Mauas (2004) method. In addition to this, we perform the intercalibration between indexes where the CASLEO indexes were corrected by a factor of 1.07 to re-scale Mount Wilson indexes derived from CASLEO to simultanoues measurements obtained from HARPS.
In Fig. 2(a) we show the Mount Wilson indexes compiled for AU Mic between 2004 and 2016 at CASLEO, combined with the Mount Wilson indexes obtained from HARPS, FEROS and UVES spectra between 2003 and 2015.
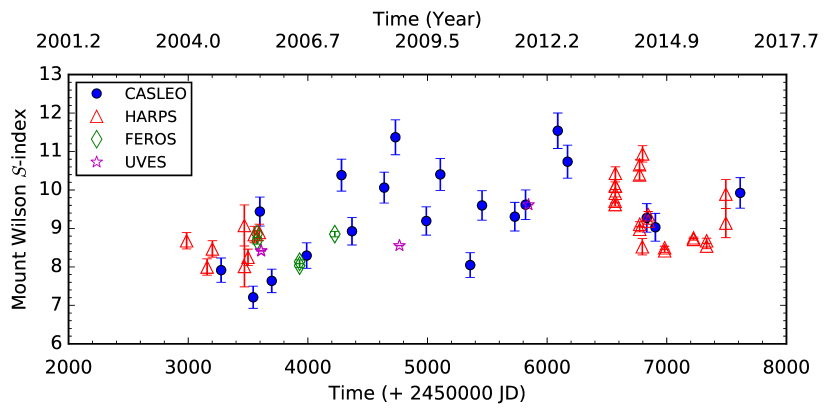
As we said, we assume a 4%-error for the Mount Wilson indexes derived from CASLEO spectra. Error bars of each HARPS, FEROS and UVES monthly means correspond to their standard deviation. For those cases with only one observation in a month, we adopted the typical RMS dispersion of other bins.
From the whole time-series we obtained a mean Mount Wilson index with a 10%-variability given by . Using the Astudillo-Defru et al. (2017) calibration, we obtained a , corresponding to a very active star.
To search for stellar activity cycles, the Lomb-Scargle (LS) periodogram (Horne & Baliunas, 1986) has been extensively employed by several studies (e.g. Baliunas et al. 1995; Metcalfe et al. 2013; Flores et al. 2017). Although the LS periodogram is a well-known algorithm to perform a frequency analysis of unevenly-sampled data-sets, its efficiency has been extensively discussed in the literature and new modifications were proposed. One of them is the Generalized Lomb-Scargle (GLS) periodogram (Zechmeister & Kürster, 2009), which exhibits certain advantages in comparison to the classic LS periodogram. It takes into account a varying zero point, it does not require a bootstrap or Monte Carlo algorithms to compute the significance of a signal, reducing the computational cost, and it is less susceptible to aliasing than the LS periodogram.
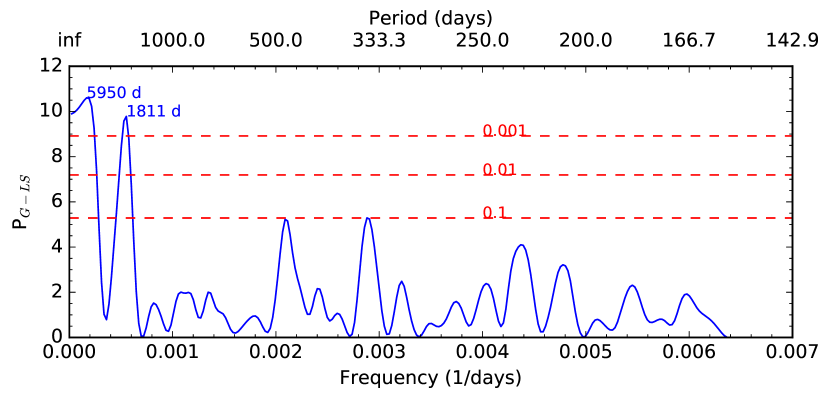
In Fig.2(b) we show the GLS periodogram for the combined spectroscopy. To estimate the false alarm probabilities (FAP) of each peak of the periodogram we use
where is the size of the data-set, is the number of independent frequencies and is the power of the period detected in the GLS periodogram (Zechmeister & Kürster, 2009). We normalize the periodogram assuming Gaussian noise.
The two most significant peaks we obtained are days ( 16.7 years) and days ( 5 years) with very good FAPs of 0.02 and 0.06 %, see Fig. 2(b). The error of the period detected depends on the finite frequency resolution of the periodogram as given by Eq.(2) in Lamm et al. (2004), .
We also analyzed the data with other formalisms. First, we implemented the Bayesian formalism for the Generalized Lomb-Scargle periodogram (BGLS; Mortier et al. 2015), which has the advantage that the relative probabilities of any frequency can be easily calculated and it is useful to discern the most significant peaks in the data. In this case we found a most probable period days with a probability of 92 %, and a second period of 3885 days with 47% of probability.
In addition, we used the Phase Dispersion Minimization algorithm (PDM; Stellingwerf 1978) provided by IRAF, which finds the frequency that produces the smaller scatter in the phased series. In this case we obtained two periods of 1872 and 4950 days with a significance of 0.31 and 0.51 respectively. Here is defined as where is the sample variance of data subsets, obtained by splitting the data series into several sub samples, and is the variance of the original data series. For the correct period should approach zero, and implies that the period obtained is false.
In Table 2 we summarize the results obtained with all methods. We see that the periods obtained by the different formalisms are consistent with each other. We remark that each BGLS and PDM methods detect the best period without informing its uncertainty. To verify these results with an independent data set, we also analyzed the ASAS photometry.
Method Short Period Significance Long Period Significance (days) (%) (days) (%) GLS 1811 82 0.06∗ 5950 2565 0.02∗ BGLS 1841 92∗∗ 3885 47∗∗ PDM 1872 31∗∗∗ 4950 51∗∗∗ ASAS 1929 283 6
∗ False Alarm Probability (FAP). ∗∗ Relative probability. ∗∗∗ Significance .
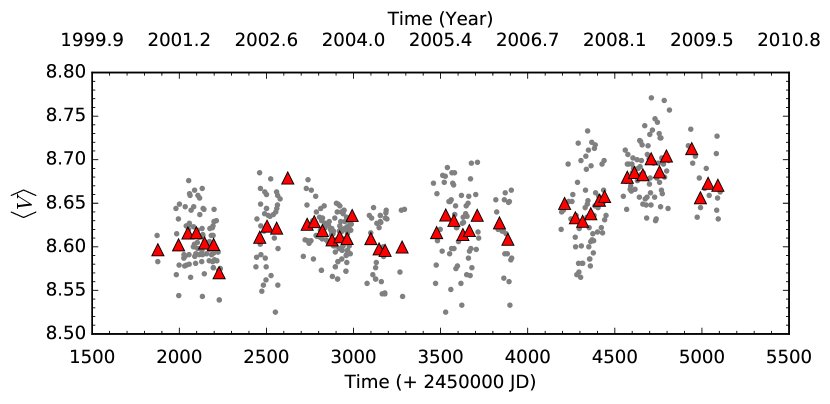
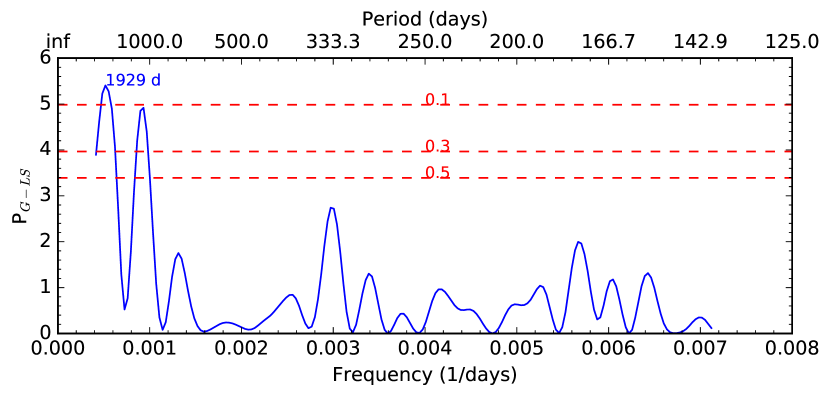
In Fig. 3(a), we show the magnitude of AU Mic obtained from the high-quality ASAS data-set between 2000 and 2009. The final time series consists of 507 points, with typical errors of around 30 mmag. The mean magnitude of the whole data set is . To eliminate possible short-term variations due to flare events, we binned the data by grouping every 45 days. The red triangles represent the mean of the observations taken over 45 days, weighted by the error reported in the ASAS database. We computed the error of each mean magnitude as the square root of the variance-weighted mean (see Frodesen et al. 1979, Eq. 9.12).
In Fig. 3(b) we show the periodogram for the ASAS data set. For the binned series we obtained a peak at days with a FAP = 6%. As in the spectroscopic study, we also studied the smoothed data set from ASAS with the BGLS and PDM formalisms. We obtained similar periods although their significances were very low due to the high dispersion of the original data series.
Suárez Mascareño et al. (2016) detected a period of 7.6-yr in a similar ASAS dataset. Thus in this work, we evaluated the original data (without binning) and the grouped data (binning the time series into different groups). We analyzed all the time-series with the GLS periodogram, but we did not find the period of 7.6 years reported by Suárez Mascareño and collaborators. In all the cases (original and smoothed data) we found a period close to the 1929 days as we reported before.
3.3 Rotation period
The rotation period of AU Mic was determined by several authors, with little discrepancies. First, from the ASAS database Pojmanski (2002) determined a rotation period of 4.822 days. Hebb et al. (2007) found a significant period of 4.847 days using photometric observations obtained with the CTIO-1m telescope, employing four different optical filters. Finally, Kiraga (2012) analyzed a longer ASAS series and determined a rotation period of days.
As explained in section §2, we also performed differential photometry of AU Mic. Analyzing the time series of 1902 points obtained as between the AU Mic and its comparing star with a GLS periodogram, we found a rotation period of days with a very low FAP. However, this periodogram presents other significant peaks, probably of instrumental origin or due to aliasing. For this reason, we binned the data corresponding to each night in three points, corresponding to the beginning, the middle and the end of the night. For the grouped data we obtained a period of days with a FAP = . This periodogram, for the binned data, is plotted in Fig. 4.
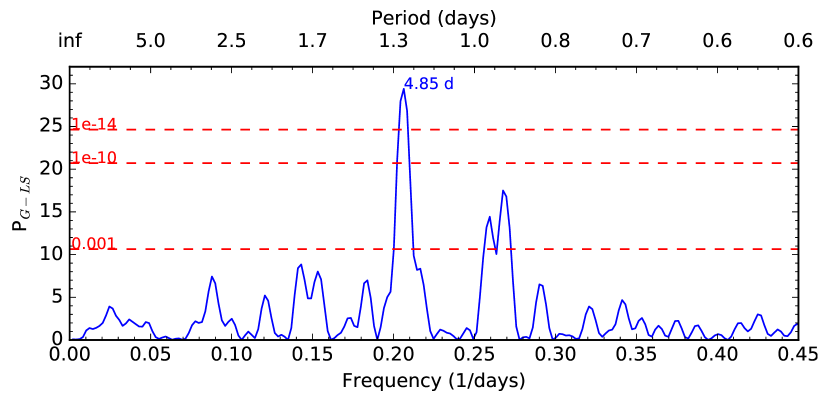
We also studied the binned data set with the BGLS and PDM formalisms, described in Section 3.2. We obtained similar results with peaks at P = 4.849 days and P = 4.89 days, respectively.
In Fig. 5 we show the differential magnitude of the smoothed data phased with the rotation period of 4.85 days, the most significant peak in Fig. 4. The red solid line represents the least-square fit with a harmonic function.
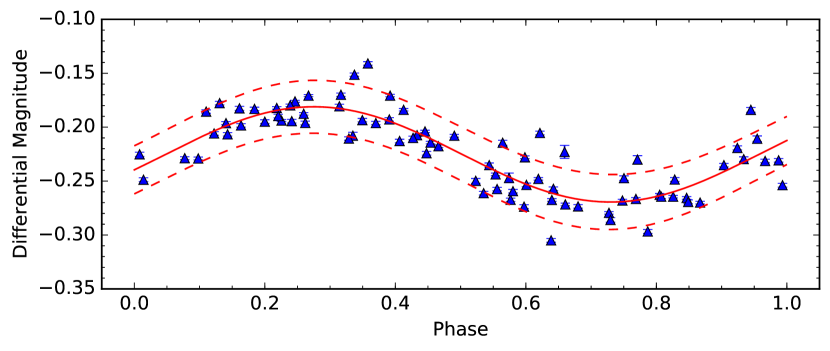
We did not detect signs of flare activity during our observations. In the future, we plan to obtain observations in the V and R filters and higher cadence to explore the flare activity of AU Mic in detail.
4 Discussion
Long-term activity has been studied for only a few dM stars, where activity cycles with periods between 1 to 8 years were detected. To increase this statistics, we studied in detail the long-term activity of the active fast-rotator dM star AU Microscopii (GJ 803-M1V). Furthermore, since most early-M stars are inactive (Reiners et al., 2012), this star is an uncommon target to analyze stellar activity. Its high activity is very likely related to its youth, as Reiners et al. (2012) also observed in other six early-M stars.
In this work, we built for the first time a long time series of AU Mic Mount Wilson indexes measured from CASLEO, UVES, FEROS and HARPS spectra obtained between 2004 and 2016. We analyzed this data with the Generalized Lomb Scargle (GLS) periodogram and we detected two significant activity cycles of days and days ( and years). We analyzed the same series with two other techniques and we obtained similar results. See Table 2 for a summary of the results.
We also studied ASAS photometry of this star obtained between 2000 and 2009. With the GLS we detected an activity cycle of (1929 283) days. Since both data-sets are completely independent, the FAP of the combined detection of the shorter cycle is 3.6.
A different case is the one of the longer period. Although the detection in the GLS is significant, with a , the error of the period itself is quite large, and the detection of this period with the two other methods is less significant. This is probably due to the fact that this period is longer than the time-series. This period is not detected in the ASAS observations, which is not surprising since these observations span only 9 years.
To study whether this peak is an artifact caused by the duration of the data-set, we follow Buccino & Mauas (2009). We used the sunspot number between 1900 and 2000 obtained from the National Geophysical Data Center666https://www.ngdc.noaa.gov/stp/solar/ssndata.html. We rescaled in time this series to the shorter period days. We also rescaled the to obtain a time series of the same mean value and we added gaussian noise to get the same standard deviation of our data. In this way we built an artificial signal representing a cycle of the same characteristics of the one observed in AU Mic.
We then “observed” the rescaled solar data selecting data-points with the same phase intervals than in the -index time series for AU Mic, and we computed the GLS periodogram. We repeated this “observation” 1000 times with random starting dates. For each periodogram, we considered the most significant period. As expected, 97.5 % of the periods detected were between 4.2 and 5.7 years. Only in 1.7 % of the cases this period lied between 13 and 18 years with FAP0.02. In other words, the FAP for the longer period in this data-set is only of 1.7 %. Therefore, the longer period we detected in Fig. 2(b) is likely related to stellar activity. However, as this period presents a large error, we will continue observing this star in the HK project, to obtain a longer time-series that could confirm this detection.
In addition, we also obtained our own photometry in the V-band during several months for this star. From these observations, we obtained a rotation period of 4.85 days with a 0.4% accuracy. This result agrees with rotation periods reported in the literature, obtained from other independent data-sets (Pojmanski, 2002; Hebb et al., 2007; Kiraga, 2012).
It is well known that stellar rotation plays an important role on the dynamo action in FGK stars and thus on their stellar activity (e.g. Noyes et al. 1984, Mamajek & Hillenbrand 2008). Recently, Astudillo-Defru et al. (2017) provided the activity index for a set of M0-M6 stars and evaluated the relation between and the rotation period. They obtained that the index shows a saturated correlation with rotation for stars with 10 days. Above that period, the - seems to be linear, where activity decreases with slower rotation, what is found for FGK stars. This saturation regime in M fast-rotators is already known for other activity proxies (eg. in Delfosse et al. 1998, in Browning et al. 2010, in Reiners et al. 2009). While the whole pattern observed in the - relation was also reported in the X-ray coronal emission by Wright & Drake (2016).
From our Mount Wilson series we obtained an activity index . Given a rotation period of = 4.85 days, this value place AU Mic in the saturation regime, as is also observed for the proxies (Wright et al., 2011). It reflects the fact that the rotation plays a key role in the magnetic activity on AU Mic similar to other young FGK stars, thus its dynamo mechanism should be similar to a solar-type dynamo. Moreover, at an age of about 25 Myr, stars of M1V spectral type like AU Mic are not fully convective any more, with an external convective envelope whose mass ranges from 40% (Baraffe et al., 2015) to 54% (Feiden, 2016) of the total mass, depending on the adopted evolutionary model. Therefore, we can expect to have in AU Mic mechanisms of magnetic fields generation similar to those that operate in the more massive solar-type stars. Therefore the 5-year chromospheric activity cycle detected for AU Mic is consistent with an dynamo. Saar (1994) determined a magnetic field strength for AU Mic KG. Malo et al. (2014) suggest that this magnetic field strength is consistent with the one derived from an dynamo model for AU Mic given its age approximately. Considering a Rossby Number 0.15 (Wright & Drake, 2016), this star seems to be near the limit of the saturation regime of the proxy. Therefore, we bring new evidence that there is not a tight correlation between emission and magnetic fields as observed in other active stars (Reiners et al., 2009).
On the one hand, the determination of the activity cycle and rotation periods of AU Mic, allows us to analyze its relation in the stellar context. For those FGK stars latter than F5 with well-determined rotation and cycle periods, Böhm-Vitense (2007) examined this relation. She concluded that the values of are distributed in two branches in the diagram, indicating that probably different kinds of dynamos are operating in each different sequence.
Expanding this sample, Saar (2011) analyzed the dependency of the cycle frequency () on the rotation frequency () for a set of single active F5-M4 stars. They identified three branches on the diagram for stars with rotations bellow 10 . We included the rotation and cyclic periods detected in the present work on the diagrams reported in Böhm-Vitense (2007) and Saar (2011). In both cases we observe that the 5-year activity cycle belongs to the active branch, which means that particular our results for AU Mic are consistent with the distribution for several stars.
Following Saar’s diagram, if AU Mic also has a shorter cycle, as reported in other M stars (Buccino et al., 2014), it would belong to the inactive branch, therefore, should have a period between 1.14 and 1.57 years. In our GLS periodogram of the Mount Wilson indexes a poor significant peak (FAP=1%) at 1.36 years is present. Due to the low significance of this detection, we think that a 2-year observing campaign with weekly observations is needed to really detect this second shorter cycle of lower amplitude.
On the other hand, since AU Mic is surrounded by an edge-on circumstellar debris disk (Kalas et al., 2004; Liu, 2004; Krist et al., 2005), our results could be relevant on characterizing this star as a planetary host. Until 2015 only three debris disks were detected surrounding M stars: AU Mic, GJ 581 (Lestrade et al., 2012) and the M4 star Fomalhaut C (Kennedy et al., 2014). Recently, Choquet et al. (2016) reported the detection of two disks imaged for the first time in scattered light around the M stars: TWA 7 (M3.2, 34.5 pc, 10 Myr) and TWA 25 (M0.5, 54 pc, 13 Myr). The presence of a debris disk indicates that its stellar system achieved the formation of planetary-like bodies during its previous protoplanetary disk phase. In the case of GJ 581 five planets were detected around this star (Bonfils et al. 2005; Udry et al. 2007; Mayor et al. 2009).
The AU Mic’s youth and its proximity to Earth ( 9.9 pc), are favourable conditions for the detection of low mass planets. Boccaletti et al. (2015) reported five large-scale features with a fast outward motion of the AU Mic disk that can be interpreted as signposts of significant planetary formation activity. Therefore, an accurate determination of the rotation period and the activity cycles of AU Mic, reported for the first time in this present work, should be useful for planets searches on this star since signals related to stellar activity could bring false detections in different time-scales (Dumusque et al., 2011; Díaz et al., 2016).
References
- Amado et al. (2013) Amado P. J., et al., 2013, in Guirado J. C., Lara L. M., Quilis V., Gorgas J., eds, Highlights of Spanish Astrophysics VII. pp 842–847 (arXiv:1210.5465)
- Astudillo-Defru et al. (2017) Astudillo-Defru N., Delfosse X., Bonfils X., Forveille T., Lovis C., Rameau J., 2017, A&A, 600, A13
- Baliunas et al. (1995) Baliunas S. L., et al., 1995, ApJ, 438, 269
- Baraffe et al. (2015) Baraffe I., Homeier D., Allard F., Chabrier G., 2015, A&A, 577, A42
- Bell et al. (2015) Bell C. P. M., Mamajek E. E., Naylor T., 2015, MNRAS, 454, 593
- Boccaletti et al. (2015) Boccaletti A., et al., 2015, Nature, 526, 230
- Böhm-Vitense (2007) Böhm-Vitense E., 2007, ApJ, 657, 486
- Bonfils et al. (2005) Bonfils X., et al., 2005, A&A, 443, L15
- Bonfils et al. (2013) Bonfils X., et al., 2013, A&A, 549, A109
- Borucki et al. (2010) Borucki W. J., et al., 2010, Science, 327, 977
- Browning (2008) Browning M. K., 2008, ApJ, 676, 1262
- Browning et al. (2010) Browning M. K., Basri G., Marcy G. W., West A. A., Zhang J., 2010, AJ, 139, 504
- Buccino & Mauas (2009) Buccino A. P., Mauas P. J. D., 2009, A&A, 495, 287
- Buccino et al. (2007) Buccino A. P., Lemarchand G. A., Mauas P. J. D., 2007, Icarus, 192, 582
- Buccino et al. (2011) Buccino A. P., Díaz R. F., Luoni M. L., Abrevaya X. C., Mauas P. J. D., 2011, AJ, 141, 34
- Buccino et al. (2014) Buccino A. P., Petrucci R., Jofré E., Mauas P. J. D., 2014, ApJ, 781, L9
- Chabrier & Baraffe (1997) Chabrier G., Baraffe I., 1997, A&A, 327, 1039
- Chabrier & Küker (2006) Chabrier G., Küker M., 2006, A&A, 446, 1027
- Chang et al. (2017) Chang H.-Y., et al., 2017, ApJ, 834, 92
- Choquet et al. (2016) Choquet É., et al., 2016, ApJ, 817, L2
- Cincunegui & Mauas (2004) Cincunegui C., Mauas P. J. D., 2004, A&A, 414, 699
- Cincunegui et al. (2007a) Cincunegui C., Díaz R. F., Mauas P. J. D., 2007a, A&A, 461, 1107
- Cincunegui et al. (2007b) Cincunegui C., Díaz R. F., Mauas P. J. D., 2007b, A&A, 469, 309
- Cully et al. (1993) Cully S. L., Siegmund O. H. W., Vedder P. W., Vallerga J. V., 1993, ApJ, 414, L49
- Delfosse et al. (1998) Delfosse X., Forveille T., Perrier C., Mayor M., 1998, A&A, 331, 581
- Díaz et al. (2007) Díaz R. F., González J. F., Cincunegui C., Mauas P. J. D., 2007, A&A, 474, 345
- Díaz et al. (2016) Díaz R. F., et al., 2016, A&A, 585, A134
- Donati et al. (2008) Donati J.-F., et al., 2008, MNRAS, 390, 545
- Dressing & Charbonneau (2015) Dressing C. D., Charbonneau D., 2015, ApJ, 807, 45
- Dumusque et al. (2011) Dumusque X., et al., 2011, A&A, 535, A55
- Duncan et al. (1991) Duncan D. K., et al., 1991, ApJS, 76, 383
- Durney & Robinson (1982) Durney B. R., Robinson R. D., 1982, ApJ, 253, 290
- Egeland et al. (2017) Egeland R., Soon W., Baliunas S., Hall J. C., Henry G. W., 2017, in Nandy D., Valio A., Petit P., eds, IAU Symposium Vol. 328, Living Around Active Stars. pp 329–337 (arXiv:1704.02388), doi:10.1017/S1743921317004173
- Feiden (2016) Feiden G. A., 2016, A&A, 593, A99
- Flores et al. (2017) Flores M. G., Buccino A. P., Saffe C. E., Mauas P. J. D., 2017, MNRAS, 464, 4299
- France et al. (2016) France K., et al., 2016, ApJ, 820, 89
- Frodesen et al. (1979) Frodesen A. G., Skjeggestad O., Tofte H., 1979, Probability and Statistics in Particle Physics. Universitetsforlaget, Bergen, Norway, http://www-spires.fnal.gov/spires/find/books/www?cl=QC174.8.F928
- Gomes da Silva et al. (2012) Gomes da Silva J., Santos N. C., Bonfils X., Delfosse X., Forveille T., Udry S., Dumusque X., Lovis C., 2012, A&A, 541, A9
- Hall et al. (2007) Hall J. C., Lockwood G. W., Skiff B. A., 2007, AJ, 133, 862
- Hawley & Pettersen (1991) Hawley S. L., Pettersen B. R., 1991, ApJ, 378, 725
- Hawley et al. (2014) Hawley S. L., Davenport J. R. A., Kowalski A. F., Wisniewski J. P., Hebb L., Deitrick R., Hilton E. J., 2014, ApJ, 797, 121
- Hebb et al. (2007) Hebb L., Petro L., Ford H. C., Ardila D. R., Toledo I., Minniti D., Golimowski D. A., Clampin M., 2007, MNRAS, 379, 63
- Hilton et al. (2011) Hilton E. J., Hawley S. L., Kowalski A. F., Holtzman J., 2011, in Johns-Krull C., Browning M. K., West A. A., eds, Astronomical Society of the Pacific Conference Series Vol. 448, 16th Cambridge Workshop on Cool Stars, Stellar Systems, and the Sun. p. 197
- Horne & Baliunas (1986) Horne J. H., Baliunas S. L., 1986, ApJ, 302, 757
- Jenkins et al. (2008) Jenkins J. S., Jones H. R. A., Pavlenko Y., Pinfield D. J., Barnes J. R., Lyubchik Y., 2008, A&A, 485, 571
- Kalas et al. (2004) Kalas P., Liu M. C., Matthews B. C., 2004, Science, 303, 1990
- Kennedy et al. (2014) Kennedy G. M., Wyatt M. C., Kalas P., Duchêne G., Sibthorpe B., Lestrade J.-F., Matthews B. C., Greaves J., 2014, MNRAS, 438, L96
- Kiraga (2012) Kiraga M., 2012, Acta Astron., 62, 67
- Kitchatinov & Olemskoy (2016) Kitchatinov L. L., Olemskoy S. V., 2016, MNRAS, 459, 4353
- Kitchatinov et al. (2014) Kitchatinov L. L., Moss D., Sokoloff D., 2014, MNRAS, 442, L1
- Kowalski et al. (2013) Kowalski A. F., Hawley S. L., Wisniewski J. P., Osten R. A., Hilton E. J., Holtzman J. A., Schmidt S. J., Davenport J. R. A., 2013, ApJS, 207, 15
- Krist et al. (2005) Krist J. E., et al., 2005, AJ, 129, 1008
- Küker et al. (2018) Küker M., Rüdiger G., Oláh K., Strassmeier K. G., 2018, preprint, (arXiv:1804.02925)
- Lacy et al. (1976) Lacy C. H., Moffett T. J., Evans D. S., 1976, ApJS, 30, 85
- Lamm et al. (2004) Lamm M. H., Bailer-Jones C. A. L., Mundt R., Herbst W., Scholz A., 2004, A&A, 417, 557
- Lestrade et al. (2012) Lestrade J.-F., et al., 2012, A&A, 548, A86
- Liu (2004) Liu M. C., 2004, Science, 305, 1442
- Lovis et al. (2011) Lovis C., et al., 2011, preprint, (arXiv:1107.5325)
- Malo et al. (2014) Malo L., Doyon R., Feiden G. A., Albert L., Lafrenière D., Artigau É., Gagné J., Riedel A., 2014, ApJ, 792, 37
- Mamajek & Bell (2014) Mamajek E. E., Bell C. P. M., 2014, MNRAS, 445, 2169
- Mamajek & Hillenbrand (2008) Mamajek E. E., Hillenbrand L. A., 2008, ApJ, 687, 1264
- Mauas & Falchi (1996) Mauas P. J. D., Falchi A., 1996, A&A, 310, 245
- Mayor et al. (2009) Mayor M., et al., 2009, A&A, 507, 487
- Messina et al. (2016) Messina S., et al., 2016, A&A, 596, A29
- Messina et al. (2017) Messina S., et al., 2017, A&A, 600, A83
- Metcalfe et al. (2013) Metcalfe T. S., et al., 2013, ApJ, 763, L26
- Miguel et al. (2015) Miguel Y., Kaltenegger L., Linsky J. L., Rugheimer S., 2015, MNRAS, 446, 345
- Moffett (1974) Moffett T. J., 1974, ApJS, 29, 1
- Morin et al. (2008) Morin J., et al., 2008, Monthly Notices of the Royal Astronomical Society, 390, 567
- Mortier et al. (2015) Mortier A., Faria J. P., Correia C. M., Santerne A., Santos N. C., 2015, A&A, 573, A101
- Noyes et al. (1984) Noyes R. W., Hartmann L. W., Baliunas S. L., Duncan D. K., Vaughan A. H., 1984, ApJ, 279, 763
- Parker (1955) Parker E. N., 1955, ApJ, 122, 293
- Parker (1963) Parker E. N., 1963, ApJ, 138, 226
- Pojmanski (2002) Pojmanski G., 2002, Acta Astronom., 52, 397
- Reiners & Basri (2010) Reiners A., Basri G., 2010, ApJ, 710, 924
- Reiners et al. (2009) Reiners A., Basri G., Browning M., 2009, ApJ, 692, 538
- Reiners et al. (2012) Reiners A., Joshi N., Goldman B., 2012, AJ, 143, 93
- Robertson et al. (2013) Robertson P., Endl M., Cochran W. D., Dodson-Robinson S. E., 2013, ApJ, 764, 3
- Saar (1994) Saar S. H., 1994, in Rabin D. M., Jefferies J. T., Lindsey C., eds, IAU Symposium Vol. 154, Infrared Solar Physics. p. 493
- Saar (2011) Saar S. H., 2011, in Prasad Choudhary D., Strassmeier K. G., eds, IAU Symposium Vol. 273, IAU Symposium. pp 61–67, doi:10.1017/S1743921311015018
- Schwartz et al. (2013) Schwartz P. M. A. P., Mauas P., Veltri A., Hereñú H., 2013, Boletin de la Asociacion Argentina de Astronomia La Plata Argentina, 56, 449
- Shibata et al. (2013) Shibata K., et al., 2013, PASJ, 65, 49
- Spiegel & Zahn (1992) Spiegel E. A., Zahn J.-P., 1992, A&A, 265, 106
- Sraibman et al. (2017) Sraibman L., Buccino A. P., Minotti F., 2017, Boletin de la Asociacion Argentina de Astronomia La Plata Argentina, 59, 19
- Steenbeck & Krause (1969) Steenbeck M., Krause F., 1969, Astronomische Nachrichten, 291, 49
- Stellingwerf (1978) Stellingwerf R. F., 1978, ApJ, 224, 953
- Suárez Mascareño et al. (2016) Suárez Mascareño A., Rebolo R., González Hernández J. I., 2016, A&A, 595, A12
- Udry et al. (2007) Udry S., et al., 2007, A&A, 469, L43
- Vida et al. (2017) Vida K., Kővári Z., Pál A., Oláh K., Kriskovics L., 2017, ApJ, 841, 124
- Wargelin et al. (2017) Wargelin B. J., Saar S. H., Pojmański G., Drake J. J., Kashyap V. L., 2017, MNRAS, 464, 3281
- Wright & Drake (2016) Wright N. J., Drake J. J., 2016, Nature, 535, 526
- Wright et al. (2011) Wright N. J., Drake J. J., Mamajek E. E., Henry G. W., 2011, ApJ, 743, 48
- Yadav et al. (2016) Yadav R. K., Christensen U. R., Wolk S. J., Poppenhaeger K., 2016, ApJ, 833, L28
- Yang et al. (2017) Yang H., et al., 2017, ApJ, 849, 36
- Zechmeister & Kürster (2009) Zechmeister M., Kürster M., 2009, A&A, 496, 577