A gap in HD 92945’s broad planetesimal disc revealed by ALMA
Abstract
In the last few years multiwavelength observations have revealed the ubiquity of gaps/rings in circumstellar discs. Here we report the first ALMA observations of HD 92945 at 0.86 mm, that reveal a gap at about au within a broad disc of planetesimals that extends from 50 to 140 au. We find that the gap is au wide. If cleared by a planet in situ, this planet must be less massive than 0.6 MJup, or even lower if the gap was cleared by a planet that formed early in the protoplanetary disc and prevented planetesimal formation at that radius. By comparing opposite sides of the disc we also find that the disc could be asymmetric. Motivated by the asymmetry and the fact that planets might be more frequent closer to the star in exoplanetary systems, we show that the gap and asymmetry could be produced by two planets interior to the disc through secular resonances. These planets excite the eccentricity of bodies at specific disc locations, opening radial gaps in the planetesimal distribution. New observations are necessary to confirm if the disc is truly asymmetric, thus favouring the secular resonance model, or if the apparent asymmetry is due to a background galaxy, favouring the in-situ planet scenario. Finally, we also report the non-detection of CO and HCN gas confirming that no primordial gas is present. The CO and HCN non-detections are consistent with the destruction of volatile-rich Solar System-like comets.
keywords:
circumstellar matter - planetary systems - planets and satellites: dynamical evolution and stability - techniques: interferometric - methods: numerical - stars: individual: HD 92945.1 Introduction
In the last decade, observational campaigns have discovered thousands of exoplanets with orbital radii smaller than 5 au; however, the population of planets at larger radii remains mostly unexplored, especially for low mass planets (Bowler & Nielsen, 2018). Those planets, nevertheless, can shape the distribution of planetesimals leaving hints of their presence. Our Solar System is a good example, with the Kuiper belt’s inner edge shaped by Neptune, and the gap between the asteroid and Kuiper belt filled with planets.
In this manner, observations of dusty debris discs can reveal the presence of planets that shape the distribution of planetesimals (potentially stirring their orbits, e.g. Mustill & Wyatt, 2009) and dust (see reviews by Wyatt, 2008; Hughes et al., 2018). Well known examples of systems with debris discs and confirmed planets are Pic (Lagrange et al., 2009), HR 8799 (Marois et al., 2008; Marois et al., 2010; Booth et al., 2016; Read et al., 2018; Wilner et al., 2018) and HD 95086 (Rameau et al., 2013; Su et al., 2013, 2015; Rameau et al., 2016). Other systems display eccentric debris discs that hint at the presence of yet undetected planets (e.g. Fomalhaut and HD 202628, Kalas et al., 2005; Krist et al., 2012; Schneider et al., 2016, Faramaz et al. in prep); or both inner and outer belts (e.g. Backman et al., 2009; Morales et al., 2009; Chen et al., 2009; Ballering et al., 2014; Kennedy & Wyatt, 2014), which have been used as an argument for the presence of planets in between these two components (Shannon et al., 2016; Lazzoni et al., 2018; Matthews et al., 2018). Additionally, a few debris discs show evidence of single or multiple gaps in between broad outer belts which suggests the presence of planets formed within these icy planetesimals belts. The most remarkable of these systems is HD 107146, with a face on debris disc around a solar analogue, 100 au wide, and with a au wide gap at 80 au revealed by ALMA (Ricci et al., 2015; Marino et al., 2018a).
Observation Dates tsci Image rms beam size (PA) Min and max baselines [m] [hours] [Jy] (5th and 95th percentiles) Band 7 - 12m 13, 17, 18 Dec 2016 2.2 16 () 46 and 360 Band 7 - ACA 24-27 Oct 2016 3.6 175 () 9 and 44 23 Mar 2017 Band 7 - 12m+ACA - - 16 () -
Two other systems (HD 131835 and HD 92945) also show tentative evidence of gaps or concentric rings possibly produced by planet disc interactions (Feldt et al., 2017; Golimowski et al., 2011; Schneider et al., 2014). However, these features have only been detected in scattered light observations that trace the distribution of m-sized dust grains, which are heavily affected by radiation forces, thus not directly tracing the distribution of the parent planetesimals. Moreover, HD 131835 is known to have large amounts of gas (Moór et al., 2015; Kral et al., 2018) which could affect the distribution of m-sized grains traced in scattered light observations, and cause instabilities that can result in multiple ring structures (Klahr & Lin, 2005; Lyra & Lin, 2013; Richert et al., 2018).
In this paper we focus on HD 92945, a 100-300 Myr old K0 star (Song et al., 2004; Plavchan et al., 2009) at 21.5 pc (Gaia Collaboration et al., 2018), and present the first ALMA observations of this system to search for evidence of single or multiple planets that could be shaping the distribution of planetesimals. ALMA observations can resolve emission arising from 0.1-10 mm-sized grains, for which radiation forces are negligible, and thus trace the location of the parent planetesimals.
This paper is organised as follows: In §2 we present the first ALMA observations of HD 92945, revealing a broad planetesimal disc with a gap near 73 au. Then, in §3 we model the observations to characterise the distribution of planetesimals, especially the width and depth of the gap, and test if the disc could be asymmetric. Given the derived disc structure, in §4 we propose that a pair of inner planets could produced the observed gap through secular resonances. In §5 we discuss potential origins for the observed gap, and which scenarios we can already rule out. Finally, in §6 we summarise the main findings and conclusions of this work.
2 Observations
We observed HD 92945 in band 7 (0.86 mm) as part of the cycle 4 project 2016.1.00104.S (PI: S. Marino). We requested both 12m array and ACA observations to obtain high angular resolution and to recover large scale structure that was previously observed by HST (Golimowski et al., 2011; Schneider et al., 2014). The 12m array observations were carried out between 13 and 18 December 2016, for a total of 2.2 h on source. The baselines ranged from 46 to 360 m (5th and 95th percentiles), with PWV values between 0.6 and 1.0 mm and a total of 42-47 antennas were used. ACA observations were taken between 24 October 2016 and 23 March 2017, with a total time on source of 3.6 h and PWV values ranging from 0.3 to 1.4 mm. The baselines ranged from 9 to 44 m and 8-11 antennas were used. These details are summarised in Table 1. This range of baselines allows us to recover emission on angular scales ranging from to or 10 to 400 au.
The correlator was set up with four spectral windows. Two were used to study the continuum emission only, centred at 343.1 and 357.0 GHz with 2 GHz bandwidth and a channel width of 15.625 MHz. The other two were center-ed at 345.0 and 355.1 to look for CO and HCN gas emission, with 2 GHz bandwidth and channel widths of 0.977 MHz (effective spectral resolution of 1.13 MHz) and 0.488 MHz (effective spectral resolution of 0.977 MHz), respectively. Calibrations were applied using CASA 4.7 (McMullin et al., 2007) and the calibration routines provided by ALMA.
2.1 Dust continuum
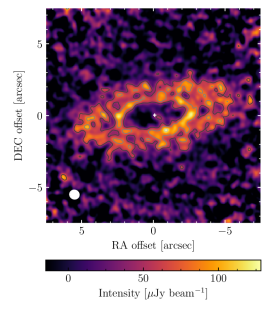
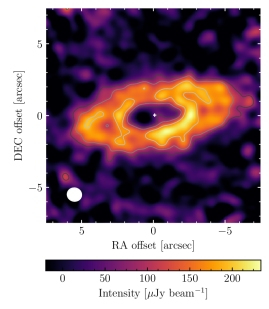
Continuum maps at 0.86 mm are obtained using the tclean task in CASA 5.1 (McMullin et al., 2007). In Figure 1 we present the Clean image using natural weights (left panel) and smoothed with a Gaussian tapering of (right panel) to obtain a higher signal-to-noise per beam (but at lower resolution). These images reveal a well resolved broad disc with a bright inner rim at (54 au) from the star and a fainter outer component extending out to (150 au) with a sharp outer edge, similar to the morphology seen by HST (Golimowski et al., 2011; Schneider et al., 2014). The new ALMA image indicates that large grains and thus planetesimals are present at a wide range of radii in a au wide disc, and not only at the bright inner ring around 50 au as it was modelled by Golimowski et al. (2011). This is not always the case, with many systems displaying narrow birth rings well traced at mm wavelengths, with extended halos of small grains blown out by radiation pressure (e.g. as seen for HD 181327, Fomalhaut and HD 202628 in scattered light, Schneider et al., 2014; Stark et al., 2014; Marino et al., 2016; Boley et al., 2012, Faramaz et al. in prep). The similarity between scattered light and mm thermal emission images could be due to HD 92945 being a K0 star, thus m-sized grains are not as heavily affected by radiation pressure as around more luminous stars.
We measure a total disc flux of mJy (including absolute flux uncertainties) by integrating the emission inside an elliptic mask oriented the same as the disc in the sky (see §3) and with a semi-major axis of (150 au). This total flux is consistent with the mJy flux measured with JCMT/SCUBA-2 as part of the SONS survey (Panić et al., 2013; Holland et al., 2017). Within the inner edge of the disc, a peak (Jy) appears slightly offset by , but is still consistent with being emission arising from the star given the astrometric accuracy of 111ALMA Technical Handbook, Astrometric observations. and the expected photospheric emission (Jy based on photometry at wavelengths shorter than 10 m and assuming a Rayleigh-Jeans spectral index). We also find that the disc inner edge is brighter towards the South-West than elsewhere, indicating that the disc might be asymmetric, as suggested by HST images (Golimowski et al., 2011; Schneider et al., 2014), although those scattered light observations showed the East side being brighter than its counterpart.
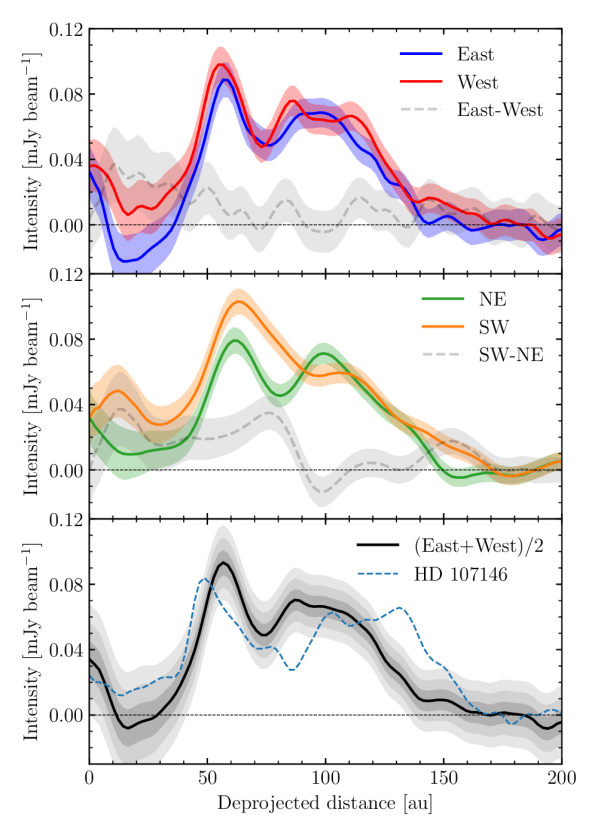
Despite the low S/N per beam in these images, it is still possible to see along the disc major axis that the surface brightness has a local minimum at about (73 au) from the center, which suggests the presence of a gap. This finding seems to confirm the previous suggestion of a gap at the same location based on scattered light images presented by (Golimowski et al., 2011, see their Figure 7 for a dust density radial profile). This feature is better seen in a disc brightness radial profile, obtained by azimuthally averaging the deprojected emission (using the disc inclination and PA found in §3) within wide wedges as shown in Figure 2. The radial profile strongly peaks at around 55 au, with no significant emission within 40 au, and with a local minimum near 73 au that is seen both at the Eastern and Western sides of the disc along the disc major axis. These wedges are consistent with each other; however, when comparing the radial profiles obtained along a PA of and (NE and SW lines in Figure 2) we find differences. The South-West side is brighter than its counterpart and shows no clear evidence of a gap (orange line). These findings suggest that the disc is asymmetric, providing key information to understand the origin of this gap (see §4 and 5).
It is also noticeable some similarities in the radial structure of the debris discs around HD 92945 and HD 107146 (see bottom panel of Figure 2). Both are among the widest discs that have been imaged in the sub-millimetre (Matrà et al., 2018b). HD 107146’s outer belt extends from roughly 40-150 au, with a wide gap centred at around 75 au and bright and sharp disc inner and outer edges. In §3 we conclude a similar radial structure for HD 92945, although with an overall narrower disc and gap. The stellar masses and ages of these systems are also similar (0.9-1.0 M☉ and 100-300 Myr). However, the HD 92945 disc has a dust mass that is a factor 5 lower (which also applies to the total disc mass if both have the same planetesimal size distribution), and moreover, is possibly asymmetric. The difference in mass could still be consistent with similar initial masses, but more depletion over time for HD 92945 than HD 107146 if the first is older by a factor of a few, or the largest planetesimals are larger in the case of HD 92945. Alternatively, if the level of stirring is higher in HD 92945 it would collisionally evolve faster, explaining its lower mass.
2.2 CO J=3-2 and HCN J=4-3
As well as studying the dust continuum emission we look for any secondary gas that could be present, released from volatile rich planetesimals in the disc (e.g. Dent et al., 2014; Marino et al., 2016; Matrà et al., 2017a, b). However, after subtracting the continuum emission and producing dirty data cubes (no clean iterations are necessary) we find no evidence for CO (3-2) nor HCN (4-3) line emission co-located with the dust, nor closer in as found around Corvi (Marino et al., 2017a). In order to place tight upper limits on the total CO and HCN flux, we integrate the dirty data cubes between the disc inner and outer edge and only in those channels where gas emission is expected according to the Doppler shift due to Keplerian rotation, also taking the disc orientation into account. We have used this method previously to both detect faint lines (Marino et al., 2016, 2017a; Matrà et al., 2017b) and place tight upper limits (e.g. Matrà et al., 2015). We obtain upper limits of 69 mJy km s-1 for CO (3-2) and 63 mJy km s-1 for HCN (4-3). We use these in §5.3 to derive gas mass upper limits.
3 Parametric disc model
In this section we model the dust continuum observations with a parametric model to constrain the disc structure. We combine radiative transfer simulations and an MCMC fitting procedure in visibility space (e.g. Marino et al., 2016). We use the same parametric model as Marino et al. (2018a) that was used to fit ALMA observations of HD 107146 (we direct the reader to that work for details). The surface density is defined as a triple power law to constrain the disc inner edge slope (power law index), the slope of the surface density between the inner and outer edge , and the slope beyond the disc outer edge . In addition, the model has a gap with a Gaussian radial profile that is parametrized with a fractional depth , mean radius and FWHM . We also model the disc vertical aspect ratio assuming a Gaussian vertical profile (imposing due to resolution constraints). We leave the stellar flux at 0.86 mm () as a free parameter as it is not well constrained (e.g. it could have significant chromospheric emission), although to compute the dust temperature we use a stellar template spectrum corresponding to an effective temperature of 5250 K and a radius of 0.77 . Finally, we use six parameters that determine the disc orientation in the sky: a disc inclination (measured from face-on), PA, and RA and Dec offsets (which are allowed to be different for the 12m and ACA observations).
Given the putative asymmetry found in §2.1, we also allow the disc to have a global eccentricity and argument of pericentre , defined as the angle in the disc plane between the disc PA (i.e. the line of nodes) and pericentre (increasing anti-clockwise). In this work, we use a slightly different parametrization for the disc eccentricity since the model used in Marino et al. (2017a) and Marino et al. (2018a) did not account properly for the disc eccentricity as it assumed the disc was not resolved radially, overestimating slightly the surface density at apocentre. Here, we provide a correct expression for it.
First, let us assume that the disc is composed of particles with the same eccentricity and longitude of pericentre at . Consider now a portion of the disk where semi-major axes go from a to at longitudes from to . That area is and contains a number of particles , where is the orbital period, resulting in a surface density
| (1) |
At a given longitude , a maps directly onto through
| (2) |
This means that the surface density is constant along ellipses defined by Equation 2, and that plots of surface density versus distance at each longitude are identical except for a scaling in radius given by Eq. 2. One way of describing this is to define , where and is the surface density that would have resulted from the given semi-major axis distribution for circular orbits, and otherwise is the distribution that is scaled in radius at different longitudes through Equation 2. In our case is parametrized as a triple power law with a Gaussian gap as written in Equations 1 and 2 of Marino et al. (2018a), but substituting by using Equation 2.
Equation 1 implies that the surface density of a disc with a global eccentricity and longitude of pericentre is independent of (when keeping fixed)222We have checked if Equation 1 gives the right surface density distribution as a function of and by comparing it with numerical simulations of particles distributed in a disc on real eccentric orbits with semi-major axes distributed as . We found a good agreement between the two for eccentricities from 0 to 0.9 with differences only due to numeric noise that was lower than 1%.. This result is counter-intuitive because discs are expected to be brightest at apocentre at long wavelengths since particles spend more time near there than at any other point of their orbits (Wyatt et al., 1999; Pan et al., 2016). However, this effect is balanced by the increased separation between orbits (i.e. disc radial width) at apocentre, keeping the surface density constant. On top of this, the disc temperature decreases with radius, making the disc slightly brighter at pericentre. Apocentre glow should only be visible if the emission is integrated radially or if the disc width is unresolved by the resolution of the observations. A caveat in this derivation is that we are assuming that all particles have the same eccentricity and pericentre orientation, and therefore it is possible that the surface density could be higher at apocentre under a different set of assumptions.
3.1 Results
The best fit parameters are presented in Table 2, and in Figure 3 we show the posterior distribution of some of the parameters. We find disc inner and outer radii at and au, with a sharp inner (outer) edge or slope greater (lower) than 5.7 (-6.0) with 95% significance. The surface density between the inner and outer disc radii is consistent with being flat (), which is expected for a broad disc of planetesimals with a surface density proportional to and a size distribution that is not yet in collisional equilibrium (i.e. the age of the system is shorter than the collisional lifetime of the largest planetesimals, Schüppler et al., 2016; Marino et al., 2017b; Geiler & Krivov, 2017).
| Parameter | best fit value | description |
| [] | total dust mass | |
| [au] | disc inner radius | |
| [au] | disc outer radius | |
| inner edge’s slope | ||
| disc slope | ||
| outer edge’s slope | ||
| scale height | ||
| [Jy] | stellar flux at 0.86 mm | |
| [au] | radius of the gap | |
| [au] | FWHM of the gap | |
| fractional depth of the gap | ||
| PA [] | disc position angle | |
| [] | disc inclination from face-on | |
| <0.097 | disc global eccentricity | |
| [] | argument of pericentre |
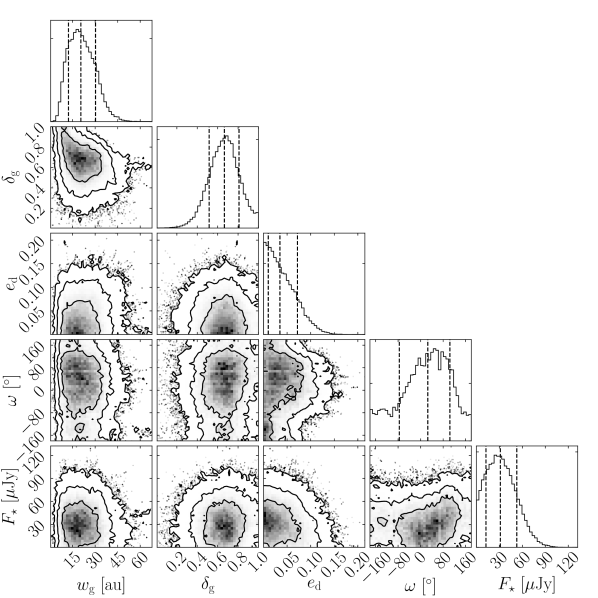
From the posterior distribution, we find that a gap is indeed required to fit the data, i.e. with a well defined mean radius of au and a fractional depth that is significantly larger than zero (). Although its marginalised distribution peaks at (see Figure 3), the gap is still consistent with being completely devoid of dust and planetesimals, which was ruled out for HD 107146 (Marino et al., 2018a). Moreover, the gap FWHM is constrained to be au, which despite its large uncertainty, is smaller than for HD 107146.
Because the gap’s width if carved by a planet in situ is roughly equal to the chaotic zone (e.g. see Figure 5 in Marino et al., 2018a), which scales with the planet mass as (Wisdom, 1980), then if this is the origin of the gap the planet mass must be constrained. However, given the large uncertainty on , that mass is only limited to be lower than MJup (). By comparing new N-body simulations tailored to HD 92945 with the observed visibilities (as in Marino et al. (2018a)), we obtain tighter upper limits for the maximum planet mass that could carve this gap. Depending on whether we consider particles in the planet co-rotation zone or not, we find upper limits of 0.6 MJup and 10 M⊕, respectively. Removing particles in the co-rotation zone makes the gap deeper (); and therefore the gap must be narrower and planet masses lower (see Figure 3). The uncertainty in the system age (100-300 Myr) is not an important factor in this upper limit, as planets with masses M⊕ can open a gap in less than 10 Myr (Morrison & Malhotra, 2015; Marino et al., 2018a).
Regarding the disc vertical distribution, we find that is constrained to be , although still marginally consistent with zero. For a disc with an intermediate inclination and a gap, the disc scale height affects how sharp the gap is along the minor axis compared to the major axis (e.g. HL Tau, Pinte et al., 2016). Therefore, the model prefers since the gap is likely seen smoother and narrower along the minor axis, as well as the disc inner and outer edges appearing smoother. Finally, we find a disc inclination of and a disc PA of , which are consistent with previous estimates from scattered light observations (Golimowski et al., 2011; Schneider et al., 2014).
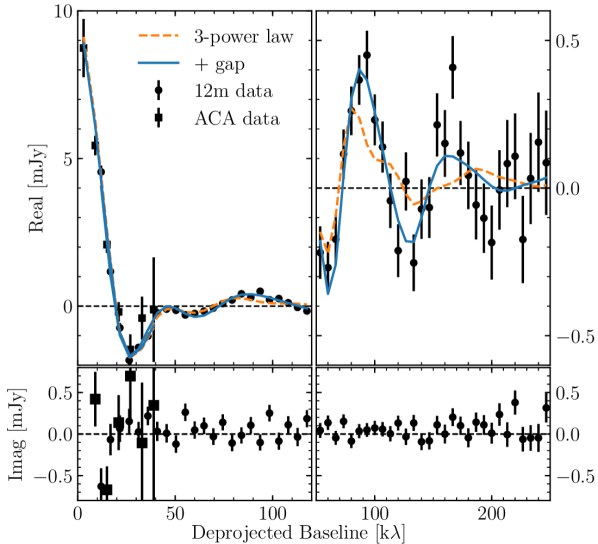
At this point it is worth looking for evidence for the gap in visibility space. In order to do this, we deproject (using the best fit inclination and PA), radially bin and azimuthally average the observed visibilities, and compare them with the simulated visibilities of two models in Figure 4. These correspond to two MCMC best fits using a 3-power law model that does not include a gap (orange) and with the addition of a gap as discussed above (blue). We find that between 50 and 200 k there are significant differences between the real components of the data and the model without a gap (see top right panel in Figure 4). The data displays amplitudes that are larger than the model by a factor of . The model with a gap, on the other hand, is able to reproduce these amplitudes within the noise level providing a better fit. In fact, the addition of the gap improves the by 19, which considering the difference of three in the total number of free parameters, is a significant difference. Therefore, based on the gap’s depth being significantly larger than zero, evidence of the gap in the deprojected visibilities themselves, and previous HST images which provided evidence for a depression in the dust distribution at the same distance, we conclude that there must be a gap or depression in the dust and planetesimal distribution.
Despite allowing the disc to be eccentric, the marginalised distribution of peaks at zero, with an upper limit of 0.1 (). This high upper limit is in part due to the unconstrained stellar flux and position in these observations. We find that higher stellar fluxes require lower eccentricities (see Figure 3). The disc eccentricity and disc offsets are also correlated, such that the disc geometric center is always centred, while the star is offset instead, providing a better fit. We also find that is more likely to be near than (i.e. pericentre aligned with the disc PA) when larger eccentricities are allowed. This preference in pericentre orientation is possibly due to the west side of the disc appearing more extended (see Figures 1 and 2).
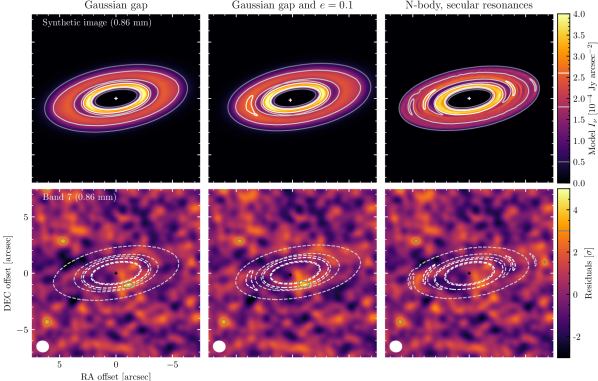
In Figure 5 we present best fit model images (top) and the corresponding residuals (bottom) for a disc with zero eccentricity and one with 0.1 eccentricity with pericentre at the South East ansa. In the residual images for both models there are a few 70 Jy beam-1() peaks, one of them located towards the South West ( in the circular disc model) where we found that the disc appears brighter and the gap seems absent. Whether this observed residual is due to a true disc asymmetry or background emission is uncertain. Sub-millimetre galaxies are ubiquitous at these frequencies in deep observations. The expected number of sub-millimetre galaxies brighter than 70Jy at 0.88 mm within a square region of is 8 (Simpson et al., 2015), therefore it is not surprising that we find between four and five 70 Jy beam-1peaks in the residual images. Moreover, we expect to find about 2 sub-millimetre galaxies brighter than 70 Jy in the area covered by the disc in the sky, therefore it is possible that the observed clump is a background object. To rule out this clump being a background object new observations in 2020 or later with a similar sensitivity and resolution could confirm if it is co-moving or not with HD 92945 given its stellar proper motion (220 mas yr-1, Gaia Collaboration et al., 2018). Alternatively, observations at a different wavelength could be used to measure the disc and clump spectral index and see if they differ, which could suggest that the observed residual is background emission. The difference in spectral index was used as an evidence for the extra-galactic origin of a clump in HD 95086 ALMA observations (Su et al., 2017; Booth et al., 2019).
4 Gap opening by secular resonances
Given the putative asymmetry found in the ALMA data, we begin this section by describing a dynamical model which could explain both the gap and asymmetry observed in the HD 92945 disc via interactions with a two-planet system, with both planets interior to the disc. Such a system of planets will excite the eccentricities of planetesimals in the disc over certain ranges of semi-major axis where the planetesimals’ pericentres are precessing at close to one of the eigenfrequencies of the system, which are the frequencies that set the precession rates of the planets themselves. The planetesimals satisfying this condition are said to be in secular resonance with the planets (e.g. Murray & Dermott, 1999). Yelverton & Kennedy (2018) demonstrated that a gap can form in the disc at the secular resonance locations, as the eccentric planetesimals there spend more time per orbit close to apocentre than at a radius equal to their semi-major axis. The resulting gap is asymmetric, with a width and depth that varies with azimuthal angle, as the inner ring of the disc is offset relative to the outer.
In their paper, they applied this model to HD 107146, finding that it is difficult to produce a gap that is both as wide and as axisymmetric as in the observations of Marino et al. (2018a). The gap in HD 92945 is located at around the same radial distance as that in HD 107146, but is narrower and does not appear to be axisymmetric; the stars also have similar estimated ages. Thus, here we compare the results of their simulation A (with planetary semi-major axes of 3 and 26 au, masses of 1.5 and 0.6 MJup respectively, and initial eccentricities both set to 0.05) with our ALMA observations.
Note that this particular choice of planets is not unique, and certain other configurations of planets are expected to work equally well (see for example Fig. 7 in Yelverton & Kennedy, 2018, and Figure 8 here). It may be possible with some fine-tuning to find a combination of planets which better reproduces the observations, but our aim here is simply to demonstrate that the secular resonance model (SR model hereafter) can explain the disc’s structure at least as well as simple parametric models, rather than to identify a “best fit” system of planets.
Based on the output of simulation A, we simulate observations that we compare directly to the data. To do this, we take the orbital elements of each simulated particle ( particles between 45 and 130 au) at the end of the simulation (100 Myr) and populate their orbits with 300 points with randomly distributed mean anomalies. We impose an initial power law surface density proportional to by weighting each particle according to their initial semi-major axis. This weighting scheme allows us to leave the surface density slope as a free parameter, similar to the parametric model in §3. We translate the resulting density distribution to a dust density field. Finally, we produce synthetic images using RADMC-3D, which we use to compare with observations in visibility space. In order to obtain the best match that we can, we vary some disc parameters such as the total dust mass, , the minimum and maximum initial semi-major axes since the HD 92945 disc is somewhat narrower than that of HD 107146, and the disc orientation on the sky. In addition, we linearly scale the semi-major axis of all particles such that the gap radial location best matches the observations, although we found a best match by only scaling the semi-major axes by 0.99. Therefore, in total we vary 11 parameters: , , , , , PA, four parameters to fit any offset in the 12m and ACA data, and one to scale the simulation.
In the right panels of Figure 5 we present a model image (top) and residuals after subtracting the model visibilities from the observations (bottom). The model image shows a variety of features such as bright narrow rings, spiral features and a gap that is asymmetric as described above. We oriented the disc such that the gap is narrowest towards (PA). We find that residuals of the SR model are similar compared to the previous parametric models, although no emission above is present in these residuals near the disc. Moreover, we find a that is larger only by 11 compared to the circular disc (with data points and a total of 11 free parameters vs 19 for the eccentric disc model presented in §3). This small difference in therefore favours the SR model when compared against the full eccentric disc model presented in §3 because it has fewer parameters (based on a difference test and the Bayesian Information Criterion).
We also compare the SR model with the observations by computing radial profiles as in §2.1. Figure 6 compares the intensity radial profiles obtained from simulated observations using the same uv sampling, but without any noise (continuous and dashed lines) with the radial profiles observed from the observations (shaded regions). Similar to HD 92945, the East and West sides of the disc are symmetric, or at least consistent within the noise in the original data, which is also reproduced with the parametric model with zero eccentricity. The observed gap width and depth are also reproduced by the SR model. Moreover, the SR model has an asymmetry between the NE and SW sides of the disc, which appears similar to the observations. In particular, the SW side is brighter than its opposite at a deprojected distance of 70-80 au (i.e. within the gap), as we found in our observations. Whether this is a true asymmetry or due to a background object is uncertain.
In conclusion, the SR model is able to reproduce the observations suggesting that a planet on a wide orbit at au is not the only plausible scenario to explain the observed gap. New observations could confirm the disc asymmetry, which with a higher S/N would make it possible to better quantify the width a depth of the gap.

5 Discussion
In this section we discuss the potential origins of the gap in the planetesimal disc around HD 92945, and how the new ALMA observations provide constraints to these models or rule them out.
5.1 The gap origin
5.1.1 Planet in situ
Thanks to instruments such as ALMA, SPHERE and GPI, in the last few years multiple gaps have been discovered in nearby circumstellar discs. Most of them in protoplanetary discs either in dust continuum or gas emission (ALMA Partnership et al., 2015; Andrews et al., 2016; Tsukagoshi et al., 2016; Isella et al., 2016; Thalmann et al., 2016; Cieza et al., 2017; van der Plas et al., 2017; Sheehan & Eisner, 2018; Teague et al., 2018; Avenhaus et al., 2018; Fedele et al., 2018; Cla, ), suggesting the presence of planets at tens of au. As shown here and in Marino et al. (2018a), gaps are also observed in some wide debris discs in the distribution of planetesimals traced by ALMA observations. A natural question then arises which is are these gaps in planetesimal discs primordial or secondary? i.e. were these gaps present in the solid distribution that formed these planetesimal discs or were they carved after planetesimal formation?
Let us assume that the gap was created by an ice giant planet, formed in situ early during the protoplanetary disc lifetime (e.g. through pebble or planetesimal accretion), long before the observed planetesimal disc was formed. Such a planet would have created a gap or at least a depression in the dust distribution due to the perturbed gas pressure profile (e.g. Rice et al., 2006; Zhu et al., 2012; Owen, 2014; Rosotti et al., 2016). Therefore, planetesimal formation could have been hindered near the planet orbit after it formed, creating a primordial gap. On the other hand, if the planet attained its final mass after disc dispersal (e.g. through planetesimal accretion), or if the planet formed from the same distribution of planetesimals that formed the debris disc, then the gap around its orbit should be set by the size of its chaotic zone, where the orbits of minor bodies become unstable and are scattered away on short timescales. In this latter case, the gap would be of secondary origin.
In Figure 7 we compare the size of the chaotic zone (blue) and the gap produced in the distribution of mm-sized dust in a protoplanetary disc as a function of planet mass (orange lines), based on numerical simulations by Rosotti et al. (2016). In Rosotti et al. (2016)’s simulations, a planet creates a gap in the gas distribution or at least a pressure maximum outside its orbit in the protoplanetary disc, affecting the dust grains and producing a depression or gap in the dust distribution around its orbit. The protoplanetary disc gap after 400 orbits (0.25 Myr of evolution, orange continuous line) has a very similar size to the chaotic zone (they differ by for planet masses between 1 M⊕ to 1 MJup), but after 3000 orbits (1.9 Myr) the width of the protoplanetary disc gap has converged and is 50-80% larger than the chaotic zone. Therefore, we expect primordial gaps in debris discs to be similar or even larger compared to secondary gaps for the same planet mass.
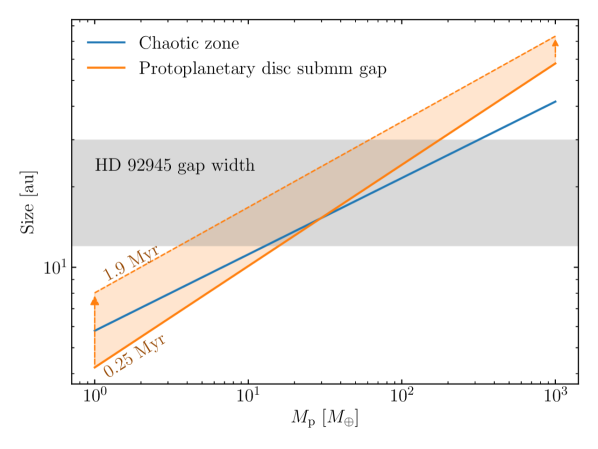
Understanding whether a gap is primordial or secondary is important if we want to infer the mass of a gap clearing planet from debris disc observations. For example, assuming the gap is primordial, the planet mass is only constrained between 3 and 100 M⊕ ( see Figure 7), while if secondary, between 10 to 200 M⊕. A potential way to discern between these two origins is to look for how much material is left within the gap. If the planet is massive enough, in the primordial scenario we expect no dust and planetesimals within the gap, since no dust was able to filter through the gas pressure maxima created outside the planet orbit in the protoplanetary disc. Moreover, planetesimals would potentially only form beyond the chaotic zone according to Figure 7, and would not undergo scattering with the planet as in the secondary scenario. On the other hand, if the gap is of secondary origin and cleared through scattering encounters, some material might still be present inside the gap from solids on highly eccentric orbits that have not been ejected yet depending on the scattering timescales (e.g. Tremaine, 1993).
A caveat to the comparison above is that we are assuming planets have no significant migration. Planet migration through a gaseous disc could significantly change how the dust is distributed, possibly opening an even wider primordial gap if the planet migrates outwards. On the other hand, if the gap is carved through scattering of planetesimals, we expect that those interactions will lead to a change in the planet’s angular momentum and thus semi-major axis (Fernandez & Ip, 1984; Ida et al., 2000; Gomes et al., 2004; Kirsh et al., 2009; Ormel et al., 2012). Planet migration could open a gap significantly wider than the planet’s chaotic zone (Morrison & Kratter, 2018, e.g.), and moreover, it could lead to an asymmetry between the inner and outer edge of the gap (e.g. Marino et al., 2018a).
Planetesimal driven migration of a single planet tends to be inwards (Kirsh et al., 2009) and only occurs at a significant level when the disc mass within a few Hill radii from the planet’s orbit is similar or larger than the planet mass. In order to compute the primordial mass surface density at around 73 au, we use the estimated surface density of millimetre dust for HD 92945 and Equation 7 in (which had a typo where the factor preceding the right hand side should be , and here we correct Marino et al., 2017b)
| (3) |
where is the mass surface density profile (including planetesimals), is the age of the system, is the maximum planetesimal size and is the primordial surface density at 1 au in units of the Minimum Mass Solar Nebula (MMSN, Weidenschilling, 1977; Hayashi, 1981). We estimate the initial surface density of solids at 73 au to be 0.005-0.01 M⊕ au-2 (depending on the age), which integrated between 50 to 130 au results in a total disc mass of 100-200 M⊕ (for an age of 100-300 Myr, respectively)333Assuming a radial mass distribution proportional to , consistent with the derived slope of millimetre grains and Equation 6 in Marino et al. (2017b).. This means that for an ice giant planet of M⊕ there would have been enough solid mass around its orbit to drive migration.
Current constraints in the presence of planets at au by the Gemini/NICI planet-finding campaign are not very constraining, only discarding planets more massive than MJup (Biller et al., 2013). Future direct imaging observations with new generation instruments such as JWST/NIRCam or MIRI (e.g. Beichman et al., 2010), or with ground base 30m class telescopes such as E-ELT/METIS (Quanz et al., 2015) or TMT/MICHI (Packham et al., 2018) could detect planets with masses much lower than current upper limits and that are consistent with the measured gap width and depth, i.e. below 10 MJup.
A potential problem in the planet in situ scenario is that these observations also showed an asymmetry in the disc when comparing the North East and South West sides. Strong asymmetries are not expected if the planet is on a circular orbit. Hence, if the asymmetry is real and not due to a background object (e.g. sub-millimetre galaxy), then this would indicate that the gap has a different origin. Moreover, ice giant planet formation via core accretion at these distances is challenging according to various planet formation models (e.g. Safronov, 1969; Pollack et al., 1996; Kenyon & Bromley, 2008; Bitsch et al., 2015), although these remain to be tested at these distances.
5.1.2 Inner planets
Because planets might be more likely to be found at smaller radii, it is worth considering scenarios in which an inner planet with a semi-major axis () within 50 au could produce a gap at around 73 au. In protoplanetary discs, multiple gaps in the gas and dust distribution could be produced by multiple spiral arms excited by a single planet (Dong et al., 2017; Bae et al., 2017). However, in those models the most external of these gaps is still too close to the planet orbit to explain our observations that suggest (assuming it is caused by an inner planet interior to ).
A secondary origin gap could also be produced by inner planets. Four scenarios have been investigated so far: mean motion resonances (MMRs, Tabeshian & Wiegert, 2016; Regály et al., 2018), resonant trapping by a migrating planet (Wyatt, 2003, 2006), secular interactions (Pearce & Wyatt, 2015) and secular resonances (Yelverton & Kennedy, 2018). In the first case, a massive planet can create both interior and exterior gaps, especially at the 3:2 MMR. An interior planet at au on a low eccentricity orbit () would open a gap at the right location ( au). Such a gap would be asymmetric, with a width that varies as a function of azimuth similar to our observations. In order to explain the observed width ( au), a 6-19 MJup mass planet would be required (Tabeshian & Wiegert, 2016), which is just below the most conservative direct imaging upper limit of MJup (assuming an age of 100 Myr Biller et al., 2013). However, such a high planet mass means that the planet would push the inner edge of the disc out to a radius au (outer edge of its chaotic zone), which is inconsistent with our observations. Therefore, we rule out this scenario.
In the second scenario, a planet migrated outwards through a disc trapping planetesimals in mean motion resonances and eccentric orbits. As shown by Wyatt (2006), small dust generated from collisions of planetesimals trapped in the 2:1 MMR exit the resonance due to radiation pressure, creating an axisymmetric wide disc with a semi-filled gap, resembling the double peaked profile seen in HD 92945’s HST observations (Golimowski et al., 2011). Such a structure would be absent at longer wavelengths that trace larger grains; however, our ALMA observations show that the gap is also present in the distribution of millimetre-sized grains. This means that the planet that migrated must be less massive than M⊕ (Equation 14 in Wyatt, 2006), which would make the resonant population unlikely444The planet would need to migrate at au Myr-1, too slow to sweep and capture a significant number of planetesimals. Alternatively, if the migration is stochastic, planetesimals might be only weakly bound to the resonance, making it easier for larger grains to exit and form an axisymmetric structure.
In the third scenario, a planet on an initially eccentric orbit (e.g. after a scattering event with an inner planet) interacts with a planetesimal disc of similar mass, opening a gap through secular interactions that is asymmetric. During the evolution multiple scattering events damp the planet’s eccentricity and its orbit is circularised, ending up near the inner edge of the disc on an orbit close to where the surface density peaks interior to the gap. This scenario could produce a gap similar to the one observed as well as the possible asymmetry since the gap width varies with azimuth in that model. The inner planet must be of a similar mass compared to the disc, i.e. M⊕ based on disc mass estimates discussed in §5.1.1. However, Pearce & Wyatt (2015) showed that the resulting inner edge of the disc is not steep, but rather smooth as a result of planet disc interactions. This is in contradiction with our observations that suggest a very steep inner edge, although it is not clear if the addition of an inner planet closer in (that scattered the outer planet) in Pearce & Wyatt (2015) simulations could lead to a steeper inner edge.
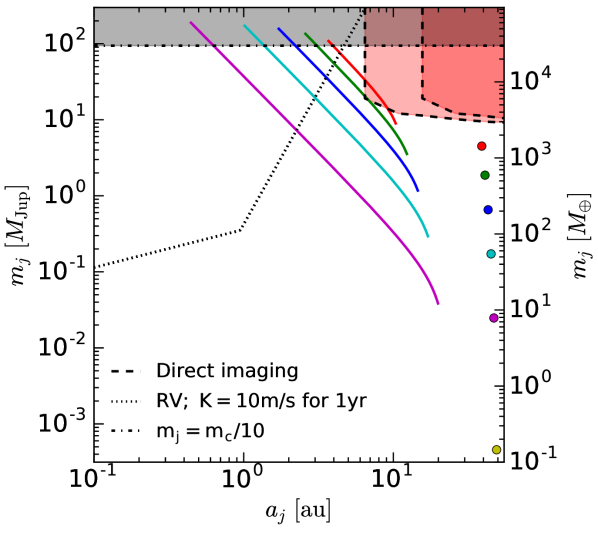
Finally, in §4 we showed how two inner planets could open a gap within the planetesimal disc through secular resonances. Figure 8 summarises the constraints on these planets assuming that the outermost planet truncated the disc at 50 au, the gap is located at 73 au, and the gap is set in less than 300 Myr (upper limit for the age of the system). The outermost planet must have a semi-major axis of about around 40-45 au depending on its mass, which would be constrained to be larger than 10 M⊕ (otherwise the timescale to create the gap is longer than 300 Myr, Yelverton & Kennedy, 2018). Its mass, on the other hand, must be lower than direct imaging upper limits of MJup (derived by Biller et al., 2013, and represented with a red shaded region). These upper limits only apply to the innermost planet if it has a semi-major axis larger than au. Its semi-major axis also cannot be larger than 20 au to ensure dynamical (considering that the planets cannot be closer than 5 mutual Hill radii). There is no current lower limit for its semi-major axis. However, if it was smaller than 2 au, it would be readily detectable using radial velocities (dotted line), although we are not aware of any published radial velocity detection or upper limit even though it has been monitored, therefore planets could still lie in that region. Note that the location of the gap and timescales depend on the planet mass and semi-major axis ratios, therefore the exact planet masses and semi-major axes required to explain the observations are degenerate. As commented before in §5.1.1 new generation instruments in JWST or 30m class telescopes could detect planets beyond 10 au with masses significantly lower than current direct imaging limits, potentially confirming or ruling out this scenario.
5.1.3 No planet scenarios
Multiple alternative scenarios have been proposed to explain gaps in protoplanetary discs that do not require the presence of planets. Some invoke changes in the dust opacities near condensation fronts (snow lines) due to changes in grain growth efficiency (Zhang et al., 2015; Okuzumi et al., 2016), or gas dust interactions (Takahashi & Inutsuka, 2014; Ruge et al., 2016; Flock et al., 2017; Dullemond & Penzlin, 2018). We do not expect that local decrements in the dust opacities due to dust growth in protoplanetary discs to be imprinted in the radial distribution of dust produced by planetesimal grinding, unless planetesimal properties are different within these gaps (e.g. strength, size distribution, formation efficiency). On the other hand, gas dust interactions can affect the solid mass distribution and thus the planetesimal distribution inherits this gap. Therefore, the latter is a potential explanation for the observed gaps in debris discs too.
5.2 Volatile delivery
If the gap was of secondary origin and cleared by a planet on an orbit at 73 au, some of the planetesimals would get scattered inwards where they could deliver volatiles such as water to inner planets that potentially formed dry (e.g. like Earth, Morbidelli et al., 2000). Although a single planet on a circular orbit cannot scatter material into the temperate regions where habitable planet may lie in this system (Bonsor & Wyatt, 2012; Bonsor et al., 2012), additional inner planets can facilitate this process as long as the orbits of the two outermost planets are close enough. This is because the pericentre of particles interacting with a single planet is constrained to be larger than , which depends on the planet mass and initial Tisserand parameter (or orbital eccentricity and inclination, Tisserand, 1896). If the second outermost planet has a semi-major axis smaller than , particles will never get scattered by the second outermost planet and inward scattering will be hindered.
Although the planet in situ scenario does not require the presence of additional inner planets, these cannot be ruled out either. In order to assess whether inward scattering is possible, here we consider the best case scenario: the second planet is as far out as possible without disrupting the disc, i.e. on an orbit at au. Therefore one of the most basic conditions for inward scattering and volatile delivery from 73 au in HD 92945 is that the au, such that planetesimals can get scattered by the second planet. Using Equation 4 in Marino et al. (2018b) and assuming that planetesimals have zero eccentricities and inclinations, we estimate that only if the planet at 73 au is more massive than 7 M⊕ could volatile rich planetesimals reach 50 au and be scattered further in. For higher initial eccentricities and inclinations the minimum planet mass is lower, e.g. with initial eccentricities of 0.05 and inclinations of the minimum planet mass is 2 M⊕. For HD 107146 on the other hand, the same analysis leads to a minimum planet mass of M⊕ assuming zero initial eccentricities and inclinations since the inner radius is at 40 rather than 50 au. Larger initial eccentricities of 0.05 and inclinations of translate into a lower minimum mass of 20 M⊕. These planet masses for HD 107146 are at the limit since planet masses much higher than M⊕ were found to be inconsistent with the width and depth of the gap (Marino et al., 2018a). We conclude therefore that the material cleared from the gaps in HD 107146 and HD 92945 could have been delivered to inner planets if: the gap is of secondary origin and cleared by a planet in situ; a second outer planet lies near the inner radius of the disc; and the planet within the gap is more massive than 7 M⊕ in HD 92945 and 30 M⊕ in HD 107146 (assuming very low initial eccentricities and inclinations).
5.3 Gas mass upper limits
Here we derive gas mass upper limits based on the flux limits derived in §2.2 for CO (3-2) and HCN (4-3) line emission. Given the low gas densities expected in the disc, non-LTE effects can be significant and conversion from flux to gas mass is highly dependent on the density of collisional partners and gas kinetic temperature, which remain largely unknown (Matrà et al., 2015). We use the code developed by Matrà et al. (2018a) to compute CO gas masses given the flux upper limit, a wide density range of collisional partners (to cover from radiation dominated to LTE regimes), a range of kinetic temperatures, and taking into account the cosmic microwave background, stellar and dust thermal radiation. We find a CO gas mass upper limit of M⊕ in the radiation dominated regime, which is orders of magnitude greater than M⊕ if CO were in LTE. For HCN there is no equivalent non-LTE tool to calculate line populations, hence we simply assume LTE. Assuming a kinetic temperature of 40 K (worst case scenario), we find a HCN gas upper limit of M⊕.
Assuming the most conservative upper limit of M⊕ of CO and that primordial gas could still be present (with a CO to H2 ratio of 10-4), we find an upper limit on the CO column density of cm-2 and cm-2. This is only enough to shield CO molecules by a factor of 660 (Visser et al., 2009), resulting in a photodissociation timescale of 80 kyr, i.e. too short for CO to survive for the age of the system (100-300 Myr). Note that such a high H2 column density is inconsistent with CO being in non-LTE (see Figure 4 in Matrà et al., 2015), hence the photodissociation timescale of CO must be even shorter.
Therefore, since either CO or HCN gas present in the system would need to be of secondary origin (i.e. released from solids in the collisional cascade), we can link the upper limits above with the volatile composition of planetesimals (e.g. Zuckerman & Song, 2012; Marino et al., 2016; Matrà et al., 2017a, b). We find that the CO non-detection is not surprising as even with an extreme 99% CO mass fraction in planetesimals, the mass loss rate in the HD 92945 debris disc is not high enough to maintain detectable levels of CO (using equation 2 in Matrà et al., 2017b). For HCN, we find a mass fraction upper limit of 3% in planetesimals, which is an order of magnitude higher than the inferred levels in comets (Mumma & Charnley, 2011), therefore not constraining when assuming LTE.
6 Conclusions
In this paper we have presented the first ALMA observations of the debris disc around the nearby K0 star HD 92945. After HD 107146, this is the second system that we know of with an outer belt of planetesimals divided by a gap. These observations reveal the emission of mm-sized grains for which radiation forces are negligible; therefore tracing the distribution of the parent planetesimals. We find that the planetesimal belt emission is detected from 50 to 140 au, similar to HST images tracing the m-sized grains pushed out by radiation pressure. Within this broad debris disc we found that the disc has a gap at about 73 au, which was tentatively detected with HST. Interestingly, we found that the disc looks asymmetric, with the South West side being brighter and with a no clear depletion or gap at 75 au. Whether this is a true disc asymmetry or due to background emission is not clear and new observations are necessary to assess the nature of the observed asymmetry.
In order to constrain the disc morphology we fit the data in visibility space using a parametric disc model. We found that the disc has steep inner and outer edges roughly at 52 and 121 au, with a close to flat surface density of dust in between (as expected from collisional evolution models). More importantly, we found that the gap has a mean radius of au, a width of au and a fractional depth of . By comparing N-body simulations with the data assuming that the planetesimal gap was cleared by a planet at 73 au, we found that the planet must have a mass lower than 0.6 MJup and even lower than 10 M⊕ if no material is present in the planet co-rotation region. We also allowed for a disc global eccentricity, taking into account how the surface density should vary as a function of azimuth. We found that the disc eccentricity is consistent with zero, with a 2 upper limit of 0.1
Motivated by the putative disc asymmetry we explored a dynamical model where two inner planets can open a gap through secular resonances in a broad exterior debris disc. We showed that this scenario can explain both qualitatively and quantitatively the observations, i.e. the gap location, width and potential asymmetry. Using this model we obtain a fit to the observations that is as good as with a full parametric model which has more free parameters. The putative inner planets are consistent with direct imaging upper limits, and represent an alternative scenario to explain the gap through planet disc interactions. If the disc is truly asymmetric, this would strongly favour this scenario.
Given the ubiquity of gaps found in protoplanetary discs in recent years, we also discussed the possibility of the gap being primordial rather than secondary, i.e. originated from a gap in the solid/dust distribution in a protoplanetary disc before the planetesimal disc was formed. A primordial gap could be caused by the presence of a planet in situ or due to gas dust interactions, shaping the distribution of dust grains that will grow to form a planetesimal disc. We ruled out other primordial scenarios that can open gaps at multiple radii via spiral wakes in protoplanetary discs and snow lines. If the gap is of secondary origin instead (i.e. the gap was carved after planetesimal formation), scenarios invoking mean motion resonances, resonant trapping after gas dispersal, and secular interactions between a planetesimal disc and a planet of similar mass are disfavoured.
Finally, we found no CO or HCN line emission. These non-detections are still consistent with icy planetesimals in HD 92945’s debris disc with volatile compositions similar to Solar System comets. Some of these planetesimals could have been scattered in if the gap is of secondary origin, cleared by a planet at 73 au and an additional planet is on an orbit near the disc inner edge at 50 au.
Acknowledgements
MB acknowledges support from the Deutsche Forschungsgemeinschaft (DFG) through project Kr 2164/15-1. VF’s postdoctoral fellowship is supported by the Exoplanet Science Initiative at the Jet Propulsion Laboratory, California Inst. of Technology, under a contract with the National Aeronautics and Space Administration. GMK is supported by the Royal Society as a Royal Society University Research Fellow. LM acknowledges support from the Smithsonian Institution as a Submillimeter Array (SMA) Fellow. This paper makes use of the following ALMA data: ADS/JAO.ALMA#2016.1.00104.S. ALMA is a partnership of ESO (representing its member states), NSF (USA) and NINS (Japan), together with NRC (Canada), MOST and ASIAA (Taiwan), and KASI (Republic of Korea), in cooperation with the Republic of Chile. The Joint ALMA Observatory is operated by ESO, AUI/NRAO and NAOJ.
References
- ALMA Partnership et al. (2015) ALMA Partnership et al., 2015, ApJ, 808, L3
- Andrews et al. (2016) Andrews S. M., et al., 2016, ApJ, 820, L40
- Avenhaus et al. (2018) Avenhaus H., et al., 2018, ApJ, 863, 44
- Backman et al. (2009) Backman D., et al., 2009, ApJ, 690, 1522
- Bae et al. (2017) Bae J., Zhu Z., Hartmann L., 2017, ApJ, 850, 201
- Ballering et al. (2014) Ballering N. P., Rieke G. H., Gáspár A., 2014, ApJ, 793, 57
- Beichman et al. (2010) Beichman C. A., et al., 2010, PASP, 122, 162
- Biller et al. (2013) Biller B. A., et al., 2013, ApJ, 777, 160
- Bitsch et al. (2015) Bitsch B., Lambrechts M., Johansen A., 2015, A&A, 582, A112
- Boley et al. (2012) Boley A. C., Payne M. J., Corder S., Dent W. R. F., Ford E. B., Shabram M., 2012, ApJ, 750, L21
- Bonsor & Wyatt (2012) Bonsor A., Wyatt M. C., 2012, MNRAS, 420, 2990
- Bonsor et al. (2012) Bonsor A., Augereau J.-C., Thébault P., 2012, A&A, 548, A104
- Booth et al. (2016) Booth M., et al., 2016, MNRAS, 460, L10
- Booth et al. (2019) Booth M., et al., 2019, MNRAS, 482, 3443
- Bowler & Nielsen (2018) Bowler B. P., Nielsen E. L., 2018, Occurrence Rates from Direct Imaging Surveys. p. 155, doi:10.1007/978-3-319-55333-7_155
- Chen et al. (2009) Chen C. H., Sheehan P., Watson D. M., Manoj P., Najita J. R., 2009, ApJ, 701, 1367
- Cieza et al. (2017) Cieza L. A., et al., 2017, ApJ, 851, L23
- (18)
- Dent et al. (2014) Dent W. R. F., et al., 2014, Science, 343, 1490
- Dong et al. (2017) Dong R., Li S., Chiang E., Li H., 2017, ApJ, 843, 127
- Dullemond & Penzlin (2018) Dullemond C. P., Penzlin A. B. T., 2018, A&A, 609, A50
- Fedele et al. (2018) Fedele D., et al., 2018, A&A, 610, A24
- Feldt et al. (2017) Feldt M., et al., 2017, A&A, 601, A7
- Fernandez & Ip (1984) Fernandez J. A., Ip W.-H., 1984, Icarus, 58, 109
- Flock et al. (2017) Flock M., Nelson R. P., Turner N. J., Bertrang G. H. M., Carrasco-González C., Henning T., Lyra W., Teague R., 2017, ApJ, 850, 131
- Foreman-Mackey (2016) Foreman-Mackey D., 2016, The Journal of Open Source Software, 24
- Gaia Collaboration et al. (2018) Gaia Collaboration et al., 2018, A&A, 616, A1
- Geiler & Krivov (2017) Geiler F., Krivov A. V., 2017, MNRAS, 468, 959
- Golimowski et al. (2011) Golimowski D. A., et al., 2011, AJ, 142, 30
- Gomes et al. (2004) Gomes R. S., Morbidelli A., Levison H. F., 2004, Icarus, 170, 492
- Hayashi (1981) Hayashi C., 1981, Progress of Theoretical Physics Supplement, 70, 35
- Holland et al. (2017) Holland W. S., et al., 2017, MNRAS, 470, 3606
- Hughes et al. (2018) Hughes A. M., Duchêne G., Matthews B. C., 2018, ARA&A, 56, 541
- Ida et al. (2000) Ida S., Bryden G., Lin D. N. C., Tanaka H., 2000, ApJ, 534, 428
- Isella et al. (2016) Isella A., et al., 2016, Phys. Rev. Lett., 117, 251101
- Kalas et al. (2005) Kalas P., Graham J. R., Clampin M., 2005, Nature, 435, 1067
- Kennedy & Wyatt (2014) Kennedy G. M., Wyatt M. C., 2014, MNRAS, 444, 3164
- Kenyon & Bromley (2008) Kenyon S. J., Bromley B. C., 2008, ApJS, 179, 451
- Kirsh et al. (2009) Kirsh D. R., Duncan M., Brasser R., Levison H. F., 2009, Icarus, 199, 197
- Klahr & Lin (2005) Klahr H., Lin D. N. C., 2005, ApJ, 632, 1113
- Kral et al. (2018) Kral Q., Marino S., Wyatt M. C., Kama M., Matra L., 2018, arXiv e-prints,
- Krist et al. (2012) Krist J. E., Stapelfeldt K. R., Bryden G., Plavchan P., 2012, AJ, 144, 45
- Lagrange et al. (2009) Lagrange A.-M., Desort M., Galland F., Udry S., Mayor M., 2009, A&A, 495, 335
- Lazzoni et al. (2018) Lazzoni C., et al., 2018, A&A, 611, A43
- Lyra & Lin (2013) Lyra W., Lin M.-K., 2013, ApJ, 775, 17
- Marino et al. (2016) Marino S., et al., 2016, MNRAS, 460, 2933
- Marino et al. (2017a) Marino S., et al., 2017a, MNRAS, 465, 2595
- Marino et al. (2017b) Marino S., Wyatt M. C., Kennedy G. M., Holland W., Matrà L., Shannon A., Ivison R. J., 2017b, MNRAS, 469, 3518
- Marino et al. (2018a) Marino S., et al., 2018a, MNRAS, 479, 5423
- Marino et al. (2018b) Marino S., et al., 2018b, MNRAS, 479, 5423
- Marois et al. (2008) Marois C., Macintosh B., Barman T., Zuckerman B., Song I., Patience J., Lafrenière D., Doyon R., 2008, Science, 322, 1348
- Marois et al. (2010) Marois C., Zuckerman B., Konopacky Q. M., Macintosh B., Barman T., 2010, Nature, 468, 1080
- Matrà et al. (2015) Matrà L., Panić O., Wyatt M. C., Dent W. R. F., 2015, MNRAS, 447, 3936
- Matrà et al. (2017a) Matrà L., et al., 2017a, MNRAS, 464, 1415
- Matrà et al. (2017b) Matrà L., et al., 2017b, ApJ, 842, 9
- Matrà et al. (2018a) Matrà L., Wilner D. J., Öberg K. I., Andrews S. M., Loomis R. A., Wyatt M. C., Dent W. R. F., 2018a, ApJ, 853, 147
- Matrà et al. (2018b) Matrà L., Marino S., Kennedy G. M., Wyatt M. C., Öberg K. I., Wilner D. J., 2018b, ApJ, 859, 72
- Matthews et al. (2018) Matthews E., et al., 2018, MNRAS, 480, 2757
- McMullin et al. (2007) McMullin J. P., Waters B., Schiebel D., Young W., Golap K., 2007, in Shaw R. A., Hill F., Bell D. J., eds, Astronomical Society of the Pacific Conference Series Vol. 376, Astronomical Data Analysis Software and Systems XVI. p. 127
- Moór et al. (2015) Moór A., et al., 2015, ApJ, 814, 42
- Morales et al. (2009) Morales F. Y., et al., 2009, ApJ, 699, 1067
- Morbidelli et al. (2000) Morbidelli A., Chambers J., Lunine J. I., Petit J. M., Robert F., Valsecchi G. B., Cyr K. E., 2000, Meteoritics and Planetary Science, 35, 1309
- Morrison & Kratter (2018) Morrison S. J., Kratter K. M., 2018, MNRAS, 481, 5180
- Morrison & Malhotra (2015) Morrison S., Malhotra R., 2015, ApJ, 799, 41
- Mumma & Charnley (2011) Mumma M. J., Charnley S. B., 2011, ARA&A, 49, 471
- Murray & Dermott (1999) Murray C. D., Dermott S. F., 1999, Solar system dynamics
- Mustill & Wyatt (2009) Mustill A. J., Wyatt M. C., 2009, MNRAS, 399, 1403
- Okuzumi et al. (2016) Okuzumi S., Momose M., Sirono S.-i., Kobayashi H., Tanaka H., 2016, ApJ, 821, 82
- Ormel et al. (2012) Ormel C. W., Ida S., Tanaka H., 2012, ApJ, 758, 80
- Owen (2014) Owen J. E., 2014, ApJ, 789, 59
- Packham et al. (2018) Packham C., et al., 2018, in Ground-based and Airborne Instrumentation for Astronomy VII. p. 10702A0, doi:10.1117/12.2313967
- Pan et al. (2016) Pan M., Nesvold E. R., Kuchner M. J., 2016, ApJ, 832, 81
- Panić et al. (2013) Panić O., et al., 2013, MNRAS, 435, 1037
- Pearce & Wyatt (2015) Pearce T. D., Wyatt M. C., 2015, MNRAS, 453, 3329
- Pinte et al. (2016) Pinte C., Dent W. R. F., Ménard F., Hales A., Hill T., Cortes P., de Gregorio-Monsalvo I., 2016, ApJ, 816, 25
- Plavchan et al. (2009) Plavchan P., Werner M. W., Chen C. H., Stapelfeldt K. R., Su K. Y. L., Stauffer J. R., Song I., 2009, ApJ, 698, 1068
- Pollack et al. (1996) Pollack J. B., Hubickyj O., Bodenheimer P., Lissauer J. J., Podolak M., Greenzweig Y., 1996, Icarus, 124, 62
- Quanz et al. (2015) Quanz S. P., Crossfield I., Meyer M. R., Schmalzl E., Held J., 2015, International Journal of Astrobiology, 14, 279
- Rameau et al. (2013) Rameau J., et al., 2013, ApJ, 772, L15
- Rameau et al. (2016) Rameau J., et al., 2016, ApJ, 822, L29
- Read et al. (2018) Read M. J., Wyatt M. C., Marino S., Kennedy G. M., 2018, MNRAS, 475, 4953
- Regály et al. (2018) Regály Z., Dencs Z., Moór A., Kovács T., 2018, MNRAS, 473, 3547
- Ricci et al. (2015) Ricci L., Carpenter J. M., Fu B., Hughes A. M., Corder S., Isella A., 2015, ApJ, 798, 124
- Rice et al. (2006) Rice W. K. M., Armitage P. J., Wood K., Lodato G., 2006, MNRAS, 373, 1619
- Richert et al. (2018) Richert A. J. W., Lyra W., Kuchner M. J., 2018, ApJ, 856, 41
- Rosotti et al. (2016) Rosotti G. P., Juhasz A., Booth R. A., Clarke C. J., 2016, MNRAS, 459, 2790
- Ruge et al. (2016) Ruge J. P., Flock M., Wolf S., Dzyurkevich N., Fromang S., Henning T., Klahr H., Meheut H., 2016, A&A, 590, A17
- Safronov (1969) Safronov V. S., 1969, Evoliutsiia doplanetnogo oblaka.
- Schneider et al. (2014) Schneider G., et al., 2014, AJ, 148, 59
- Schneider et al. (2016) Schneider G., et al., 2016, AJ, 152, 64
- Schüppler et al. (2016) Schüppler C., Krivov A. V., Löhne T., Booth M., Kirchschlager F., Wolf S., 2016, MNRAS, 461, 2146
- Shannon et al. (2016) Shannon A., Bonsor A., Kral Q., Matthews E., 2016, MNRAS, 462, L116
- Sheehan & Eisner (2018) Sheehan P. D., Eisner J. A., 2018, ApJ, 857, 18
- Simpson et al. (2015) Simpson J. M., et al., 2015, ApJ, 799, 81
- Song et al. (2004) Song I., Zuckerman B., Bessell M. S., 2004, ApJ, 614, L125
- Stark et al. (2014) Stark C. C., Schneider G., Weinberger A. J., Debes J. H., Grady C. A., Jang-Condell H., Kuchner M. J., 2014, ApJ, 789, 58
- Su et al. (2013) Su K. Y. L., et al., 2013, ApJ, 763, 118
- Su et al. (2015) Su K. Y. L., Morrison S., Malhotra R., Smith P. S., Balog Z., Rieke G. H., 2015, ApJ, 799, 146
- Su et al. (2017) Su K. Y. L., et al., 2017, AJ, 154, 225
- Tabeshian & Wiegert (2016) Tabeshian M., Wiegert P. A., 2016, ApJ, 818, 159
- Takahashi & Inutsuka (2014) Takahashi S. Z., Inutsuka S.-i., 2014, ApJ, 794, 55
- Teague et al. (2018) Teague R., Bae J., Bergin E. A., Birnstiel T., Foreman-Mackey D., 2018, ApJ, 860, L12
- Thalmann et al. (2016) Thalmann C., et al., 2016, ApJ, 828, L17
- Tisserand (1896) Tisserand F., 1896, Traité de mécanique céleste. No. v. 4 in Traité de mécanique céleste, Gauthier-Villars, https://books.google.co.uk/books?id=hNjinQAACAAJ
- Tremaine (1993) Tremaine S., 1993, in Phillips J. A., Thorsett S. E., Kulkarni S. R., eds, Astronomical Society of the Pacific Conference Series Vol. 36, Planets Around Pulsars. pp 335–344
- Tsukagoshi et al. (2016) Tsukagoshi T., et al., 2016, ApJ, 829, L35
- Visser et al. (2009) Visser R., van Dishoeck E. F., Black J. H., 2009, A&A, 503, 323
- Weidenschilling (1977) Weidenschilling S. J., 1977, Ap&SS, 51, 153
- Wilner et al. (2018) Wilner D. J., MacGregor M. A., Andrews S. M., Hughes A. M., Matthews B., Su K., 2018, ApJ, 855, 56
- Wisdom (1980) Wisdom J., 1980, AJ, 85, 1122
- Wyatt (2003) Wyatt M. C., 2003, ApJ, 598, 1321
- Wyatt (2006) Wyatt M. C., 2006, ApJ, 639, 1153
- Wyatt (2008) Wyatt M. C., 2008, ARA&A, 46, 339
- Wyatt et al. (1999) Wyatt M. C., Dermott S. F., Telesco C. M., Fisher R. S., Grogan K., Holmes E. K., Piña R. K., 1999, ApJ, 527, 918
- Yelverton & Kennedy (2018) Yelverton B., Kennedy G. M., 2018, MNRAS, 479, 2673
- Zhang et al. (2015) Zhang K., Blake G., Bergin E., 2015, in IAU General Assembly. p. 2256118
- Zhu et al. (2012) Zhu Z., Nelson R. P., Dong R., Espaillat C., Hartmann L., 2012, ApJ, 755, 6
- Zuckerman & Song (2012) Zuckerman B., Song I., 2012, ApJ, 758, 77
- van der Plas et al. (2017) van der Plas G., et al., 2017, A&A, 597, A32