C2H and N2H+ observations of Planck Galactic cold clumps
Abstract
A survey of C2H and N2H+ toward Planck Galactic cold clumps (PGCCs) was performed using the Purple Mountain Observatory’s 13.7 m telescope. C2H and N2H+ were chosen to study the chemical evolutionary states of PGCCs. Among 121 observed molecular cores associated with PGCCs, 71 and 58 are detected with C2H and N2H+ , respectively. The detected lines of most sources can be fitted with a single component with compatible VLSR and line widths, which confirms that these PGCC cores are very cold (with gas temperatures 9–21 K) and quiescent while still dominanted by turbulence. The ratio between the column densities of C2H and N2H+ ((C2H)/(N2H+)) is found to be a good tracer for the evolutionary states of PGCC cores. Gas-grain chemical model can reproduce the decreasing trend of (C2H)/(N2H+) as a function of time. The cores with the lowest abundances of N2H+ ([N2H+] ) are the youngest, and have nearly constant abundances of C2H. In evolved cores with [N2H+] , abundances of C2H drop quickly as the exhaustion of carbon atoms. Although these PGCC cores are in different evolutionary states, they are all quite young ( yr) with (C2H) (N2H+). Mapping observations are carried out toward 20 PGCC cores. The PGCC cores in Cepheus have lower (C2H)/(N2H+) and larger line widths compared with those in Taurus. This implies that PGCC cores in Taurus are less chemically evolved than those in Cepheus.
1 Introduction
The Planck satellite (Tauber et al., 2010; Planck Collaboration et al., 2011a) carried out the first all sky survey in the submillimeter to millimeter range with unprecedented sensitivity and provides a catalog of cold clumps of interstellar matter in the Galaxy. The Cold Clump Catalog of Planck Objects (C3POs) released by Planck Collaboration et al. (2011b) consists of 10 342 cold sources that stand out against a warmer environment. The C3PO clumps are cold with dust temperatures ranging from 7 to 19 K, peaking around 13 K. Among the C3PO clumps, 915 early cold cores (ECCs) were identified with most valid detection and lowest dust temperatures (15K). Planck Collaboration et al. (2016) released 13,188 Planck Catalog of Galactic cold clumps (PGCCs) as the full version of the ECC catalog. The characteristics of coldness and quiescence make them good targets to investigate the initial conditions of star formation, including both dynamic processes and chemical states (Juvela et al., 2010, 2012, 2015; Parikka et al., 2015; Tatematsu et al., 2017; Juvela et al., 2018).
Soon after the release of ECC data, surveys with different molecular spectral lines were conducted. Observations with the transitions of 12CO, 13CO, and C18O toward 674 Planck cold clumps selected from the ECC catalog were performed by Wu et al. (2012) using the 13.7 m telescope of the Purple Mountain Observatory (PMO). Mapping observations of the same transitions were followed up soon (Liu et al., 2012, 2013; Meng et al., 2013; Liu et al., 2015, 2016; Zhang et al., 2016; Liu et al., 2018a, b; Zhang et al., 2018; Tang et al., 2018). Meanwhile, single-point observations of HCO+ and HCN toward 621 CO-selected cores associated with PGCCs were performed (Yuan et al., 2016). Thanks to these follow-up studies, the morphologies and dynamic properties of PGCCs are fairly well understood. However, their locations in the evolutionary sequence are still unclear. The chemical properties, essential for understanding the evolutionary states of PGCCs, were not given enough attention. To investigate the chemical evolutionary states of PGCCs, probing a large sample of such sources with molecule pair of the early formed molecule ethynyl radical (C2H) (Beuther et al., 2008) and the daughter molecule diazenylium (N2H+) (Aikawa et al., 2003; Tatematsu et al., 2017) will be helpful.
C2H is the simplest hydrocarbon molecule with the carbon-carbon triple bond (CC). Since being firstly detected by Tucker et al. (1974), C2H is found to be widely distributed and detected in all evolutionary stages of star-forming regions (Sanhueza et al., 2013; Jiang et al., 2015). Beuther et al. (2008) suggest that this molecule could also be used to study the cold gas of forming stars to investigate their initial conditions. Meanwhile, N2H+ is also an excellent tracer of dense molecular cloud cores (Caselli et al., 2002). N2H+ is durable in cold and dense regions owing to the depletions of its destroyers such as CO and the delayed freeze-out of its precursors such as N2. We expect that C2H and N2H+ are enhanced in different evolutionary states of PGCCs.
In this paper, we report a survey of C2H and N2H+ toward the gas structures enclosed by emission of 13CO in the PGCCs (Liu et al., 2012; Meng et al., 2013; Zhang et al., 2016). We have compared the spectra of our detected species with those of CO and its isotopologues as well as HCO+ and HCN (Wu et al., 2012; Yuan et al., 2016) to reveal the characteristics of C2H and N2H+in PGCCs. We also have compared the abundances of C2H and N2H+ with those predicted by gas-grain chemical model to investigate the evolutionary states of single PGCC and PGCCs in different regions. This paper is arranged as follows. We present a description of the sample and observations in Sect. 2. The results of the molecular line observations are presented in Sect. 3. We discuss the properties of these two species and the chemical evolutionary states of detected sources in Sect. 4. We summarize the paper in Sect. 5.
| Species | Transition | Freq (GHz) | (D2) | (K) |
|---|---|---|---|---|
| C2H | , , | 87.28415 | 0.14 | 4.191 |
| , , | 87.31692 | 1.42 | 4.192 | |
| , , | 87.32862 | 0.71 | 4.191 | |
| , , | 87.402 | 0.71 | 4.196 | |
| , , | 87.40716 | 0.28 | 4.197 | |
| , , | 87.44651 | 0.15 | 4.196 | |
| N2H+ | , | 93.17188 | 37.2 | 4.471 |
| , | 93.1737 | 62.0 | 4.471 | |
| , | 93.17613 | 12.4 | 4.471 |
2 Sample and observation
2.1 Sample characteristics
A sample consisting of 121 CO-selected cores with strongest emission of 13CO (Wu et al., 2012) was selected to be observed in C2H and N2H+ . Spectra of of CO, 13CO and C18O at the center of observed cores were extracted from previous mapping observations (Liu et al., 2012; Meng et al., 2013; Zhang et al., 2016). The preliminary work of deriving line parameters from these CO data was done as described in Yuan et al. (2016). Basic information about our detected sources including their equatorial coordinates, distances, H2 column densities of host PGCCs derived from dust continuum ((H2)) (Planck Collaboration et al., 2016), and CO parameters are listed in Table 2.
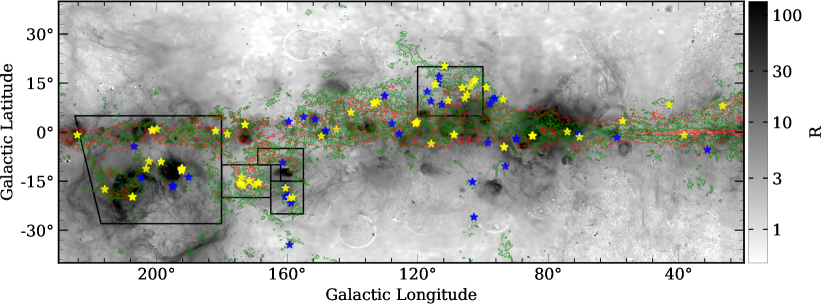
Distances of these sources are adopted from the literature (Wu et al., 2012; Planck Collaboration et al., 2016). For sources with no available distances in the literature, distances are adopted as the values with the highest probabilities given by a Bayesian distance calculator (Reid et al., 2016). The distances calculated by the Bayesian distance calculator are on average 30 percent higher than those adopted from the literature (Table 2). Figure 1 shows the spatial distribution of the observed sources. These sources are biased toward nearby star-forming regions while the Galactic plane is under-represented. These properties are inherited from the whole sample of ECCs and CO-selected cores (Wu et al., 2012; Yuan et al., 2016). The red and green contours represent Planck 353 m continuum emission and Planck CO emission detected by the High Frequency Instrument on the Planck Satellite (Planck HFI) (Planck Collaboration et al., 2014), respectively. Distribution of Planck 353 m continuum is well correlated with that of CO detected by Planck HFI. The Planck HFI CO emission traces relatively dense regions on Galactic scale, and our CO-selected cores tend to locate at the margins of these regions.
The excitation temperatures of CO (Tex(CO)) for our CO-selected cores range from 9 K to 21 K. The mean value of Tex(CO) is 14 K with a standard error of 0.3 K, and it is slightly larger than the value in Wu et al. (2012) and the average dust temperature (13 K) for C3POs (Planck Collaboration et al., 2011b). Sources in our sample generally have higher H2 column densities than those of CO cores in other PGCC samples. The H2 column densities of CO cores in nearby star-forming regions range from 1 1021 cm-2 to 10 1021 cm-2 with a mean value of 2.2 1021 cm-2(Meng et al., 2013), and those in the Galactic second quadrant range from 0.6 1021 cm-2 to 36 1021 cm-2 with a mean value of 8 1021 cm-2 (Zhang et al., 2016). The H2 column densities ((H2)) of our CO-selected cores are derived from (13CO) adopting the 12C/13C isotope ratio and CO abundance ([CO]) as the values in the solar neighbor with a Galactocentric distance 8 kpc (Pineda et al., 2013; Wilson & Rood, 1994), 63 and 910-5, respectively. (H2) cover the range of (3-70) 1021 cm-2 with a mean value of 2.2 1022 cm-2.
Futhermore, 20 cores with valid detection of C2H and N2H+ were selected to perform mapping observations.
2.2 Observations
Single-point observations of C2H and N2H+ (Table 1) were carried out with the PMO 13.7 m telescope from 2015 May to June. The nine-beam Superconducting Spectroscopic Array Receiver (SSAR) was working as the front end in sideband separation mode (see Shan et al. 2012). An FFTS spectrometer was used as back end, which has a total bandwidth of 1 GHz and 16 384 channels, corresponding to a velocity resolution of 0.21 km s-1 for C2H and 0.20 km s-1 for N2H+ . C2H was observed in the lower sideband (LSB), while N2H+ was observed simultaneously in the upper sideband (USB). The half-power beam width and main beam efficiency at 90 GHz are about 56″ and 0.5, respectively. The pointing accuracy of the telescope was better than 4″. The typical system temperature (Tsys) is around 170 K and varies about ten percent. Spectra of C2H and N2H+ were integrated till the rms of Ta ranged from 20 mK to 50 mK.
Mapping observations were performed in June 2015 using the PMO 13.7 m telescope. Same front and back ends were employed as in single-point observations. The on-the-fly (OTF) observation mode was applied. The antenna continuously scanned a region of 18′ 18′ centered on CO-selected cores with a scan speed of 20″ s-1. Only the central 10′ 10′ regions were cut out for further analyses because the edges of the OTF maps are very noisy. Data were meshed with a grid spacing of 30″.
The GILDAS111http://www.iram.fr/IRAMFR/GILDAS/doc/html/class-html package including CLASS and GREG (Guilloteau & Lucas, 2000; Pety, 2005) was used to reduce the data. All figures were plotted using the open source Python package, Matplotlib.
3 Results
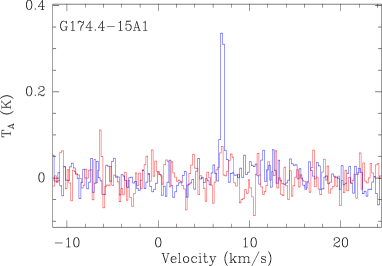
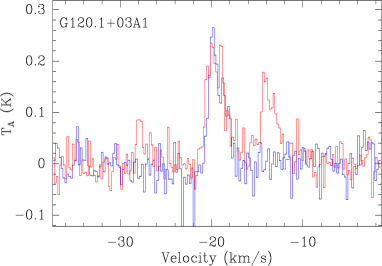
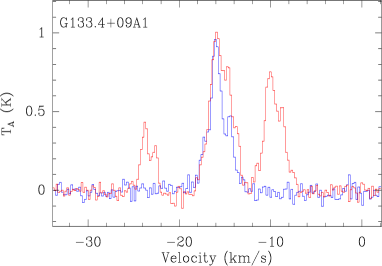
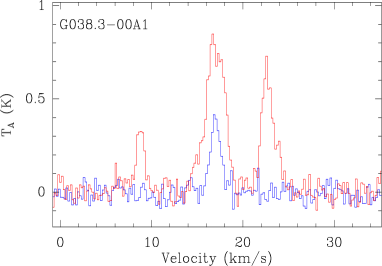
Among the 121 observed CO-selected molecular cores, 71 have detection of C2H and 58 have detection of N2H+ . Cores with or without detection of C2H and N2H+ are denoted in Figure 1 with stars in different colors, and their projected spatial distributions have no obvious deviations. Typical spectra of several cores with antenna temperature (Ta) of C2H , , larger or smaller than or comparable with that of N2H+ are shown in Figure 2 as examples.
Mapping observations of C2H and N2H+ are performed toward 20 cores. Both lines are detected in all sources except N2H+ in G167.2-15A1.
3.1 Line parameters
All six hyperfine structure (HFS) components are well resolved for C2H of detected sources, while only the spectra of the main component C2H , , are exhibited in Figure 2. However, only three groups of HFS components of N2H+ , as listed in Table 1, are well resolved for most of the sources. is the main group of N2H+ and consists of two hyperfine lines labeled as and with a velocity separation 1 km s-1.
Using the HFS fitting program in GILDAS/CLASS, we performed hyperfine structure fitting toward spectra of C2H and N2H+ . In the HFS fitting, the optical depths of different hyperfine lines are all assumed as Gaussian with the same width, and the excitation temperatures for different HFS components are the same (Feng et al., 2016). Hyperfine structure fitting can give the parameters such as line width (V) and velocity (VLSR) very precisely. The results of HFS fittings are listed in Table 3, including Ta, VLSR, V, and integrated intensities () of C2H , , and N2H+ , . The optical depths are not listed because most of the lines we detect are optical thin ( 0.1), and hence HFS fitting can not provide accurate values of optical depths.
The Ta of C2H , , ranges from 0.08 K to 0.93 K with a median value of 0.50 K. The Ta of N2H+ , , ranges from 0.10 K to 1.03 K with a median value of 0.45 K. The sources with detection of N2H+ all have detection of C2H . Only 10 sources have Ta of N2H+ , larger than that of C2H , , by more than 3 (Table 3), and all of them have line widths of C2H and C18O larger than the average line width of C2H (1.0 km s-1) except G104.4+06A1.
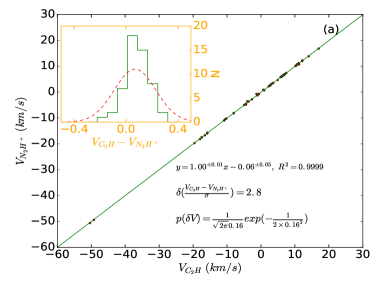
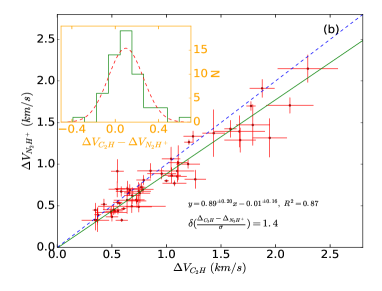
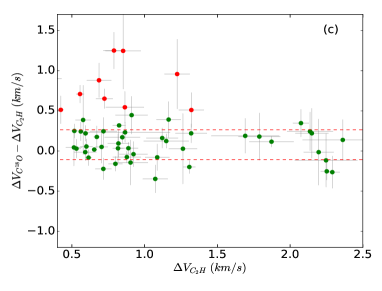
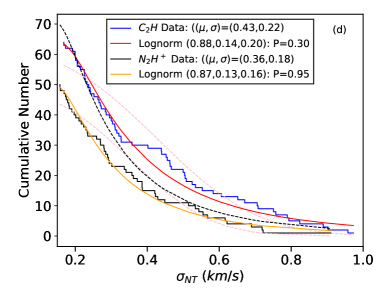
Figure 3(a) shows the correlation between the VLSR of C2H and N2H+ . They agree with each other very well, with smaller than three, where . From Figure 3(b), one can see that line widths of C2H and N2H+ are also quite consistent with each other and ((-) is smaller than 1.5, where . The mean widths of 13CO and C18O of these CO-selected cores with valid detection of C2H are 2.0 and 1.3 km s-1, slightly larger than the mean width of C2H . However, from Figure 3(c) it can be clearly seen that the larger mean width of C18O mainly results from several sources (shown as red dots) with V smaller than 1 km s-1. The V of C2H are well consistent with those of C18O for the rest of the sources, especially for sources with widest line widths. Figure 3(d) shows the cumulative distribution functions of nonthermal velocities (Equation 5) traced by C2H and N2H+ . Nonthermal velocity dispersions, , traced by C2H and N2H+ can be better fitted with lognormal distributions than Gaussian distributions. The probability density function function of lognormally distributed random variable () can be expressed with three parameters (a, b, c) as
| (1) |
The mean () and variance () of lognormally distributed random variable can be expressed as
| (2) |
| (3) |
The three parameters of the best lognormal fits are (0.88, 0.14, 0.20) and (0.87, 0.13, 0.16) (Figure 3(d)), corresponding to mean values and standard deviations (, ) of the fitted curves (0.43, 0.32) km s-1 and (0.36, 0.25) km s-1, respectively.
3.2 Derived parameters
The dispersions of thermal velocity () and one dimensional nonthermal velocity () can be calculated as
| (4) |
| (5) |
where , is the gas kinetic temperature which is adopted as excitation temperature of CO, k the Boltzmann’s constant, mX the molecular mass, mH the mass of atomic hydrogen, and = /n(H2) the mean molecular weight of the gas (Kauffmann et al., 2008). is adopted as 2.72 assuming n(He)/n(H)=0.18 and ignoring the mass contributions of metals. The derived from emission of C2H and that of N2H+ are listed in the second and third columns of Table 4, respectively.
Under the assumption of local thermal equilibrium (LTE), column densities of C2H and N2H+ can be calculated through (e.g. Mangum & Shirley, 2015)
| (6) |
| (7) |
where J(T) = , Tbg (2.73 K) is the temperature of the cosmic background radiation, h is the Planck constant, and the beam-filling factor f is assumed as unit. The permanent dipole moment , line strength Sij, partition function Q and upper level energy Eu were adopted from the Cologne Database for Molecular Spectroscopy 222http://www.astro.uni-koeln.de/cdms/ and partly listed in Table 1.
Unfortunately, the excitation temperatures cannot be given by HFS fittings because most lines we detected are optical thin and the exact beam filling factors are unknown for single-point sources. Besides, the assumption that the excitation temperatures of different hyperfine components stay the same is not always valid. For example, the differences among the excitation temperatures of different hyperfine components of C2H can be as large as several K in L1498 (Padovani et al., 2009). Therefore, the excitation temperatures T K were adopted. For optical thin lines, the assumption, Tex = , was usually made to give the lower limits to the column densities (Miettinen, 2014). It is also consistent with the typical excitation temperatures of the N2H+ (5 K) in dense cloud cores (Caselli et al., 2002). To explore how large uncertainties are brought in under this estimation, we also calculated the column densities with excitation temperatures deduced from spectra of of 12CO and 13CO. The column densities of C2H and N2H+ as well as their ratios calculated based on the two set of Tex assumptions are listed in the fourth-to-sixth and seventh-to-ninth columns of Table 4, respectively. It is clear from Table 4 that column densities calculated based on the two set of Tex assumptions do not deviate much from each other, and most of them have deviations less than 15 percent. An underestimation of Tex (5 K) would introduce a higher through Equation 7, which compensates for the reduced column densities introduced by it in Equation 6. The values of (C2H)/(N2H+) change little within a wide range of temperatures (Pan et al., 2017). The column densities calculated with Tex = 5 K are adopted for further discussions.
3.3 Mapping parameters
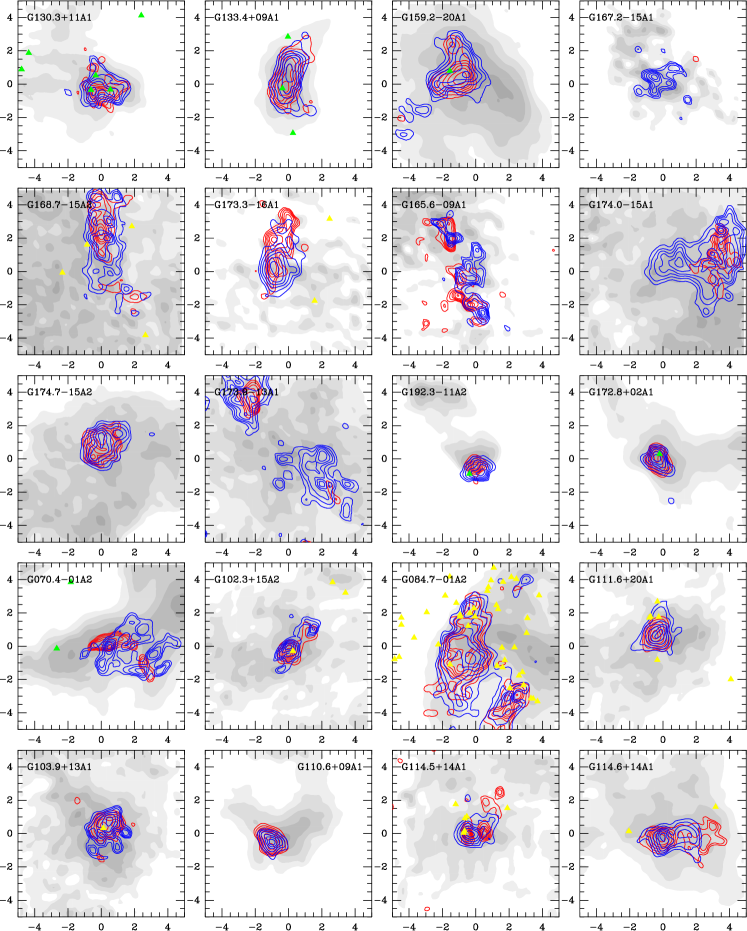
Among sources with detection of C2H and N2H+ , 20 were performed with mapping observations, and all have detection of C2H and N2H+ with a 0.08 K km s-1 except G167.2-15A1. The nondetection of N2H+ for G167.2-15A1 might be due to its weak emission (Ta 0.33 K) and shorter integration time ( 0.13 K) compared with other mapped sources. The integrated intensities of C2H and N2H+ are shown as blue and red contours in Figure 4, respectively.
From each map shown in Figure 4, one or several substructures are resolved in one CO-select core. The contour with half maximum value is taken as the border line of a substructure. Additional labels are used to distinguish different substructures if there are two or more substructures resolved within a single map, for example “NE” if one substructure was in the northeast relative to its neighbor substructure. Since the emission regions of C2H and N2H+ are well correlated with each other, each substructure resolved from C2H map is matched with its nearest substructure resolved from N2H+ map, and a same location label is given to them. The radius () of a substructure is defined as the radius of a circle whose area is equal to the area enclosed by the border line of that substructure. In total there are 26 substructures resolved with 0.5′. The average value of the radius for C2H substructures is 1.30.1 arcmin (0.280.05 pc), and it is larger than that for N2H+ substructures, 0.90.1 arcmin (0.220.05 pc). The names of their harboring CO-selected cores and their location labels are listed in the first two columns of Table 5. Process of calculating the peak column densities is the same as that in Sect. 3.2. Parameters including peak positions, VLSR, V, and column densities of peak points as well as the radii of these substructures are also listed in Table 5.
Because the abundances of C2H are less variant than those of N2H+, the masses of substructures () are calculated based on emission of C2H through the equation
| (8) |
where the abundance of C2H ([C2H]) is assumed as 10-8. It is reasonable because abundances of C2H are nearly constant in diffuse molecular gas (42 10-8) (Beuther et al., 2008), starless cores such as TMC-1 (3-5 10-8) (Liszt et al., 2018) and prestellar cores such as L1498 (0.80.1 10-8) (Padovani et al., 2009) as well as PGCCs (Sect. 4.2). The uncertainty of calculated contributed by the assumption of fixed [C2H] can be as high as a factor of five. Virial masses () of dense cores assumed as gravitationally bounded spheres with can be calculated though (MacLaren et al., 1988; Williams et al., 1994)
| (9) |
where ), G is the gravitational constant, . The , and virial parameters / are listed in the last three columns of Table 5.
The derived virial parameters range from 1.2 to 21.8 with a median value of 4.8. Among the 26 substructures resolved, 20 have virial parameters smaller than five. Considering the possible underestimations of the masses of substructures for the overestimations of [C2H], most of these substructures in PGCCs are approximately virialized and slightly confined by external pressures (Pattle et al., 2015).
4 Discussion
4.1 Kinematics
All sources have only one velocity component with single peak, except for G120+03A1 and G133.4+09A1 whose spectra exhibit blue asymmetry. A double-peaked line is blue or red asymmetric if its higher peak skews to the blue or red side. Combining with an optically thin line, an optically thick double-peaked line can be further identified as a blue profile if its higher peak is shifted blueward with V = (Vthick-Vthin)/Vthin -0.25 (Myers et al., 1996; Mardones et al., 1997). A red profile would have V 0.25 (Wu et al., 2007; Yuan et al., 2013). However, the characteristic blue profile will appear only if the molecular tracer has a suitable optical depth and critical density (Wu & Evans, 2003; Evans et al., 2005) within a source with warmer center regions (Zhou et al., 1993). Blue profiles are not expected to be common in PGCCs with dark and cold center regions.
Similar profiles may also be produced by multicomponents of target sources. In G120+03A1, spectrum of HCO+ was identified as red profile (with higher red peak) by Yuan et al. (2016). Although emission of N2H+ is weak and blended by several hyperfine structures, a small blue component can still be resolved. Spectrum of C18O has two peaks similar to that of C2H while that of 13CO shows a flat-topped single peak (Yuan et al., 2016). In G133.4+09A1, both spectra of C2H and N2H+ show two resolvable peaks. A small red component can also be resolved with C18O , but not with HCN and HCO+ (Yuan et al., 2016). Spectrum of HCO+ shows broad line wings and there are multiple peaks in the spectrum of 12CO . These two sources may consist of two or more velocity components. Only the main velocity components are fitted since the remaining velocity components can not be resolved fully in spectra of different species.
The widths of different lines might be the result of the different level of turbulence on different spatial scales. V of C2H and N2H+ agrees with each other well (Figure 3(c)) because they have similar critical densities (Ungerechts et al., 1997) and both trace the inner dense regions of PGCCs. The mean width of C2H is about 1.0 km s-1 and it is similar to that of HCN in Yuan et al. (2016) and that of C18O in Wu et al. (2012). It is also close to the mean width of 13CO for CO-selected cores in the molecular complexes of Orion (0.9 km s-1), Taurus (1.1 km s-1), and California (1.4 km s-1) (Liu et al., 2012; Meng et al., 2013). For most of these PGCC sources, the line widths seem to be uniform on different scales. It may indicate that turbulence has been dissipated on smaller scales. The entire PGCC region is nearly “transition-to-coherence” because of the low density, thus cutoff wavelength below which Alfven waves cannot propagate and support turbulence (Goodman et al., 1998) is large. Below coherence scale, constant residual line widths persist throughout the volume (Tafalla, 2005). The region outside such a coherent core is more like filled with cloud components with a radially power-law distributed velocity field. The Larson’s V-r relationship (Larson, 1981) can not be applied to PGCCs (Zhang et al., 2016) because the H2 column densities of PGCCs are lowest compared with other star formation samples such as infrared dark clouds (IRDCs) (Wu et al., 2012) thus 13CO and C18O traced the relatively dense components in PGCCs. It is also compatible with the concept that these PGCCs are quiescent and most of them seem to be in transitions from clouds to dense clumps (Wu et al., 2012). The cloud components may contribute to the broad line widths of C18O of several sources with narrow C2H lines. Sources with broad line widths of C2H and N2H+ may be more evolved since sources with emission of N2H+ stronger than that of C2H all have line widths broader than 1 km s-1.
The typical nonthermal velocity traced by C2H in CO-selected cores is comparable with that in dense cloud cores (Caselli et al., 2002), whose typical line width of NH3 is 0.5 km s-1 which corresponds to a 0.2 km s-1. The ratio between and ranges from 0.7 to 4.7 with a median value of 1.6. Among 71 sources, 12 have / 1. It is consistent with the idea that supersonic isothermal turbulence is well developed with a lognormal velocity distribution (Veltchev et al., 2016) in outer part of PGCC and decays as the radius decreases. The residual line width in coherent region persists due to subsonic or low supersonic turbulence (Goodman et al., 1998; Myers, 1998). Emission of C2H and N2H+ traces the inner coherent regions of PGCCs, where radial density distributions of pressure-confined Bonnor-Ebert spheres (Pattle et al., 2015) may be established.
All these characteristics indicate that most of our selected cores in PGCCs are very cold (with an average gas temperature 14 K), quiescent and with single component, while still turbulence dominant. However, there are still some obviously more envolved sources. Our sample is made up of different components including clouds, relatively isolated cold clumps and evolved gas cores. Emission of C2H and N2H+ originates from the inner dense regions but may have different states of chemical evolutions (Sect. 4.2).
4.2 Abundances of C2H and N2H+
These early cores in our sample with low temperatures but high enough column densities to shield interstellar radiation field (Tatematsu et al., 2017) are good sites to test the evolutions of those two kind of molecules. C2H is generally the most abundant hydrocarbon (Liszt et al., 2018) in diffuse molecular gas and dark cloud gas. It has been known to be a tracer of photo-dissociation regions (PDRs) (Fuente et al., 1993). Recent evidences suggest that it could also trace the cold and dense gas associated with the early stage of star formation. In dark clouds, C2H has an extended distribution (Beuther et al., 2008). In the early stage of dark clouds, C2H is thought to reside in the inner regions instead of in the external photo-dissociated layers of clumps (Sanhueza et al., 2013). In the latter stages C2H can still has a high abundance in the outer region when it is oxidized to form other species such as CO, OH and H2O in the dense center regions (Beuther et al., 2008; Miettinen, 2014; Feng et al., 2016). However, N2H+ usually shows centrally peaked emission for its durability in dense regions. N2H+ forms through proton transfer reaction (Aikawa et al., 2001). N2H+ is impeded if CO is present in the gas phase for the competition of CO to react with its precursor H through . Furthermore, CO also plays the role of the direct destroyer of N2H+ through reaction (Bergin et al., 2002). Anticorrelation between N2H+ and gas-phase CO was presented in envelopes around the pre-stellars and protostars, such as L1544 (Caselli et al., 1999) and IC 5146 (Bergin et al., 2001). In star-forming cores, heating and radiations of protostars will lead to the generation of C2H and the destruction of N2H+, which make it hard to predict the evolution trends of the abundances of these two species.
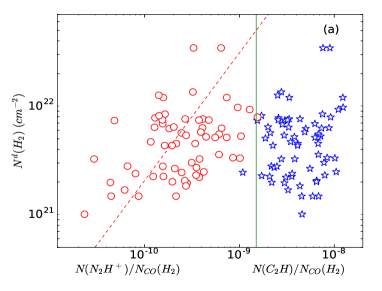
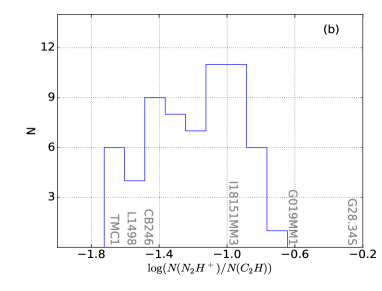
Figure 5(a) shows the relation between the abundances of C2H and N2H+ of CO-selected cores and the H2 column densities of their host PGCCs ((H2)). The H2 column densities of CO-selected cores derived from emission of 13CO ((H2)) are adopted to calculate the abundances of C2H and N2H+. (H2) are much lower than (H2) for relatively large beams (4.3′ at 350 m) (Planck Collaboration et al., 2016) and should be treated as the densities of the environments of CO-selected cores. N2H+ abundances of CO-selected cores are positively correlated with (H2), but with a large dispersion (Figure 5(a)). It suggests that N2H+ abundances are positively correlated with the evolutionary ages if the cores in PGCCs with larger (H2) tend to be more evolved. On the other hand, the abundances of C2H are weakly correlated with (H2). From Figure 5(a), it is clear to see that the abundances of C2H and N2H+ of our sources locate in two different regions separated by a green line. Our sources all have (C2H) (N2H+) thus in pretty young states ( yr). The abundances of C2H and N2H+ as well as their ratios can serve as intrinsic parameters to trace the evolutionary states of PGCC gas cores. Figure 5(b) shows the number density distribution of the ratio between the column density of N2H+ and that of C2H ((N2H+)/(C2H)). The value of (N2H+)/(C2H) for typical starless cores and IRDCs are also shown in Figure 5(b). Our PGCC cores generally have (N2H+)/(C2H) higher than those of starless cores such as TMC-1 and L1498, but lower than those of IRDCs such as G028.34S, which is consistent with the result of (Tatematsu et al., 2017).
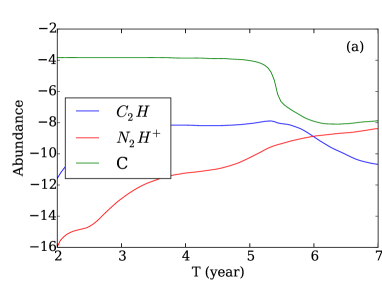
We built a very simple gas-grain chemical model to unveil the evolution of C2H and N2H+ in cold gas. In this simulation, a single-point (zero-dimension) chemical code is run under an ordinary differential equation solver DVODE (Brown et al., 1989) with most physical parameters fixed and dynamical processes are not coupled. The temperature is adopted as 10 K, the visible extinction = 5, the grain radius = 0.03 m, and the rate of ionization by cosmic-ray is set as (Lee et al., 2004). At such a low temperature that is lower than the thermal evaporation temperature of CO 22–25 K (Bergin et al., 1995; Ripple et al., 2013), there is nearly no feedback of gas particles except H2 from grain surfaces, although grain surface reactions are very active. The gas phase reactions were downloaded from UMIST Database for Astrochemistry 2012 (McElroy et al., 2013) with 6 173 reactions for 467 kind of species. The metal abundances are adopted as the low-metal abundance case of Graedel et al. (1982). Initially, the elements are all ionized except the hydrogen atoms. The volume density n(H2) is fixed as 105 cm-3, and the results of the simulation are shown in Figure 6(a). Adopting a lower or higher n(H2) has little influence on the evolution trends of the abundances except the timescale, especially for the early stages when the chemical processes are mainly driven by the atoms and ions generated from photo-dissociation and photo-ionization during prior more diffuse phase instead of externally induced ionizations. It is natural that the abundances of species will evolve slower or faster under a lower or higher n(H2) (Pan et al., 2017). The values along the x-axis of Figure 6(a) have limited meanings and should not be interpreted as the exact chemical ages considering the variances of volume densities of PGCCs. Instead, we find that [C2H]/[N2H+] is an intrinsic parameter to trace the evolutionary state of a PGCC.
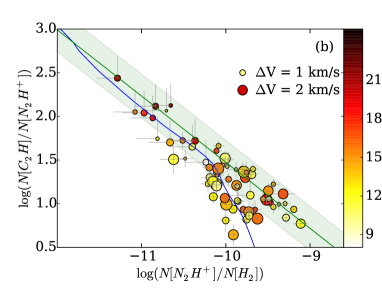
In early stage, the abundance of N2H+ increases with time while that of C2H stays nearly constant. The abundance of C2H drops down quickly after the carbon atoms are depleted, while that of N2H+ keeps growing. As shown in Figure 6(b), the ratio between the abundance of N2H+ and that of C2H can trace the evolution states of PGCCs quite well. The cores with the lowest abundances of N2H+ () are in the youngest evolutionary states compared with other sources, and most of them are located in the green band shown in Figure 6(b) whose center line has a power-law index of 0.75. The power law index is slightly lower than one maybe because of the depletions of CO (Liu et al., 2012) and thus the H2 column densities in evolved regions are underestimated. For more evolved cores, [N2H+] versus [C2H]/[N2H+] deviates from the green band for dropping down of the abundances of C2H. The cores with high abundances of N2H+ () but still located in the green band may have the harshest depletions of CO. Another possibility is that the C2H emission regions in these cores are dominated by the outer regions where the abundances of C2H have not yet dropped down. Observations with higher resolutions will be helpful to investigate the depletions in the most inner dense regions of PGCCs, and exam the validity and general applicability of this molecule pair as a tracer of evolutionary state.
4.3 Emission regions
Most of our mapped sources are located in nearby star forming regions such as Taurus and Cepheus (Wu et al., 2012, and the references therein). Cepheus region consists of two velocity components called feature A (300–500 pc) and feature C (800 pc), and they are associated with the Gould belt and the local arm or Orion arm, respectively (Olano et al., 2006). The distance of taurus ranges from 130–160 pc (Loinard et al., 2011). Among these 20 mapped CO-selected cores in PGCCs, six are associated with IRAS and eight with 2MASS objects, both within CO emission regions. There are no cores associated with both IRAS and 2MASS objects. This is unlike the case of PGCCs in the second quadrant (with 98°l180° and -4°b10° as defined by Dame et al. (1987)) in which most of the associated IR objects are IRAS point sources and the rest are 2MASS objects (Zhang et al., 2016). However, the ratio of the count of cores associated with IR objects to the size of the sample (referred as core-associated-ratio below) of our sample (70%) is similar to that in nearby star forming regions (Meng et al., 2013). However, among the eight cores in Taurus region (see Table 5), only three (G159.2-20A1, G168.7-15A2, G173.3-16A1) are associated with IRAS or 2MASS objects. The high core-associated-ratio is mainly contributed by cores in Cepheus region. Among the eight cores in Cepheus region (see Table 5), only one (G110.6+09A1) is starless. The C2H and N2H+ substructures are much smaller than their host clumps and CO emission regions. The average value of (CO)/(C2H) and (CO)/(N2H+) is 2.3 and 2.9, respectively. Objects locating within the border line of a substructure are considered as its associated objects. In total there are ten substructures associated with IRAS or 2MASS objects. Among them, six are in Cepheus and only one in Taurus. The PGCCs in Cepheus region may be generally more evolved than those in the Taurus Complex.
The average value of line widths of substructures in Cepheus, 1.13 km s-1, is larger than that in Taurus region, 0.88 km s-1 (Table 5). The average value of (C2H)/(N2H+) for the cores in Taurus, 1.33, is larger than that in Cepheus, 1.15. Similarly the average value of the (C2H)/(N2H+) in Taurus, 23, is larger than that in Cepheus, 13. These characteristics again confirm that PGCCs in Taurus are less evolved than those in Cepheus. For young sources such as PGCCs in Taurus, distribution of C2H is much more extended than that of N2H+. For more evolved sources like PGCCs in Cepheus, N2H+ is generated in the dense region (Tatematsu et al., 2017) and the area of emission region of N2H+ continuously expands till close to that of C2H.
Our finding is compatible with the statistics of Myers (1998). Among four complexes, Taurus, Perseus, Orion, and Cepheus, the percentage of supercritical and cluster associated cores is lowest in Taurus, while highest in Cepheus. The cores in Cepheus tend to be dynamically and chemically more evolved than those in Taurus, because the Taurus complex is younger than Cepheus complex as a whole. Another possibility is that the materials in Cepheus are significantly affected by the large void between Cassiopeia and Cepheus (Grenier et al., 1989; Tachihara et al., 2005).
Among the four mapped cores not located in Taurus and Cepheus, C2H emission regions of two cores (G192.3-11A2, G172.8+02A1) is quite compact, while those of the other two cores (G070.4-01A2, G084.7-01A2) are extended. Emission of C2H with annular distribution is detected in G070.4-01A2 (Figure 4). Similar emission distribution had been detected by Tatematsu et al. (2017) in PGCC with C2S surrounding centrally peaked N2H+. Abundance of C2H is positively correlated with that of C2S in dark cloud cores beacuse of the reactions (Suzuki et al., 1992). Emission of C2H shows annular distribution attributed to the depletion of C2H in the central regions of prestellar cores such as L1498 (Padovani et al., 2009). Similar C2H distributions are also observed in various massive star formation regions (Li et al., 2012) such as NGC 6334I (Walsh et al., 2010) and PDRs around H ii regions (Pilleri et al., 2013). Although the depletion factors of CO are usually not high ( 2) in early PGCC cores (Liu et al., 2013), the depletion factors in C2H emission dominant region can not be ignored considering the dipole moment of C2H (0.77 D; Wilson & Green 1977) is about seven times higher than that of CO. Depletions in the densest places of PGCCs may produce the annular distributions of C2H emission regions.
5 Summary
We have made C2H and N2H+ single-point observations toward 121 CO-selected cores of PGCCs. The detection rate is 59% for C2H and 48% for N2H+ . Line parameters were derived through HFS fittings. Our column densities calculated assuming Tex equal to 5 K and excitation temperatures of CO are well consistent with each other, and most of them (65%) have deviations of less than 15 percent. We also mapped 20 sources with the same transitions. Substructures were resolved from maps of C2H and N2H+ with peaks slightly dislocated. Our main findings are as follows:
1. Most spectra of detected sources are single peaked. Sources that show red and blue profiles in HCO+ are identified with multicomponents under joint analysis of spectra of C2H, N2H+, CO as well as HCN and HCO+. Centroid velocities and line widths of C2H and N2H+ are consistent with each other. Most sources (83%) have nonthermal velocities comparable with or larger than thermal velocities. All those characteristics indicate that most of our CO-selected cores in PGCCs are very cold (9–21 K) and quiescent while still dominanted by turbulence.
2. We find that the ratio between the abundance of C2H and N2H+ is a good tracer of evolution for PGCCs. Gas grain chemical model based on UMIST network is applied to fit (C2H)/(N2H+) versus (N2H+). At the most early stage ((C2H)/(N2H+) 10), abundance of C2H is nearly invariable while that of N2H+ increases continuously. Later on ((C2H)/(N2H+) 10), abundance of N2H+ keeps growing while that of C2H drops rapidly as the exhaustion of carbon atoms. These PGCCs in our sample are in quite early stages and chemistry driven by residual atoms and ions generated from photo-dissociation and photo-ionization during prior more diffuse phase still plays a important role.
3. The PGCC cores mapped are approximately virialized ( 5) and slightly confined by external pressures. Sources in Cepheus have lower ratios between (C2H) and (N2H+) and larger line widths compared with those in Taurus. The probability of finding an associated IR source within PGCC substructures in Cepheus, 55%, is larger than that in Taurus, 10%. These indicate that PGCCs in Taurus are less chemically evolved than those in Cepheus. The C2H emission region of G074.4+01A2 shows an annular distribution.
References
- Aikawa et al. (2003) Aikawa, Y., Ohashi, N., & Herbst, E. 2003, ApJ, 593, 906
- Aikawa et al. (2001) Aikawa, Y., Ohashi, N., Inutsuka, S.-i., Herbst, E., & Takakuwa, S. 2001, ApJ, 552, 639
- Bergin et al. (2002) Bergin, E. A., Alves, J., Huard, T., & Lada, C. J. 2002, ApJ, 570, L101
- Bergin et al. (2001) Bergin, E. A., Ciardi, D. R., Lada, C. J., Alves, J., & Lada, E. A. 2001, ApJ, 557, 209
- Bergin et al. (1995) Bergin, E. A., Langer, W. D., & Goldsmith, P. F. 1995, ApJ, 441, 222
- Beuther et al. (2008) Beuther, H., Semenov, D., Henning, T., & Linz, H. 2008, ApJ, 675, L33
- Brown et al. (1989) Brown, P., Byrne, G., & Hindmarsh, A. 1989, SIAM Journal on Scientific and Statistical Computing, 10, 1038
- Caselli et al. (2002) Caselli, P., Benson, P. J., Myers, P. C., & Tafalla, M. 2002, ApJ, 572, 238
- Caselli et al. (1999) Caselli, P., Walmsley, C. M., Tafalla, M., Dore, L., & Myers, P. C. 1999, ApJ, 523, L165
- Dame et al. (2001) Dame, T. M., Hartmann, D., & Thaddeus, P. 2001, ApJ, 547, 792
- Dame et al. (1987) Dame, T. M., Ungerechts, H., Cohen, R. S., et al. 1987, ApJ, 322, 706
- Evans et al. (2005) Evans, II, N. J., Lee, J.-E., Rawlings, J. M. C., & Choi, M. 2005, ApJ, 626, 919
- Feng et al. (2016) Feng, S., Beuther, H., Zhang, Q., et al. 2016, A&A, 592, A21
- Finkbeiner (2003) Finkbeiner, D. P. 2003, ApJS, 146, 407
- Fuente et al. (1993) Fuente, A., Martin-Pintado, J., Cernicharo, J., & Bachiller, R. 1993, A&A, 276, 473
- Goodman et al. (1998) Goodman, A. A., Barranco, J. A., Wilner, D. J., & Heyer, M. H. 1998, ApJ, 504, 223
- Graedel et al. (1982) Graedel, T. E., Langer, W. D., & Frerking, M. A. 1982, ApJS, 48, 321
- Grenier et al. (1989) Grenier, I. A., Lebrun, F., Arnaud, M., Dame, T. M., & Thaddeus, P. 1989, ApJ, 347, 231
- Guilloteau & Lucas (2000) Guilloteau, S. & Lucas, R. 2000, in Astronomical Society of the Pacific Conference Series, Vol. 217, Imaging at Radio through Submillimeter Wavelengths, ed. J. G. Mangum & S. J. E. Radford, 299
- Hirota et al. (2004) Hirota, T., Maezawa, H., & Yamamoto, S. 2004, ApJ, 617, 399
- Jiang et al. (2015) Jiang, X.-J., Liu, H. B., Zhang, Q., et al. 2015, ApJ, 808, 114
- Juvela et al. (2018) Juvela, M., Malinen, J., Montillaud, J., et al. 2018, A&A, 614, A83
- Juvela et al. (2015) Juvela, M., Ristorcelli, I., Marshall, D. J., et al. 2015, A&A, 584, A93
- Juvela et al. (2010) Juvela, M., Ristorcelli, I., Montier, L. A., et al. 2010, A&A, 518, L93
- Juvela et al. (2012) Juvela, M., Ristorcelli, I., Pagani, L., et al. 2012, A&A, 541, A12
- Kauffmann et al. (2008) Kauffmann, J., Bertoldi, F., Bourke, T. L., Evans, II, N. J., & Lee, C. W. 2008, A&A, 487, 993
- Larson (1981) Larson, R. B. 1981, MNRAS, 194, 809
- Lee et al. (2004) Lee, J.-E., Bergin, E. A., & Evans, II, N. J. 2004, ApJ, 617, 360
- Li et al. (2012) Li, J., Wang, J., Gu, Q., Zhang, Z.-y., & Zheng, X. 2012, ApJ, 745, 47
- Liszt et al. (2018) Liszt, H., Gerin, M., Beasley, A., & Pety, J. 2018, ApJ, 856, 151
- Liu et al. (2018a) Liu, T., Kim, K.-T., Juvela, M., et al. 2018a, ApJS, 234, 28
- Liu et al. (2018b) Liu, T., Li, P. S., Juvela, M., et al. 2018b, ApJ, 859, 151
- Liu et al. (2015) Liu, T., Wu, Y., Mardones, D., et al. 2015, Publication of Korean Astronomical Society, 30, 79
- Liu et al. (2012) Liu, T., Wu, Y., & Zhang, H. 2012, ApJS, 202, 4
- Liu et al. (2013) Liu, T., Wu, Y., & Zhang, H. 2013, ApJ, 775, L2
- Liu et al. (2016) Liu, T., Zhang, Q., Kim, K.-T., et al. 2016, ApJS, 222, 7
- Loinard et al. (2011) Loinard, L., Mioduszewski, A. J., Torres, R. M., et al. 2011, in Revista Mexicana de Astronomia y Astrofisica Conference Series, Vol. 40, Revista Mexicana de Astronomia y Astrofisica Conference Series, 205–210
- Lombardi et al. (2010) Lombardi, M., Lada, C. J., & Alves, J. 2010, A&A, 512, A67
- MacLaren et al. (1988) MacLaren, I., Richardson, K. M., & Wolfendale, A. W. 1988, ApJ, 333, 821
- Mangum & Shirley (2015) Mangum, J. G. & Shirley, Y. L. 2015, PASP, 127, 266
- Mardones et al. (1997) Mardones, D., Myers, P. C., Tafalla, M., et al. 1997, ApJ, 489, 719
- McElroy et al. (2013) McElroy, D., Walsh, C., Markwick, A. J., et al. 2013, A&A, 550, A36
- Meng et al. (2013) Meng, F., Wu, Y., & Liu, T. 2013, ApJS, 209, 37
- Miettinen (2014) Miettinen, O. 2014, A&A, 562, A3
- Myers (1998) Myers, P. C. 1998, ApJ, 496, L109
- Myers et al. (1996) Myers, P. C., Mardones, D., Tafalla, M., Williams, J. P., & Wilner, D. J. 1996, ApJ, 465, L133
- Olano et al. (2006) Olano, C. A., Meschin, P. I., & Niemela, V. S. 2006, MNRAS, 369, 867
- Padovani et al. (2009) Padovani, M., Walmsley, C. M., Tafalla, M., Galli, D., & Müller, H. S. P. 2009, A&A, 505, 1199
- Pan et al. (2017) Pan, Z., Li, D., Chang, Q., et al. 2017, ApJ, 836, 194
- Parikka et al. (2015) Parikka, A., Juvela, M., Pelkonen, V.-M., Malinen, J., & Harju, J. 2015, A&A, 577, A69
- Pattle et al. (2015) Pattle, K., Ward-Thompson, D., Kirk, J. M., et al. 2015, MNRAS, 450, 1094
- Pety (2005) Pety, J. 2005, in SF2A-2005: Semaine de l’Astrophysique Francaise, ed. F. Casoli, T. Contini, J. M. Hameury, & L. Pagani, 721
- Pilleri et al. (2013) Pilleri, P., Treviño-Morales, S., Fuente, A., et al. 2013, A&A, 554, A87
- Pineda et al. (2013) Pineda, J. L., Langer, W. D., Velusamy, T., & Goldsmith, P. F. 2013, A&A, 554, A103
- Planck Collaboration et al. (2014) Planck Collaboration, Ade, P. A. R., Aghanim, N., et al. 2014, A&A, 571, A13
- Planck Collaboration et al. (2011a) Planck Collaboration, Ade, P. A. R., Aghanim, N., et al. 2011a, A&A, 536, A1
- Planck Collaboration et al. (2011b) Planck Collaboration, Ade, P. A. R., Aghanim, N., et al. 2011b, A&A, 536, A23
- Planck Collaboration et al. (2016) Planck Collaboration, Ade, P. A. R., Aghanim, N., et al. 2016, A&A, 594, A28
- Reid et al. (2016) Reid, M. J., Dame, T. M., Menten, K. M., & Brunthaler, A. 2016, ApJ, 823, 77
- Ripple et al. (2013) Ripple, F., Heyer, M. H., Gutermuth, R., Snell, R. L., & Brunt, C. M. 2013, MNRAS, 431, 1296
- Sakai et al. (2010) Sakai, T., Sakai, N., Hirota, T., & Yamamoto, S. 2010, ApJ, 714, 1658
- Sakai et al. (2008) Sakai, T., Sakai, N., Kamegai, K., et al. 2008, ApJ, 678, 1049
- Sanhueza et al. (2013) Sanhueza, P., Jackson, J. M., Foster, J. B., et al. 2013, ApJ, 773, 123
- Shan et al. (2012) Shan, W., Yang, J., Shi, S., et al. 2012, IEEE Transactions on Terahertz Science and Technology, 2, 593
- Suzuki et al. (1992) Suzuki, H., Yamamoto, S., Ohishi, M., et al. 1992, ApJ, 392, 551
- Tachihara et al. (2005) Tachihara, K., Neuhäuser, R., Kun, M., & Fukui, Y. 2005, A&A, 437, 919
- Tafalla (2005) Tafalla, M. 2005, in IAU Symposium, Vol. 231, Astrochemistry: Recent Successes and Current Challenges, ed. D. C. Lis, G. A. Blake, & E. Herbst, 17–26
- Tang et al. (2018) Tang, M., Liu, T., Qin, S.-L., et al. 2018, ApJ, 856, 141
- Tatematsu et al. (2017) Tatematsu, K., Liu, T., Ohashi, S., et al. 2017, ApJS, 228, 12
- Tauber et al. (2010) Tauber, J. A., Norgaard-Nielsen, H. U., Ade, P. A. R., et al. 2010, A&A, 520, A2
- Tucker et al. (1974) Tucker, K. D., Kutner, M. L., & Thaddeus, P. 1974, ApJ, 193, L115
- Ungerechts et al. (1997) Ungerechts, H., Bergin, E. A., Goldsmith, P. F., et al. 1997, ApJ, 482, 245
- Veltchev et al. (2016) Veltchev, T. V., Donkov, S., & Klessen, R. S. 2016, MNRAS, 459, 2432
- Walsh et al. (2010) Walsh, A. J., Thorwirth, S., Beuther, H., & Burton, M. G. 2010, MNRAS, 404, 1396
- Williams et al. (1994) Williams, J. P., de Geus, E. J., & Blitz, L. 1994, ApJ, 428, 693
- Wilson & Green (1977) Wilson, S. & Green, S. 1977, ApJ, 212, L87
- Wilson & Rood (1994) Wilson, T. L. & Rood, R. 1994, ARA&A, 32, 191
- Wu & Evans (2003) Wu, J. & Evans, II, N. J. 2003, ApJ, 592, L79
- Wu et al. (2007) Wu, Y., Henkel, C., Xue, R., Guan, X., & Miller, M. 2007, ApJ, 669, L37
- Wu et al. (2012) Wu, Y., Liu, T., Meng, F., et al. 2012, ApJ, 756, 76
- Yuan et al. (2016) Yuan, J., Wu, Y., Liu, T., et al. 2016, ApJ, 820, 37
- Yuan et al. (2013) Yuan, J.-H., Wu, Y., Li, J. Z., Yu, W., & Miller, M. 2013, MNRAS, 429, 954
- Zhang et al. (2018) Zhang, C.-P., Liu, T., Yuan, J., et al. 2018, ApJS, 236, 49
- Zhang et al. (2016) Zhang, T., Wu, Y., Liu, T., & Meng, F. 2016, ApJS, 224, 43
- Zhou et al. (1993) Zhou, S., Evans, II, N. J., Koempe, C., & Walmsley, C. M. 1993, ApJ, 404, 232
| Designation | RA (J2000) | DEC (J2000) | distr11footnotemark: 1 | dist22footnotemark: 2 | (H2) 33footnotemark: 3 | Tex(CO) | (H2)44footnotemark: 4 | |||
|---|---|---|---|---|---|---|---|---|---|---|
| kpc | kpc | km/s | km/s | K | ||||||
| G120.1+03A1 | 0:24:23.48 | +65:49:43.4 | 1.4(0.3) | 1.2(0.6) | 7.62 | 2.66(0.02) | 1.99(0.07) | 0.92(0.05) | 15.0(0.7) | 24.2(0.2) |
| G120.6+02A1 | 0:28:55.37 | +65:27:28.6 | – | 0.9(0.3) | 4.52 | 2.03(0.09) | 1.0(0.2) | 0.7(0.1) | 15(2) | 13.9(0.3) |
| G120.6+02A2 | 0:29:42.75 | +65:26:40.8 | – | 0.9(0.3) | 4.52 | 2.40(0.04) | 2.0(0.3) | 0.47(0.03) | 17(1) | 14.42(0.01) |
| G130.3+11A1 | 2:32:30.38 | +72:39:22.4 | 0.6(0.1) | 0.6(0.2) | 6.31 | 2.28(0.05) | 1.6(0.2) | 1.0(0.1) | 11.0(0.9) | 11.8(0.2) |
| G133.2+08B2 | 2:51:22.88 | +69:13:10.2 | – | 0.6(0.1) | 2.25 | 1.7(0.1) | 1.0(0.2) | 0.9(0.2) | 12(3) | 9.9(0.5) |
| G133.2+08B1 | 2:51:45.48 | +69:14:32.8 | – | 0.6(0.1) | 2.25 | 1.8(0.1) | 1.3(0.4) | 1.4(0.5) | 10(3) | 12(1) |
| G133.4+09A1 | 2:54:32.59 | +69:20:31.8 | – | 0.6(0.1) | 9.73 | 2.87(0.07) | 2.0(0.2) | 1.1(0.2) | 16(2) | 33(1) |
| G158.8-21A1 | 3:27:38.72 | +30:5:56.4 | 0.14(0.01) | 0.14(0.1) | 5.06 | 1.65(0.07) | 0.7(0.2) | 1.0(0.2) | 15(2) | 16.8(0.8) |
| G158.2-20A1 | 3:30:14.22 | +31:44:56.8 | 0.14(0.01) | 0.14(0.1) | 0 | 1.03(0.03) | 1.0(0.8) | 0.74(0.08) | 18(2) | 11.9(0.3) |
| G159.2-20A1 | 3:33:24.06 | +31:6:59.3 | 0.14(0.01) | 0.4(0.1) | 13.5 | 2.17(0.01) | 1.14(0.02) | 1.5(0.1) | 16.3(0.6) | 38(1) |
| G140.4+06A1 | 3:37:37.02 | +63:7:34.0 | – | 1.2(0.5) | 2.45 | 2.36(0.07) | 2.1(0.5) | 0.58(0.07) | 14(1) | 10.67(0.04) |
| G159.0-08A1 | 4:9:49.83 | +40:6:55.8 | 0.14(0.01) | 0.4(0.1) | 1.96 | 2.05(0.06) | 1.1(0.1) | 0.70(0.07) | 12(1) | 8.97(0.02) |
| G160.8-09A1 | 4:13:10.09 | +38:10:52.4 | 0.14(0.01) | 0.4(0.1) | 1.01 | 1.0(0.1) | 0.4(0.1) | 0.7(0.1) | 12(3) | 5.2(0.3) |
| G167.2-15A1 | 4:14:29.24 | +29:35:4.5 | 0.14(0.01) | 0.2(0.07) | 2.66 | 1.8(0.2) | 0.6(0.1) | 0.9(0.2) | 10(2) | 7.3(0.3) |
| G168.7-15A2 | 4:18:32.97 | +28:24:41.9 | 0.14(0.01) | 0.14(0.1) | 6.21 | 1.4(0.1) | 0.8(0.1) | 1.4(0.2) | 14(2) | 14(1) |
| G162.4-08A1 | 4:21:40.39 | +37:34:28.1 | 0.14(0.01) | 0.14(0.1) | 5.29 | 2.22(0.08) | 1.3(0.1) | 0.8(0.1) | 10(1) | 8.37(0.01) |
| G150.4+03A2 | 4:24:40.88 | +55:3:2.4 | 0.17(0.05) | 0.2(0.1) | 0 | 1.40(0.05) | 1.2(0.2) | 0.8(0.1) | 12(1) | 7.7(0.1) |
| G173.3-16A1 | 4:29:25.19 | +24:32:45.3 | 0.23(0.02) | 0.2(0.1) | 6.89 | 1.7(0.5) | 0.8(0.1) | 1.3(0.4) | 17(6) | 21(5) |
| G165.6-09A1 | 4:30:57.40 | +34:56:18.8 | 0.14(0.01) | 0.5(0.1) | 3.02 | 1.5(0.2) | 1.0(0.4) | 0.8(0.2) | 13(3) | 7.8(0.6) |
| G174.0-15A1 | 4:32:31.08 | +24:23:25.3 | 0.23(0.02) | 0.14(0.1) | 8.44 | 1.56(0.04) | 0.81(0.10) | 1.1(0.1) | 13(1) | 14.8(0.5) |
| G172.8-14A1 | 4:33:6.18 | +25:58:41.1 | 0.23(0.02) | 0.4(0.2) | 2.8 | 1.77(0.03) | 0.44(0.04) | 1.0(0.1) | 11.9(0.9) | 11.0(0.2) |
| G174.4-15A1 | 4:33:56.07 | +24:10:26.5 | 0.23(0.02) | 0.4(0.2) | 1.69 | 1.5(0.1) | 0.9(0.2) | 1.0(0.1) | 15(2) | 13.5(0.8) |
| G174.7-15A2 | 4:35:36.34 | +24:8:21.2 | 0.23(0.02) | 0.2(0.1) | 12 | 1.15(0.01) | 0.67(0.03) | 1.29(0.07) | 14.1(0.5) | 13.4(0.3) |
| G174.7-15A3 | 4:35:51.79 | +24:8:33.6 | 0.23(0.02) | 0.2(0.1) | 12 | 1.20(0.02) | 0.66(0.09) | 0.84(0.05) | 16.3(0.9) | 11.5(0.2) |
| G173.9-13A1 | 4:39:28.05 | +25:48:13.9 | 0.23(0.02) | 0.2(0.1) | 6.39 | 1.79(0.07) | 1.3(0.1) | 1.0(0.2) | 15(2) | 18.4(0.8) |
| G192.3-11A1 | 5:29:41.06 | +12:21:7.5 | 0.40(0.04) | 0.42(0.07) | 0.36 | 1.63(0.03) | 1.1(0.3) | 0.54(0.03) | 17(1) | 11.46(0.09) |
| G192.3-11A2 | 5:29:54.22 | +12:17:12.5 | 0.40(0.04) | 0.42(0.07) | 0.36 | 1.09(0.02) | 0.92(0.07) | 0.90(0.05) | 18.4(0.9) | 13.9(0.2) |
| G207.3-19A1 | 5:30:42.79 | -4:11:16.0 | 0.41(0.05) | 0.60(0.05) | 6.8 | 1.94(0.02) | 1.1(0.1) | 0.80(0.04) | 20.5(0.9) | 25.1(0.3) |
| G192.2-11A2 | 5:31:28.90 | +12:30:20.8 | 0.40(0.04) | 0.42(0.07) | 1.48 | 1.05(0.06) | 0.5(0.1) | 0.82(0.09) | 20(2) | 15.5(0.7) |
| G192.2-11A3 | 5:31:54.02 | +12:32:36.6 | 0.40(0.04) | 0.42(0.04) | 1.48 | 1.45(0.03) | 1.2(0.1) | 0.74(0.05) | 20(1) | 18.6(0.3) |
| G192.2-11A4 | 5:32:4.48 | +12:31:43.2 | 0.40(0.04) | 0.42(0.04) | 1.48 | 1.22(0.04) | 0.56(0.10) | 0.73(0.07) | 21(2) | 16.1(0.5) |
| G192.1-10A1 | 5:32:34.42 | +12:51:38.8 | 0.40(0.04) | 0.42(0.07) | 3.26 | 1.16(0.04) | 1.1(0.3) | 0.62(0.06) | 21(2) | 14.3(0.3) |
| G172.8+02A1 | 5:36:54.23 | +36:10:33.5 | 3.4(0.8) | 1.7(0.1) | 5.52 | 3.32(0.06) | 2.4(0.3) | 0.65(0.07) | 18(2) | 29.0(0.3) |
| G178.2-00A2 | 5:39:6.75 | +30:4:48.9 | – | 0.96(0.02) | 2.72 | 2.01(0.04) | 1.4(0.2) | 1.1(0.1) | 11.9(0.8) | 12.5(0.2) |
| G181.8+00A1 | 5:51:30.86 | +27:29:8.1 | – | 1.76(0.04) | 3.58 | 2.13(0.07) | 0.7(0.2) | 1.0(0.2) | 11(1) | 12.7(0.3) |
| G215.8-17A1 | 5:53:40.87 | -10:23:49.1 | 0.41(0.05) | 0.5(0.2) | 1.98 | 1.52(0.06) | 1.3(0.2) | 1.1(0.2) | 14(1) | 14.4(0.7) |
| G203.2-11A1 | 5:53:44.67 | +3:22:48.9 | 0.41(0.05) | 0.42(0.06) | 7.61 | 1.62(0.04) | 1.27(0.09) | 1.2(0.1) | 12(1) | 15.0(0.6) |
| G202.3-08B2 | 6:0:11.61 | +5:14:52.5 | 0.41(0.05) | 0.43(0.06) | 5.21 | 1.66(0.09) | 0.80(0.07) | 0.47(0.04) | 17(1) | 10.7(0.3) |
| G199.8+00A1 | 6:30:42.73 | +12:1:19.4 | – | 1(1) | 7.81 | 2.02(0.09) | 1.4(0.1) | 1.1(0.2) | 9(1) | 11.0(0.4) |
| G201.4+00A2 | 6:32:44.05 | +10:29:25.6 | – | 0.42(0.04) | 7.47 | 5.13(0.09) | 6.4(0.9) | 0.7(0.1) | 12(2) | 21.0(0.2) |
Only the detected sources are listed. 1Distance adopted from literatures (Wu et al., 2012; Planck Collaboration et al., 2016). 2Distance given by Bayesian Distance Calculator (Reid et al., 2016). 3H2 column densities of host PGCCs derived from dust continuum. 4H2 column densities of CO-selected cores derived from (13CO).
| Designation | RA (J2000) | DEC (J2000) | distr | dist | (H2) | Tex(CO) | (H2) | |||
|---|---|---|---|---|---|---|---|---|---|---|
| kpc | kpc | km/s | km/s | K | ||||||
| G224.2-00A1 | 7:9:17.49 | -10:28:27.1 | – | 0.42(0.08) | 12.6 | 3.5(0.1) | 2.2(0.4) | 1.2(0.3) | 12(2) | 27(1) |
| G026.4+08A1 | 18:11:20.92 | -2:0:22.7 | 0.8(0.5) | 0.24(0.02) | 2.28 | 1.01(0.07) | 0.5(0.1) | 1.3(0.3) | 11(2) | 8.8(0.7) |
| G043.0+08A1 | 18:39:21.54 | +12:41:35.3 | 0.30(0.07) | 0.4(0.1) | 5.77 | 0.81(0.05) | 1.5(0.9) | 0.60(0.08) | 11(1) | 2.91(0.03) |
| G038.3-00A1 | 19:4:44.03 | +4:22:51.4 | 1.2(0.3) | 2.1(0.2) | 7.92 | 2.07(0.06) | 1.8(0.2) | 1.0(0.1) | 11(1) | 13.4(0.3) |
| G052.9+03A1 | 19:17:45.44 | +19:15:9.9 | 0.7(0.6) | 0.8(0.3) | 2.21 | 1.67(0.08) | 0.6(0.1) | 1.0(0.1) | 11(1) | 8.7(0.3) |
| G057.1+03A1 | 19:23:55.43 | +23:7:5.3 | – | 0.8(0.3) | 5.67 | 2.01(0.04) | 1.5(0.1) | 1.1(0.1) | 12.5(0.9) | 15.7(0.3) |
| G058.1+03A1 | 19:26:28.95 | +23:58:37.5 | 0.7(0.6) | 0.8(0.3) | 6.26 | 1.98(0.09) | 0.8(0.2) | 1.2(0.2) | 10(1) | 10.4(0.5) |
| G060.7-01A1 | 19:50:10.65 | +23:55:10.5 | 0.9(0.7) | 1.3(0.3) | 2.79 | 2.18(0.06) | 2.0(0.2) | 2.3(0.6) | 10(1) | 22(3) |
| G070.4-01A2 | 20:14:31.88 | +31:57:5.5 | 2.1(0.8) | 2.48(0.08) | 7.44 | 3.33(0.05) | 2.1(0.3) | 0.81(0.09) | 15(1) | 26.8(0.3) |
| G070.4-01A3 | 20:14:33.09 | +31:57:33.5 | 2.1(0.8) | 2.48(0.08) | 7.44 | 3.32(0.04) | 2.3(0.2) | 0.81(0.08) | 16(1) | 29.4(0.4) |
| G074.1+00A1 | 20:17:56.73 | +35:56:42.8 | 3.5(0.8) | 4.3(0.7) | 6.42 | 3.00(0.07) | 2.5(0.3) | 0.8(0.1) | 14(2) | 29.82(0.06) |
| G102.3+15A2 | 20:35:43.46 | +67:53:18.7 | – | 0.88(0.05) | 3.35 | 0.91(0.03) | 0.53(0.10) | 1.9(0.3) | 10.5(0.8) | 8.8(0.7) |
| G098.9+13A1 | 20:36:12.70 | +63:52:30.1 | – | 0.7(0.3) | 2.06 | 1.07(0.05) | 0.6(0.2) | 1.1(0.2) | 9(1) | 5.3(0.2) |
| G093.9+10A2 | 20:37:9.60 | +57:40:28.8 | 0.21(0.02) | 0.67(0.02) | 4.69 | 1.17(0.06) | 1.0(0.2) | 1.9(0.5) | 8(1) | 7.7(0.8) |
| G089.2+04A1 | 20:50:46.66 | +50:26:37.4 | – | 1.64(0.05) | 2.01 | 3.04(0.09) | 2.2(0.4) | 0.9(0.1) | 10(1) | 11.62(0.07) |
| G084.7-01A3 | 20:56:42.28 | +43:40:42.4 | – | 2.2(0.7) | 34.4 | 3.3(0.3) | 2.4(0.2) | 1.1(0.3) | 13(3) | 27(1) |
| G084.7-01A2 | 20:56:51.94 | +43:44:15.2 | – | 2.1(0.7) | 34.4 | 3.34(0.07) | 2.0(0.1) | 1.1(0.2) | 15(2) | 38(2) |
| G111.6+20A1 | 20:57:21.72 | +77:35:12.9 | – | 0.6(0.2) | 5.15 | 1.31(0.03) | 0.9(0.2) | 1.1(0.1) | 12.6(1.0) | 10.2(0.3) |
| G111.7+20A1 | 20:57:34.44 | +77:35:46.0 | – | 0.6(0.2) | 5.15 | 1.41(0.06) | 0.9(0.2) | 0.8(0.1) | 15(1) | 10.2(0.2) |
| G103.9+13A1 | 21:2:19.84 | +67:54:0.5 | – | 0.89(0.05) | 3.32 | 1.31(0.04) | 0.64(0.09) | 1.1(0.1) | 11.8(1.0) | 8.0(0.3) |
| G089.3-00B1 | 21:12:26.16 | +47:24:3.5 | – | 0.67(0.02) | 3.26 | 3.14(0.07) | 1.4(0.2) | 0.73(0.09) | 11(1) | 11.50(0.03) |
| G105.5+10A1 | 21:41:3.61 | +66:35:17.5 | 0.9(0.3) | 0.89(0.07) | 2.31 | 1.18(0.04) | 0.8(0.3) | 0.67(0.06) | 15(1) | 8.0(0.2) |
| G093.5-04A1 | 21:44:52.90 | +47:37:25.1 | 0.12(0.02) | 1(1) | 8.17 | 2.24(0.06) | 1.6(0.2) | 1.1(0.1) | 12(1) | 15.9(0.4) |
| G093.4-04A2 | 21:46:1.88 | +47:18:6.1 | 0.12(0.02) | 1(1) | 2.39 | 1.89(0.05) | 1.2(0.2) | 0.75(0.08) | 11(1) | 8.66(0.02) |
| G110.6+09A1 | 22:28:17.01 | +69:1:35.1 | 0.30(0.03) | 0.8(0.1) | 5.39 | 1.78(0.03) | 1.02(0.07) | 1.3(0.1) | 12.1(0.7) | 15.2(0.5) |
| G114.1+14A1 | 22:30:13.93 | +75:15:37.6 | – | 0.81(0.08) | 7.37 | 2.11(0.07) | 2.1(0.5) | 0.63(0.08) | 11(1) | 7.49(0.04) |
| G114.5+14A1 | 22:35:35.60 | +75:17:0.9 | – | 0.81(0.08) | 2.48 | 1.73(0.08) | 0.9(0.2) | 1.1(0.2) | 12(1) | 12.9(0.6) |
| G114.6+14A1 | 22:38:50.73 | +75:11:45.1 | – | 0.80(0.08) | 9.31 | 1.65(0.02) | 1.11(0.08) | 1.5(0.2) | 13.2(0.9) | 19.9(0.9) |
| G108.8-00A1 | 22:58:40.27 | +58:56:7.2 | 0.18(0.04) | 0.2(0.1) | 4.34 | 3.21(0.06) | 2.4(0.2) | 0.68(0.07) | 15(1) | 21.5(0.2) |
| G108.8-00A2 | 22:58:54.24 | +58:57:55.3 | 0.18(0.04) | 0.2(0.1) | 4.34 | 2.82(0.04) | 1.9(0.2) | 0.71(0.06) | 15(1) | 22.4(0.2) |
| G115.8-03A1 | 23:56:47.86 | +58:33:36.2 | 0.5(0.4) | 0.7(0.1) | 1.84 | 1.13(0.04) | 0.77(0.09) | 1.1(0.1) | 9.8(0.8) | 5.7(0.1) |
| Designation | C2H | N2H+ | |||||||
| VLSR | VLSR | ||||||||
| K km s-1 | km s-1 | km s-1 | K km s-1 | km s-1 | km s-1 | ||||
| G120.1+03A1 | 0.24(0.04) | -19.59(0.06) | 1.8(0.2) | 0.44(0.04) | 0.26(0.04) | -19.70(0.07) | 1.5(0.2) | 0.59(0.07) | |
| G120.6+02A1 | 0.22(0.02) | -17.39(0.03) | 1.05(0.08) | 0.23(0.02) | 0.16(0.03) | -17.50(0.05) | 0.86(0.09) | 0.27(0.04) | |
| G120.6+02A2 | 0.21(0.02) | -17.96(0.05) | 1.7(0.1) | 0.38(0.02) | 0.21(0.03) | -18.17(0.06) | 1.3(0.1) | 0.42(0.05) | |
| G130.3+11A1 | 0.42(0.05) | -15.84(0.03) | 1.04(0.08) | 0.49(0.03) | 0.26(0.05) | -15.93(0.06) | 1.1(0.1) | 0.50(0.07) | |
| G133.2+08B2 | 0.13(0.02) | -10.50(0.04) | 0.76(0.09) | 0.10(0.02) | 0.17(0.03) | -10.48(0.06) | 0.7(0.1) | 0.12(0.02) | |
| G133.2+08B1 | 0.18(0.02) | -10.88(0.04) | 1.26(0.10) | 0.22(0.02) | 0.12(0.04) | -10.96(0.06) | 0.8(0.1) | 0.22(0.04) | |
| G133.4+09A1 | 0.68(0.04) | -15.77(0.02) | 2.26(0.05) | 1.55(0.04) | 0.99(0.04) | -15.69(0.01) | 2.07(0.03) | 2.5(0.3) | |
| G158.8-21A1 | 0.09(0.03) | 5.7(0.1) | 1.3(0.3) | 0.13(0.02) | – | – | – | – | |
| G158.2-20A1 | 0.10(0.02) | 7.75(0.08) | 1.1(0.2) | 0.11(0.02) | – | – | – | – | |
| G159.2-20A1 | 0.50(0.04) | 6.83(0.02) | 0.66(0.04) | 0.41(0.03) | 0.54(0.05) | 6.80(0.01) | 0.65(0.03) | 1.0(0.1) | |
| G140.4+06A1 | 0.06(0.02) | -16.53(0.10) | 0.6(0.1) | 0.05(0.01) | 0.21(0.05) | -16.68(0.06) | 0.6(0.2) | 0.25(0.03) | |
| G159.0-08A1 | 0.14(0.05) | -4.41(0.09) | 0.7(0.3) | 0.13(0.03) | 0.14(0.05) | -4.59(0.04) | 0.49(0.08) | 0.26(0.05) | |
| G160.8-09A1 | 0.22(0.04) | -4.39(0.04) | 0.48(0.09) | 0.11(0.02) | – | – | – | – | |
| G167.2-15A1 | 0.36(0.04) | 6.78(0.01) | 0.37(0.03) | 0.19(0.02) | 0.33(0.04) | 6.61(0.04) | 0.39(0.09) | 0.16(0.02) | |
| G168.7-15A2 | 0.53(0.02) | 7.449(0.006) | 0.37(0.02) | 0.30(0.01) | 0.28(0.05) | 7.38(0.02) | 0.33(0.06) | 0.24(0.03) | |
| G162.4-08A1 | 0.26(0.04) | -1.08(0.04) | 1.1(0.1) | 0.29(0.03) | 0.46(0.04) | -1.27(0.02) | 0.77(0.03) | 0.89(0.10) | |
| G150.4+03A2 | 0.15(0.04) | 3.39(0.05) | 0.3(0.1) | 0.05(0.01) | 0.26(0.04) | 3.36(0.02) | 0.327(0.008) | 0.15(0.02) | |
| G173.3-16A1 | 0.73(0.03) | 6.424(0.008) | 0.66(0.02) | 0.49(0.01) | 0.18(0.03) | 6.40(0.03) | 0.69(0.07) | 0.28(0.04) | |
| G165.6-09A1 | 0.45(0.04) | -0.66(0.01) | 0.49(0.05) | 0.26(0.02) | 0.15(0.04) | -0.75(0.02) | 0.43(0.07) | 0.24(0.04) | |
| G174.0-15A1 | 0.78(0.03) | 5.875(0.006) | 0.53(0.02) | 0.46(0.01) | 0.17(0.03) | 5.83(0.02) | 0.44(0.04) | 0.23(0.03) | |
| G172.8-14A1 | 0.33(0.04) | 5.85(0.02) | 0.35(0.01) | 0.11(0.02) | 0.15(0.04) | 5.78(0.04) | 0.3(0.1) | 0.07(0.01) | |
| G174.4-15A1 | 0.42(0.03) | 7.033(0.009) | 0.37(0.02) | 0.18(0.01) | 0.11(0.05) | 6.95(0.06) | 0.3(0.1) | 0.07(0.02) | |
| G174.7-15A2 | 1.01(0.04) | 5.800(0.007) | 0.57(0.02) | 0.66(0.02) | 0.53(0.04) | 5.797(0.009) | 0.53(0.02) | 0.9(0.1) | |
| G174.7-15A3 | 0.26(0.02) | 6.31(0.02) | 0.56(0.04) | 0.15(0.01) | 0.14(0.03) | 6.28(0.03) | 0.44(0.04) | 0.16(0.03) | |
| G173.9-13A1 | 0.44(0.03) | 6.64(0.01) | 0.43(0.03) | 0.25(0.02) | 0.12(0.03) | 6.53(0.03) | 0.52(0.06) | 0.21(0.04) | |
| G192.3-11A1 | 0.06(0.02) | 12.0(0.2) | 1.9(0.4) | 0.10(0.02) | – | – | – | – | |
| G192.3-11A2 | 0.40(0.04) | 12.19(0.02) | 0.79(0.07) | 0.36(0.03) | 0.41(0.05) | 12.16(0.02) | 0.81(0.06) | 0.76(0.08) | |
| G207.3-19A1 | 0.20(0.03) | 11.00(0.04) | 1.2(0.1) | 0.25(0.02) | – | – | – | – | |
| G192.2-11A2 | 0.50(0.04) | 10.35(0.02) | 0.59(0.06) | 0.36(0.03) | 0.14(0.05) | 10.28(0.02) | 0.33(0.02) | 0.25(0.05) | |
| G192.2-11A3 | 0.23(0.04) | 10.46(0.06) | 1.2(0.1) | 0.29(0.03) | – | – | – | – | |
| G192.2-11A4 | 0.25(0.04) | 10.17(0.05) | 1.4(0.1) | 0.32(0.03) | – | – | – | – | |
| G192.1-10A1 | 0.11(0.02) | 10.30(0.07) | 1.5(0.2) | 0.18(0.02) | – | – | – | – | |
| G172.8+02A1 | 0.33(0.05) | -17.48(0.05) | 1.9(0.1) | 0.72(0.03) | 0.57(0.05) | -17.44(0.04) | 1.9(0.1) | 1.4(0.2) | |
| G178.2-00A2 | 0.15(0.04) | -0.80(0.06) | 0.7(0.1) | 0.14(0.03) | 0.22(0.05) | -0.84(0.04) | 0.7(0.1) | 0.45(0.06) | |
| G181.8+00A1 | 0.37(0.04) | 2.60(0.03) | 1.10(0.09) | 0.40(0.03) | 0.38(0.05) | 2.48(0.03) | 0.85(0.07) | 0.78(0.08) | |
| G215.8-17A1 | 0.16(0.03) | 9.38(0.03) | 0.7(0.1) | 0.14(0.02) | – | – | – | – | |
| G203.2-11A1 | 0.20(0.05) | 10.55(0.06) | 1.1(0.2) | 0.23(0.03) | 0.32(0.05) | 10.54(0.05) | 0.9(0.1) | 0.60(0.09) | |
| G202.3-08B2 | 0.18(0.04) | 12.13(0.04) | 0.52(0.10) | 0.15(0.03) | 0.17(0.05) | 12.00(0.03) | 0.45(0.06) | 0.40(0.08) | |
| G199.8+00A1 | 0.19(0.03) | 6.24(0.03) | 0.55(0.06) | 0.14(0.02) | 0.12(0.03) | 6.10(0.09) | 0.9(0.1) | 0.15(0.03) | |
| G201.4+00A2 | 0.11(0.04) | 4.92(0.05) | 0.6(0.1) | 0.25(0.04) | 0.19(0.05) | 4.67(0.04) | 0.71(0.09) | 0.33(0.06) | |
| Designation | C2H | N2H+ | |||||||
| VLSR | VLSR | ||||||||
| K km s-1 | km s-1 | km s-1 | K km s-1 | km s-1 | km s-1 | ||||
| G224.2-00A1 | 0.15(0.03) | 14.04(0.05) | 1.4(0.1) | 0.32(0.02) | 0.17(0.05) | 13.83(0.10) | 1.4(0.3) | 0.39(0.07) | |
| G026.4+08A1 | 0.15(0.03) | 6.37(0.05) | 0.6(0.1) | 0.07(0.01) | – | – | – | – | |
| G043.0+08A1 | 0.17(0.03) | 4.09(0.02) | 0.35(0.03) | 0.07(0.01) | – | – | – | – | |
| G038.3-00A1 | 0.42(0.04) | 16.97(0.03) | 1.24(0.09) | 0.56(0.03) | 0.85(0.05) | 16.80(0.02) | 1.33(0.06) | 1.9(0.2) | |
| G052.9+03A1 | 0.22(0.04) | 10.76(0.04) | 0.55(0.08) | 0.13(0.02) | 0.22(0.05) | 10.79(0.04) | 0.70(0.10) | 0.34(0.06) | |
| G057.1+03A1 | 0.12(0.02) | 12.22(0.04) | 1.2(0.1) | 0.15(0.01) | 0.19(0.01) | 12.24(0.02) | 1.00(0.05) | 0.38(0.04) | |
| G058.1+03A1 | 0.51(0.04) | 10.18(0.02) | 0.55(0.04) | 0.36(0.03) | 0.40(0.05) | 10.09(0.02) | 0.54(0.02) | 0.70(0.08) | |
| G060.7-01A1 | 0.34(0.05) | 11.11(0.03) | 0.69(0.07) | 0.27(0.03) | 0.17(0.05) | 11.18(0.05) | 0.62(0.10) | 0.37(0.07) | |
| G070.4-01A2 | 0.15(0.04) | 11.24(0.09) | 2.1(0.2) | 0.34(0.04) | 0.40(0.03) | 10.70(0.03) | 1.71(0.09) | 0.89(0.10) | |
| G070.4-01A3 | 0.14(0.05) | 11.2(0.1) | 2.1(0.3) | 0.03(0.05) | 0.54(0.06) | 10.77(0.04) | 1.5(0.1) | 1.2(0.1) | |
| G074.1+00A1 | 0.11(0.03) | -1.3(0.1) | 2.3(0.3) | 0.26(0.03) | 0.22(0.03) | -0.73(0.06) | 2.1(0.2) | 0.57(0.07) | |
| G102.3+15A2 | 0.56(0.02) | 2.756(0.009) | 0.61(0.02) | 0.34(0.01) | 0.44(0.03) | 2.641(0.006) | 0.47(0.01) | 0.8(0.1) | |
| G098.9+13A1 | 0.33(0.03) | -2.67(0.02) | 0.50(0.06) | 0.17(0.02) | 0.11(0.03) | -2.81(0.03) | 0.37(0.05) | 0.15(0.03) | |
| G093.9+10A2 | 0.25(0.03) | -2.06(0.02) | 0.49(0.05) | 0.13(0.01) | – | – | – | – | |
| G089.2+04A1 | 0.30(0.04) | -4.41(0.03) | 1.11(0.09) | 0.36(0.03) | 0.12(0.03) | -4.81(0.09) | 1.0(0.2) | 0.24(0.04) | |
| G084.7-01A3 | 0.44(0.04) | 0.69(0.02) | 1.59(0.05) | 0.91(0.04) | 0.36(0.03) | 0.88(0.03) | 1.4(0.1) | 0.9(0.1) | |
| G084.7-01A2 | 0.61(0.04) | 0.96(0.02) | 1.78(0.04) | 1.38(0.04) | 0.83(0.04) | 0.70(0.01) | 1.70(0.05) | 2.1(0.3) | |
| G111.6+20A1 | 0.33(0.05) | -8.02(0.03) | 0.78(0.10) | 0.31(0.03) | 0.38(0.05) | -8.14(0.02) | 0.70(0.04) | 0.72(0.10) | |
| G111.7+20A1 | 0.32(0.04) | -8.06(0.03) | 0.72(0.07) | 0.26(0.03) | 0.29(0.04) | -8.15(0.02) | 0.57(0.04) | 0.51(0.06) | |
| G103.9+13A1 | 0.46(0.05) | 2.93(0.02) | 0.59(0.05) | 0.37(0.03) | 0.47(0.05) | 2.99(0.02) | 0.67(0.06) | 0.79(0.09) | |
| G089.3-00B1 | 0.18(0.03) | 2.26(0.04) | 1.0(0.1) | 0.15(0.02) | 0.22(0.03) | 2.24(0.03) | 0.89(0.07) | 0.45(0.05) | |
| G105.5+10A1 | 0.29(0.05) | -10.21(0.04) | 0.7(0.1) | 0.26(0.04) | 0.13(0.05) | -10.24(0.03) | 0.49(0.07) | 0.25(0.07) | |
| G093.5-04A1 | 0.18(0.03) | 3.62(0.04) | 0.73(0.08) | 0.12(0.01) | 0.13(0.03) | 3.53(0.03) | 0.56(0.08) | 0.23(0.03) | |
| G093.4-04A2 | 0.27(0.03) | 5.32(0.02) | 0.43(0.04) | 0.15(0.01) | – | – | – | – | |
| G110.6+09A1 | 0.25(0.04) | -4.43(0.05) | 0.9(0.1) | 0.21(0.03) | 0.24(0.04) | -4.47(0.05) | 0.92(0.09) | 0.42(0.06) | |
| G114.1+14A1 | 0.15(0.03) | -4.01(0.05) | 0.5(0.1) | 0.06(0.01) | 0.06(0.03) | -3.56(0.08) | 0.42(0.06) | 0.04(0.01) | |
| G114.5+14A1 | 0.72(0.04) | -4.94(0.01) | 0.77(0.04) | 0.59(0.03) | 0.34(0.04) | -4.98(0.03) | 0.72(0.06) | 0.54(0.07) | |
| G114.6+14A1 | 0.71(0.04) | -3.66(0.02) | 1.21(0.04) | 0.93(0.03) | 1.11(0.04) | -3.64(0.01) | 1.26(0.03) | 2.2(0.2) | |
| G108.8-00A1 | 0.17(0.03) | -50.38(0.05) | 1.9(0.2) | 0.37(0.03) | 0.16(0.04) | -50.61(0.09) | 1.3(0.2) | 0.32(0.05) | |
| G108.8-00A2 | 0.12(0.03) | -49.20(0.07) | 1.7(0.2) | 0.21(0.02) | 0.19(0.04) | -49.39(0.07) | 1.4(0.2) | 0.39(0.06) | |
| G115.8-03A1 | 0.24(0.04) | -0.64(0.02) | 0.35(0.02) | 0.12(0.02) | 0.31(0.04) | -0.74(0.04) | 0.45(0.08) | 0.16(0.02) | |
| Designation | (CO) | =5 K | |||||||
| (C2H) | (N2H+) | ratio | (C2H) | (N2H+) | ratio | ||||
| km s-1 | km s-1 | ||||||||
| G120.1+03A1 | 0.76(0.07) | 0.6(0.1) | 52(5) | 32(3) | 16(2) | 53(5) | 34(4) | 15(2) | |
| G120.6+02A1 | 0.44(0.04) | 0.36(0.04) | 28(2) | 15(2) | 19(3) | 28(2) | 14(2) | 19(3) | |
| G120.6+02A2 | 0.71(0.06) | 0.54(0.06) | 48(3) | 24(3) | 19(2) | 45(2) | 23(2) | 19(2) | |
| G130.3+11A1 | 0.44(0.04) | 0.45(0.06) | 52(3) | 24(3) | 21(3) | 66(4) | 29(4) | 22(3) | |
| G133.2+08B2 | 0.32(0.04) | 0.27(0.05) | 10(1) | 6(1) | 16(4) | 10(1) | 6(1) | 16(4) | |
| G133.2+08B1 | 0.53(0.04) | 0.34(0.05) | 23(1) | 10(1) | 22(4) | 26(1) | 11(2) | 22(4) | |
| G133.4+09A1 | 0.96(0.02) | 0.88(0.01) | 204(5) | 158(19) | 12(1) | 271(7) | 507(61) | 5(1) | |
| G158.8-21A1 | 0.6(0.1) | – | 15(3) | (1) | – | 14(2) | (1) | – | |
| G158.2-20A1 | 0.46(0.07) | – | 15(2) | (2) | – | 12(1) | (1) | – | |
| G159.2-20A1 | 0.27(0.02) | 0.27(0.01) | 53(3) | 61(7) | 8(1) | 60(4) | 76(9) | 8(1) | |
| G140.4+06A1 | 0.26(0.05) | 0.23(0.07) | 5(1) | 13(1) | 4(1) | 5(1) | 13(1) | 4(1) | |
| G159.0-08A1 | 0.3(0.1) | 0.20(0.03) | 13(3) | 12(2) | 10(3) | 14(3) | 13(2) | 10(3) | |
| G160.8-09A1 | 0.19(0.04) | – | 11(2) | (1.0) | – | 13(2) | (1) | – | |
| G167.2-15A1 | 0.15(0.01) | 0.16(0.04) | 20(2) | 7.6(0.8) | 26(4) | 25(2) | 9(1) | 26(4) | |
| G168.7-15A2 | 0.14(0.01) | 0.12(0.02) | 36(1) | 13(1) | 27(4) | 45(2) | 14(2) | 31(4) | |
| G162.4-08A1 | 0.45(0.05) | 0.32(0.01) | 30(3) | 43(4) | 6(1) | 36(3) | 60(6) | 6(1) | |
| G150.4+03A2 | 0.14(0.05) | 0.13(0.01) | 4(1) | 7(1) | 6(2) | 5(1) | 8(1) | 5(2) | |
| G173.3-16A1 | 0.27(0.01) | 0.28(0.03) | 66(1) | 16(2) | 40(6) | 92(2) | 15(2) | 59(6) | |
| G165.6-09A1 | 0.20(0.02) | 0.17(0.03) | 30(2) | 12(2) | 24(4) | 36(2) | 12(2) | 28(4) | |
| G174.0-15A1 | 0.22(0.01) | 0.17(0.01) | 55(1) | 12(1) | 45(6) | 92(2) | 12(1) | 71(6) | |
| G172.8-14A1 | 0.14(0.01) | 0.13(0.05) | 11(1) | 3.6(0.7) | 32(8) | 14(2) | 4.0(0.8) | 34(8) | |
| G174.4-15A1 | 0.14(0.01) | 0.12(0.06) | 22(1) | 4.2(0.9) | 53(13) | 24(1) | 4.0(0.9) | 61(13) | |
| G174.7-15A2 | 0.23(0.01) | 0.22(0.01) | 82(2) | 49(6) | 16(2) | 130(4) | 64(8) | 20(2) | |
| G174.7-15A3 | 0.23(0.02) | 0.17(0.02) | 19(1) | 9(1) | 21(4) | 18(1) | 8(1) | 21(4) | |
| G173.9-13A1 | 0.17(0.01) | 0.21(0.03) | 30(2) | 11(2) | 25(5) | 34(2) | 11(2) | 30(5) | |
| G192.3-11A1 | 0.8(0.2) | – | 13(3) | (1) | – | 11(2) | (1) | – | |
| G192.3-11A2 | 0.33(0.03) | 0.34(0.02) | 48(3) | 47(5) | 10(1) | 48(3) | 49(5) | 9(1) | |
| G207.3-19A1 | 0.50(0.05) | – | 35(2) | (1) | – | 29(2) | (1) | – | |
| G192.2-11A2 | 0.24(0.02) | 0.12(0.01) | 52(4) | 16(3) | 31(6) | 51(4) | 13(2) | 38(6) | |
| G192.2-11A3 | 0.50(0.06) | – | 42(4) | (8) | – | 35(3) | (6) | – | |
| G192.2-11A4 | 0.58(0.06) | – | 47(4) | (3) | – | 39(4) | (2) | – | |
| G192.1-10A1 | 0.65(0.07) | – | 27(2) | (2) | – | 20(1) | (1) | – | |
| G172.8+02A1 | 0.79(0.05) | 0.81(0.05) | 98(4) | 89(11) | 11(1) | 93(4) | 104(13) | 9(1) | |
| G178.2-00A2 | 0.31(0.05) | 0.28(0.05) | 14(3) | 22(3) | 6(1) | 15(3) | 25(3) | 6(1) | |
| G181.8+00A1 | 0.46(0.04) | 0.36(0.03) | 43(3) | 38(4) | 11(1) | 53(3) | 49(5) | 10(1) | |
| G215.8-17A1 | 0.30(0.05) | – | 15(2) | (3) | – | 16(2) | (3) | – | |
| G203.2-11A1 | 0.46(0.07) | 0.39(0.05) | 25(3) | 30(4) | 8(1) | 27(3) | 36(5) | 7(1) | |
| G202.3-08B2 | 0.21(0.04) | 0.18(0.03) | 20(3) | 23(4) | 8(2) | 18(3) | 21(4) | 8(2) | |
| G199.8+00A1 | 0.23(0.03) | 0.39(0.06) | 14(1) | 7(1) | 20(5) | 16(2) | 8(1) | 20(5) | |
| G201.4+00A2 | 0.27(0.05) | 0.29(0.04) | 26(4) | 16(2) | 16(3) | 28(4) | 18(3) | 15(3) | |
| Designation | (CO) | =5 K | |||||||
| (C2H) | (N2H+) | ratio | (C2H) | (N2H+) | ratio | ||||
| km s-1 | km s-1 | ||||||||
| G224.2-00A1 | 0.61(0.04) | 0.6(0.1) | 34(2) | 19(3) | 17(3) | 36(2) | 21(3) | 17(3) | |
| G026.4+08A1 | 0.24(0.05) | – | 7(1) | (1) | – | 8(1) | (1) | – | |
| G043.0+08A1 | 0.14(0.01) | – | 7(1) | (5) | – | 7(1) | (6) | – | |
| G038.3-00A1 | 0.53(0.04) | 0.56(0.03) | 61(3) | 104(11) | 5.9(0.7) | 77(4) | 217(23) | 3.6(0.7) | |
| G052.9+03A1 | 0.23(0.03) | 0.29(0.04) | 13(2) | 16(2) | 8(2) | 15(2) | 19(3) | 7(2) | |
| G057.1+03A1 | 0.51(0.05) | 0.42(0.02) | 16(1) | 19(1) | 8(1) | 17(1) | 21(2) | 8(1) | |
| G058.1+03A1 | 0.23(0.02) | 0.22(0.01) | 38(2) | 33(3) | 11(1) | 53(3) | 44(5) | 11(1) | |
| G060.7-01A1 | 0.29(0.03) | 0.26(0.04) | 27(3) | 17(3) | 16(3) | 34(3) | 20(3) | 16(3) | |
| G070.4-01A2 | 0.90(0.09) | 0.72(0.04) | 40(4) | 50(5) | 8(1) | 38(4) | 57(6) | 6(1) | |
| G070.4-01A3 | 0.9(0.1) | 0.62(0.05) | 47(5) | 69(6) | 6(1) | 43(5) | 87(8) | 5(1) | |
| G074.1+00A1 | 1.0(0.1) | 0.91(0.07) | 29(3) | 30(3) | 9(1) | 29(3) | 32(4) | 9(1) | |
| G102.3+15A2 | 0.25(0.01) | 0.19(0.01) | 36(1) | 37(4) | 9(1) | 52(1) | 50(6) | 10(1) | |
| G098.9+13A1 | 0.21(0.02) | 0.15(0.02) | 17(1) | 7(1) | 24(5) | 21(2) | 8(1) | 26(5) | |
| G093.9+10A2 | 0.20(0.02) | – | 13(1) | (4) | – | 16(1) | (5) | – | |
| G089.2+04A1 | 0.47(0.04) | 0.43(0.09) | 37(2) | 11(2) | 33(6) | 45(3) | 13(2) | 34(6) | |
| G084.7-01A3 | 0.67(0.02) | 0.60(0.04) | 105(4) | 45(6) | 23(3) | 126(4) | 53(7) | 23(3) | |
| G084.7-01A2 | 0.75(0.02) | 0.72(0.02) | 170(4) | 121(15) | 14(1) | 224(5) | 225(28) | 10(1) | |
| G111.6+20A1 | 0.33(0.04) | 0.29(0.02) | 34(3) | 37(5) | 9(1) | 39(4) | 45(6) | 8(1) | |
| G111.7+20A1 | 0.30(0.03) | 0.23(0.02) | 31(3) | 28(3) | 11(1) | 33(3) | 30(3) | 11(1) | |
| G103.9+13A1 | 0.24(0.02) | 0.28(0.03) | 40(3) | 40(4) | 10(1) | 52(4) | 53(6) | 9(1) | |
| G089.3-00B1 | 0.40(0.06) | 0.37(0.03) | 15(1) | 21(2) | 7(1) | 18(2) | 25(3) | 7(1) | |
| G105.5+10A1 | 0.31(0.05) | 0.20(0.03) | 31(4) | 14(4) | 22(7) | 32(4) | 13(4) | 23(7) | |
| G093.5-04A1 | 0.30(0.04) | 0.23(0.03) | 13(1) | 11(1) | 12(2) | 14(1) | 12(1) | 11(2) | |
| G093.4-04A2 | 0.17(0.02) | – | 15(1) | (3) | – | 18(1) | (3) | – | |
| G110.6+09A1 | 0.36(0.05) | 0.39(0.04) | 22(3) | 20(3) | 10(2) | 25(3) | 24(3) | 10(2) | |
| G114.1+14A1 | 0.20(0.06) | 0.17(0.03) | 5(1) | 1.8(0.7) | 32(15) | 6(1) | 2.0(0.8) | 32(15) | |
| G114.5+14A1 | 0.32(0.02) | 0.30(0.02) | 67(2) | 27(3) | 24(3) | 108(4) | 33(4) | 32(3) | |
| G114.6+14A1 | 0.51(0.02) | 0.53(0.01) | 109(3) | 127(13) | 8.6(0.9) | 169(5) | 119(12) | 14.3(0.9) | |
| G108.8-00A1 | 0.82(0.07) | 0.56(0.10) | 44(3) | 17(3) | 25(4) | 42(2) | 17(3) | 24(4) | |
| G108.8-00A2 | 0.71(0.10) | 0.59(0.08) | 25(3) | 21(3) | 11(2) | 23(2) | 21(3) | 10(2) | |
| G115.8-03A1 | 0.14(0.01) | 0.18(0.04) | 12(1) | 7.8(0.8) | 15(3) | 14(2) | 10(1) | 14(3) | |
| C2H | N2H+ | |||||||||||||||
| Designation11footnotemark: 1 | sub | center | VLSR | V | N | center | VLSR | V | N | 22footnotemark: 2 | ||||||
| ′ | (′,′) | km s-1 | km s-1 | ′ | cm-2 | (′,′) | km s-1 | km s-1 | ′ | cm-2 | M☉ | |||||
| G130.3+11A1Δ | – | 2.5 | (-0.5,-0.5) | -15.55 | 1.55 | 1.35 | 64(5) | (-0.0,-0.7) | -15.81 | 1.48 | 1.07 | 3.5(0.3) | 7.3(0.7) | 57(5) | 7.9 | |
| G133.4+09A1Δ | – | 2.7 | (0.1,0.6) | -16.17 | 2.95 | 1.55 | 236(21) | (-0.2,-0.1) | -15.58 | 2.7 | 1.47 | 11(1) | 29(2) | 285(26) | 9.6 | |
| G159.2-20A1⋆ | – | 3.2 | (-0.6,0.6) | 6.81 | 1.23 | 1.8 | 89(8) | (-0.9,0.4) | 6.73 | 2.03 | 1.42 | 14(1) | 6.3(0.6) | 29(2) | 4.6 | |
| G167.2-15A1⋆ | – | 2.4 | (-0.6,0.5) | 6.54 | 1.01 | 1.04 | 40(3) | (-0.5,0.5) | 7.45 | 0.67 | 0.49 | 0.51(0.05) | 0.56(0.05) | 5.5(0.5) | 9.7 | |
| G168.7-15A2⋆ | – | – | (0.4,2.0) | 7.28 | 0.62 | 1.96 | 48(4) | (0.0,2.5) | 7.46 | 2.03 | 1.3 | 5.9(0.5) | 0.62(0.06) | 2.5(0.3) | 4.0 | |
| G173.3-16A1⋆ | – | – | (-0.8,0.3) | 6.31 | 0.66 | 1.3 | 80(7) | (-0.9,0.1) | 6.14 | 2.44 | 0.81 | 3.4(0.3) | 0.54(0.05) | 1.8(0.2) | 3.3 | |
| G165.6-09A1⋆ | – | – | (-0.6,-0.3) | -0.74 | 1.24 | 0.91 | 39(3) | (-0.9,-0.5) | -0.47 | 1.63 | 0.74 | 3.8(0.3) | 0.88(0.08) | 19(1) | 21.8 | |
| G174.0-15A1⋆ | W | 4.5 | (1.0,0.6) | 6.04 | 0.73 | 1.44 | 80(7) | (1.2,0.6) | 5.88 | 1.36 | 0.62 | 2.1(0.2) | 0.55(0.05) | 1.8(0.2) | 3.3 | |
| G174.0-15A1⋆ | E | 4.5 | (4.1,1.0) | 6.14 | 0.85 | 2.07 | 86(7) | (3.5,1.9) | 6.24 | 1.84 | 1.22 | 6.4(0.6) | 1.1(0.1) | 4.5(0.4) | 4.1 | |
| G174.7-15A2⋆ | – | 3.5 | (0.1,1.3) | 5.95 | 0.63 | 1.47 | 99(8) | (-0.4,1.0) | 5.97 | 1.73 | 1.25 | 5.9(0.5) | 0.86(0.08) | 3.7(0.2) | 4.3 | |
| G173.9-13A1⋆ | S | 3.0 | (2.1,0.1) | 6.55 | 0.82 | 1.53 | 57(5) | (2.5,-1.6) | 6.46 | 1.69 | 0.39 | 1.7(0.2) | 0.41(0.04) | 1.5(0.2) | 3.6 | |
| G173.9-13A1⋆ | N | 2.5 | (-3.0,3.6) | 6.19 | 0.74 | 1.39 | 56(5) | (-2.1,3.1) | 6.6 | 1.83 | 0.89 | 4.2(0.4) | 0.40(0.04) | 2.8(0.3) | 7.0 | |
| G192.3-11A2 | – | 1.7 | (0.4,-0.8) | 11.73 | 0.7 | 0.87 | 95(8) | (0.0,-0.4) | 11.98 | 0.7 | 0.63 | 10.9(1.0) | 1.5(0.1) | 4.7(0.4) | 3.3 | |
| G172.8+02A1 | – | 2.3 | (-0.4,0.0) | -17.27 | 2.28 | 0.89 | 91(8) | (-0.4,0.3) | -17.38 | 2.43 | 0.9 | 6.9(0.6) | 29(2) | 294(26) | 10.1 | |
| G070.4-01A2 | – | 3.6 | (2.2,-0.1) | 11.24 | 1.8 | 1.66 | 35(3) | (0.4,0.2) | 11.24 | 2.0 | 0.89 | 4.1(0.4) | 90(8) | 262(24) | 2.9 | |
| G102.3+15A2Δ | SW | 3.0 | (0.1,-0.1) | 2.66 | 0.49 | 0.8 | 42(3) | (-0.0,-0.4) | 2.93 | 2.27 | 0.78 | 4.6(0.4) | 2.7(0.2) | 6.0(0.5) | 2.2 | |
| G102.3+15A2Δ | NE | 3.0 | (1.5,1.1) | 2.47 | 0.8 | 0.5 | 33(3) | (1.3,0.8) | 2.32 | 1.35 | 0.51 | 1.8(0.2) | 0.83(0.07) | 10.5(0.9) | 12.7 | |
| G084.7-01A2 | NW | 3.5 | (-0.3,-0.7) | 1.09 | 2.27 | 2.39 | 150(13) | (-0.9,-1.2) | 1.41 | 2.36 | 2.1 | 11(1) | 695(63) | 851(77) | 1.2 | |
| G084.7-01A2 | SE | 3.5 | (1.9,-3.2) | 0.6 | 2.85 | 1.2 | 151(14) | (2.5,-2.9) | 3.38 | 8.3 | 1.16 | 20(1) | 156(14) | 741(67) | 4.7 | |
| G111.6+20A1Δ | – | 3.6 | (-0.1,0.9) | -7.92 | 0.86 | 1.27 | 68(6) | (-0.4,0.7) | -7.81 | 1.95 | 0.96 | 9.3(0.8) | 7.0(0.6) | 16(1) | 2.3 | |
| G103.9+13A1Δ | – | 2.7 | (0.5,0.8) | 2.84 | 1.27 | 1.32 | 54(4) | (0.2,0.5) | 3.26 | 1.98 | 0.99 | 4.7(0.4) | 10.4(0.9) | 52(4) | 5.0 | |
| G110.6+09A1Δ | – | 2.0 | (-0.9,-0.5) | -4.25 | 0.84 | 0.83 | 65(5) | (-1.0,-0.8) | -4.18 | 2.32 | 0.95 | 8.1(0.7) | 4.8(0.4) | 20(1) | 4.2 | |
| G114.5+14A1Δ | W | 2.9 | (-0.4,-0.0) | -4.79 | 1.0 | 0.85 | 92(8) | (-0.5,-0.1) | -4.48 | 2.29 | 0.58 | 4.3(0.4) | 6.6(0.6) | 17(1) | 2.6 | |
| G114.5+14A1Δ | E | 2.9 | (0.5,0.4) | -4.89 | 0.82 | 0.68 | 58(5) | (0.5,0.1) | -4.68 | 1.58 | 0.51 | 3.4(0.3) | 3.4(0.3) | 10.2(0.9) | 3.0 | |
| G114.6+14A1Δ | W | 3.2 | (0.1,-0.2) | -3.71 | 1.01 | 0.91 | 80(7) | (-0.2,-0.3) | -3.77 | 1.89 | 0.94 | 9.5(0.9) | 8.3(0.7) | 28(2) | 3.4 | |
| G114.6+14A1Δ | E | 3.2 | (1.2,0.0) | -3.42 | 0.82 | 0.98 | 71(6) | (2.5,-0.5) | -3.76 | 2.12 | 1.15 | 6.5(0.6) | 8.7(0.8) | 22(2) | 2.6 | |
1 and represent that this core is in Taurus and Cepheus region respectively. 2The uncertainty contributed by assuming a fixed abundance of [C2H] is not included.