Pump-probe Spectroscopy Study of Ultrafast Temperature Dynamics in Nanoporous Gold
Abstract
We explore the influence of the nanoporous structure on the thermal relaxation of electrons and holes excited by ultrashort laser pulses () in thin gold films. Plasmon decay into hot electron-hole pairs results in the generation of a Fermi-Dirac distribution thermalized at a temperature higher than the lattice temperature . The relaxation times of the energy exchange between electrons and lattice, here measured by pump-probe spectroscopy, is slowed down by the nanoporous structure, resulting in much higher peak than for bulk gold films. The electron-phonon coupling constant and the Debye temperature are found to scale with the metal filling factor and a two-temperature model reproduces the data. The results open the way for electron temperature control in metals by engineering of the nanoporous geometry.
The optical excitation of electrons and holes at high energy levels in metal nanostructures has been the subject of considerable attention in the last decade Atwater and Polman (2010); Manjavacas et al. (2014); Brongersma et al. (2015); Wu et al. (2015); Benz et al. (2016); Cortés et al. (2017), with the aim of enabling chemical reactions and charge transfer from the metal to adjacent materials at ambient temperature for energy harvesting and storage Atwater and Polman (2010); Wu et al. (2015), most notably H2 production by water splitting Lee et al. (2012); Mukherjee et al. (2012); Zhang et al. (2017, 2018). In particular, gold nanostructures have been investigated because of the relative ease of obtaining plasmonic field enhancement at their surfaces Naik et al. (2013). The absorption of optical energy by free carriers in a metal implies collective oscillation of electron currents (plasmons) Ruello et al. (2015); Besteiro et al. (2017); Deacon et al. (2017). Such coherent plasmons rapidly decay into non-thermalized electron-hole (e-h) pairs occupying high kinetic energy states. The e-h pairs decay via electron-electron scattering on the femtosecond time scale into hot carriers, which can be represented by a Fermi-Dirac distribution at an electron temperature , much higher than the lattice temperature . Subsequently, electron-phonon interaction leads to equilibrium defined as on the picosecond timescale Baida et al. (2011); Della Valle et al. (2012).
Very recently, ab-initio calculations of all electron and phonon states of gold have been employed to confirm the above interpretation of ultrafast pump-probe spectroscopy in the case of spherical nanoparticles of diameter in aqueous solution Brown et al. (2017). For such a simple geometry, electron and phonon distributions may be taken as constant in space, and the introduction of statistical thermal baths for electrons at and phonons at may not be conceptually necessary any more. The present work, however, explores the opposite limit of an extended nanoscale filament network, also called nanoporous gold (NPG). In NPG, geometrical parameters such as gold filling factor and filament diameter play a key role in determining the electron-phonon thermalization time due to spatially inhomogeneous excitation intensity at the nanoscale, therefore the previous simplified approach of two coupled statistical thermal baths (so called two-temperature (TT) model Anisimov et al. (1974); Carpene (2006); Della Valle et al. (2012)) will be followed in this work so as to effectively include the geometrical parameters of the nanoporous gold structure in the model.
Hot electron plasmonics experiments have been mostly conducted on nanoparticles dispersed in solutions Hodak et al. (1998); Hrelescu et al. (2010); Lee et al. (2012); Mukherjee et al. (2012); Aruda et al. (2013); Manjavacas et al. (2014); Zhang et al. (2017, 2018), and the ultrafast temperature dynamics are poorly understood due to an extremely varied experimental landscape Wu et al. (2015); Keller and Frontiera (2018); Yu et al. (2018).
NPG Biener et al. (2008); Ding and Chen (2009); Lang et al. (2011); Detsi et al. (2014) represents an interesting system for applications, as it allows liquid and gas samples to fill the empty spaces among gold ligaments Lee et al. (2012); Mukherjee et al. (2012); Zhang et al. (2017, 2018) where the radiation field is strongly enhanced by cusp-like geometries of the fractal structure (see Fig. 1 (a)-(b)) Lang et al. (2011); Detsi et al. (2014); Garoli et al. (2018). Nanoporous materials of different kinds (e.g. glass Costescu et al. (2002), silicon Hopkins et al. (2010); Wang et al. (2011) and polymers Costescu et al. (2002)) are also well known for their thermal and acoustic insulation properties. The nanoporous structure should then impact on the ultrafast electron temperature dynamics following the absorption of optical energy by plasmons in NPG. If compared to bulk gold, the decrease in the thermal conductivity at the interior of the effective material constituted by the nanoporous metal should then lead to higher maximum temperatures and slower local energy relaxation, in a way similar to what observed in gold nanoparticles Brown et al. (2017) and clusters Hrelescu et al. (2010). In this work, we present an ultrafast pump-probe spectroscopy study and related thermal modeling of plasmon energy relaxation in NPG. Interestingly, relevant fundamental quantities of the TT model such as the speed of sound, the Debye temperature and the electron-phonon coupling constant are found to follow a simple power scaling law with the metal filling fraction in NPG, which quantitatively explains both the longer time scales and the higher electron temperatures observed in our experiments.
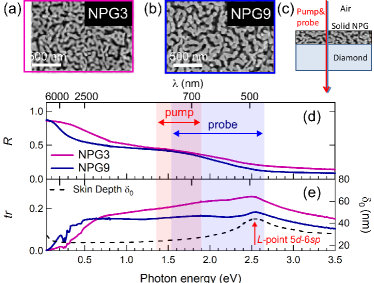
NPG samples were prepared by chemical dealloying from an Ag0.67Au0.33 thin film following the procedure reported in Ref. Garoli et al. (2018). The two films studied in this work are characterized by different dealloying times (3 hours for NPG3 and 9 hours for NPG9) and have a similar (mainly related to the composition of the initial alloy). Different dealloying times lead to different average diameter of the gold ligaments Garoli et al. (2018). In particular, by numerical analysis of the SEM images of Fig. 1(a),(b) Garoli et al. (2018), we found and for NPG3, and for NPG9. In Fig. 1(c),(d) the optical reflectance and transmittance of the two NPG films in the infrared and visible ranges are reported. A redshift of the plasma edge is observed from in NPG3 to in NPG9 Lang et al. (2011); Detsi et al. (2014); Garoli et al. (2018). The dielectric resonance of gold at is clearly visible in all samples. The broad peak barely seen in the spectra of NPG9 around is due to an effective medium resonance Garoli et al. (2018).
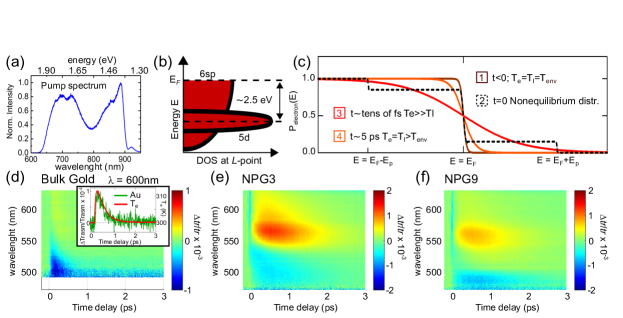
In a simplified model of optical excitations of gold, the lowest-energy interband transition is the 5-6 transition at the L-point, which leads to the lowest-energy resonance in the dielectric function of gold. The spectral lineshape of this resonance is a Lorentz function centered at Della Valle et al. (2012); Brown et al. (2017); Olmon et al. (2012). In this work, in order to focus on the geometrical effect of the nanoporous structure rather than on the details of electromagnetic interactions, we will make use of a corresponding simplified model for ultrafast pump-probe spectroscopy of gold: the infrared pump pulse spectrum, being located at photon energies well below the L-point transitions at (see Fig. 2(a)), mainly excites the intraband transitions within the 6 band. As a 6 intraband transition of gold can be seen as a pure free-electron excitation, it can also be interpreted as a plasmon excitation. The plasmon then decays into a 6 electron-hole pair that subsequently thermalizes in a hot carrier population in the 6 band, which we model with a simple Fermi-Dirac distribution thermalized at . The white-light probe pulse, instead, encompasses a broader spectral range including the dielectric function resonance at , here used as a qualitative probe of as a function of pump-probe delay. Fig. 2(b) is a sketch that summarizes the simplified model for ultrafast pump-probe spectroscopy of gold. However, it has been recently established, both theoretically Sundararaman et al. (2014); Brown et al. (2015) and experimentally Tagliabue et al. (2018), that 5-6 interband transitions at the -point can actually be excited by pump photons with energy higher than a threshold approximately set at . The effect of -point transitions is to depress plasmon excitation in the 6 band taking place at pump photon energies higher than , therefore the simplified picture described above and sketched in FIg. 2(b), which implies pure plasmonic excitation in gold for all pump photon energies below the dielectric function resonance at , has to be rigorously rejected Tagliabue et al. (2018). At odds with the -point transitions, however, the weaker -point transition oscillator does not produce a true resonance in the dielectric function of gold at Olmon et al. (2012) so our probe pulse will not be sensitive to hot holes in the 5 band at that energy. Also, the pump pulse spectrum in our experiment extends between to as shown in Fig. 2(a), so it overlaps only marginally with the -point transitions at . Therefore, the simplified model of Fig. 2(b) can be fairly employed for the scopes of the present work hence allowing us to describe the electron system, after e-h pair thermalization, with the single parameter .
Transient absorption experiments were performed with an ultrafast laser system based on a Yb:KGW regenerative amplifier operating at a repetition time of . A home-built noncollinear optical parametric amplifier delivers excitation pulses with a bandwidth of at a central energy of as reported in Fig. 2(a) hence excluding the 5-6 transition (see Fig. 2(b)). Dielectric chirped mirrors compress the pulses to a duration of . In Fig. 2(c) the evolution of the Fermi-Dirac distribution following the excitation of the pump pulse is sketched. At the pulse excites a non-equilibrium distribution whose shape is determined by the pulse energy spectrum in Fig. 2(a), which can be roughly approximated by a multiple step function (black dashed curve in Fig. 2(c)) Besteiro et al. (2017); Della Valle et al. (2012). The non-equilibrium e-h pair distribution generated by the pump pulse thermalizes to a Fermi-Dirac distribution at on a timescale of the order of hundreds of fs, mainly through electron-electron interactions. At this stage, is still much higher than (red curve in Fig. 2(c)). On a longer timescale on the order of ps, the carriers cool down through electron-phonon interactions to a new lattice temperature (orange curve in Fig. 2(c)) higher than the environment temperature .
The pump-induced optical transmission change is probed by a synchronous white light pulse obtained from supercontinuum generation in a thick sapphire crystal Grupp et al. (2017). Probe pulses cover a spectral range between 1.55 and including the 5-6 transition. Spectra of subsequent probe pulses are used to calculate the differential transmission signal with a modulation of the excitation pulses at half the repetition rate. In Fig. 2(d)-(f), color plots of as a function of pump-probe time delay and probe wavelength are shown for a reference bulk gold thin film and for the NPG3 and NPG9 samples. By comparing the three plots of Fig. 2(d)-(f), one immediately sees a strongly increased transmittance around in both NPG samples which is almost absent in the bulk gold film Lang et al. (2011); Detsi et al. (2014), accompanied by a decay of slower than that of the gold film at all wavelengths. For probe wavelenghts shorter than the sign of changes to negative because of pump-induced interband absorption Rotenberg et al. (2009, 2010); Baida et al. (2011); Della Valle et al. (2015); Di Mario et al. (2018). High-energy non-thermalized carriers impact on the transmittance of gold films and nanostructures only for Della Valle et al. (2012, 2015). The transmittance dynamics for probe delays above , instead, can be almost entirely attributed to thermalized carriers and to changes in their , displaying a relaxation time scale independent on the probe wavelength Qiu and Tien (1992). In this perspective the strongly increased transmittance observed in NPG (positive areas in Fig. 2(e),(f)) indicates a much higher value of if compared to that reached in bulk gold (Fig. 2(d)). These facts demonstrate that NPG is a very promising candidate for hot-electron plasmonics applications.
Numerical evaluation of and dynamics is performed within the two-temperature model, in which energy relaxation to the lattice from the free carriers, heated by e-h pair thermalization via the fast electron-electron interaction, is mediated by the relatively slow electron-phonon interaction Anisimov et al. (1974). In an improved version of the TT model Carpene (2006), e-h pairs produced by plasmon decay act as the external heat source for both the Fermi-Dirac free carrier distribution and the lattice via electron-electron and electron-phonon scattering processes respectively, resulting in the following coupled equations:
| (1) |
where and are the electronic and lattice heat capacities per unit volume, is the electron-phonon coupling constant, and are characteristic times related to the electron-electron and electron-phonon energy relaxation Carpene (2006). The pump pulse power in the instantaneous pump-pulse approximation is , with the film thickness, and the pump fluence. For bulk gold thin films, the values of the parameters used in the extended TT model are , , , , , , , Della Valle et al. (2012). In the inset of Fig. 2(c), the curve obtained from Eq.1 fits to the data for bulk gold, provided that the delay scale is normalized by the relative change factor .
In order to analyze the ultrafast temperature dynamics of NPG within the extended TT model, we scale all quantities of Eq.1 by , where is the corresponding scaling exponent, as summarized in Table 1. For and , the scaling exponent is a trivial as they scale linearly with the mass density. For the thermal conductance, the problem is considerably more complex due to the NPG network connectivity. Previous works have employed the Asymmetric Bruggeman Theory (ABT) McLachlan et al. (1990) to calculate the electron thermal conductivity in NPG Hopkins et al. (2008); Makinson (1938) and the lattice thermal conductivity of nanoporous glass Costescu et al. (2002). In both cases, the results point toward an experimental value of for thermal conductivities of nanoporous solids. The lattice thermal conductivity is written as , where is the lattice specific heat, is the speed of sound and is the phonon mean free path. Since and are microscopic quantities that should not depend on the geometry, should scale with the exponent as well Costescu et al. (2002). There are two quantities in the TT model of Eq.1 that depend on . The first quantity is Kaganov et al. (1957):
| (2) |
where is the microscopic electron density, is the electron mass, and is the total electron scattering time including electron-electron and electron phonon scatterings. Following Matthiessen’s rule and assuming momentum-independent scattering, the effect of electron scattering at physical boundaries in NPG ligaments can be included in the model by considering an additional scattering time , where is the Fermi velocity in gold Hopkins et al. (2008):
| (3) |
In Eq.3 and are temperature-independent coefficients that in gold can be taken equal to , Wang et al. (1994). In bulk gold and the contribution of is negligible. The case of gold nanoparticles can also be obtained by using and similar to the value of the nanoparticle diameter supplmat. In Eq.2 the only quantity that scales with is the speed of sound , therefore for we obtain a scaling exponent .
The second quantity of the TT model proportional to is the Debye temperature :
| (4) |
where ( is the atomic density) and is the Boltzmann constant. represents the average phonon energy and, as such, enters in the definition of the electron-phonon energy relaxation time as . Therefore, from we obtain for .
| Quantity | |||||
|---|---|---|---|---|---|
| scaling () |
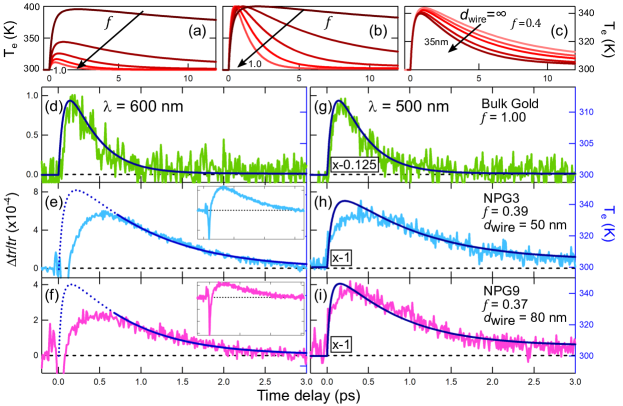
Using the scaling exponents of Table 1, we can describe the ultrafast electron dynamics of NPG by solving the extended TT model of Eq.1 as a function of . It is important to notice that the scaled quantities are effective quantities purposely defined for the nanoporous solid, and do not correspond to an actual variation of the microscopic quantities of bulk gold. In Fig. 3(a)-(c) the model results are reported, highlighting the effect of and on . In the model, the temperature dynamics is clearly slowed down for low and is considerably increased. Electron scattering at physical boundaries, which is almost absent in bulk gold, becomes relevant only when the electron mean free path in gold Hopkins et al. (2008); Gall (2016) is of the same order of the mean ligament diameter (as it is in our samples NPG3 and NPG9 with of and , respectively).
In Fig. 3(d)-(i) we compare cuts of the experimental data of Fig. 2(d)-(f) at fixed and with the prediction of the TT model scaled by for NPG3 and for NPG9. The relaxation dynamics for is fairly reproduced by the TT model in all plots of Fig. 3. The much higher for NPG if compared to bulk gold at is indicative of the much higher reached in NPG. The TT model accounts only for the dynamics of thermalized electrons and therefore it cannot reproduce the ultrafast variations of at very short . Especially at , a strong induced absorption signal can be seen for (see insets of panels (e) and (f)) and it can be attributed to the excitation of non-thermalized high-energy carriers Rotenberg et al. (2009, 2010); Baida et al. (2011); Della Valle et al. (2015); Di Mario et al. (2018). Hot carriers are almost absent in bulk gold for the same excitation conditions as for NPG, as expected due to the high density of field-enhancement hotspots in NPG and to the high surface/volume ratio Besteiro et al. (2017) of the NPG fractal structure Garoli et al. (2018). At the contribution of non-thermalized carriers to is much smaller Della Valle et al. (2012); Brown et al. (2017) and it does not impact on the fitting of the model to the data as seen in Fig. 3(h),(i). It has been observed Aruda et al. (2013) that surface functionalization of gold nanostructures leads to similar slowdown of the temperature dynamics. Further studies of functionalized nanoporous gold for future hot electron chemistry applications will be required to understand the combination of the two different slowdown effects.
In conclusion, the predictions of a geometrical scaling theory of nanoporous gold, concerning the reduced thermal capacitance, the weaker thermal link between electrons and phonons and the longer electron-phonon energy relaxation time if compared to bulk gold, could quantitatively account for the ultrafast temperature dynamics experimentally observed by pump-probe spectroscopy. On the basis of these results, higher electron temperatures and longer plasmon decay times can be engineered in gold nanostructures for future applications of hot-electron plasmonics.
References
- Atwater and Polman (2010) H. A. Atwater and A. Polman, Nature materials 9, 205 (2010).
- Manjavacas et al. (2014) A. Manjavacas, J. G. Liu, V. Kulkarni, and P. Nordlander, ACS nano 8, 7630 (2014).
- Brongersma et al. (2015) M. L. Brongersma, N. J. Halas, and P. Nordlander, Nature nanotechnology 10, 25 (2015).
- Wu et al. (2015) K. Wu, J. Chen, J. R. McBride, and T. Lian, Science 349, 632 (2015).
- Benz et al. (2016) F. Benz, M. K. Schmidt, A. Dreismann, R. Chikkaraddy, Y. Zhang, A. Demetriadou, C. Carnegie, H. Ohadi, B. de Nijs, R. Esteban, et al., Science 354, 726 (2016).
- Cortés et al. (2017) E. Cortés, W. Xie, J. Cambiasso, A. S. Jermyn, R. Sundararaman, P. Narang, S. Schlücker, and S. A. Maier, Nature communications 8, 14880 (2017).
- Lee et al. (2012) J. Lee, S. Mubeen, X. Ji, G. D. Stucky, and M. Moskovits, Nano letters 12, 5014 (2012).
- Mukherjee et al. (2012) S. Mukherjee, F. Libisch, N. Large, O. Neumann, L. V. Brown, J. Cheng, J. B. Lassiter, E. A. Carter, P. Nordlander, and N. J. Halas, Nano letters 13, 240 (2012).
- Zhang et al. (2017) Y. Zhang, S. He, W. Guo, Y. Hu, J. Huang, J. R. Mulcahy, and W. D. Wei, Chemical reviews 118, 2927 (2017).
- Zhang et al. (2018) Y. Zhang, T. R. Nelson, S. Tretiak, H. Guo, and G. C. Schatz, ACS nano (2018), 10.1021/acsnano.8b03830.
- Naik et al. (2013) G. V. Naik, V. M. Shalaev, and A. Boltasseva, Advanced Materials 25, 3264 (2013).
- Ruello et al. (2015) P. Ruello, A. Ayouch, G. Vaudel, T. Pezeril, N. Delorme, S. Sato, K. Kimura, and V. Gusev, Physical Review B 92, 174304 (2015).
- Besteiro et al. (2017) L. V. Besteiro, X.-T. Kong, Z. Wang, G. Hartland, and A. O. Govorov, ACS Photonics 4, 2759 (2017).
- Deacon et al. (2017) W. M. Deacon, A. Lombardi, F. Benz, Y. d. V.-I. Redondo, R. Chikkaraddy, B. de Nijs, M.-E. Kleemann, J. Mertens, and J. J. Baumberg, Physical review letters 119, 023901 (2017).
- Baida et al. (2011) H. Baida, D. Mongin, D. Christofilos, G. Bachelier, A. Crut, P. Maioli, N. Del Fatti, and F. Vallée, Physical review letters 107, 057402 (2011).
- Della Valle et al. (2012) G. Della Valle, M. Conforti, S. Longhi, G. Cerullo, and D. Brida, Physical Review B 86, 155139 (2012).
- Brown et al. (2017) A. M. Brown, R. Sundararaman, P. Narang, A. M. Schwartzberg, W. A. Goddard III, and H. A. Atwater, Physical review letters 118, 087401 (2017).
- Anisimov et al. (1974) S. Anisimov, B. Kapeliovich, and T. Perelman, Zh. Eksp. Teor. Fiz 66, 375 (1974).
- Carpene (2006) E. Carpene, Physical Review B 74, 024301 (2006).
- Hodak et al. (1998) J. H. Hodak, I. Martini, and G. V. Hartland, The Journal of Physical Chemistry B 102, 6958 (1998).
- Hrelescu et al. (2010) C. Hrelescu, J. Stehr, M. Ringler, R. A. Sperling, W. J. Parak, T. A. Klar, and J. Feldmann, The Journal of Physical Chemistry C 114, 7401 (2010).
- Aruda et al. (2013) K. O. Aruda, M. Tagliazucchi, C. M. Sweeney, D. C. Hannah, G. C. Schatz, and E. A. Weiss, Proceedings of the National Academy of Sciences , 201222327 (2013).
- Keller and Frontiera (2018) E. L. Keller and R. R. Frontiera, ACS nano 12, 5848 (2018).
- Yu et al. (2018) Y. Yu, V. Sundaresan, and K. A. Willets, The Journal of Physical Chemistry C 122, 5040 (2018).
- Olmon et al. (2012) R. L. Olmon, B. Slovick, T. W. Johnson, D. Shelton, S.-H. Oh, G. D. Boreman, and M. B. Raschke, Physical Review B 86, 235147 (2012).
- Biener et al. (2008) J. Biener, G. W. Nyce, A. M. Hodge, M. M. Biener, A. V. Hamza, and S. A. Maier, Advanced Materials 20, 1211 (2008).
- Ding and Chen (2009) Y. Ding and M. Chen, MRS bulletin 34, 569 (2009).
- Lang et al. (2011) X. Lang, L. Qian, P. Guan, J. Zi, and M. Chen, Applied Physics Letters 98, 093701 (2011).
- Detsi et al. (2014) E. Detsi, M. Salverda, P. R. Onck, and J. T. M. De Hosson, Journal of Applied Physics 115, 044308 (2014).
- Garoli et al. (2018) D. Garoli, E. Calandrini, A. Bozzola, A. Toma, S. Cattarin, M. Ortolani, and F. De Angelis, ACS Photonics (2018), 10.1021/acsphotonics.8b00676.
- Costescu et al. (2002) R. M. Costescu, A. J. Bullen, G. Matamis, K. E. O’Hara, and D. G. Cahill, Physical Review B 65, 094205 (2002).
- Hopkins et al. (2010) P. E. Hopkins, C. M. Reinke, M. F. Su, R. H. Olsson III, E. A. Shaner, Z. C. Leseman, J. R. Serrano, L. M. Phinney, and I. El-Kady, Nano letters 11, 107 (2010).
- Wang et al. (2011) Z. Wang, J. E. Alaniz, W. Jang, J. E. Garay, and C. Dames, Nano letters 11, 2206 (2011).
- Sundararaman et al. (2014) R. Sundararaman, P. Narang, A. S. Jermyn, W. A. Goddard III, and H. A. Atwater, Nature communications 5, 5788 (2014).
- Brown et al. (2015) A. M. Brown, R. Sundararaman, P. Narang, W. A. Goddard III, and H. A. Atwater, ACS nano 10, 957 (2015).
- Tagliabue et al. (2018) G. Tagliabue, A. S. Jermyn, R. Sundararaman, A. J. Welch, J. S. DuChene, R. Pala, A. R. Davoyan, P. Narang, and H. A. Atwater, Nature communications 9, 3394 (2018).
- Grupp et al. (2017) A. Grupp, A. Budweg, M. P. Fischer, J. Allerbeck, G. Soavi, A. Leitenstorfer, and D. Brida, Journal of Optics 20, 014005 (2017).
- Rotenberg et al. (2009) N. Rotenberg, J. N. Caspers, and H. M. van Driel, Physical Review B 80, 245420 (2009).
- Rotenberg et al. (2010) N. Rotenberg, M. Betz, and H. M. van Driel, Physical review letters 105, 017402 (2010).
- Della Valle et al. (2015) G. Della Valle, D. Polli, P. Biagioni, C. Martella, M. Giordano, M. Finazzi, S. Longhi, L. Duo, G. Cerullo, and F. B. De Mongeot, Physical Review B 91, 235440 (2015).
- Di Mario et al. (2018) L. Di Mario, T. O. Otomalo, D. Catone, P. O’Keeffe, L. Tian, S. Turchini, B. Palpant, F. Martelli, et al., Physical Review B 97, 115448 (2018).
- Qiu and Tien (1992) T. Qiu and C. Tien, International Journal of Heat and Mass Transfer 35, 719 (1992).
- McLachlan et al. (1990) D. S. McLachlan, M. Blaszkiewicz, and R. E. Newnham, Journal of the American Ceramic Society 73, 2187 (1990).
- Hopkins et al. (2008) P. E. Hopkins, P. M. Norris, L. M. Phinney, S. A. Policastro, and R. G. Kelly, Journal of Nanomaterials 2008, 22 (2008).
- Makinson (1938) R. Makinson, in Mathematical Proceedings of the Cambridge Philosophical Society, Vol. 34 (Cambridge University Press, 1938) pp. 474–497.
- Kaganov et al. (1957) M. Kaganov, I. Lifshitz, and L. Tanatarov, Sov. Phys. JETP 4, 173 (1957).
- Wang et al. (1994) X. Wang, D. M. Riffe, Y.-S. Lee, and M. Downer, Physical Review B 50, 8016 (1994).
- Gall (2016) D. Gall, Journal of Applied Physics 119, 085101 (2016).