Manifestation of electron correlation effect in states of uranium compounds revealed by resonant photoemission spectroscopy
Abstract
We have elucidated the nature of the electron correlation effect in uranium compounds by imaging the partial density of states (pDOS) of typical itinerant, localized, and heavy fermion uranium compounds by using the resonant photoemission spectroscopy. Obtained pDOS exhibit a systematic trend depending on the physical properties of compounds. The coherent peak at the Fermi level can be described by the band-structure calculation, but an incoherent peak emerges on the higher binding energy side () in the pDOS of localized and heavy fermion compounds. As the state is more localized, the intensity of the incoherent peak is enhanced and its energy position is shifted to higher binding energy. These behaviors are consistent with the prediction of the Mott metal-insulator transition, suggesting that the Hubbard- type mechanism takes an essential role in the electronic structure of actinide materials.
I INTRODUCTION
The electron correlation effect gives rise to an abundant variety of physical properties particularly in the - and -based materials. Among this class of materials, the uranium-based compounds share a unique position due to the interplay between their magnetic and superconducting properties. Particularly, the coexistence of a large magnetic moment and unconventional superconductivity is the most significant aspect of uranium-based compounds Pfleiderer (2009). These distinctive behaviors are due to the strongly correlated states which are located at the boundary between simple localized and itinerant pictures of electrons. To understand the origin of these remarkable physical properties, it is essential to unveil the electronic structures.
Resonant photoemission (RPES) is a powerful experimental tool which is capable of identifying the contribution from a specific atomic orbital in the valence band spectra Allen (1992). It has been applied to strongly correlated - and -electron materials, and their and partial density of states (pDOS) have been obtained experimentally Allen (1992); Laubschat (1998); Laubschat et al. (1990); Fujimori (2016). For Ce-based compounds, the () and the () absorption edges have been frequently utilized to image their pDOS. In the case of uranium compounds, the absorption edge () has been utilized to obtain the pDOS Iwan et al. (1981). However, the mean free path of photoexcited valence electrons at these photon energies has the shortest value (), and the spectra are dominated by the information of less than one unit cell from the surface where the electrons are much localized than those in the bulk Fujimori et al. (1999). Although an enhanced bulk sensitivity of more than 15 Å is expected at the absorption edge (), the absence of the resonance enhancement of signals at this absorption edge was reported by Allen et al. Allen et al. (1996). On the other hand, Tobin et al. recently reported a finite resonance enhancement in the resonant inverse photoemission (RIPES) spectra of Tobin and Yu (2011). The enhancement factor is about 2 which is more than one order smaller than the values of or RPESs. Nevertheless, this finite enhancement is enough for the identification of the contributions from the unoccupied states among other orbitals.
In the present study, we have measured the photon energy dependence of the photoemission spectra of uranium compounds at the absorption energy very precisely, and discovered the finite enhancement of signals of about 15–20 % at the edge. We have utilized this enhancement to image the bulk pDOS of some uranium compounds, and unveiled the nature of the electron correlation effect in these compounds.
We selected , , and as typical itinerant, localized, and heavy fermion compounds, respectively. is a spin-fluctuation system with itinerant state, and its band structure and Fermi surface are essentially described by the band-structure calculation Aoki et al. (2000). On the other hand, is a prototypical localized compound Radwański and Kim-Ngan (1995); Diviš et al. (1996) which undergoes a ferromagnetic phase below a Curie temperature of . The heavy fermion superconductor is characterized by the large specific heat coefficient of Geibel et al. (1991). It undergoes an antiferromagnetic phase below the Neel temperature of and superconducting phase below . Although its overall band structure can be described by the band-structure calculation, the electronic structure in the vicinity of is modified due to the electron correlation effect Fujimori et al. (2007, 2014, 2010, 2016).
II EXPERIMENTAL PROCEDURES
Photoemission experiments were performed at the soft X-ray beamline BL23SU of SPring-8 Saitoh et al. (2012). The overall energy resolution at was about . The on- and off-resonance photon energies were chosen for each compound to minimize the influences of the contributions from ligand states. Clean sample surfaces were obtained by cleaving high-quality single crystals in situ under ultra-high vacuum condition. The sample temperature was kept at during the measurements for all compounds, and and were in the paramagnetic phase whereas was in the ferromagnetic phase. It should be noted that no recognizable changes were observed between the spectra of measured above and below . To evaluate the photon flux on the sample surface, we monitored the photoemission intensities of shallow core-level spectra of ligand atoms, and the photon energy dependencies of their photoionization cross sections were also taken into account by referring the values from the atomic calculation Yeh and Lindau (1985).
III RESULTS and DISCUSSION
III.1 Itinerant compound
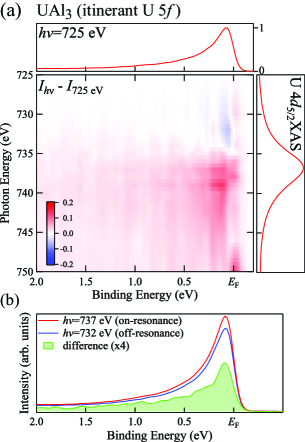
Figure 1 shows the RPES spectra and the X-ray absorption spectroscopy (XAS) spectrum of . The top and right panels in Fig. 1 (a) represent the photoemission spectrum measured at and the XAS spectrum, respectively. The XAS spectrum has a maximum at , and the photon energy of is about below from the absorption energy. The density plot in the center of Fig. 1 (a) represents the difference between the spectrum measured at and that measured at each photon energy. The horizontal and vertical axes are the binding energy and the incident photon energy, respectively. All spectra are normalized to the maximum of the spectrum measured at as a unity.
As the photon energy approaches to the absorption edge, the photoemission intensity just below is enhanced. The enhancement of the signal is much weaker than that observed in the signals at the absorption edge of -based compounds, where the enhancement factor is higher than 40 Fujimori (2016). Nevertheless, the enhancement of signal coincides with the intensity of the XAS spectrum, and no Auger signal, which would appear as a diagonally-right down traces in the density plot, was observed. This result indicates that the enhancement is indeed due to the Coster–Kronig type excitation in the resonant process, and not to the overlap of normal Auger signals. Furthermore, a similar weak enhancement was observed at the absorption edge (, not shown), suggesting the enhancement originates from resonant process.
In Fig. 1 (b), the on-resonance () and off-resonance () spectra, along with the corresponding difference spectrum, are shown. The shape of the difference spectrum was found to be similar to the that of the valence band spectra of itinerant uranium compounds such as Ohkochi et al. (2008) and Fujimori et al. (2012a), and it is consistent with the itinerant nature of observed in our previous angle-resolved photoelectron spectroscopy (ARPES) study Fujimori et al. (2017).
III.2 Localized compound
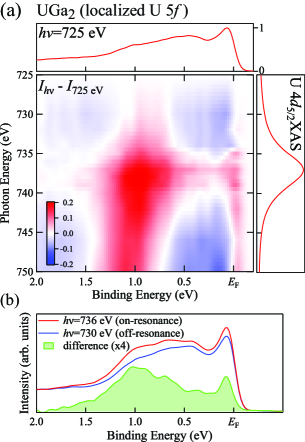
Figure 2 shows the same representation of the localized compound . The spectrum measured at , which is shown in the top panel, consists of a sharp peak at the Fermi level and multiple peaks on the higher binding energy side. In the photon energy dependence of the spectra shown in the central density plot, an enhancement is recognized although its appearance is very different from that of . Two different energy locations of the resonance enhancement were observed: One at the Fermi level and the other centered at . Since the enhancement in the latter is greater, the states are mainly localized in this compound. Figure 2 (b) shows the on-resonance () and off-resonance () spectra, and the corresponding difference spectrum. The difference spectrum exhibits a sharp peak at the Fermi level and a broad peak centered at with a much stronger contribution, and its overall structure differs remarkably from that of .
III.3 Heavy Fermion compound
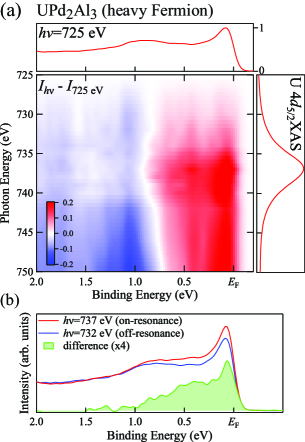
Figure 3 summarizes the RPES spectra of the heavy fermion compound . The photon energy dependence of the spectra is different from the cases of and . The intensity in the energy region of exhibits an enhancement at the absorption edge. Furthermore, two vertical streaks are recognized in this image: One at the Fermi level and the other centered at . Figure 3 (b) shows the on- and off-resonance spectra of measured at and , respectively. The difference spectrum is also indicated, and its profile is different from those of the itinerant compound and the localized compound . The spectrum has a sharp peak at , but in contrast with the spectrum of , there is a broad hump at . Furthermore, its intensity is much weaker than that of the broad peak in the analogous spectrum of .
III.4 Comparison with band-structure calculation
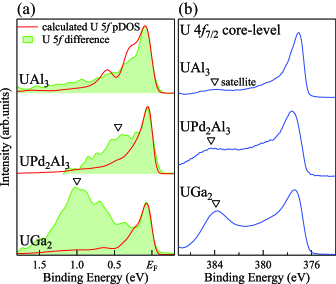
To further understand the implication of these difference spectra, we compared them with the calculated pDOS as shown in Fig. 4 (a). The red curves represent the pDOS obtained by the band-structure calculation based on the local density approximation (LDA) where all electrons are treated as itinerant. The calculated pDOS were multiplied by the Fermi-Dirac function and broadened by the instrumental energy resolution to simulate the experimental difference spectra. A systematic deviation of the calculated pDOS from the experimental difference spectra is recognized. In the case of the itinerant compound , there is a good agreement between them. Both of them have a sharp peak at the Fermi level and exhibit a long tail toward higher-binding energies. On the other hand, in the case of the heavy fermion compound , although the peak at the Fermi level is well reproduced by the calculation, there is a broad peak around that cannot be explained by the calculation. Furthermore, in the case of the localized compound , the intensity of the broad peak is remarkably enhanced, and its energy position is shifted toward higher-binding energies (). The structure is completely missing in the calculated pDOS. Accordingly, the broad peak appears in the higher-binding energies in the valence band spectra of the heavy fermion compound and localized compound, and it cannot be explained within the framework of the LDA, suggesting that these broad peaks originate from the partially localized nature of states.
The partially localized nature of the states in these compounds were also observed in their core-level spectra which are a sensitive probe of the local electronic structures of uranium site Fujimori et al. (1998).Figure 4 (b) shows the core-level spectra of these compounds. Data were replotted from Refs. Fujimori et al. (2016) and Fujimori et al. (2012b). In all spectra, the main peak is accompanied by a satellite at an approximately higher binding energy side of the main line. This is designated as “ satellite” Schneider and Laubschat (1981) which originates from the unscreened state in the photoemission final state Fujimori et al. (2016); Fujimori et al. (2012b). Its intensity exhibits a similar behavior to that of the broad peaks in their valence band spectra: As the degree of the localization of state increases, the intensity of the satellite is enhanced. Thus, it should be reasonable to assume that the broad peaks in the valence band spectra also originate from a similar local-type excitation with the same unscreened -dominant final state character.
The behavior of the double-peak structure of the pDOS coincides with that of the spectral profile of the Mott metal-insulator transition where the incoherent satellite peak is shifted toward higher binding energies and its intensity is enhanced as increases Zhang et al. (1993) ( and are the on-site Coulomb energy and the one-electron band width, respectively). Thus, the broad peak in the valence band spectra corresponds to the incoherent localized state with the final state character, and the Hubbard- type mechanism takes an essential role in the electronic structure.
Here, note that the previous ARPES studies on revealed that the bands at the Fermi level are renormalized due to the electron correlation effect in the energy scale of less than few-hundred meV Fujimori et al. (2007, 2014, 2010, 2016), but presumably the angle-integrated nature hindered their detection in these difference spectra. Thus the correlation effect in states appears in two different energy scales: Renormalization of bands in the vicinity of the Fermi level Durakiewicz et al. (2008) and the appearance of the incoherent peak on higher binding energies. This hierarchal nature of the electron structure in compounds was also theoretically predicted by DMFT+ calculation and the intermediate Coulomb- coupling Das et al. (2013).
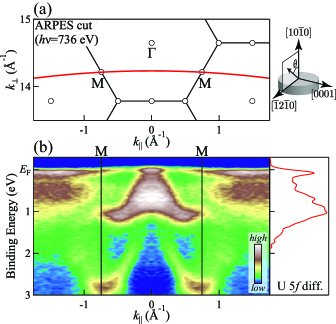
III.5 Resonant ARPES study of
To further unveil the nature of the incoherent peak, we have measured the ARPES spectra of at which corresponds to the on-resonance condition. In the experimental setup, the sample surface was parallel to the axis, and the angular scan was along direction. The ARPES cut traces in momentum space along the direction as illustrated in Fig. 5 (a). Figure 5 (b) shows the ARPES spectra of measured along the ARPES cut together with the difference spectrum in the left panel. In addition to the narrow band at the Fermi level, dispersive bands were observed in the energy region of , where the incoherent peak has a dominant contribution in the difference spectrum. In particular, a bell-shaped structure with an energy dispersion of about was observed around the point, suggesting that the incoherent “localized” state also have a sizable hybridization with ligand states.
The dispersive nature of the incoherent peak in compounds is in accord with the theoretical calculations Das et al. (2013); Zwicknagl (2007). Similar dispersive nature of the incoherent peak was also reported in the transition metal compound Takizawa et al. (2009), and thus it could be a common feature of incoherent states. On the other hand, the energy dispersions were hardly observed experimentally in the incoherent peak of the heavy fermion compound Chen et al. (2018), suggesting that there exist fundamental differences in the energy scale between and compounds although their transport properties are often very similar each other. Such fundamentally-different natures between and states were also reported by the recent systematic analysis of ferromagnetic compounds Tateiwa et al. (2017).
IV CONCLUSION
In summary, we have revealed the electronic structures of typical uranium compounds using RPES. Incoherent satellite peaks were observed in the spectra of the heavy fermion compound and the localized compound , whose behavior fit well with the mechanism of the Mott metal-insulator type transition. Moreover, the unique physical properties such as unconventional superconductivity emerge in the intermediate Coulomb region as in the case of . The incoherent component of exhibits an energy dispersion of about , suggesting that it has a sizable hybridization. These results indicate that the nature of the localized electrons differs from that of compounds, and the application of a simple localized model is not suitable for their description even for localized compounds.
Acknowledgements.
The authors thank A. Tanaka, M. Taguchi, and K. Okada for stimulating discussion. The experiment was performed under Proposal Nos 2014B3820, 2015A3820, 2015B3820, 2016A3810, and 2016B3811 at SPring-8 BL23SU. The present work was financially supported by JSPS KAKENHI Grant Numbers 26400374 and 16H01084 (J-Physics).References
- Pfleiderer (2009) C. Pfleiderer, Rev. Mod. Phys. 81, 1551 (2009).
- Allen (1992) J. Allen, in Synchrotron Radiation Research (Springer, 1992), p. 253.
- Laubschat (1998) C. Laubschat, J. Electron Spectrosc. Relat. Phenom. 96, 127 (1998).
- Laubschat et al. (1990) C. Laubschat, E. Weschke, G. Kalkowski, and G. Kaindl, Physica Scripta 41, 124 (1990).
- Fujimori (2016) S.-i. Fujimori, J. Phys. Condens. Matter 28, 153002 (2016).
- Iwan et al. (1981) M. Iwan, E. E. Koch, and F.-J. Himpsel, Phys. Rev. B 24, 613 (1981).
- Fujimori et al. (1999) S.-i. Fujimori, Y. Saito, M. Seki, K. Tamura, M. Mizuta, K.-i. Yamaki, K. Sato, A. Tanaka, N. Sato, S. Suzuki, S. Sato, T. Okane, T. Komatsubara, Y. Tezuka, S. Shin, and T. Ishii, Phys. Rev. B 59, 10469 (1999).
- Allen et al. (1996) J. Allen, Y.-X. Zhang, L. Tjeng, L. Cox, M. Maple, and C.-T. Chen, J. Electron Spectrosc. Relat. Phenom. 78, 57 (1996).
- Tobin and Yu (2011) J. G. Tobin and S.-W. Yu, Phys. Rev. Lett. 107, 167406 (2011).
- Aoki et al. (2000) D. Aoki, N. Watanabe, Y. Inada, R. Settai, K. Sugiyama, H. Harima, T. Inoue, K. Kindo, E. Yamamoto, Y. Haga, and Y. Ōnuki, J. Phys. Soc. Jpn. 69, 2609 (2000).
- Radwański and Kim-Ngan (1995) R. Radwański and N. Kim-Ngan, J. Magn. Magn. Mater. 140-144, 1373 (1995).
- Diviš et al. (1996) M. Diviš, M. Richter, H. Eschrig, and L. Steinbeck, Phys. Rev. B 53, 9658 (1996).
- Geibel et al. (1991) C. Geibel, C. Schank, S. Thies, H. Kitazawa, C. Bredl, A. Bohm, M. Rau, A. Grauel, R. Caspary, R. Helfrich, U. Ahlheim, G. Weber, and F. Steglich, Z. Phys. B 84, 1 (1991).
- Fujimori et al. (2007) S.-i. Fujimori, Y. Saitoh, T. Okane, A. Fujimori, H. Yamagami, Y. Haga, E. Yamamoto, and Y. Ōnuki, Nat. Phys. 3, 618 (2007).
- Fujimori et al. (2014) S.-i. Fujimori, I. Kawasaki, A. Yasui, Y. Takeda, T. Okane, Y. Saitoh, A. Fujimori, H. Yamagami, Y. Haga, E. Yamamoto, and Y. Ōnuki, JPS Conf. Proc. 3, 011072 (2014).
- Fujimori et al. (2010) S.-i. Fujimori, T. Ohkochi, T. Okane, Y. Saitoh, A. Fujimori, H. Yamagami, Y. Haga, E. Yamamoto, and Y. Onuki, IOP Conf. Ser.: Mater. Sci. Eng. 9, 012045 (2010).
- Fujimori et al. (2016) S.-i. Fujimori, Y. Takeda, T. Okane, Y. Saitoh, A. Fujimori, H. Yamagami, Y. Haga, E. Yamamoto, and Y. Ōnuki, J. Phys. Soc. Jpn. 85, 062001 (2016).
- Saitoh et al. (2012) Y. Saitoh, Y. Fukuda, Y. Takeda, H. Yamagami, S. Takahashi, Y. Asano, T. Hara, K. Shirasawa, M. Takeuchi, T. Tanaka, and H. Kitamura, J. Synchrotron Rad. 19, 388 (2012).
- Yeh and Lindau (1985) J. Yeh and I. Lindau, Atomic Data and Nuclear Data Tables 32, 1 (1985).
- Ohkochi et al. (2008) T. Ohkochi, S.-i. Fujimori, H. Yamagami, T. Okane, Y. Saitoh, A. Fujimori, Y. Haga, E. Yamamoto, and Y. Ōnuki, Phys. Rev. B 78, 165110 (2008).
- Fujimori et al. (2012a) S.-i. Fujimori, T. Ohkochi, T. Okane, Y. Saitoh, A. Fujimori, H. Yamagami, Y. Haga, E. Yamamoto, and Y. Ōnuki, Phys. Rev. B 86, 235108 (2012a).
- Fujimori et al. (2017) S.-i. Fujimori, M. Kobata, Y. Takeda, T. Okane, Y. Saitoh, A. Fujimori, H. Yamagami, Y. Haga, E. Yamamoto, and Y. Ōnuki, Phys. Rev. B 96, 115126 (2017).
- Fujimori et al. (1998) S.-i. Fujimori, Y. Saito, N. Sato, T. Komatsubara, S. Suzuki, S. Sato, and T. Ishii, Solid State Commun. 105, 185 (1998).
- Fujimori et al. (2012b) S.-i. Fujimori, T. Ohkochi, I. Kawasaki, A. Yasui, Y. Takeda, T. Okane, Y. Saitoh, A. Fujimori, H. Yamagami, Y. Haga, E. Yamamoto, Y. Tokiwa, S. Ikeda, T. Sugai, H. Ohkuni, N. Kimura, and Y. Ōnuki, J. Phys. Soc. Jpn. 81, 014703 (2012b).
- Schneider and Laubschat (1981) W.-D. Schneider and C. Laubschat, Phys. Rev. Lett. 46, 1023 (1981).
- Zhang et al. (1993) X. Y. Zhang, M. J. Rozenberg, and G. Kotliar, Phys. Rev. Lett. 70, 1666 (1993).
- Durakiewicz et al. (2008) T. Durakiewicz, P. S. Riseborough, C. G. Olson, J. J. Joyce, P. M. Oppeneer, S. Elgazzar, E. D. Bauer, J. L. Sarrao, E. Guziewicz, D. P. Moore, M. T. Butterfield, and K. S. Graham, Europhys. Lett. 84, 37003 (2008).
- Das et al. (2013) T. Das, J.-X. Zhu, and M. J. Graf, J. Mater. Res. 28, 659 (2013).
- Zwicknagl (2007) G. Zwicknagl, Int. J. Mod. Phys. B 21, 2232 (2007).
- Takizawa et al. (2009) M. Takizawa, M. Minohara, H. Kumigashira, D. Toyota, M. Oshima, H. Wadati, T. Yoshida, A. Fujimori, M. Lippmaa, M. Kawasaki, H. Koinuma, G. Sordi, and M. Rozenberg, Phys. Rev. B 80, 235104 (2009).
- Chen et al. (2018) Q. Y. Chen, C. H. P. Wen, Q. Yao, K. Huang, Z. F. Ding, L. Shu, X. H. Niu, Y. Zhang, X. C. Lai, Y. B. Huang, G. B. Zhang, S. Kirchner, and D. L. Feng, Phys. Rev. B 97, 075149 (2018).
- Tateiwa et al. (2017) N. Tateiwa, J. c. v. Pospíšil, Y. Haga, H. Sakai, T. D. Matsuda, and E. Yamamoto, Phys. Rev. B 96, 035125 (2017).