Please Forget Where I Was Last Summer:
The Privacy Risks of Public Location (Meta)Data
Abstract
The exposure of location data constitutes a significant privacy risk to users as it can lead to de-anonymization, the inference of sensitive information, and even physical threats. In this paper we present LPAuditor, a tool that conducts a comprehensive evaluation of the privacy loss caused by publicly available location metadata. First, we demonstrate how our system can pinpoint users’ key locations at an unprecedented granularity by identifying their actual postal addresses. Our experimental evaluation on Twitter data highlights the effectiveness of our techniques which outperform prior approaches by 18.9%-91.6% for homes and 8.7%-21.8% for workplaces. Next we present a novel exploration of automated private information inference that uncovers “sensitive” locations that users have visited (pertaining to health, religion, and sex/nightlife). We find that location metadata can provide additional context to tweets and thus lead to the exposure of private information that might not match the users’ intentions.
We further explore the mismatch between user actions and information exposure and find that older versions of the official Twitter apps follow a privacy-invasive policy of including precise GPS coordinates in the metadata of tweets that users have geotagged at a coarse-grained level (e.g., city). The implications of this exposure are further exacerbated by our finding that users are considerably privacy-cautious in regards to exposing precise location data. When users can explicitly select what location data is published, there is a 94.6% reduction in tweets with GPS coordinates. As part of current efforts to give users more control over their data, LPAuditor can be adopted by major services and offered as an auditing tool that informs users about sensitive information they (indirectly) expose through location metadata.
I Introduction
The capability of modern smartphones to provide fine-grained location information in real time has enabled the deployment of a wide range of novel functionality by online services. In Twitter users can incorporate location information in their tweets to provide more context and enrich their communications [52], or even enhance situational awareness during critical events [77]. Nonetheless, the presence of location metadata in a by-default-public data stream like Twitter constitutes a significant privacy risk. Apart from potentially enabling physical threats like stalking [31, 57] and “cybercasing” [27], location information could lead to the inference of very sensitive data [51, 13], and even get combined with other information collected from online services [58]. Previous work has demonstrated how to identify users’ key locations (i.e., home and work) at a postcode [22] or very coarse-grained (10,000m2) level [35, 16]. However, this coarse granularity fails to highlight the true extent of the privacy risks introduced by the public availability of geographical information in users’ tweets. Furthermore, these studies have not explored what sensitive information can be inferred from users geotagging tweets at other locations.
In this paper we develop LPAuditor, a system that examines the privacy risks users face due to publicly accessible location information, and conduct a large scale study leveraging Twitter data and public APIs. Initially we present techniques for identifying a user’s home and work at a postal address granularity; our heuristics are built around intuitive social and behavioral norms. We first conduct a two-level clustering process for creating clusters of tweets and mapping them to postal addresses, which is robust to errors in the GPS readings of smartphones [79] as well as minor spatial displacement due to user mobility (e.g., the user tweeting while arriving or departing from home). Subsequently we analyze the spatio-temporal characteristics of a user’s tweets and break down the user’s tweeting behavior in time windows of varying granularity; we identify the most long-lived clusters in regards to weekend tweeting activity, and then select the one with the largest number of one-hour time windows that contain at least one tweet. For identifying users’ workplaces, we introduce the first adaptive technique that handles users with varying or split shift schedules at work. Specifically, we identify the longest clusters in terms of active weeks. Then, we extract the dominant time frame of each cluster by superimposing their daily time frames, even ones spanning two different days (i.e. night shifts), and excluding any hours that appear to be outliers, as well as any clusters that have a repeated activity of more than 10 hours and, finally, select the cluster with the largest number of active weeks.
Through an arduous manual process we create a ground truth dataset for 2,047 users, which enables us to experimentally evaluate our auditing tool. Our system is able to identify the home and workplace for 92.5% and 55.6% of the users respectively. When compared to state-of-the-art results, we find that our techniques outperform previous approaches by 18.9%-91.6% for homes and 8.7%-21.8% for workplaces.
Apart from the increased effectiveness of our techniques, our work demonstrates that by leveraging widely available geolocation databases attackers can pinpoint users’ key locations at a granularity that is orders of magnitude more precise than previously demonstrated. Without doubt, this level of accuracy renders the identification of users a trivial task. The privacy implications of our findings are even more alarming when considering the prominent role that platforms like Twitter play in protests and other forms of social activism [36]. Indeed, a substantial number of users choose to not reveal their actual identity on Twitter, and prior work has found a correlation between the choice of anonymity and the sensitivity of topics in tweets [54]111This study also reported that 5.9% of Twitter accounts are anonymous and another 20% do not disclose their full name. and other online posts [53].
LPAuditor offers a comprehensive analysis of the privacy loss caused by location metadata by also exploring whether the remaining locations can be used to infer personal information that is typically considered sensitive. While the inference of sensitive information has been one of the main motivations behind prior research on location-privacy [61], such automated attacks have not been demonstrated in practice. Our system examines tweets that place the user at (or in close proximity of) locations that are associated with such information. Currently we search for locations pertaining to three sensitive topics: religion, medical issues, and sex/nightlife. We find that 71% of users have tweeted from sensitive locations, 27.5% of which can be placed there with high confidence based on the content of their tweets. Privacy loss is amplified by the location metadata as it leaks additional contextual details to the tweet’s content; e.g., the user may simply mention being at a doctor without giving more details, while the location metadata places the user at an abortion clinic. We also explore a spatiotemporal-based approach and find that 29.5% of the users can be placed at a sensitive location regardless of the content of their tweets. As such, we envision LPAuditor being offered as an auditing tool by social networks and location-based services, providing users with an overview of the sensitive information that can be inferred based on their publicly accessible location data. This can support recently stated initiatives of giving users more control over their data [3].
Finally, our study reveals that older versions of the Twitter app implement a privacy-invasive policy. Specifically, tweets that are geotagged by users at a coarse level (e.g., city) include the user’s exact coordinates in the tweets’ metadata. This privacy violation is invisible to users, as the GPS coordinates are only contained in the metadata returned by the API and not visible through the Twitter website or app. To make matters worse, this historical metadata currently remains publicly accessible through the API. We quantify the impact of Twitter’s invasive policy, and find that it results in an almost 15-fold increase in the number of users whose key locations are successfully identified by our system. In an effort to remediate this significant privacy threat we have disclosed our findings to Twitter. In summary, our main research contributions are:
-
We conduct a comprehensive, IRB-approved, large-scale exploration of the privacy risks that users face when location data is, either explicitly or inadvertently, shared in a public data stream like Twitter’s API.
-
We develop LPAuditor, a system that leverages location metadata for identifying key locations with high precision, outperforming state-of-the-art approaches. Apart from achieving superior granularity, we also introduce a clustering approach that renders our system robust to errors in GPS readings or spatial displacement due to user mobility.
-
We present the first, to our knowledge, study on the feasibility of automated location-based inference attacks. Our system leverages novel content-based and spatiotemporal techniques for inferring sensitive user information, thus, validating the motivation of prior location-privacy research.
-
We measure the impact of Twitter’s invasive policy for collecting and sharing precise location data and quantify the lingering implications. Our study on user geotagging behavior reveals that users are restrained when publishing their location and avoid including exact coordinates when given control by the underlying system, yet remain exposed due to the availability of this historical data.
II Motivation and Threat Model
The sensitive nature of mobility data is well known to the research community, which has proposed various techniques so far for limiting the granularity of the location data that services can obtain (e.g., [32]). In practice, however, such defenses have not seen wide deployment and a large number of mobile apps collect precise locations [64]. While prior work has proposed approaches for identifying key locations (home and work), the reported granularity is not sufficient for demonstrating the true extent of the threat (e.g., [22, 35, 16, 17]). More importantly, the risk of sensitive information being inferred from other location data points remains unexplored.
Despite the privacy risk this data poses to users, services do not stringently prohibit access to it and may expose it to third parties [41] or render it publicly accessible. To demonstrate the extent and accuracy of sensitive information inference that an adversary can achieve, we develop and evaluate LPAuditor exclusively using public and free data streams and APIs. Furthermore, we design our system to be application-independent and applicable to other location datasets. We show that location metadata enables the inference of sensitive information that could be misused for a wide range of scenarios (e.g., from a repressive regime de-anonymizing an activist’s account to an insurance company inferring a customer’s health issues, or a potential employer conducting a background check). While we build a tool that can be adopted by online services for better protecting users’ privacy, the techniques employed by our system could be applied by a wide range of adversaries or invasive third parties. By demonstrating the severity and practicality of such attacks, we aim to initiate a public discussion and incentivize the adoption of privacy-preserving mechanisms.
III System Overview
In this section we provide an overview of our system. First we describe how LPAuditor clusters location data and identifies key locations. Next we provide details on our methodology for identifying sensitive locations that users may have visited. Finally, we provide some implementation details.
III-A Data Labeling and Clustering
Labeling tweets. The first step is to label each geotagged tweet with the corresponding postal address. To highlight the extent of the risk that users face, we opt for publicly available API services that could be trivially employed by attackers for mapping each tweet’s GPS coordinates to an address. To that end, we use the reverse geocoding API by ArcGIS [10] for the majority of our labels, and the more accurate but rate-limited Google Maps Geocoding API [30] for the subset of labels that are more critical to our accuracy. While this allows us to improve our system’s performance, in practice, if LPAuditor is adopted by a major service like Twitter, Google Maps could be used for the entirety of the calls.
Since our dataset is large in size, we developed a form of caching that allows avoiding unnecessary API calls. Instead of issuing a call for every pair of coordinates we come across, we estimate the spatial position of the pair of coordinates and search for nearby coordinates that have already been labeled. If the distance to a labeled pair of coordinates is less than two meters, we assign the same address label to the new pair of coordinates. Experimentally, we found that this approach reduced the number of API calls our system issued by 42.5%.
It should be noted, however, that geocoding APIs do not always return an address. We label those tweets with “unknown address”. After a manual investigation and verification of a random subset, we observed that they typically correspond to places like university campuses, airports or remote rural areas that do not have exact postal addresses. Nonetheless, while we don’t have a postal address in these cases, the granularity of our process is unaffected as we still have the GPS coordinates.
Initial clustering. LPAuditor groups tweets assigned to the same postal address into a single cluster (we refer to this as first-level clustering). Then, by taking into consideration the coordinates of all the tweets of a cluster, we calculate the coordinates for the cluster’s mid-point (geometric center). To verify that the label assigned to a cluster indeed corresponds to the cluster’s actual address, we use the Google Maps API for retrieving the address of the cluster’s mid-point coordinates. If the address returned from Google’s API does not match the already assigned address label for the cluster, due to incompatibilities between the two APIs or borderline cases where our caching approach results in assigning a neighboring address, we opt for the address returned from Google’s API. However, due to Google’s stricter API rate limits, we only use this methodology for verifying the address of the 10 largest clusters of each user, which we have empirically found to be the most prominent and significant ones. This follows our threat model constraint of demonstrating what attacks can be conducted using free and public APIs. In practice, attackers with many resources could avoid rate limiting or use other proprietary geolocating databases.
For tweets with the “unknown address” label we employ the DBSCAN algorithm [23]. We empirically set our threshold to 30 meters, but due to its cascading effect we may cluster together points that have a greater distance due to other points laying in between them. We only use DBSCAN for clustering tweets that have been marked with “unknown address” (16% of clusters); nearby tweets that have been labeled with an actual address are not considered by DBSCAN.
Second-level clustering. We have observed that the initial clustering approach can result in multiple neighboring clusters for a specific place. The most common case involves one large dominant cluster in the area and a few significantly smaller clusters next to it, in close proximity. In general, it is difficult to distinguish which tweets belong to each cluster, even by plotting the coordinates of these tweets on a map and visually inspecting them. Through an empirical analysis, where we visually inspected clusters and cross referenced the timing of their tweets, it became apparent that these closely neighboring clusters typically correspond to a single user location but have been mapped to a neighboring address. Various factors can lead to this, such as inaccuracies in the user’s GPS readings [79], the precision of the geocoding APIs, as well as differences in the actual tweeting position of the user (tweeting when leaving a place or arriving, being in the backyard or at a neighbor etc.).
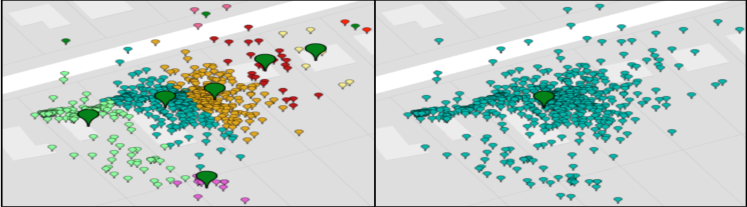
As these nearby clusters most likely correspond to the same place, we implement a second-level clustering for grouping such neighboring clusters into a larger one.222For the remainder of the paper, referring to clusters will imply second-level clusters unless stated otherwise. First we identify which cluster in an area of multiple neighboring clusters is dominant, i.e., has the most tweets, and then we employ a modified version of the DBSCAN algorithm for estimating which clusters should be merged with the dominant one. For this clustering we consider that the distance between the mid-point of the larger central cluster and all the smaller ones should not exceed 50 meters.333We set this threshold based on the value in the FCC mandate for 911 caller location accuracy [25], as it can account for GPS errors but is not prohibitively large so as to lead to false positives. We also experimentally verified its suitability. To eliminate DBSCAN’s cascading effect we check this distance before deciding whether a cluster should be included in the new one. An example is shown in Figure 1, where there are several clusters of significant size, with smaller clusters around them. All tweets in a cluster are depicted with a common color, and the dark green pins denote the center of the various clusters, with the size of each cluster pin being dependent on the number of tweets mapped to it.
Overall, implementing our second-level of clustering allows us to introduce a (configurable) radius for effectively mapping these “runaway” data points to the main cluster. Nonetheless, it is important to note that the initial clustering step (using the geocoding API) is actually necessary; solely applying DBSCAN’s radius-based clustering to the dataset leads to oversized clusters and eliminates the finer granularity that is achieved by the two-level clustering approach.
III-B Identifying Key User Locations
Here we describe how LPAuditor selects the clusters that represent two key user locations (home and workplace) in an automated fashion. Our system does not take into consideration the content and semantics of the tweets posted, but only the temporal characteristics and distribution of the tweets in each cluster. It should be emphasized that our work focuses on location metadata and not the tweet content as this allows us to quantify the true extent of the privacy risks introduced by location metadata: even cautious users that do not explicitly disclose information about their key locations face this privacy loss. However, LPAuditor leverages the content for increasing confidence in placing users in other sensitive locations, as discussed in Section III-C. It is imperative to note that our system incorporates heuristics that are built upon intuitive assumptions regarding common human behavior and legislative norms (e.g., 8-hour shifts) in the US (location of our study’s users) and many other countries as well (e.g., in the European Union). While highly effective, these heuristics may require tweaking for countries with vastly different social norms or legislature; such cases are out of the scope of this work.
First we obtain the local timezone corresponding to each cluster from its mid-point coordinates, and then convert the timestamp of each tweet to the local time. This allows us to identify tweets that have been posted within specific hours, and understand the user’s daily routine and behavior in depth. For capturing the temporal characteristics of each cluster and understanding the user’s activity and tweeting patterns, our system identifies active time windows, i.e., time windows with at least one geotagged tweet for a particular cluster. Apart from days or weeks, time windows can be set to represent weekdays, weekends, or even specific time frames at a granularity of hours (e.g., afternoon, late night).
Homes exhibit distinct characteristics compared to other places users regularly visit, as that is where people typically return at the end of the day and also spend a considerable amount of time. Due to the non-ephemeral relationship people have with their home, the temporal characteristics of a user’s tweeting behavior can sufficiently distinguish this location from other visited locations. One exception could be users that are considerably privacy-cautious and refrain from posting geotagged tweets from their home or surrounding areas.
Our approach for identifying a user’s home cluster is based on the following intuitions: (i) as the user spends some time at home every day, we expect to repeatedly observe some activity from this cluster (i.e., multiple active windows in this cluster’s timespan), and (ii) the tweets of this cluster will not occur solely within a specific time frame, but we expect tweets that correspond to almost all hours in the day. In other words, while other clusters of a user may follow a specific well-defined temporal pattern, we expect the home cluster to exhibit a more “chaotic” behavior in the long term, having tweets that were posted at different times throughout the day, from early in the morning to very late at night.
While experimenting with two approaches for specifying the time windows (i.e., only weekends vs entire weeks), we observed that a week-based time window may introduce uncertainty for users that exhibit considerable activity from multiple clusters. As such, we design a robust home-inferring algorithm by only considering weekends. We determine which are the user’s five most active clusters “horizontally”, i.e., those with the highest number of active weekends, and estimate the time frame and active hours of each of these clusters. Following our intuition that the home will exhibit more widespread temporal activity from a macroscopic viewpoint, we choose the cluster with the broadest time frame as the user’s home.
Work. We expect that, for most users, tweets posted from work will follow a well-defined time frame that corresponds to the user’s working hours. We set the time window to the entire week and identify the five most active clusters, i.e., those with the highest number of active weeks (in the horizontal dimension). We ignore the home cluster when assembling this set. For each of the remaining candidate clusters we try to identify the cluster’s most dominant time frame. To that end, we identify all the distinct days in which the user has posted more than one tweet, and use the day’s earliest and latest tweet for calculating the time frame of that day. After estimating the time frame of each active day, we superimpose all these time frames and consider as the dominant time frame the set of hours that appears in more than half of the active days of the cluster. This allows us to avoid including insignificant hours, e.g., for days where the user happened to go to work a little earlier or later than usual. At the same time this also allows us to handle users that have a more lax schedule or may work in shifts. We also account for users that work night shifts, which span two consecutive dates; specifically, we consider instances of active time windows that span two days, have a duration of up to eight hours [5] and terminate by 07:00,444In the United States the night shift is typically 23:00-07:00 while the European Union identifies it as including the 00:00-05:00 period [2]. and are followed by a period of inactivity of at least eight hours.555The US Department of Labor considers that a normal shift is followed by “at least an eight-hour rest” [5] while the European Union’s 2003/88/EC directive establishes a “minimum rest period of 11 consecutive hours.”
Next, we exclude all tweets not belonging to the dominant time frame. We also exclude clusters that repeatedly have daily activity of more than ten hours, as they most likely do not correspond to the user’s work (since we assume that most jobs have eight-hour shifts). However, as sometimes people are required to work overtime, or stay at work longer than usual, we are flexible and only exclude clusters with more than 20% of their daily time frames exceeding the ten-hour threshold (i.e., one workday per week) based on reported average overtime hours in the US [1] and the European Union’s limit for 48 hours per week. Finally, we select the cluster with the largest number of active weeks as the user’s workplace. It is important to note that our approach provides the first adaptive approach that dynamically identifies shifts or common working hours for each individual user, contrarily to previous approaches that followed a simplistic approach of considering fixed working hours for all users (e.g., “09:00-17:00”).
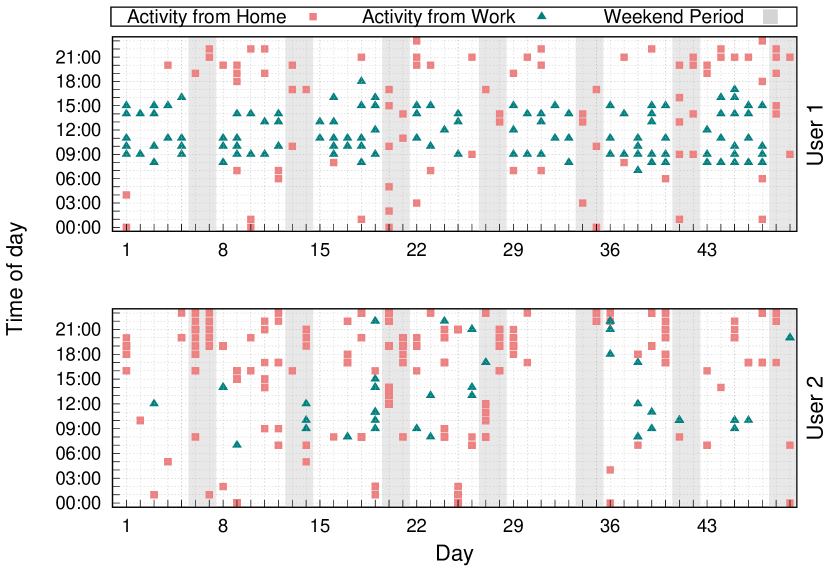
An example of the tweeting activity of two users from both home and work is given in Figure 2. Both users’ locations were correctly identified by LPAuditor. For the top user, tweets from work fall in a well-defined time frame (08:00-16:00), in contrast to tweets posted from home, which cover almost all times of day. The bottom user exhibits a more erratic behavior with different work shifts within a week, highlighting the need for our dynamic approach that adapts to different patterns.
III-C Identifying Highly-Sensitive Places
While identification of a user’s home and workplace is a significant privacy risk, our goal is to also explore the feasibility of uncovering personal user information that may be considered even more sensitive. As such, we want to identify other places a user has visited that could be used to infer such sensitive information. LPAuditor identifies a user’s Potentially Sensitive Clusters (PSCs) which are in close proximity to highly-sensitive venues, and determines whether the user actually visited these venues. To label a cluster as potentially sensitive, we estimate the cluster’s mid-point coordinates and use Foursquare’s [26] venue API for retrieving information about the nearest venues.
We consider venues that are within a 25 meter radius from the cluster’s mid-point coordinates; we set a more restrictive threshold compared to the key location clustering process to avoid potential false positives due to the small number of tweets per cluster and density of PSCs. In practice, if LPAuditor is offered as an auditing tool to users, these thresholds can be user-configurable to allow for flexibility for areas of different venue density (e.g., downtown metropolitan areas vs rural areas). The Foursquare API returns the name of each venue as well as its type, selected from an extensive list of predefined categories. As such, we have identified which of the venues returned by the API are associated with sensitive categories or subcategories (the categories we consider as sensitive in this study can be seen in Figure 9).
Content-based corroboration. Proximity to a sensitive venue does not necessitate that the user visited it (at least on that occasion). It could quite possibly be a case of simply passing by or visiting a different (potentially non-sensitive) nearby venue. To determine if the user is associated with the sensitive venue, we analyze the content of the cluster’s tweets in an effort to capture terms that indicate the user’s presence at that venue. It is important to note that despite the user including some relevant keyword in the tweet, location metadata allows attackers to obtain more context and infer sensitive information that the user did not intend to disclose.
LPAuditor uses three manually-curated wordlists of related terms based on numerous online domain-specific corpora that contain keywords related to our sensitive categories. Specifically, our wordlists contain medical- and health-related terms, terms associated with various religions, and sex/nightlife. We remove relevant keywords that are overtly ambiguous in context, as they can lead to false positives (e.g., “joint” may refer to a part of the body, some type of establishment, or may be drug-related). Our wordlists are available online.666https://www.cs.uic.edu/~location-inference/ These lists can be easily modified, or expanded to include terms from other categories (e.g., political).
LPAuditor first pre-processes users’ tweets (i.e., tokenization, lemmatization, removes punctuation, emojis, mentions, stop-words and URLs) using the NLTK library. Then it uses term frequency - inverse document frequency (tf-idf) to identify the most significant terms within the tweets of each PSC. For each cluster we consider the cluster’s tweets as the document and the entirety of the user’s tweets as the collection (with each cluster considered a document). As tf-idf assigns a score to the terms of the cluster, we check the three terms with the highest score against the respective wordlist, to determine if the context of these terms can be associated with a nearby sensitive venue.
Duration-based corroboration. Due to the sensitive nature of these venues, users will not always include content in their tweets that enables us to place them in a sensitive venue. For this reason, we introduce another approach that does not depend on the content of tweets, but on the repetitiveness and duration of user visits to a specific geographic area, in order to identify places the user has likely visited. More specifically, with this approach we identify PSCs that have consecutive tweets in the span of a few hours, which indicate that the user has spent a considerable amount of time at that place. In order to avoid cases where the users did not visit a sensitive place but posted multiple tweets while passing by it, we exclude cases of consecutive tweets that have been posted in short periods of time (within five minutes). We also identify tweets posted from the same cluster on different days, which shows that the user tends to repeatedly visit that place. Obviously this approach does not work for clusters with a single tweet, and it lacks the additional confidence in placing the user at the sensitive venue that we obtain with the content-based approach. Nonetheless, it highlights a significant source of privacy leakage.
III-D Implementation Details
LPAuditor has been designed as a completely modular framework, allowing for each individual component to be trivially changed or extended (e.g., incorporating a new data source, or implementing a different clustering method etc.). Our system has been fully implemented in Python, and all collected data is stored into a Mongo database. In more detail, we leverage the Tweepy package for interacting with Twitter’s API and collecting users’ timelines. For the first-level clustering and address validation we rely on the Geopy package (via which we interact with the ArcGIS and Google APIs), while our second-level clustering is based on the default implementation of DBSCAN as provided by the scikit-learn package. For collecting venue information LPAuditor uses the Foursquare package, while the NLTK package is used for all tweet preprocessing and procedures related to tf-idf. Given the importance of scalability when processing large collections of users, we have designed LPAuditor to be able to use multiple API keys in parallel. This allows us to speed up the more inefficient parts of the process which rely on communicating with external, and often rate-limited, APIs. Finally, as each user is processed completely independently from other users at all stages, multiple instances of our framework can be executed in parallel for increasing efficiency.
IV Data Collection
We first describe our automatically-collected Twitter datasets, and then outline our methodology for manually creating a ground truth dataset used for the experimental evaluation of LPAuditor in Section V.
Datasets. We used Twitter’s streaming API for collecting a set of tweets within a bounding box that covers the mainland area of the United States. While LPAuditor can be applied to any country with similar working norms (e.g., shift duration) we opted for users in the US as our sensitive location inference also requires the tweet content and we currently only support English. Furthermore, it is also the one country common across the datasets of all the prior studies we compare to in Section V. Nonetheless, an interesting future direction is to explore these privacy risks for users in other countries.
An initial set of tweets was collected in November 2016, through which we obtained 308,593 unique user identifiers (UIDs). Then we collected each user’s profile information and timeline (the 3,200 most recent tweets, according to Twitter’s policy). This dataset contains 456,856,444 tweets, which have been generated from 15,094 distinct sources (including unofficial Twitter client apps and websites.)
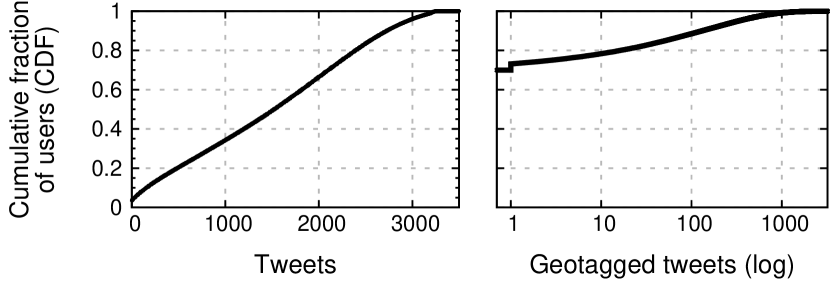
Apps may handle geolocation data differently as Twitter’s Geo Guidelines [76] are neither mandatory nor enforceable. To avoid inconsistencies, we only consider official Twitter apps and Foursquare in this study, which also account for the vast majority of collected tweets. After this filtering, we end up with 290,162 users and 345,643,445 tweets. We break down our dataset in Table I; users who posted tweets from multiple apps are counted in all the respective categories. Figure 3 (left) shows the number of tweets in each user’s timeline. We find that only 0.5% of the users have more than 3000 tweets, and less than 0.06% reached Twitter’s API limit of 3,200.
As we are interested in the privacy implications that stem from geolocation metadata, we identify all users with at least one tweet containing GPS coordinates in the metadata. We identified 87,114 such users, which have contributed 15,263,317 geotagged tweets in total. In Figure 3 (right) we present the number of users’ geotagged tweets. Surprisingly we find that for 30.03% of the users the Twitter API reveals some precise geolocation information, with 8.01% of the users having less than 10 geotagged tweets. We also observe that 15.55% of the users have between 10 and 250 geotagged tweets, and approximately 5% and 2% of the users have more than 330 and 655 geotagged tweets, respectively.
Users with many geotagged tweets may have patterns that differ from those of users with a significantly lower number. For this reason we conduct our analysis on two different sets of users. The first set (Top-6K) consists of the top 6,010 users in our dataset that have the most geotagged tweets (approximately top 2% of users in Figure 3), while the second set (Low-10K) consists of 9,841 randomly selected users that have between 10 and 250 geotagged tweets. We use these two sets of users for our main analysis (instead of all collected users), due to the rate limits imposed by the API providers that we use for our clustering process. Also, by including users with as few as 10 geotagged tweets, we can explore the privacy risk that users face even when very few location data points are available.
Geotag accuracy. It is important to note that while other types of location-based services may add some form of noise or obfuscate the user’s location [57], that is not the case with Twitter. As such, the GPS coordinates contained in the tweet metadata we obtain through the API match those provided by the user’s device.
| Application (source) | Geoloc. | Users | Tweets | |
|---|---|---|---|---|
|
✓ | 99,979 | 50,188,992 | |
|
✓ | 328,320 | 291,820,742 | |
|
✗ | 253,616 | 39,655,850 | |
|
✓ | 13,192 | 3,633,711 |
Ground truth collection. As we aim to demonstrate the true extent of this privacy issue by identifying key locations at a postal address granularity, a significant challenge is obtaining the ground truth for evaluating the accuracy of our approach. While our home/work identification algorithms focus on spatio-temporal characteristics, creating the ground truth mandates an analysis of the tweets’ content. Due to strict requirements for veracity, we did not resort to an automated process but opted for an arduous and painstaking manual process that required over 6 weeks of continuous effort. While we have explicitly limited our data collection to publicly available data offered by the official Twitter API, we took extra precautions during our manual data analysis phase for protecting users’ privacy. Specifically, the user’s account information (name, username) was not included in the content that was manually inspected, and references to other users (i.e., tokens starting with “@”) were removed as well.
In a nutshell, we started with users that explicitly mentioned in their tweets that they are at home, by matching phrases such as “Im home”, “I’m home”, “at home” etc. After identifying users with clusters containing such tweets, we manually reviewed all the tweets in these particular clusters. During the manual inspection we took into account the context of a user’s tweets for ensuring that these clusters indeed correspond to a user’s home. Instead of identifying work clusters for other users, we decided to focus this task on the users for which we have already identified their home location, as that would allow us to create a more complete dataset that contains both home and work locations for each user. To that end, we followed a similar approach and searched for phrases denoting work-related information, “at work”, “at the office”, “my job”, “this job” etc., and manually inspected the tweets of the returned clusters.
Below we outline the workflow of our manual inspection process for identifying users’ home and work locations. Our goal was to establish a methodology that allows us to have high confidence in the resulting labels. The content analysis and location labeling was performed by two researchers independently; in cases where the labels by the two researchers did not match the user was discarded. We avoided potentially ambiguous instances or cases with uncertainty, and built our ground truth with users where both labellers agreed. We discarded such instances as we set a strict requirement for correct labels for our ground truth. However, discarding users was a rare occurrence, as it is a fairly straightforward and intuitive process for human annotators to identify home/work locations. In more detail, we established the following workflow:
-
1.
Apart from inspecting the tweets that contained one of the initial seed phrases, we also inspected all of the cluster’s remaining tweets. This allowed us to further increase our confidence by identifying tweets where the user explicitly or implicitly referred to being at home or work (e.g., “just took a shower”, “my boss just said” etc.). If we only found implicit references, we required at least two such tweets to increase our confidence.
-
2.
To make our ground truth as complete as possible, we also manually inspected all the tweets in users’ 10 largest clusters, for identifying cases where users have multiple homes or work clusters that were not already identified during the previous task. Again we followed the same approach as described in the previous step. In cases where there were no other clusters with tweets indicating a home or work location we were confident of our original labeling, since there was only one cluster matching each label. In cases where other clusters’ alluded to a potential key location, we continued with the following process:
-
(a)
Temporal analysis. We explicitly analyzed the timeline of clusters, and identified the periods during which each cluster was active. This helped us identify cases where users had changed residences, where multiple locations had been labeled as homes but their active periods did not overlap temporally. We also observed cases where the identified home was not the user’s place of residence, but could be considered a secondary home (i.e., country/summer house, parents’ house). During this step we also searched specifically for references that allowed us to label the cluster as a secondary home location (e.g., terms referring to parents).
-
(b)
Spatial analysis. In cases where more than one cluster exhibited home-like patterns and had overlapping active periods, we considered the spatial location of each cluster. If the two clusters were close geographically, we further investigated them to decide which one was the user’s actual home and which was not (e.g., a friend’s house that the user visits frequently). For clusters that were far away from each other (e.g., in different cities), we relied on the content for verification. A common occurrence was clusters with home-related keywords that exhibited continuous activity for a few days: e.g., users tweeting that they were at home, while visiting their parents’ house during the holidays.
-
(a)
Overall, in the Home-Top dataset we have 1,004 users with 1,307 home clusters; 718 of these users have only one home cluster, while 269 and 17 users have two and three homes, respectively. This is not a surprising finding, as we collected all the tweets in each user’s timeline (up to 3,200), and not only tweets posted in a specific time period. Indicatively, we have observed cases of users that have relocated (e.g., after graduating), college students living in dorm rooms during their first year and then moving to a house, and students that regularly visit their family home. We also observed users with multiple home locations in the Home-Low ground truth dataset, but to a lower extent. Specifically, we identified 905 users that have one home cluster, 137 users with two, and one user with three home clusters. For the two work ground truth datasets, i.e., Work-Top and Work-Low, we identified 298 and 92 users, that have 363 and 98 work clusters respectively.
It is possible that our home/work ground truth datasets are not exhaustive (i.e., we may have missed certain locations). However, due to the systematic and stringent manual inspection process, we are certain that all the locations labeled in our ground truth indeed correspond to users’ home and work locations. Our manual inspection process has resulted in ground truth datasets significantly more complete and fine-grained than those used in prior studies [22, 35, 16, 17, 46] (more details can be found in Section VII).
V Experimental Evaluation
In this section we first present an analysis of our datasets and discuss properties of users’ behavior regarding key and sensitive locations. Subsequently, we use our ground truth to experimentally evaluate LPAuditor and compare to prior work.
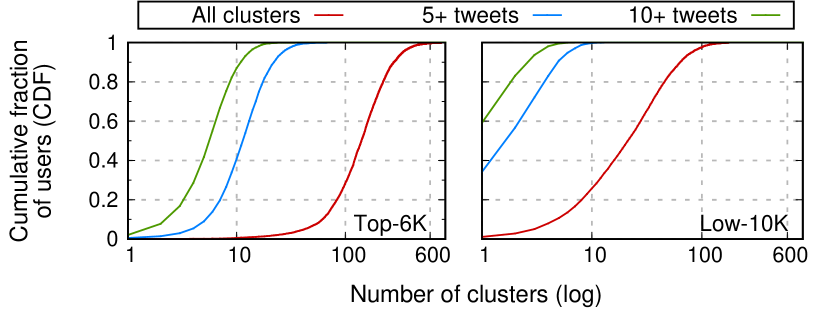
Location clusters. To investigate the location patterns in users’ tweeting behavior, we focus our analysis on understanding the characteristics of users’ location clusters. We perform this analysis for both the most active (Top-6K) and less active (Low-10K) users. Figure 4 depicts the number of clusters per user. As expected, highly active users tend to have a large number of clusters. Specifically, only 4.45% of these users have less than 40 location clusters, and around 28% less than 100 clusters. In more detail, we observe that around 50% of the highly active users have more than 140 clusters, and about 25% and 10% of them have more than 200 and 280 clusters respectively. If we only consider clusters that have more than five tweets, we observe that about 50% of the users have more than 11 such clusters, and 10% have more than 22 clusters.
When focusing our analysis on the Low-10K dataset, we observe that these users have significantly less clusters than the highly active users but seem to follow a similar pattern. As shown in Figure 4 (right), about 10.7% have five or less clusters, and about 50%, 25% and 10% of the users have more than 21, 40 and 63 clusters respectively. Furthermore, similarly to the highly active users, the number of clusters drops significantly when considering only those clusters that have more than 5 tweets. For both sets of users we find that users tend to have a large number of clusters, out of which the majority has a small number of tweets.
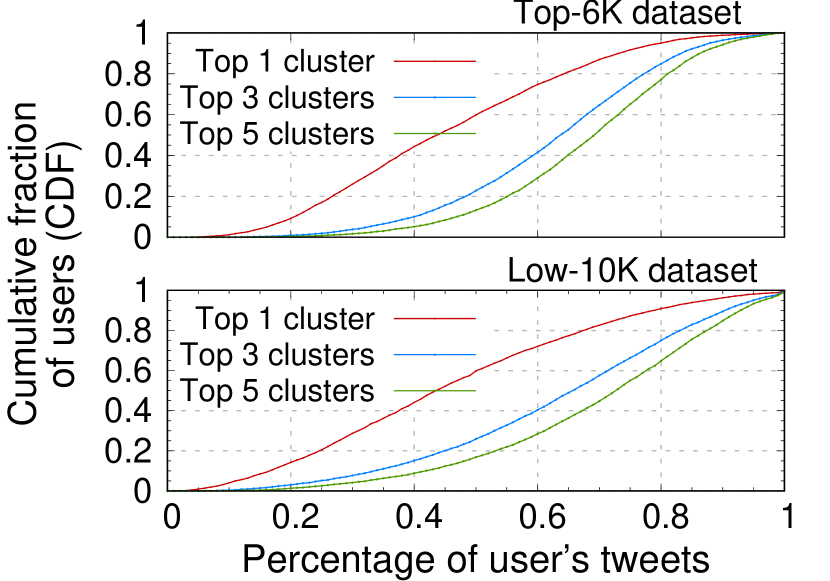
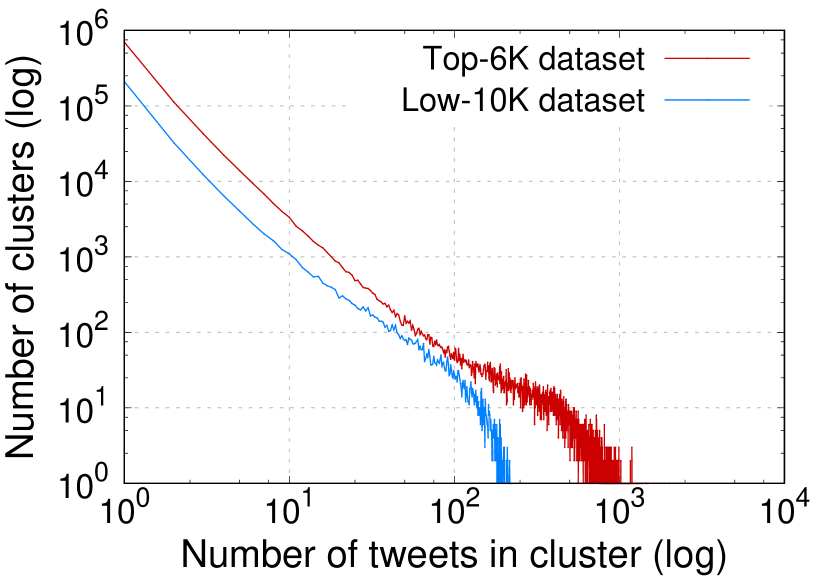
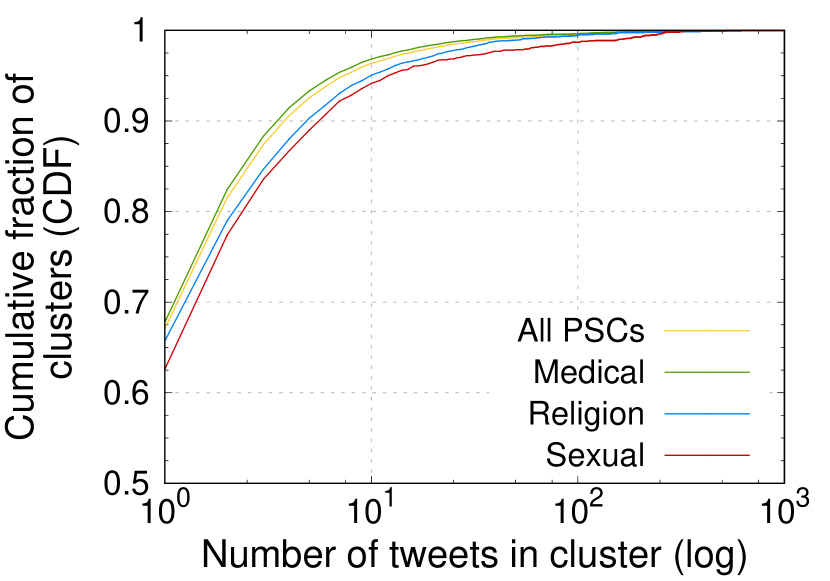
Figure 7 presents the percentage of users’ tweets in their five largest clusters. We observe that for about 40% of the users, more than half of their tweets belong to their top cluster, while 47.77% of the users have more than 70% of their tweets in their top 5 clusters. This phenomenon is observed in both sets of users. In Figure 7 we explore the cluster sizes of all users. Both datasets exhibit a power law distribution, with the vast majority of clusters having only a few tweets and a small number of clusters with a large number of tweets. These small clusters will most likely not correspond to a user’s home and work locations, as they appear to be visited rarely; however, these locations are important from a privacy perspective, as they allow an adversary to reconstruct a semantically-rich location history, which can reveal highly sensitive information. In fact, this is clearly demonstrated in Figure 7, which presents the distribution of PSCs with regards to the number of their tweets. We find that 67.10% of the PSCs in our datasets have one tweet, while only 4.04% of them have 10 or more (the most being health-related).
V-A Home and Work Location Inference
To assess our methodology and measure the effectiveness of LPAuditor we aim to pinpoint exact locations. Thus, we opt for a “strict” evaluation of accuracy where a location is either correctly or incorrectly identified. We do not calculate distance errors as they are more suitable for coarse-grained approaches that roughly estimate locations.
| Inferred clusters | Rank of clusters | |||||||
|---|---|---|---|---|---|---|---|---|
| Dataset | Users | Precis. | 1 | 2 | 3 | 4 | 5-10 | |
| Home-Top | 1004 | 926 | 92.2% | 806 | 111 | 8 | 1 | - |
| Home-Low | 1043 | 969 | 92.9% | 911 | 49 | 8 | - | 1 |
| Work-Top | 298 | 164 | 55% | 7 | 79 | 47 | 16 | 15 |
| Work-Low | 92 | 53 | 57.6% | 4 | 31 | 11 | 6 | 1 |
LPAuditor correctly identifies the home of 926 and 969 users from the two datasets, resulting in a precision of 92.23% and 92.9% respectively. Thus apart from obtaining superior granularity, our system is considerably more effective than previous approaches as we will show. As our work inference first excludes the home cluster, the outcome also depends on the precision of the home inference. Our precision is 55.03% and 57.6% for identifying workplaces in our ground truth. As users typically tweet less when they are at work than when they are at home (in our ground truth, home clusters contain an average of 45% of tweets while work clusters contain 8%) our effectiveness at identifying work is lower since other locations frequented by the user can exhibit similar characteristics (e.g., restaurants, coffee shops, gyms). Table II presents the precision of our home and work inference, as well as the rank of all the correctly identified clusters. The clusters’ ranks are estimated according to their size, such that rank 1 is the largest cluster of the user, rank 2 is the second largest cluster and so on. Also, we do not re-calculate cluster ranks after excluding home clusters in the work identification phase, as we want to make direct comparisons between the results of the two approaches. Finally home clusters have, on average, a maximum radius of 59.55 meters and work clusters of 53.38, which drops to 19.25 meters for all clusters in our ground truth.
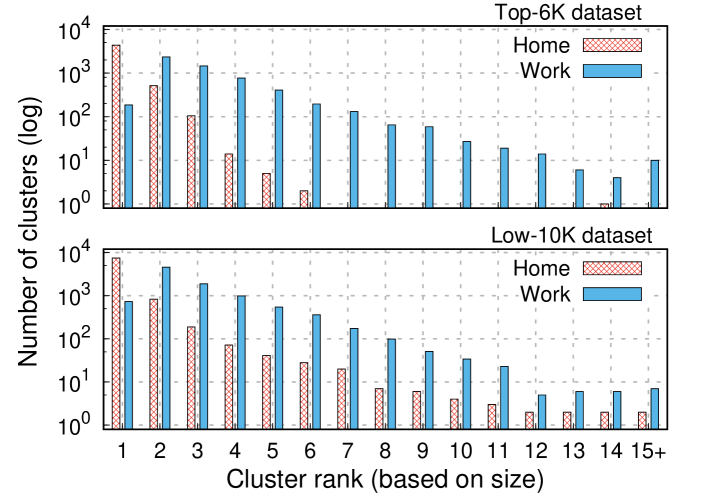
Having established the precision of LPAuditor on our ground truth datasets, we run our system on the main datasets (Top-6K, Low-10K) after excluding the ground truth users. As can be seen in Figure 8, the majority of home clusters in both datasets are rank 1 clusters, which is consistent with the results from the home ground truth. For the work clusters, only 3.26% and 7.69% are rank 1, while most of them are rank 2 and a considerable number occupy lower ranks, in both datasets. We find that the detected clusters follow a similar rank distribution in the two datasets, supporting the representativeness of our ground truth. It should be noted though that while our work ground truth explicitly contains users for which we have identified their work, for the main datasets our system also identifies locations that are not work in the strictest sense. Specifically, we are able to identify locations for users that do not work but have a location that can be considered a work “substitute”, e.g., a college student attending classes.
Selection bias. The methodology that we employed to create our ground truth datasets could potentially result in selection bias, as it relies on certain key phrases as a starting point for the manual process. To examine whether the accuracy of our evaluation is a byproduct of LPAuditor’s heuristics being “overfitted” to the ground truth, we manually examine a random subset of users identified from the main datasets (Top-6K, Low-10K). Specifically, we select 100 users and manually investigate their tweets to verify whether the home and work labels assigned by our system are correct. Following the manual methodology described in Section III we are able to verify that 89 of the home labels indeed correspond to the user’s actual home cluster. For the remaining 11 users we are unable to characterize the label as correct or incorrect based on the users’ tweets. For the work labels, we find that for 45 users the work cluster has been correctly identified while for 30 users the label is incorrect. For the remaining 25 users we are not able to verify whether the label is correct or not.
While this manually verified sample is relatively small, we find that the resulting accuracy is comparable to the accuracy achieved by our system when evaluated against the ground truth. Furthermore, these users are from our main datasets, which exhibit a wide range of geotagging behavior, demonstrating that our effectiveness is not tied to a specific dataset. As LPAuditor’s underlying algorithms are based on common user behaviors and legislative/societal norms, we believe that this manual verification further validates the generalisability of our techniques and the correctness of our ground truth.
De-anonymization. While demonstrating the feasibility of de-anonymizing Twitter users is not the focus of our work, we conduct a small exploratory experiment. We aim to identify which, if any, users in our ground truth datasets appear to be pseudonymous. Specifically we want to identify users that do not provide their full name, i.e., do not provide their last name (we do not consider first names to be conclusive for identity). We use the list provided by the US Census Bureau with the most frequent surnames to filter out users that include their last name in the full name section of their account.
After filtering 282 users remain, which we manually examine and exclude the ones that actually disclose a last name that is not included in the Census list, or include their last name in their username. We end up with 183 users that do not explicitly reveal their identity on their Twitter accounts, which constitutes a lower bound of the pseudonymous users in our ground truth, due to potential false positives in our automated filtering. Out of these users, LPAuditor was able to correctly identify the home location of 171 users and the workplace of 23 users (to ensure privacy, the manual inspection of users’ names was conducted in “isolation” and not combined with or mapped to any ground truth locations or other location clusters). While these users might not be truly pseudonymous in reality (e.g., users with a pseudonym whose actual identity is well known within certain communities) or could also be de-anonymized through other techniques [28], this experiment highlights another potential threat posed by location metadata.
| Heuristic Description | Dataset | Proposed by | |||
| Top | Low | ||||
| Home | 1 | Cluster with the highest number of tweets | 72.3% | 67.8% | [16, 17, 35, 42] |
| 2 | Most tweets between 20:00-8:00 | 72.1% | 66.4% | [48] | |
| 3 | Most tweets between 24:00-7:00 | 69.3% | 54.7% | [35] | |
| 4 | Last destination of the day (before 3am) | 73.3% | 64.8% | [35, 42] | |
| 5 | Last destination of the day (w/o days with tweets between 24:00-7:00) | 71.4% | 64.4% | [35] | |
| 6 | Weighted PageRank for destinations | 44.1% | 26.4% | [35] | |
| 7 | Weighted PageRank for origins | 37.5% | 20.9% | [35] | |
| 8 | Most popular cluster in terms of unique days, during the Rest (2:00-7:59) and Leisure (19:00-01:59) time frames | 73.1% | 64.9% | [22] | |
| 9 | WMFV (best reported time frame: 24:00-5:59) | 65% | 50.9% | [46] | |
| 10 | W-MEAN (best reported time frame: 24:00-5:59) | 0.6% | 14.7% | [46] | |
| 11 | W-MEDIAN (best reported time frame: 23:00-5:59) | 15.6% | 24.5% | [46] | |
| 12 | LPAuditor’s Home detection without 2nd level clustering | 73.7% | 69.3% | this paper | |
| 13 | LPAuditor’s Home detection | 92.2% | 92.9% | this paper | |
| Work | 14 | Most popular cluster in terms of unique days, during the Active time frame (e.g., working hours, 08:00-18:59) | 33.2% | 48.9% | [22] |
| 15 | Cluster with the second highest number of tweets | 18.5% | 22.8% | - | |
| 16 | LPAuditor’s Work detection without 2nd level clustering | 32.2% | 30.4% | this paper | |
| 17 | LPAuditor’s Work detection | 55% | 57.6% | this paper | |
Prior work. Apart from pinpointing locations with a granularity that is orders of magnitude more fine-grained than prior work, it is important to also quantify the accuracy improvements of our techniques. We implement the heuristics proposed in prior work for identifying home and work locations that leverage spatiotemporal patterns and apply them to our ground truth; we do not compare to techniques that require other types of data, like social ties [38, 37], as we do not collect such data and those techniques are inherently very coarse-grained. By running these heuristics on the same data, we are able to conduct a direct comparison to previous techniques and avoid the inaccuracy of simply comparing to their reported numbers. It is important to note that we map tweets to postal addresses before applying these previously-proposed heuristics, i.e., we only apply our initial first-level clustering so as to remain as faithful as possible to their original design.
As Table III shows, LPAuditor outperforms all heuristics proposed in prior work for both home and work locations. The simplistic approach of selecting the largest cluster as the home (1) performs surprisingly well, and even outperforms some of the other more complex heuristics. We also extended this logic and evaluated the precision of considering the second largest cluster as the workplace (14); this results in a precision of 18.45% and 22.82% in the Work-Top and Work-Low datasets respectively. Heuristics (4) and (8) perform better than other prior heuristics. The approaches proposed in [46] rely on weights obtained from their data; to remain faithful to their design, we replicate their approach and randomly select 22% of our users as the sample dataset to calculate the weights and the rest as the evaluation dataset. The significant difference between their reported accuracy and our findings can be attributed to their experiments being conducted on a dataset from a very limited time frame and geographic area.
Overall, our techniques present an improvement of 18.9%-91.6% when inferring homes and 8.7%-21.8% for workplaces. An interesting observation is that in multiple cases LPAuditor presents a larger improvement over prior approaches for users that are not prolific geotaggers (i.e., from the Low datasets), indicating the benefit of our techniques when there is sparser availability of data.
In an effort to accurately quantify the effect of our second-level clustering on our techniques, we also run our heurstics by applying only the first-level clustering and compare them to prior work. LPAuditor’s home inference still outperforms all previous approaches, both in the Home-Top and Home-Low datasets, with an improvement of 0.4%-73.1%. On the contrary, heuristic (14) outperforms LPAuditor’s work inference in both Work-Top and Work-Low datasets, by 1% and 18.5% respectively. These differences in our results can be attributed to the fact that when a user’s location cluster is split into smaller clusters (i.e. first-level clusters), our heuristics cannot entirely capture the true behavior of that location, which further signifies the importance of our second-level clustering. As aforementioned, other locations frequented by users during or near working hours can exhibit work-like characteristics (e.g., gym, coffee shopts etc.) affecting fine-grained approaches like ours when working with sporadic location datasets. Our second-level clustering allows our system to group data points that belong to the same location but have been assigned to nearby locations due to the displacement introduced by user mobility (e.g., tweeting while leaving work) or GPS errors. In a sense, this can be seen as enhancing the “signal”, thus allowing our system to better capture the user’s behavior in each location. After applying our second-level clustering, our techniques improve significantly by 18.5% and 23.6% for the Home-Top and Home-Low datasets and by 22.8% and 27.2% for the Work-Top and Work-Low datasets respectively.
V-B Inference of Sensitive Places
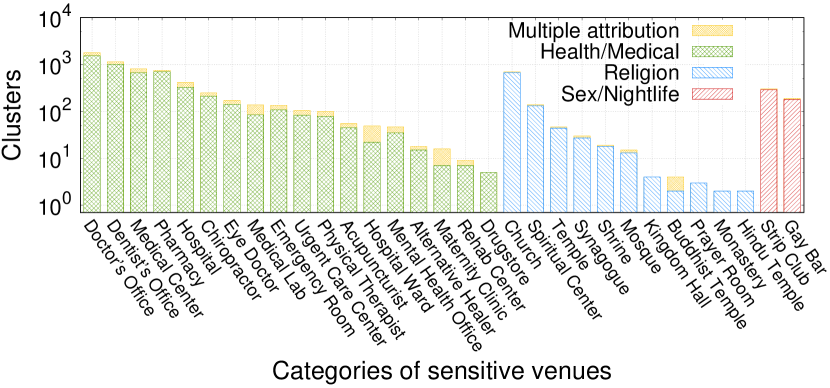
LPAuditor detected 6,483 potentially sensitive clusters (PSCs) across our ground truth. Specifically, it identified 938 (93.42%) Home-Top users with a total of 5,393 PSCs, and 516 (49.47%) users in Home-Low with 1,090 PSCs. This difference between datasets is expected as users in the latter have fewer geotagged tweets and considerably less clusters. Figure 9 breaks down the detected PSCs according to the category of the associated venues. For PSCs that have more than one sensitive venue in close proximity, we first assign that PSC to the category of the closest venue. We also present how the distribution changes if each PSC is mapped to all sensitive venues in proximity (denoted as “Multiple attribution”). When only considering the sensitive venue with the shortest distance to the PSC’s coordinates, we identify 5,094 health-related clusters, and 918 and 471 venues related to religion and sex/nightlife respectively. Interestingly, if we intersect these clusters with users’ ground truth work locations we find 10 common instances in the Work-Low and 15 in the Work-Top sets; out of those only 3 from the latter set were identified by our system through tf-idf. As such, we believe that the vast majority of cases are users visiting these sensitive venues, as opposed to working there.
Content-based corroboration. When using tf-idf and our wordlists, we increase our confidence in placing users at 545 of the detected PSCs. To assess these results we identified the clusters that contain at least one keyword from the respective wordlists and manually inspected the clusters’ tweets, to assert whether the user was actually referring to a sensitive place. This manual inspection showed that our approach had an overall precision of 80.36% and a 93.79% recall, as presented in Table IV. Out of the 438 verified sensitive venues, 375 were related to health, 51 and 12 to religion and sex respectively. We observed a small number of false positives due to ambiguous keywords that remained in our wordlists (e.g., “shot”); however, we kept these terms as the true positives significantly outweighed the false positives. On the other hand, in some cases our approach missed certain sensitive clusters due to users that post sensitive content repeatedly from many clusters (e.g., a religious user that tweeted religious content from multiple locations), which resulted in these keywords not being deemed significant by tf-idf. Furthermore, it is important to stress that we obtain a lower bound on the number of sensitive venues that a user has visited, as the user may simply post tweets that do not contain the appropriate context.
Depending on the attacker’s end goal, there might not be a need for absolute certainty of whether the user visited the sensitive place. Even low confidence levels may be considered a sufficient indicator; for instance, an insurance company looking at a user’s social media profile to decide on adjusting the user’s premium or purchasing their policy [4]. Nonetheless, as an extra source of ground truth, we identified these users’ tweets that were generated by the Foursquare app and followed the typical format of a check-in; we then compared the venues of these check-ins to the clusters of sensitive nearby venues. This allowed us to verify certain detected sensitive places irrespective of the content posted from these clusters. This returned 105 sensitive clusters for our ground truth users, 20 of which were also detected by tf-idf. While this source of ground truth is considerably small, it offers an interesting indication of user behavior; users are extremely reserved when it comes to explicitly publishing that they are at a sensitive location. This further exemplifies the implications of the location metadata being exposed, as it directly undermines privacy-conscious user behavior.
To further investigate the tweeting behavior of users from sensitive venues, we used LPAuditor to infer sensitive places visited by the remaining users from the Top-6K and Low-10K datasets. Our system identified 21,863 PSCs for 4,418 users from the Top-6K dataset and through content-based corroboration identified 1,512 of them as sensitive clusters that have been visited. Of those, 1,282 are health related, 196 pertain to religion and 34 are related to sex. Similarly for the users from the Low-10K dataset, we identified 6,918 PSCs, with 474 being flagged by our system, with 341 related to health, 115 to religion, and 18 to sex.
| Home-Top | Home-Low | Total | |
| Users in Dataset | 1,004 | 1,043 | 2,047 |
| PSCs | 5,393 | 1,090 | 6,483 |
| Users w/ PSCs | 938 | 516 | 1,454 |
| Guessed Clusters (CB) | 464 | 81 | 545 |
| Users w/ CB Clusters | 328 | 72 | 400 |
| True Positive (TP) | 368 | 70 | 438 |
| False Positive (FP) | 96 | 11 | 107 |
| False Negative (FN) | 25 | 4 | 29 |
| Precision (TP/TP+FP) | 79.31% | 86.41% | 80.36% |
| Recall (TP/TP+FN) | 93.63% | 94.59% | 93.79% |
| F-Score | 85.87% | 90.31% | 86.55% |
Duration-based corroboration. When using the duration-based approach (DB), as can be seen in Table V, we identified 691 users from the Home-Top and 205 from the Home-Low dataset that have repeatedly visited or spent a considerable amount of time at 1,699 and 276 PSCs respectively. Similarly, in the Top-6K and Low-10K datasets, we identified 3,012 and 1,672 users that have visited 7,020 and 2,337 such places. It should be noted though that these numbers constitute a lower-bound estimation, as the duration-based approach does not take into consideration PSCs that only contain a single tweet.
| Home-Top | Home-Low | Top-6K | Low-10K | |
| Visited Clusters (DB) | 1,699 | 276 | 7,020 | 2,337 |
| • Medical | 1,307 | 194 | 5,193 | 1,626 |
| • Religion | 245 | 56 | 1,176 | 493 |
| • Sex/nightlife | 147 | 26 | 651 | 218 |
| Users w/ DB Clusters | 691 | 205 | 3,012 | 1,672 |
| Common CB/DB Clusters | 53.44% | 44.44% | 53.9% | 47.25% |
| Users w/ CB/DB Clusters | 86.89% | 59.72% | 86.26% | 65.88% |
Interestingly, we observe that 53.44% and 53.9% of the sensitive clusters detected by the content-based approach (i.e., CB clusters) for the Home-Top and Top-6K datasets respectively, are among the visited clusters returned by the duration-based approach (DB clusters). For the Home-Low and Low-10K datasets, 44.44% and 47.25% of the clusters detected with the content-based approach have been also detected by the duration-based approach. Employing both approaches can increase confidence in identifying sensitive places the users have visited. Thus, for scenarios requiring higher levels of confidence, an attacker can select the intersection of the sets returned by the two approaches. Another noteworthy observation is that the DB approach results in a higher ratio of sex-related clusters compared to CB, which indicates that users are reluctant to explicitly mention such venues while further highlighting the risk of geotagged tweets.
Contextual privacy loss. A significant implication of this inference is that location metadata can amplify the loss of privacy by revealing sensitive details or additional context about the tweet’s content that might not match the user’s intended level of disclosure. While we found this to be common across most cases of sensitive clusters we identified, it is not our goal to quantify or exhaustively enumerate this phenomenon. Instead, we anecdotally refer to a few representative examples that highlight this dimension of privacy leakage. In one case, the user expressed negative feelings about his/her doctor, while the GPS coordinates place the user in the office of a mental health professional. In another example, the user complained about some blood tests, while being geo-located at a rehab center. Also, geotagged religion-based tweets can reveal the type of that place of worship (e.g., mosque, synagogue) and may even point to a specific denomination. However, even if users are cautious and nothing sensitive is disclosed in the tweets, the location information obtainable with our duration-based approach can result in significant privacy loss.
V-C Impact of Historical Data
| Dataset | Before 4/2015 | After 4/2015 |
|---|---|---|
| All tweets | 24.98% | 1.35% |
| Coarse-grained tweets | 99.9% | 2.85% |
During our analysis we found that Twitter app versions released prior to April 2015 automatically include GPS coordinates in tweets tagged with a coarse location. The resulting tweets have both a coarse-grained label (e.g., city) and GPS coordinates in their metadata. Furthermore, that information is not visible in the app or the web version. Thus, users are completely oblivious to the public availability of this sensitive information. In newer versions users have to explicitly opt to include GPS information on a per-tweet basis. The apps with a more privacy-respecting behavior were released on April 15th for iOS and the 20th for Android. Nonetheless, the historical metadata collected from the prior versions remains publicly accessible through Twitter’s API.
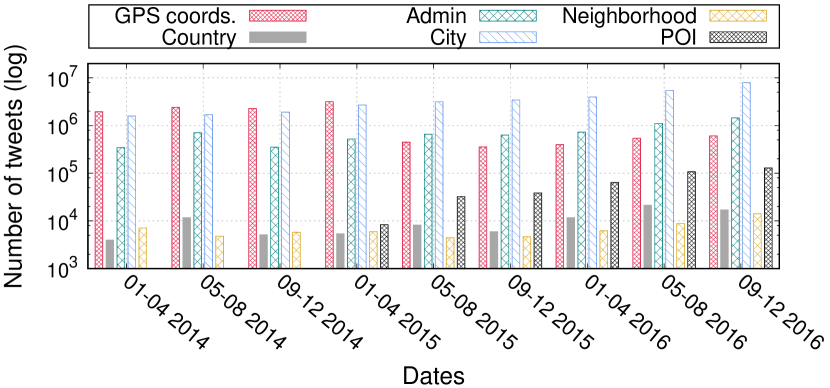
Unavoidable privacy leakage. As shown in Figure 10 user behavior changes after April 2015, with far fewer tweets with precise location, and users tagging tweets with the newly introduced point-of-interest (POI) that denotes locations of varying granularity. However, throughout the entire lifespan of our dataset, users keep posting tweets tagged with a coarse-grained location, further indicating that they are interested in enriching the context of their tweets, but not always willing to disclose their exact whereabouts. Table VI shows that there is significant change, with a 35-fold reduction in the ratio of tweets that contain GPS coordinates after the release dates of the apps with the privacy-respecting approach. Since we do not have the ability to detect each user’s app version, we first separate the data on the official release date for each platform (i.e., we take into account if the user is on Android or iOS). While some users may have delayed updating their app, that would only increase the ratio of tweets with GPS; thus, the actual reduction of tweets with GPS is even higher, further highlighting the unavoidable privacy violation that users faced due to Twitter’s poor handling of location data. While we expected that all coarse-grained tweets from before 04/2015 would contain GPS coordinates, we found that 0.1% do not. These were all from before 08/2010 indicating the point in time when Twitter started the practice of appending GPS data to coarse-grained tweets. Consequently this privacy-invasive policy persisted for almost 5 years until Twitter gave users greater control over the location information they exposed. Nonetheless, users with older devices or versions of the app are still exposing this type of data, while all users’ data remains accessible online.
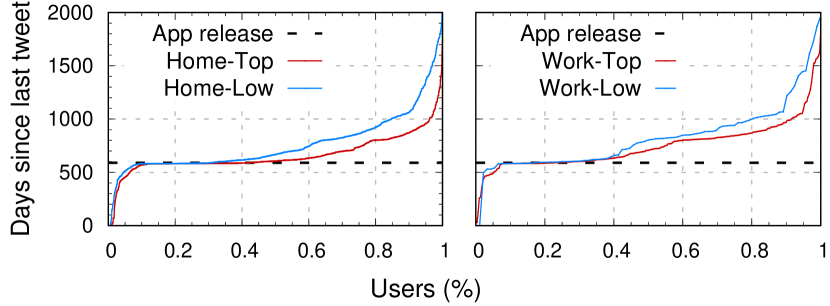
Historical data. We explored the impact of Twitter maintaining and publicly sharing historical location metadata, by calculating how many users would remain vulnerable if GPS coordinates were not included in coarse-grained tweets. In Figure 11 we first look at the number of days that have passed since the last tweet from a home/work location. We find that 56.57% and 68.45% of the users posted their last tweet from home right before the release of the newer app version, a large percentage around the dates of the app release, and only a small number after that. As we do not have information regarding the date each user installed the newer app version on their device, we cannot know the exact numbers. However, it is evident that the majority of users stopped posting tweets with precise location information from their home and work locations.
To further investigate how users’ behavior changed since Twitter changed its policy, we identified the users that have posted tweets with coordinates after the app release date (and the following weeks) and ran LPAuditor only on the tweets posted after those dates. As can be seen in Table VII, as users started updating their apps, the number of users posting tweets with precise location drops rapidly. Indicatively, only 15.43% and 11.12% of the users in the two datasets continued posting such tweets four weeks after the release of the new app. When using only tweets posted at least four weeks after the app release we were able to correctly identify the home of 7.34% and 6.39% of the users that are identified when all data is used.
Regarding the “freshness” of historical data, it is important to note that even if some of the users’ key locations have changed (e.g., a user has since moved to a different home), users can still be identified by that data, and the inferred sensitive information does not “expire”. The sensitive user traits, actions or beliefs that can be inferred by the three categories that we explore will still characterize the users regardless of the current location of their home or workplace. Even for ephemeral characteristics that no longer hold true, exposure of that sensitive information can still affect users (e.g., certain cured medical issues remain social taboos). As such, given the adage that “the Web never forgets”, Twitter’s invasive privacy policy cannot be dismissed as a case of a vulnerability that has been fixed. As long as this historical data persists online, users will continue to face the significant privacy risks that we have highlighted in this paper.
| Dataset | Date | Users | Homes | Coverage |
|---|---|---|---|---|
| Home-Top | Release | 602 | 333 | 35.96% |
| Home-Top | +4 Weeks | 155 | 68 | 7.34% |
| Home-Low | Release | 394 | 239 | 24.66% |
| Home-Low | +4 Weeks | 116 | 62 | 6.39% |
V-D Performance evaluation
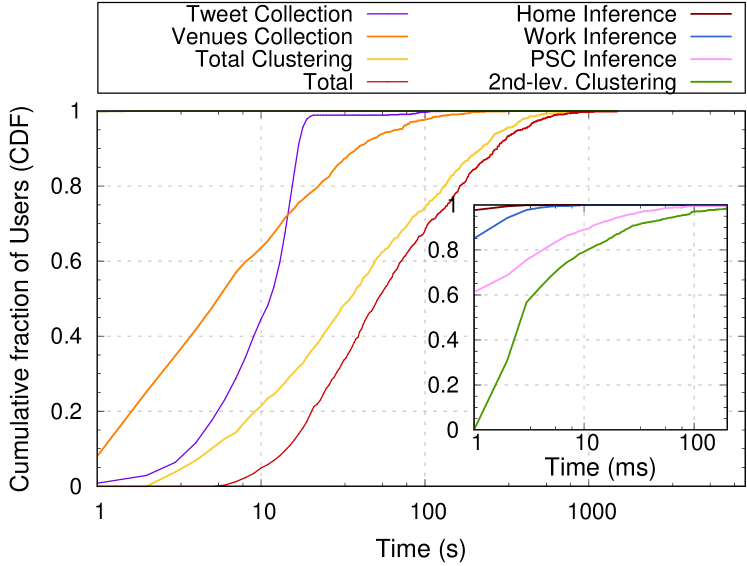
To evaluate the performance of our system we selected 1000 users randomly from all the users with geotagged tweets and measured the time required by each module of LPAuditor, as well as the total time, for completing the entire process. As expected, this time depends on the number of tweets and clusters each user has; as such we randomly chose the users to reflect a representative distribution. As shown in Figure 12, the most time demanding operations are those of collecting a user’s tweets, collecting PSCs, and the first-level clustering all of which rely on the use of third-party APIs (i.e., communication over the network, rate limits, etc.). On the other hand, the time required for the other steps are in the order of milliseconds, which can be considered as negligible.
Using a commodity desktop, LPAuditor requires less that 12 seconds for collecting all the tweets of roughly half the users, and less than 20 seconds for around 98% of the users. Furthermore, for the collection of PSCs it takes up to six seconds for half of the users, and more than 29 and 66 seconds for 15% and 5% of the users respectively. For the process of clustering, our system takes up to 35 seconds for about 50% of the users, and more than 164 and 305 seconds for 15% and 5% of the users. To that end, when considering the total time spent, LPAuditor takes less than 52 seconds for half of the users, and more than 207 and 385 for 15% and 5% of them (users with a very large number of tweets and clusters). Our system can complete the whole process in less than a minute for half the users, while approximately 95% of them can be processed within six minutes. This highlights the severity and scale of the privacy threat we have explored, as adversaries could trivially run such attacks for a massive number of users.
VI Discussion and future work
Twitter privacy leakage mitigation. The pitfalls of location-sharing have long troubled researchers. And while our work demonstrates the extent of the risks users face, it also highlights an important aspect of the issue that, to our knowledge, has not been explored before. While previous work has mainly focused on users knowingly or inadvertently sharing location data in social platforms, we also identified an inconspicuous form of privacy leakage that is invisible to users. Even though Twitter has since opted for a more privacy-oriented policy where users have to explicitly choose to append GPS coordinates in tweets, the availability of historical metadata severely undermines the benefits of this more recent approach. Apart from the fact that after users are given the choice they are 18.5 times less likely to include GPS coordinates, 93% of the users identified by LPAuditor are due to the historical tweets geotagged by Twitter. These findings underline the risks of web services publicly over-sharing data through their APIs, which poses an alarming flip side to the common problematic behavior of over-collecting data [65].
We found that Twitter mentions this behavior [74], and describes the process for removing location data [73]. However, they explicitly warn users that “deleting location information on Twitter does not guarantee the information will be removed from all copies of the data on third-party applications or in external search results”. As data brokers continuously collect and sell Twitter data, even if users do remove all location metadata from their tweets, it is not necessary that those changes will be reflected in the versions maintained by others. As users continue to tweet the privacy threats posed by historical data may naturally degrade through time, as less and less of those geotagged tweets will be obtainable through the free public API (which sets a limit for the 3200 most recent tweets). Interestingly this degradation will occur faster for more prolific users. However, it is important to note that third-party copies of that data will still exist, while more resourceful or motivated attackers will still be able to utilize Twitter’s paid APIs that give access to a complete archive of users’ tweets.
Ideally, our study will motivate services and act as a deterrent against publishing sensitive metadata not explicitly broadcast by users (interestingly, a recent study explored how other types of metadata can uniquely identify a user [55]). While the availability of public Twitter data has facilitated innovative and impactful research, the privacy threats that users face remains an important issue. This is further exacerbated by the significant ramifications for users that rely on the pseudonymous nature of Twitter [50]. Overall, while Twitter offers a partial solution for mitigating the privacy risks of this (historical) data, there exists no foolproof course of action for completely eradicating this threat.
Applicability of LPAuditor. The techniques used by our system for inferring users’ home and work locations are not tied to Twitter, but can be readily applied to any (sparse) location dataset that contains periodic entries of GPS coordinates and timestamps. For datasets that contain very frequent snapshots of a user’s location (e.g., continuously collected every couple of seconds), a simple form of sampling should be sufficient for reducing the computational overhead that can arise from a massive number of data points. And while our content-based technique for inferring sensitive locations is not applicable to every location-based service as it relies on the tweets’ content, our duration-based technique can also be applied to any location dataset. However, it is important to stress that our evaluation focuses solely on Twitter and the exact effectiveness of our techniques on other data sources remains unexplored.
LPAuditor adoption. Recent headlines regarding third parties harvesting personal user information in services like Facebook [7] have reignited the public discourse over user privacy and data protection. Facebook has announced plans for offering users more control over their data [3] and Twitter is aiming for increased transparency due to the new GDPR requirements [6]. As such, it is evident that there is need for tools and techniques that can intuitively inform users about what data of theirs is exposed. And while certain cases of data exposure can be self-evident, sensitive information inference may be less obvious. To that end, LPAuditor can be incorporated by any location-based service or social network for clearly notifying users of such exposure. For services that do not obfuscate locations, users can also explore user-side location-obfuscation tools like LP-Doctor [24] or an app for location spoofing [59].
POI. While we find a massive reduction in tweets with GPS coordinates after the release of the less privacy-invasive Twitter apps, there is a considerable number of tweets with a “point of interest” label. These labels cover areas from very coarse (e.g., “Central Park”) to fine-grained (e.g., “Starbucks”). However, without the GPS coordinates it becomes much harder to place users at those locations, since the tweet may be about that place instead of at that place [75]. We consider the exploration of POI-based privacy leakage as future work.
Ethical considerations and disclosure. As is the case with any study that explores user privacy, it is important to address the ethical implications of our work. A precise description of our study and experimental protocol were submitted to and approved for exemption by our university’s Institutional Review Board (IRB). Moreover, apart from only collecting publicly available data offered by the official Twitter API, all usernames were removed during the manual annotation process. This ensured that the authors would not be able to identify/deanonymize any users. At the same time, all collected data and results from our analysis were stored on machines with up-to-date software, encrypted hard drives, where access was strictly limited to the authors and only possible from two white-listed internal IP addresses using authorized SSH keys. We believe that our research presents minimal risk while having the potential for significant benefits to users; we have submitted a report to Twitter outlining our research and findings, and substantiating the need to purge this historical data. Moreover, we have deleted all the results of our analysis, as well as the ground truth dataset and the entirety of the collected Twitter data, to eliminate any potential of future privacy risks to the users.
By reporting the accuracy of our location identification techniques we can alert users of the true extent of the privacy threats they face. Also, by educating users on the risks of location sharing we hope to motivate even more privacy-conscious behavior. Finally, demonstrating the practicality and feasibility of impactful attacks can incentivize services to incorporate privacy-preserving techniques for collecting and sharing location data (e.g., [32, 9, 24]) and offer the functionality of LPAuditor as an intuitive auditing tool for users to assess their level of privacy exposure.
VII Related Work
Prior work has proposed approaches for identifying home and work locations that range from inspecting social graphs, to studying check-ins and precise geolocation data (a survey can be found in [82]). As certain users do not geotag their tweets, previous work has also tried to infer home locations based on tweet content [15, 49, 67] or other information like social ties [33, 14] or check-in behavior [43]. However, these studies can only infer key locations with a very coarse granularity. Furthermore, the inference of sensitive information from other location data points has not been explored.
Location inference. In a study that investigated mobility patterns, Cho et al. [17] considered geographic cells of 625km2, and considered a home location to be the average position of the cell with the most check-ins. Pontes et al. [60] used Foursquare check-ins and correctly inferred the home city of 78% of users. By considering that users are located at their home at night and near their office during working hours, Liu et al. [47] identified the key locations of 68% of the users within a distance of 2.5 km. Efstathiades et al. [22] followed an approach similar to Liu et al.’s for detecting users’ home and work at a postcode granularity
using three Twitter datasets from the Netherlands, London, and the Los Angeles county. Given that the average size of a postal code area in LA is approximately 14.66km2 and includes over 37K residents (our calculations are based on data from [18]), it is evident that postcode-level granularity is still very coarse.
Furthermore, the work by Isaacman et al. [39] leveraged cellular network data to identify important user locations, based on different factors such as the number of days a cluster of cell towers was contacted, and the duration and number of such events, during home hours (7pm-7am) and work hours (1pm-5pm on weekdays) i.e., the number of times a cell tower was contacted in the corresponding set of hours. Then, by employing logistic regression and setting several thresholds derived from 18 training volunteers, the authors estimated the likelihood of a cluster being important. Out of these clusters, again relying on logistic regression, they would pick as home the cluster deemed most significant by the home hour events factor (i.e. the one with the largest number of events during the home hours), and as work the cluster with a high work hour and a low home hour score. In a similar setting, [34] and [40] relied on GSM and WiFi transmission beacons to identify significant user locations, but these two works did not attempt to label the identified locations as home or work. However, in reality, approaches that rely on that type of data (i.e., cellular data) are limited in terms of granularity that can be achieved. Indicatively, the authors of [39] estimated that the median distance error for their home and work inference approach is around 1.44Km and 1.33Km. This is expected though, considering that the distance between the actual home and work locations (reported by the study’s participants) and their nearest cell towers are 0.98Km and 0.8Km for home and work, respectively.
While our approach for detecting home and work locations is based on spatiotemporal analysis, similarly to the previous work in the area, we are the first to propose an approach that considers the vertical “widespreadness” of users’ activity for detecting the home location, as well as a dynamic and adaptive approach for detecting the user’s work location after estimating working hours (night shifts etc.).
Apart from LPAuditor outperforming previously proposed techniques (as shown in Section V), our experimental evaluation and comparative study was conducted on a ground truth dataset that is significantly more complete and fine-grained than the datasets used in prior studies. In detail, the ground truth constructed in [22] was at a postcode level, while Cheng et. al [16] did not actually verify their home selection with some form of ground truth. Similarly, in [17] the authors constructed a ground truth using 25x25km cells and stated that “manual inspection shows that this infers home locations with 85% accuracy” but did not include more details on how that was done. Furthermore, the datasets in [42, 35, 46] all contained only home locations, with the dataset by Lin et al. [46] being based solely on the visual inspection of the GPS data points. While in [35] the authors also relied on manual inspection of tweet content for identifying the home locations, that process was conducted by Amazon Mechanical Turk workers who were only shown a subset of five tweets from a cluster, whereas our manual inspection was conducted collectively on the entirety of tweets assigned to each cluster.
Location and de-anonymization. The problem of identifying key locations has also been explored in different settings, e.g., using continuous GPS data collected from receivers in cars [42] or wearables [44]. Golle and Partridge built upon these findings and explored how users can be identified from different granularities of anonymized census data [29]. De Montjoye et al. [21] explored the uniqueness of user mobility patterns in a 15-month dataset for 1.5M people, and found that four coarse-grained spatiotemporal points can uniquely differentiate 95% of the individuals within the set. Previously, Chong et al. [71] reported a 93% predictability in mobility by measuring the entropy of users’ trajectories. Rossi et al. [66] demonstrated the feasibility of identifying users within mobility traces by using movement data including speed, direction and distance of travel and found that as little as two location points may be sufficient to uniquely identify users. Zang et al. [80] leveraged an anonymized three-month dataset of mobile call records, consisting of roughly 25M users, and discovered that as few as the top-2 most frequented locations can re-identify a user, even in varying granularities, such as call sector, cell, zip code level etc.
User behavior. Prior work also explored how users interact with or disclose location data, and the feasibility of social-tie inference. Liccardi et al. [45] explored how different ways of visualizing data affected users in inferring the type of a location (home, work, etc). Ahern et al. [8] investigated how users select the privacy settings for uploaded photos, and found that users are more likely to set as private photos that are taken at frequently photographed locations while tending to set photos from less frequented locations public. Consolvo et al. [19] found that users were willing to disclose exact locations, but that study focused on a different setting where users were asked about sharing information with friends, family and colleagues. Tang et al. [72] identified how users adapt their location sharing behavior and explored the different ways and levels of granularity at which users decide to share their location under different hypothetical scenarios. Cheng et al. [16] conducted a large-scale study of location data and studied mobility patterns and the correlation between check-ins and message content and sentiment. Sadilek et al. [68] proposed a probabilistic human mobility model for predicting users’ social links and locations. That model considers users who disclose GPS coordinates as noisy sensors for inferring the location of their friends. Several other works (e.g., [20, 56, 69, 81]) leverage spatiotemporal data for inferring social ties among users. More recently, Backes et al. [12] developed an attack for inferring social relationships from mobility data, which constructs and compares user mobility profiles in an unsupervised setting. Working on the opposite perspective, Aronov et al. [11] leverage relationships and additional information such as co-location of events to infer other potentially visited locations.
Aggregate Location Data. Prior work has also studied how aggregate location time-series can lead to significant privacy loss. Pyrgelis et al. [63] presented a novel methodology to study membership inference on such data, by formalizing the problem as a distinguishability game, and showed that such attacks are indeed feasible and can lead to significant privacy loss depending on different factors, such as the adversary’s prior knowledge, aggregation group sizes etc. Shokri et al. [70] investigated membership machine learning based membership inference, and used a dataset of Foursquare check-ins to evaluate their attack. In another work, Pyrgelis et al. [62] studied how aggregate location data can be leveraged to localize and even profile individual users, under different adversarial knowledge scenarios. Finally, Xu et al. [78], demonstrated that it is possible to recover individual user trajectories from aggregate location data with high accuracy, based on the key assumptions that users’ daily trajectories tend to be regular but also differ significantly among users. They also highlight that due to the high uniqueness of the recovered trajectories further attacks, such re-identification, are enabled.
VIII Conclusions
We have investigated the privacy threats that arise from precise location (meta)data being publicly accessible in Twitter’s API. By developing novel techniques for identifying a user’s exact home and work location, and inferring sensitive information through the reconstruction of a user’s location history, LPAuditor highlights the true extent of the risk of exposing such information. To make matters worse, our experimental evaluation revealed how Twitter’s invasive policy of including precise location data in previous app versions has significant implications, as it results in an almost 15-fold increase in the number of users whose key locations are successfully identified by our system. Given that users are most likely oblivious to this privacy leakage, it is important to shed light on this privacy-invasive practice. We hope that our work will serve as a cautionary tale, equipping users with the means to manage their personal data and avoid the risks of public exposure.
Acknowledgments
We would like to thank the anonymous reviewers for their valuable feedback. Special thanks to our shepherd Emiliano De Cristofaro, for all his help. The research leading to these results has received funding from European Union’s Marie Sklodowska-Curie grant agreement No 690972 and Horizon 2020 Research & Innovation Programme under grant agreement No 780787 and No 740787, and the Defense Advanced Research Projects Agency (DARPA) ASED Program and the Air Force Research Laboratory (AFRL), under contract FA8650-18-C-7880. This paper reflects only the view of the authors and the funding bodies are not responsible for any use that may be made of the information it contains.
References
- [1] “Circadian - Overtime and the U.S. Work Week,” http://www.circadian.com/blog/item/28-overtime-and-the-us-work-week.html.
- [2] “EU - Working Hours,” https://europa.eu/youreurope/business/human-resources/working-hours-holiday-leave/working-hours/index_en.htm.
- [3] “Reuters - Facebook to give users more control over personal information,” https://www.reuters.com/article/us-facebook-cambridge-analytica-privacy/facebook-to-give-users-more-control-over-personal-information-idUSKBN1H41KT.
- [4] “The Economist - Very Personal Finance,” http://www.economist.com/node/21556263.
- [5] “US Department of Labor - Occupational Safety and Health Administration,” https://www.osha.gov/OshDoc/data_Hurricane_Facts/faq_longhours.html.
- [6] “The Hill - Twitter announces updated privacy policy ahead of new EU laws,” http://thehill.com/policy/technology/384652-twitter-announces-new-data-privacy-policy-ahead-of-new-european-laws, 2018.
- [7] “The New York Times - Facebook and Cambridge Analytica: What You Need to Know as Fallout Widens,” https://www.nytimes.com/2018/03/19/technology/facebook-cambridge-analytica-explained.html, March 2018.
- [8] S. Ahern, D. Eckles, N. S. Good, S. King, M. Naaman, and R. Nair, “Over-exposed?: privacy patterns and considerations in online and mobile photo sharing,” in Proceedings of ACM CHI, 2007.
- [9] M. E. Andrés, N. E. Bordenabe, K. Chatzikokolakis, and C. Palamidessi, “Geo-indistinguishability: differential privacy for location-based systems,” in Proceedings of ACM CCS, 2013.
- [10] ArcGIS, “Online Geocoding Service,” http://geocode.arcgis.com/arcgis.
- [11] B. Aronov, A. Efrat, M. Li, J. Gao, J. S. B. Mitchell, V. Polishchuk, B. Wang, H. Quan, and J. Ding, “Are friends of my friends too social?: Limitations of location privacy in a socially-connected world,” in Proceedings of Mobihoc, 2018.
- [12] M. Backes, M. Humbert, J. Pang, and Y. Zhang, “walk2friends: Inferring social links from mobility profiles,” in Proceedings of ACM CCS, 2017.
- [13] A. J. Blumberg and P. Eckersly. (2009, Apr.) On Locational Privacy, and How to Avoid Losing it Forever. https://www.eff.org/wp/locational-privacy. ELECTRONIC FRONTIER FOUNDATION (EFF). [Online]. Available: https://www.eff.org/files/eff-locational-privacy.pdf
- [14] J. Chen, Y. Liu, and M. Zou, “Home location profiling for users in social media,” Inf. Manage., vol. 53, no. 1, pp. 135–143, Jan. 2016.
- [15] Z. Cheng, J. Caverlee, and K. Lee, “You are where you tweet: A content-based approach to geo-locating twitter users,” in Proceedings of ACM CIKM, 2010.
- [16] Z. Cheng, J. Caverlee, K. Lee, and D. Z. Sui, “Exploring millions of footprints in location sharing services,” in Proceedings of ICWSM, 2011.
- [17] E. Cho, S. A. Myers, and J. Leskovec, “Friendship and mobility: User movement in location-based social networks,” in Proceedings of ACM KDD, 2011.
- [18] City-Data.com, “Los Angeles Zip Code Map - Locations, Demographics,” http://www.city-data.com/zipmaps/Los-Angeles-California.html.
- [19] S. Consolvo, I. E. Smith, T. Matthews, A. LaMarca, J. Tabert, and P. Powledge, “Location disclosure to social relations: why, when, & what people want to share,” in Proceedings of ACM CHI, 2005.
- [20] D. Crandall, L. Backstrom, D. Cosley, S. Suri, D. Huttenlocher, and J. Kleinberg, “Inferring social ties from geographic coincidences,” Proceedings of the National Academy of Sciences of the United States of America, vol. 107, pp. 22 436–41, 12 2010.
- [21] Y.-A. De Montjoye, C. A. Hidalgo, M. Verleysen, and V. D. Blondel, “Unique in the crowd: The privacy bounds of human mobility,” Scientific reports, vol. 3, p. 1376, 2013.
- [22] H. Efstathiades, D. Antoniades, G. Pallis, and M. D. Dikaiakos, “Identification of key locations based on online social network activity,” in Proceedings of IEEE/ACM ASONAM, 2015.
- [23] M. Ester, H.-P. Kriegel, J. Sander, and X. Xu, “A density-based algorithm for discovering clusters a density-based algorithm for discovering clusters in large spatial databases with noise,” in Proceedings of KDD, 1996.
- [24] K. Fawaz, H. Feng, and K. G. Shin, “Anatomization and protection of mobile apps’ location privacy threats,” in Proceedings of USENIX Security, 2015.
- [25] FCC, “Indoor Location Accuracy Benchmarks,” https://www.fcc.gov/public-safety-and-homeland-security/policy-and-licensing-division/911-services/general/location-accuracy-indoor-benchmarks.
- [26] Foursquare, “Venue Categories,” https://developer.foursquare.com/docs/resources/categories.
- [27] G. Friedland and R. Sommer, “Cybercasing the joint: On the privacy implications of geo-tagging,” in Proceedings of USENIX HotSec, 2010.
- [28] O. Goga, H. Lei, S. H. K. Parthasarathi, G. Friedland, R. Sommer, and R. Teixeira, “Exploiting innocuous activity for correlating users across sites,” in Proceedings of WWW, 2013.
- [29] P. Golle and K. Partridge, “On the anonymity of home/work location pairs,” in Proceedings of the 7th International Conference on Pervasive Computing, 2009.
- [30] Google Maps APIs, “Geocoding Service,” https://developers.google.com/maps/documentation/geocoding/start, 2017.
- [31] R. Gross and A. Acquisti, “Information revelation and privacy in online social networks,” in Proceedings of ACM WPES, 2005.
- [32] M. Gruteser and D. Grunwald, “Anonymous usage of location-based services through spatial and temporal cloaking,” in Proceedings of ACM MobiSys, 2003.
- [33] Y. Gu, Y. Yao, W. Liu, and J. Song, “We know where you are: Home location identification in location-based social networks,” in Proceedings of ICCCN, 2016.
- [34] J. Hightower, S. Consolvo, A. LaMarca, I. Smith, and J. Hughes, “Learning and recognizing the places we go,” in UbiComp 2005: Ubiquitous Computing, M. Beigl, S. Intille, J. Rekimoto, and H. Tokuda, Eds. Springer Berlin Heidelberg, 2005, pp. 159–176.
- [35] T. Hu, J. Luo, H. Kautz, and A. Sadilek, “Home location inference from sparse and noisy data: Models and applications,” in Proceedings of IEEE ICDMW, 2015.
- [36] C. Huang, “Facebook and twitter key to arab spring uprisings: report,” in The National, vol. 6, 2011.
- [37] C. Huang, D. Wang, and J. Tao, “An unsupervised approach to inferring the localness of people using incomplete geotemporal online check-in data,” ACM Trans. Intell. Syst. Technol., vol. 8, no. 6, Aug. 2017.
- [38] C. Huang, D. Wang, S. Zhu, and D. Y. Zhang, “Towards unsupervised home location inference from online social media,” in Proceedings of IEEE Big Data, 2016.
- [39] S. Isaacman, R. Becker, R. Cáceres, S. Kobourov, M. Martonosi, J. Rowland, and A. Varshavsky, “Identifying important places in people’s lives from cellular network data,” in Pervasive Computing, K. Lyons, J. Hightower, and E. M. Huang, Eds. Springer Berlin Heidelberg, 2011, pp. 133–151.
- [40] J. H. Kang, W. Welbourne, B. Stewart, and G. Borriello, “Extracting places from traces of locations,” in Proceedings of the 2Nd ACM International Workshop on Wireless Mobile Applications and Services on WLAN Hotspots, ser. WMASH ’04, 2004, pp. 110–118.
- [41] B. Krishnamurthy and C. E. Wills, “Privacy leakage in mobile online social networks,” in Proceedings of WOSN, 2010.
- [42] J. Krumm, “Inference attacks on location tracks,” in Proceedings of the 5th International Conference on Pervasive Computing, 2007.
- [43] R. Li, S. Wang, H. Deng, R. Wang, and K. C.-C. Chang, “Towards social user profiling: Unified and discriminative influence model for inferring home locations,” in Proceedings of ACM KDD, 2012.
- [44] L. Liao, D. Fox, and H. Kautz, “Location-based activity recognition,” in Proceedings of NIPS, 2005.
- [45] I. Liccardi, A. Abdul-Rahman, and M. Chen, “I know where you live: Inferring details of people’s lives by visualizing publicly shared location data,” in Proceedings of ACM CHI, 2016.
- [46] J. Lin and R. G. Cromley, “Inferring the home locations of twitter users based on the spatiotemporal clustering of twitter data,” Transactions in GIS, 2017.
- [47] H. Liu, Y. Zhang, Y. Zhou, D. Zhang, X. Fu, and K. K. Ramakrishnan, “Mining checkins from location-sharing services for client-independent ip geolocation,” in IEEE INFOCOM, 2014.
- [48] F. Luo, G. Cao, K. Mulligan, and X. Li, “Explore spatiotemporal and demographic characteristics of human mobility via twitter: A case study of chicago,” Applied Geography, vol. 70, pp. 11 – 25, 2016.
- [49] J. Mahmud, J. Nichols, and C. Drews, “Home location identification of twitter users,” ACM Trans. Intell. Syst. Technol., vol. 5, no. 3, 2014.
- [50] W. R. Marczak, J. Scott-Railton, M. Marquis-Boire, and V. Paxson, “When governments hack opponents: A look at actors and technology,” in Proceedings of USENIX Security, 2014.
- [51] K. Minami and N. Borisov, “Protecting location privacy against inference attacks,” in Proceedings of ACM WPES, 2010.
- [52] S. Patil, G. Norcie, A. Kapadia, and A. Lee, “”check out where i am!”: Location-sharing motivations, preferences, and practices,” in Proceedings of ACM CHI, 2012.
- [53] S. T. Peddinti, A. Korolova, E. Bursztein, and G. Sampemane, “Cloak and swagger: Understanding data sensitivity through the lens of user anonymity,” in Proceedings of IEEE S&P, 2014.
- [54] S. T. Peddinti, K. W. Ross, and J. Cappos, “”on the internet, nobody knows you’re a dog”: A twitter case study of anonymity in social networks,” in Proceedings of ACM COSN, 2014.
- [55] B. Perez, M. Musolesi, and G. Stringhini, “You are your metadata: Identification and obfuscation of social media users using metadata information,” in Proceedings of ICWSM, 2018.
- [56] H. Pham, C. Shahabi, and Y. Liu, “Ebm: An entropy-based model to infer social strength from spatiotemporal data,” in Proceedings of ACM SIGMOD International Conference on Management of Data, 2013.
- [57] I. Polakis, G. Argyros, T. Petsios, S. Sivakorn, and A. D. Keromytis, “Where’s wally?: Precise user discovery attacks in location proximity services,” in Proceedings of ACM CCS, ser. 2015.
- [58] I. Polakis, P. Ilia, Z. Tzermias, S. Ioannidis, and P. Fragopoulou, “Social Forensics: Searching for Needles in Digital Haystacks,” in Proceedings of BADGERS, 2015.
- [59] I. Polakis, S. Volanis, E. Athanasopoulos, and E. P. Markatos, “The man who was there: validating check-ins in location-based services,” in ACSAC ’13, 2013.
- [60] T. Pontes, M. Vasconcelos, J. Almeida, P. Kumaraguru, and V. Almeida, “We know where you live: Privacy characterization of foursquare behavior,” in Proceedings of ACM UbiComp, 2012.
- [61] V. Primault, A. Boutet, S. B. Mokhtar, and L. Brunie, “The long road to computational location privacy: A survey,” IEEE COMST, 2018.
- [62] A. Pyrgelis, C. Troncoso, and E. D. Cristofaro, “What does the crowd say about you? evaluating aggregation-based location privacy,” PoPETs, vol. 2017, no. 4, pp. 156–176, 2017.
- [63] ——, “Knock knock, who’s there? membership inference on aggregate location data,” in Proceedings of Network and Distributed System Security Symposium, NDSS, 2018.
- [64] J. Ren, A. Rao, M. Lindorfer, A. Legout, and D. Choffnes, “Recon: Revealing and controlling pii leaks in mobile network traffic,” in Proceedings of ACM MobiSys, 2016.
- [65] W. Roberds and S. L. Schreft, “Data breaches and identity theft,” Journal of Monetary Economics, vol. 56, no. 7, pp. 918–929, 2009.
- [66] L. Rossi, J. Walked, and M. Musolesi, “Spatio-temporal Techniques for User Identification by means of GPS Mobility Data,” EPJ Data Science, vol. 4, no. 11, August 2015.
- [67] K. Ryoo and S. Moon, “Inferring twitter user locations with 10 km accuracy,” in Proceedings of WWW, 2014.
- [68] A. Sadilek, H. Kautz, and J. P. Bigham, “Finding your friends and following them to where you are,” in Proceedings of ACM WSDM, 2012.
- [69] S. Scellato, A. Noulas, and C. Mascolo, “Exploiting place features in link prediction on location-based social networks,” in Proceedings of KDD, 2011.
- [70] R. Shokri, M. Stronati, C. Song, and V. Shmatikov, “Membership inference attacks against machine learning models,” in Proceedings of IEEE S&P, 2017.
- [71] C. Song, Z. Qu, N. Blumm, and A.-L. Barabási, “Limits of predictability in human mobility,” Science, vol. 327, no. 5968, pp. 1018–1021, 2010.
- [72] K. P. Tang, J. Lin, J. I. Hong, D. P. Siewiorek, and N. Sadeh, “Rethinking location sharing: exploring the implications of social-driven vs. purpose-driven location sharing,” in Proceedings of ACM UbiComp, 2010.
- [73] Twitter, “Adding your location to a Tweet,” https://support.twitter.com/articles/122236.
- [74] ——, “FAQs about adding location to your Tweets,” https://support.twitter.com/articles/78525.
- [75] ——, “Tweet Object,” https://developer.twitter.com/en/docs/tweets/data-dictionary/overview/tweet-object.
- [76] ——, “Developer terms - Geo guidelines,” https://developer.twitter.com/en/developer-terms/geo-guidelines, 2014.
- [77] S. Vieweg, A. L. Hughes, K. Starbird, and L. Palen, “Microblogging during two natural hazards events: What twitter may contribute to situational awareness,” in Proceedings of ACM CHI, 2010.
- [78] F. Xu, Z. Tu, Y. Li, P. Zhang, X. Fu, and D. Jin, “Trajectory recovery from ash: User privacy is NOT preserved in aggregated mobility data,” in Proceedings of WWW, 2017.
- [79] P. A. Zandbergen, “Accuracy of iphone locations: A comparison of assisted gps, wifi and cellular positioning,” Trans. in GIS, vol. 13, 2009.
- [80] H. Zang and J. Bolot, “Anonymization of location data does not work: A large-scale measurement study,” in Proceedings of ACM MobiCom, 2011.
- [81] Y. Zhang and J. Pang, “Distance and friendship: A distance-based model for link prediction in social networks,” in Web Technologies and Applications, 2015.
- [82] X. Zheng, J. Han, and A. Sun, “A survey of location prediction on twitter,” IEEE Transactions on Knowledge and Data Engineering, 2018.