New two-dimensional phase of tin chalcogenides: candidates for high-performance thermoelectric materials
Abstract
Tin-chalcogenides SnX (X = Te, Se and S) have been arousing research interest due to their thermoelectric physical properties. The two-dimensional (2D) counterparts, which are expected to enhance the property, nevertheless, have not been fully explored because of many possible structures. Generating variable composition of 2D Sn1-xXx systems (X = Te, Se and S) has been performed using global searching method based on evolutionary algorithm combining with density functional calculations. A new hexagonal phase named by -SnX is found by Universal Structure Predictor Evolutionary Xtallography (USPEX), and the structural stability has been further checked by phonon dispersion calculation and the elasticity criteria. The -SnTe is the most stable among all possible 2D phases of SnTe including those experimentally available phases. Further, phases of SnSe and SnS are also found energetically close to the most stable phases. High thermoelectronic (TE) performance has been achieved in the -SnX phases, which have dimensionless figure of merit (ZT) as high as 0.96 to 3.81 for SnTe, 0.93 to 2.51 for SnSe and 1.19 to 3.18 for SnS at temperature ranging from 300 K to 900 K with practically attainable carrier concentration of 51012 cm-2. The high TE performance is resulted from a high power factor which is attributed to the quantum confinement of 2D materials and the band convergence near Fermi level, as well as low thermal conductivity mainly from both low elastic constants due to weak inter-Sn bonding strength and strong lattice anharmonicity.
pacs:
81.05.Zx, 72.20.Pa, 71.20.Mq, 71.20.Nr, 72.20.-i, 73.63.-bI Introduction
Group IV-VI alloys have been intensively studied with its many physical properties including ferroelectricity Chang et al. (2016), topological insulator Tanaka et al. (2012) and, in particular, thermoelectricity Zhao et al. (2014); Heremans et al. (2008); Li et al. (2015). Thermoelectric (TE) materials, which directly convert waste heat into electricity, have drawn an attention in the last few decades. The conversion efficiency of TE materials can be evaluated by the dimensionless figure of merit (= , in which , , and represent the electrical conductivity, Seebeck coefficient, thermal conductivity and temperature, respectively). Among the group IV-VI alloys, tin and lead chalcogenides Zhao et al. (2014); Heremans et al. (2008); Lee et al. (2014); Li et al. (2015) have been attracting increasing interest in thermoelectric community with the structural and electronic structural anisotropy and intrinsic lattice anharmonicity Lee et al. (2014); Li et al. (2015). Lattice anharmonicity helps to suppress thermal conductivity, while anisotropy is related to the confinement effect which has proved to be efficient in improving thermoelectric performance according to Hicks-Dresselhaus theory Hicks and Dresselhaus (1993a, b) if the confinement length is smaller than thermal de Broglie length Hung et al. (2016).
With the development of exfoliation and synthesis method, many two-dimensional (2D) van der Waals materials including graphene, black phosphorene (BP), transition metal dichalcogenides (TMDs) and tin chalcogenide (SnX) has been synthesized Novoselov et al. (2004); Mak et al. (2010); Liu et al. (2014); Li et al. (2013a). The exfoliated semiconducting monolayer BP and SnX have shown much improved thermoelectric performance ( 2.5 Fei et al. (2014) and 2.63 Shafique and Shin (2017) at 500K and 700K, respectively) with respect to the bulk counterparts. Therefore, it is reasonable to focus our attention on 2D counterpart of tin chalcogenides, which is promising candidates for high-performance TE materials. So far, there has been few studies on the TE properties of the 2D tin chalcogenides, except for some limited theoretical calculations Shen et al. (2017); Shafique and Shin (2017). Moreover, the 2D forms may exhibit many different structures from the bulk counterpart, especially for the non-layered bulks Al Balushi et al. (2016); Aufray et al. (2010). Thus, it is naturally curious to investigate theoretically the most stable structure among all the possible forms and explore the potential TE performance.
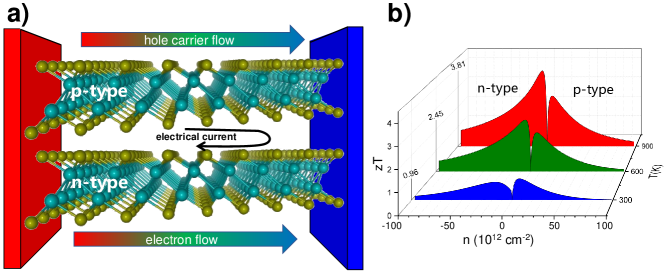
In this work, using ”Universal Structure Predictor Evolutionary Xtallography” USPEX method Oganov et al. (2011); Lyakhov et al. (2013); Oganov et al. (2010); Lyakhov et al. (2010), we survey all possible Tin-chalcogenide 2D phases. A new hexagonal SnX (X= Te, Se, S) phase, which is named phase and shown in Fig. 1(a), has been found by using USPEX. The -SnX have been checked to be thermodynamically stable. Owing to the low lattice thermal conductivity l and high , as explained in the following section, high thermoelectric performance is achieved in the -SnX phases. For example, as seen from Fig. 1(b), of -SnTe at a carrier concentration around a few 1012 cm-2 can be obtained up to 2.45 and 3.81 at 600 and 900 K, respectively.
The paper is organized as follows. We briefly introduce the computational methods in II. In III we shows the main results of the -SnX, including the structural stability in III-A, the thermal transport properties in III-B, and thermoelectric properties in III-C. Finally we draw a conclusion in IV.
II Method
The structure search of 2D tin chalcogenides is performed by USPEX Oganov et al. (2011); Lyakhov et al. (2013); Oganov et al. (2010); Lyakhov et al. (2010) combined with Vienna ab initio simulation package (VASP) Kresse and Furthmüller (1996). In our variable-composition USPEX calculations, the thickness of 2D crystals is restricted in range of 0-6 Å, the total number of atoms is set to be 2-12, while 80 layer groups are chosen for the symmetry in generation of initial 2D structures. Total energy is calculated within the framework of Projector Augmented Wave (PAW) method Kresse and Joubert (1999). Generalized gradient approximation (GGA) Perdew et al. (1996) is used to treat the electronic exchange correlation interaction. More details on the parameters can be referred to the supplementary information sup .
Electronic transport properties are calculated by solving the semi-classical Boltzmann transport equation within the constant relaxation time approximation as implemented in the BoltZTraP package Madsen and Singh (2006). Since there is no experimental data of electrical conductivity available for the new ’-phases to evaluate the relaxation time , is estimated based on carrier mobility , for example, , is the effective mass of carrier, carrier mobility is calculated based on the deformation potential theory Bardeen and Shockley (1950); Qiao et al. (2014); Cai et al. (2014); Jin et al. (2015); Zhang et al. (2016); Lv et al. (2016). The calculated at room temperature varies from a few tens to a few hundred femtoseconds (10-15 s), which has the same order of magnitude as the calculated values in other 2D materials Shafique et al. (2017); Jiang et al. (2017). More details on how to get the carrier mobility and relaxation time can be found in the supplementary information sup . Although the relaxation time of electron depends on the Fermi energy, we adopted the constant relaxation approximation for simplicity. In order to calculate the relaxation time by first principles calculations, we should consider electron-phonon interaction and phonon-phonon interaction for estimating the relaxation time of an electron and a phonon in the same level of approximation, which should be a future problem. Phonon dispersion relation is calculated by Phonopy package Togo and Tanaka (2015). The l is evaluated by phonon lifetime, which is self-consistently calculated in the ShengBTE package Li et al. (2014). The second-order harmonic interatomic force constants (IFCs) are calculated within the Phonopy package, and the third-order anharmonic IFCs are evaluated by using 321 supercell and up to the fifth-nearest neighbors considered by ShengBTE.
| a | thickness | Young’s modulus | shear modulus | Poisson ratio | |||
|---|---|---|---|---|---|---|---|
| (Å) | (Å) | (Å) | (Å) | () | () | ||
| SnTe | 4.34 | 3.36 | 2.97 | 5.39 | 47.15 | 18.42 | 0.28 |
| SnSe | 4.09 | 3.37 | 2.76 | 5.26 | 45.77 | 17.17 | 0.33 |
| SnS | 3.95 | 3.38 | 2.64 | 5.12 | 45.32 | 16.53 | 0.37 |
III Results and Discussions
To understand such a high thermoelectric performance in the -SnX, we investigate the structural, thermal and electronic transport properties of the -SnX systems as follows.
III.1 Structure and stability of -SnX
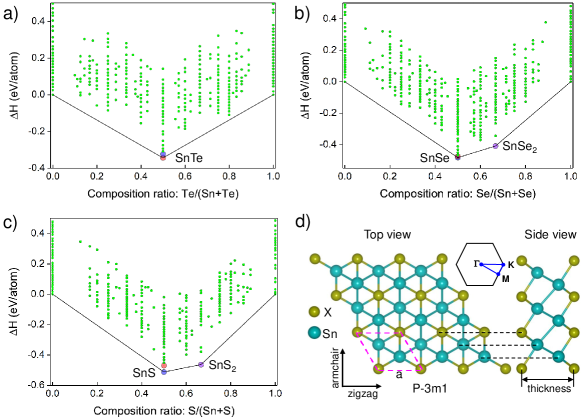
First, we show the results of global search on 2D structures of tin chalcogenides Sn1-xXx (X = Te, Se, S). In Fig. 2, we show the formation enthalpy H (defined in Eq.(1) in supplementary) of tin chalcogenide 2D systems as a function of chalcogenide composition in the variable-composition convex hulls as predicted by USPEX. In the convex hull, the zero line connects two points at H = 0 for the most stable 2D elementary structures of Sn and chalcogenide as predicted by USPEX. 2D Sn1-xXx is more stable than the reactant materials only when H is below the zero line. Out of more than 2600 structures generated, we show only those with H lower than 0.5 eV/atom. The two most stable structures of Sn-Te as highlighted in blue and red dots in the convex hull in Fig. 2(a) are the commonly observed puckered orthorhombic SnTe phase (Fig.1S(a) in the supplementary) Chang et al. (2016) and the new SnTe phase, respectively. H of the SnTe is lower by 19 meV/atom than the puckered orthorhombic SnTe phase. The SnTe has actually been proposed to be a stable semiconductor by Sa Sa et al. (2016) and Zhang et al. Zhang et al. (2017). Here we substantiate structural stability of the phase in a convex hull with all possible stoichiometries considered.
The phase of both Sn-Se and Sn-S has also been obtained close to the convex hulls, as shown in red dots in Fig. 2(b,c). However, the phase is less stable than the puckered orthorhombic phase Li et al. (2013b), with H slightly higher by 8 meV/atom for SnSe and 42 meV/atom for SnS. Additionally, octahedral 1T phases of both SnSe2 and SnS2, the former of which has been synthesized by experiment Xing et al. (2015), is found to be stable in the convex hull, as shown in purple dots in Fig. 2(b,c). In the current paper, we will focus only on the phases.
All the phases have symmetry (space group 164), with the optimized atomic structure and lattice parameters of -SnX (X = Te, Se, S) shown in Fig. 2(d) and Table 1, respectively. From Fig. 2(d), the structure can be viewed as a buckled hexagonal lattice of Sn with two X atoms (one up and one down) at the center of hexagon. Or as shown in Fig.1S(b) in supplementary, it can be considered as two stacked -SnTe monolayers, one of which takes a series of symmetry operations (inversion + glide) to get the second layer, which makes the phase distinct from and more stable than AB-stacked -bilayer in which a translation symmetry exists between two monolayers. The relative stability of the -SnTe phase over the AB-stacked -bilayer is analyzed in more details in supplementary sup .
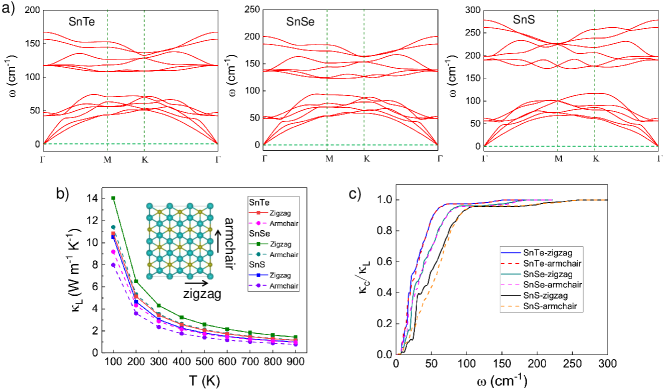
To check the stability of the -SnTe, we calculated the phonon dispersion relation of the phase of SnX, as shown in Fig. 3(a). No imaginary phonon frequencies are found near the point, showing that the phases are dynamically stable. And the stability is also checked by the elastic parameters in Table 1 from the standard criteria of elastic stability Mouhat and Coudert (2014); Born (1940); Zhou and Huang (2008). In fact, the necessary condition for stable 2D materials is that all elastic constant Cij should be positive Wang et al. (1999), which is satisfied in our -SnX materials (more details in supplementary sup ).
| SnTe | SnSe | SnS | |||||
|---|---|---|---|---|---|---|---|
| hole | electron | hole | electron | hole | electron | ||
| carrier mobility | zigzag | 1364 | 1112 | 1275 | 853 | 1220 | 764 |
| () | armchair | 576 | 834 | 579 | 694 | 468 | 660 |
| effective mass | zigzag | 0.213 | 0.144 | 0.228 | 0.169 | 0.363 | 0.218 |
| () | armchair | 0.227 | 0.144 | 0.228 | 0.163 | 0.363 | 0.212 |
III.2 Thermal transport properties of -SnX
Thermoelectric properties consist of thermal and electronic transport properties. We first study the thermal transport properties of -SnX. Since the thermal transport of lattice is related to the mechanical properties, let us discuss the mechanical properties firstly. The Young’s modulus of the -SnX (less than 50 N/m) as shown in Table 1 are much smaller than other 2D materials like graphene (345 N/m) and phosphorene (23-92 N/m) Kou et al. (2015). Shear modulus of the -SnX are found less than 20 N/m. From the phonon dispersion in Fig. 3(a), we can see anti-crossing of the phonon dispersion between low-frequency optical vibration modes with acoustic phonon modes for the -SnX. These optical phonon modes correspond to two-fold degenerate in-plane shearing modes and out-of-plane breathing mode. Interestingly, their vibrational frequency are almost independent of materials at around 50 cm-1 at point, which is closely related to their similar and low values of the shear modulus as given in Table 1. In Fig. 3(b), the calculated is plotted as a function of for armchair and zigzag directions. For example, of -SnTe at 300 along armchair direction is as low as 2.87 . A typical T dependence of () reveals that the Umklapp process in the phonon scattering is essential for the temperature range that we studied. In Fig. 3(c), we show the normalized by cumulative thermal conductivity as a function of frequency at room temperature. is the value of when only phonons with mean free paths below a threshold are considered Li et al. (2014). Over 90 of the is contributed by phonon modes with frequency below 80 cm-1 for SnTe, in which the three acoustic modes and the three low-frequency optical modes contribute to .
The low lattice thermal conductivity of the -SnX arises not only from low elastic constants due to weak Sn-Sn bonding strength, but also from strong lattice anharmonicity. In the low-frequency region, Fig.S3(a) in supplementary shows that the anharmonic scattering dominates the phonon-phonon interactions (PPIs) by comparing the anharmonic three-phonon scattering rates (ASRs) and isotropic scattering rates (ISRs). These ASRs are mainly contributed by phonon absorption process (ASRs+). Among the three -SnXs, the strongest ASRs are found in SnS, which corresponds to the lowest L. It is worth noting that the highest value of ASRs are located between around 50 and 100 cm-1, where acoustic and three low-frequency optical modes are mixed to one another. Thus we expect that the inter-band scattering between the acoustic and optical modes are associated with the large ASRs.
III.3 Thermoelectric properties of -SnX
Based on the calculated results, we will discuss the thermoelectric properties of -SnX.
III.3.1 Seebeck coefficient
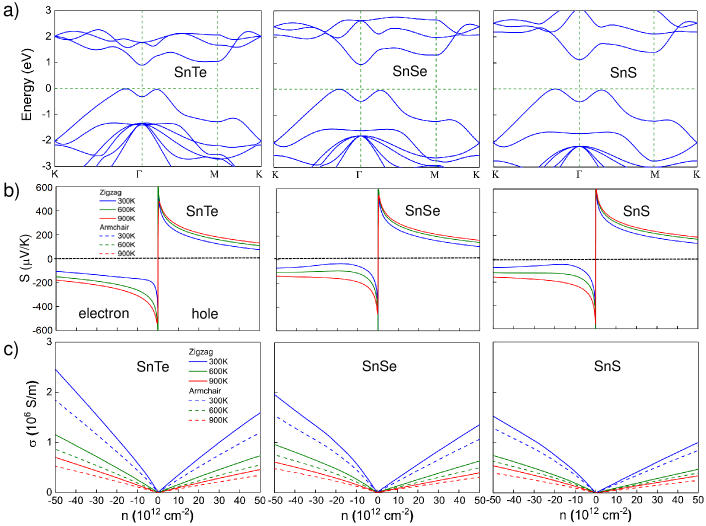
The calculated structural stability and low thermal conductivity suggest that -SnX can be considered suitable for thermoelectric applications. To unveil its potential for energy conversion between heat and electricity, we look into the relevant electronic band structure and electrical properties, both of which reinforce its capacity for such an application. In Fig. 4(a), we show electronic band structures of -SnXs. Indirect band gaps of -SnXs exist near the zone center. The value of energy gaps are around 1.0 eV, which are independent of chalcogenide atoms. It is noted that the conduction bands have been upshifted to fit the band gap obtained by hybrid functional calculations Krukau et al. (2006), which usually give a more reliable band gap size. According to Eg 10 KT rule Ehrenreich and Spaepen (1998), the optimal working temperature for thermoelectric applications of such materials should be around 1000 K.
Thermoelectric properties are closely related to electronic band structure. For all -SnXs, we found the following features in the electronic bands: (1) Band dispersions of valence band maximum (VBM) and conduction band minimum (CBM) along both K and M directions are quite similar, which corresponds to a similar effective mass along both the zigzag and armchair directions as given in Table 2. According to Cutler et al. Cutler et al. (1964) and Snyder et al. Snyder and Toberer (2018), for a parabolic band within the energy-independent scattering approximation, the Seebeck coefficient takes the form of S = , where m∗ is the effective mass of the carrier and is the carrier concentration. From this formula, similar to the effective mass m∗, one expects no directional dependence of the Seebeck coefficient, as shown in Fig. 4(b), in which dashed lines are completely overlapped by solid lines. (2) A usual quadratic dispersion relation appears for the carriers at the CBM, while a quartic band dispersion (Ek k4) is found at the VBM, which usually brings about flat bands near Fermi level. Thus constant electronic density of states (DOS) appears near CBM, while a van-Hove DOS singularity divergence appears near VBM Seixas et al. (2016), as shown in Fig.4S in supplementary. Such a difference of DOS between VBM and CBM explains why the effective mass of holes is larger than that of electrons, as is listed in Table 2.
In Fig. 4(b) and (c), we show Seebeck coefficient and electrical conductivity. For -SnSe and -SnS, the Seebeck coefficient of hole carriers is larger than that of electron; while the electrical conductivity of hole is smaller than that of electron, which is expected for a parabolic band within energy-independent scattering approximation Snyder and Toberer (2018). However, an opposite trend is found in -SnTe that Seebeck coefficient of electron is higher than that of hole, which is due to the convergence of conduction band minimum at point with flat band edge at point. Such type of band convergence is much advantageous for an enhancement of Seebeck coefficient Hung et al. (2019).
III.3.2 Electrical conductivity
In Fig. 4(c), we plot the calculated electrical conductivity as a function of carrier concentration for zigzag and armchair directions. Decent electrical conductivity as high as a few 106 S/m at room temperature is obtained for the three -SnXs. Differences of for different materials along different directions can be understood from the carrier mobility and the effective mass m∗ as is listed in Table 2. From Table 2, we can point out that (1) the effective mass m∗ depends not on crystal direction, but on carrier type, for example, m m; (2) carrier mobility along the zigzag direction is larger than that along the armchair direction, due to a smaller deformation potential along the zigzag direction than the armchair direction. All these features lead to a preference of zigzag over armchair direction and electron over hole carrier for optimal electrical conductivity , which is indicated by the comparison between solid (zigzag) and dashed (armchair) lines as is shown in Fig. 4(c). Moreover, decreases with increasing temperature, which is associated with the intrinsic phonon scattering mechanism. The electrical thermal conductivity is also calculated based on the Boltzmann transport theory, as given in Fig.5S, and fits the Wiedemann-Franz law in combination with .
III.3.3 Power factor and figure of merit
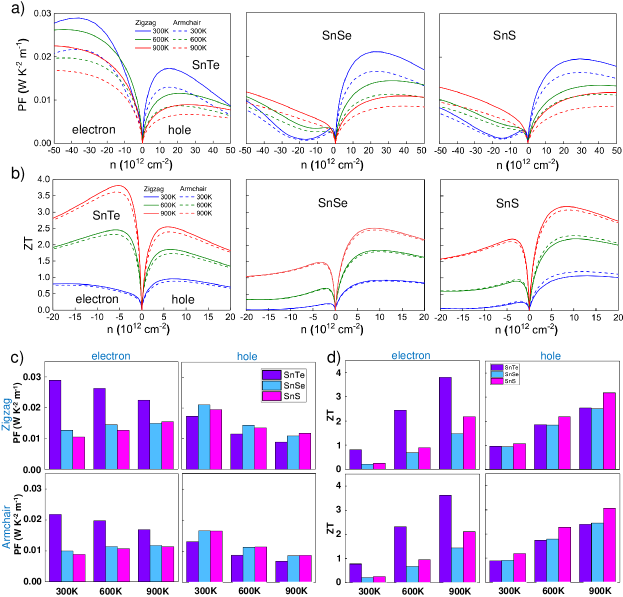
With Seebeck coefficient, electrical conductivity and thermal conductivity available, we finally evaluate power factor (PF) and dimensionless figure of merit (ZT). In Fig. 5(a) and (b), we plot the dependence of carrier type, crystalline direction and temperature for PF and ZT. The optimal PF and are shown in Fig. 5(c,d). As seen from Fig. 5(a), PF remains as high as 0.01 WK-2m-1 or above in a wide range of temperature at carrier concentration from 1012 to 1013 cm-2. Because of the high PF and relatively low , it is no surprise to observe quite promising value of in -SnX. From Fig. 5(b), all of -SnX show above 1.0 at 900 K in the interested doping range ( 8 1013 cm-2). of -SnTe can even go above 2.0 at 600K, which makes the material very competitive against the present commercialized thermoelectric materials. From Fig. 5(a, b), both PF and are larger for hole than for electron in -SnS and -SnSe, mainly due to the smaller Seebeck coefficient of electron than hole. As for -SnTe, we get a better thermoelectric performance of electron than hole, which is due to a large S and PF from the concept of ‘band convergence’ Hung et al. (2019); Pei et al. (2011) at CBM concurrent with decent electrical conductivity from the smaller effective mass of electron than that of hole. In Ref. Hung et al. (2019), the dependence of optimal PF on E for a generic systems with band convergence is given quantitatively within two-band model, with E defined as valley splitting energy. PF decreases exponentially with increasing E within a few kBT. In our case, E is the energy difference of the CBMs between the K and M points in Fig. 4(a), E is 0.15, 0.36 and 0.28 eV for SnTe, SnSe and SnS, respectively, which explains why a much bigger PF of the n-type SnTe is obtained than that of the n-type SnSe and SnS.
In Fig. 5(c,d), we show the optimal values of PF and for two types of carriers along armchair and zigzag directions at T = 300, 600 and 900 K. It is more clear to see in Fig. 5(a,b) that n-type -SnTe has a much better thermoelectric performance than -SnS and -SnSe, while p-type -SnX shows very decent performance but no obvious difference of PF and from SnS to SnTe.
It should be pointed out that we expect some discrepancy between theoretical and experimental values. For our estimation, there are following reasons for discrepancy: 1) the constant relaxation time approximation was used for electronic transport properties, where the real relaxation time may vary with the carrier concentration; 2) only isotopic and three-phonon scattering was considered here for . The constant relaxation time approximation may overestimate the . However, may also be overestimated without considering enough scattering rates coming from the impurity, defect, grain boundary and dislocation and so on. Considering that the two parameters and are both overestimated, the deviation of TE performance may be alleviated in part by the two effects. Therefore, our estimated TE performance may give a reasonable agreement with the experimental values.
Finally due to confinement effect for 2D system Hicks and Dresselhaus (1993a, b), it is important to evaluate the PF enhancement factor fE Hung et al. (2016), which is defined as fE = , where L is the spatial confinement length and (= ) is the so-called thermal de Broglie wavelength and D (= 1 or 2) is the dimension. Here we consider the PF enhancement from 3D to 2D. L is taken from the interlayer distance in 3D counterparts. Values of , L and FE for -SnX are given in Table III in supplementary. Take n-type -SnTe as an example, we find that 11.35 nm, L 0.82 nm, which makes fE 13.76, about one order of magnitude from 3D to 2D, revealing that thermoelectric behavior of -SnX in 2D form is much enhanced upon its 3D counterpart.
In summary, for the new phase of SnX, the decent thermoelectric properties beyond traditional thermoelectric materials occur because of the following reasons: (1) The low dimensional structure with high elastic and dynamic stability, which shows substantial enhancement of power factor upon the bulk phase due to the larger thermal de Broglie length . (2) The low shear modulus within the layer giving rise to an ultralow frequency of the shearing mode which can couple very effectively with the acoustic phonon mode to greatly suppress the lattice thermal conductivity. (3) The convergence of electronic bands at the valence and conduction band edges. All the above factors appear concurrently and coherently to lead to the good thermoelectric performance.
IV conclusion
In this paper, we found new-phase SnX ( phase) which is suitable for thermoelectric application by combining ab initio density functional theory with genetic algorithm and semi-classical Boltzmann transport theory. The phase is either the most stable phase (-SnTe), or close to the most stable phases (such as orthorhombic phase of SnSe and SnS) which are experimentally observed. Phonon dispersion relation calculation and elasticity criteria are used to confirm the structural stability. A low lattice thermal conductivity is obtained for -SnX, mainly because of hybridization acoustic phonon modes with low-frequency inter-layer shearing vibration modes. A decent value of power factor ( 0.01 Wm-1K-2) is also observed from our calculations, which is ascribed to band convergence at CBM and quartic electronic band dispersion at VBM. A competitive dimensionless figure of merit can be obtainable in -SnX within practical doping of a few 1012 cm-2, in particular, over 2.5 can be reached in -SnTe at 900 K. Thermoelectric performance of -SnX can be further optimized with transport along zigzag crystalline direction. Our theoretical study deems to facilitate discovering new phase for optimizing thermoelectric performance by experiment.
V ACKNOWLEDGEMENT
This work is supported by the National Key RD Program of China (2017YFA0206301) and the Major Program of Aerospace Advanced Manufacturing Technology Research Foundation NSFC and CASC, China (No. U1537204). A.R. O. and B.J. D. thank the Russian Science Foundation (Grant 16-13-10459). R.S. acknowledges MEXT-Japan Grants Nos. JP25107005, JP25286005, JP15K21722 and JP18H01810. N.T.H. acknowledges JSPS KAKENHI Grants No. JP18J10151. Z.H. W. thanks the National Science Foundation of China (Grant No.11604159) and the Russian Scientific Foundation (Grant No.18-73-10135). Calculations were performed on XSEDE facilities and on the cluster of the Center for Functional Nanomaterials, Brookhaven National Laboratory, which is supported by the DOE-BES under contract no. DE-AC02-98CH10086. This work has been carried out using the Rurik supercomputer, the Arkuda supercomputer of Skolkovo Foundation, and computing resources of the federal collective usage center Complex for Simulation and Data Processing for Mega-science Facilities at NRC Kurchatov Institute.
References
- Chang et al. (2016) K. Chang, J. Liu, H. Lin, N. Wang, K. Zhao, A. Zhang, F. Jin, Y. Zhong, X. Hu, W. Duan, Q. Zhang, L. Fu, Q.-K. Xue, X. Chen, and S.-H. Ji, Science 353, 274 (2016), http://science.sciencemag.org/content/353/6296/274.full.pdf .
- Tanaka et al. (2012) Y. Tanaka, Z. Ren, T. Sato, K. Nakayama, S. Souma, T. Takahashi, K. Segawa, and Y. Ando, Nature Physics 8, 800 (2012).
- Zhao et al. (2014) L.-D. Zhao, S.-H. Lo, Y. Zhang, H. Sun, G. Tan, C. Uher, C. Wolverton, V. P. Dravid, and M. G. Kanatzidis, Nature 508, 373 (2014).
- Heremans et al. (2008) J. P. Heremans, V. Jovovic, E. S. Toberer, A. Saramat, K. Kurosaki, A. Charoenphakdee, S. Yamanaka, and G. J. Snyder, Science 321, 554 (2008), http://science.sciencemag.org/content/321/5888/554.full.pdf .
- Li et al. (2015) C. W. Li, J. Hong, A. F. May, D. Bansal, S. Chi, T. Hong, G. Ehlers, and O. Delaire, Nature Physics 11, 1063 (2015).
- Lee et al. (2014) S. Lee, K. Esfarjani, T. Luo, J. Zhou, Z. Tian, and G. Chen, Nature Communications 5, 3525 (2014).
- Hicks and Dresselhaus (1993a) L. D. Hicks and M. S. Dresselhaus, Phys. Rev. B 47, 16631 (1993a).
- Hicks and Dresselhaus (1993b) L. D. Hicks and M. S. Dresselhaus, Phys. Rev. B 47, 12727 (1993b).
- Hung et al. (2016) N. T. Hung, E. H. H. Hasdeo, A. R. T. Nugraha, M. S. Dresselhaus, and R. Saito, Phys. Rev. Lett. 117, 036602 (2016).
- Novoselov et al. (2004) K. S. Novoselov, A. K. Geim, S. V. Morozov, D. Jiang, Y. Zhang, S. V. Dubonos, I. V. Grigorieva, and A. A. Firsov, Science 306, 666 (2004), http://science.sciencemag.org/content/306/5696/666.full.pdf .
- Mak et al. (2010) K. F. Mak, C. Lee, J. Hone, J. Shan, and T. F. Heinz, Phys. Rev. Lett. 105, 136805 (2010).
- Liu et al. (2014) H. Liu, A. T. Neal, Z. Zhu, Z. Luo, X. Xu, D. Tomanek, and P. D. Ye, ACS Nano 8, 4033 (2014), pMID: 24655084, https://doi.org/10.1021/nn501226z .
- Li et al. (2013a) L. Li, Z. Chen, Y. Hu, X. Wang, T. Zhang, W. Chen, and Q. Wang, Journal of the American Chemical Society 135, 1213 (2013a), pMID: 23311291, https://doi.org/10.1021/ja3108017 .
- Fei et al. (2014) R. Fei, A. Faghaninia, R. Soklaski, J.-A. Yan, C. Lo, and L. Yang, Nano Letters 14, 6393 (2014), pMID: 25254626, https://doi.org/10.1021/nl502865s .
- Shafique and Shin (2017) A. Shafique and Y.-H. Shin, Scientific Reports 7, 506 (2017).
- Shen et al. (2017) J. Shen, Z. Ma, and K. Wu, Scientific Reports 7, 8914 (2017).
- Al Balushi et al. (2016) Z. Y. Al Balushi, K. Wang, R. K. Ghosh, R. A. Vila, S. M. Eichfeld, J. D. Caldwell, X. Qin, Y.-C. Lin, P. A. DeSario, G. Stone, S. Subramanian, D. F. Paul, R. M. Wallace, S. Datta, J. M. Redwing, and J. A. Robinson, Nature Materials 15, 1166 (2016).
- Aufray et al. (2010) B. Aufray, A. Kara, S. Vizzini, H. Oughaddou, C. Léandri, B. Ealet, and G. Le Lay, Applied Physics Letters 96, 183102 (2010), https://doi.org/10.1063/1.3419932 .
- Oganov et al. (2011) A. R. Oganov, A. O. Lyakhov, and M. Valle, Accounts of Chemical Research 44, 227 (2011), pMID: 21361336, https://doi.org/10.1021/ar1001318 .
- Lyakhov et al. (2013) A. O. Lyakhov, A. R. Oganov, H. T. Stokes, and Q. Zhu, Computer Physics Communications 184, 1172 (2013).
- Oganov et al. (2010) A. R. Oganov, Y. Ma, A. O. Lyakhov, M. Valle, and C. Gatti, Reviews in Mineralogy and Geochemistry 71, 271 (2010).
- Lyakhov et al. (2010) A. O. Lyakhov, A. R. Oganov, and M. Valle, “Crystal structure prediction using evolutionary approach,” in Modern Methods of Crystal Structure Prediction (Wiley-Blackwell, 2010) Chap. 7, pp. 147–180.
- Kresse and Furthmüller (1996) G. Kresse and J. Furthmüller, Phys. Rev. B 54, 11169 (1996).
- Kresse and Joubert (1999) G. Kresse and D. Joubert, Phys. Rev. B 59, 1758 (1999).
- Perdew et al. (1996) J. P. Perdew, K. Burke, and M. Ernzerhof, Phys. Rev. Lett. 77, 3865 (1996).
- (26) Please refer to the supplementary files.
- Madsen and Singh (2006) G. K. Madsen and D. J. Singh, Computer Physics Communications 175, 67 (2006).
- Bardeen and Shockley (1950) J. Bardeen and W. Shockley, Phys. Rev. 80, 72 (1950).
- Qiao et al. (2014) J. Qiao, X. Kong, Z.-X. Hu, F. Yang, and W. Ji, Nature Communications 5, 4475 (2014).
- Cai et al. (2014) Y. Cai, G. Zhang, and Y.-W. Zhang, Journal of the American Chemical Society 136, 6269 (2014), pMID: 24712770, https://doi.org/10.1021/ja4109787 .
- Jin et al. (2015) Z. Jin, Q. Liao, H. Fang, Z. Liu, W. Liu, Z. Ding, T. Luo, and N. Yang, Scientific Reports 5, 18342 (2015).
- Zhang et al. (2016) L.-C. Zhang, G. Qin, W.-Z. Fang, H.-J. Cui, Q.-R. Zheng, Q.-B. Yan, and G. Su, Scientific Reports 6, 19830 (2016).
- Lv et al. (2016) H. Y. Lv, W. J. Lu, D. F. Shao, H. Y. Lu, and Y. P. Sun, J. Mater. Chem. C 4, 4538 (2016).
- Shafique et al. (2017) A. Shafique, A. Samad, and Y.-H. Shin, Phys. Chem. Chem. Phys. 19, 20677 (2017).
- Jiang et al. (2017) P. Jiang, H. Liu, L. Cheng, D. Fan, Z. J., W. J., J. Liang, and S. J., Carbon 113, 108 (2017).
- Togo and Tanaka (2015) A. Togo and I. Tanaka, Scripta Materialia 108, 1 (2015).
- Li et al. (2014) W. Li, J. Carrete, N. A. Katcho, and N. Mingo, Computer Physics Communications 185, 1747 (2014).
- Sa et al. (2016) B. Sa, Z. Sun, and B. Wu, Nanoscale 8, 1169 (2016).
- Zhang et al. (2017) X. Zhang, Z. Yang, and Y. Chen, Journal of Applied Physics 122, 064101 (2017), https://doi.org/10.1063/1.4989614 .
- Li et al. (2013b) L. Li, Z. Chen, Y. Hu, X. Wang, T. Zhang, W. Chen, and Q. Wang, Journal of the American Chemical Society 135, 1213 (2013b), pMID: 23311291, https://doi.org/10.1021/ja3108017 .
- Xing et al. (2015) Z. Xing, G. Lin, T. Wenming, Z. Qi, J. Shengye, L. Huiqiao, B. Yoshio, G. Dmitri, and Z. Tianyou, Advanced Materials 27, 8035 (2015), https://onlinelibrary.wiley.com/doi/pdf/10.1002/adma.201503873 .
- Mouhat and Coudert (2014) F. Mouhat and F.-X. Coudert, Phys. Rev. B 90, 224104 (2014).
- Born (1940) M. Born, Math. Proc. Camb. Phil. Soc. 36, 160 (1940).
- Zhou and Huang (2008) J. Zhou and R. Huang, Journal of the Mechanics and Physics of Solids 56, 1609 (2008).
- Wang et al. (1999) J. Wang, R. Zhang, D.-H. Ding, and R. Wang, Acta Crystallographica Section A 55, 558 (1999).
- Kou et al. (2015) L. Kou, C. Chen, and S. C. Smith, J. Phys. Chem. Lett. 6, 2794 (2015).
- Krukau et al. (2006) A. V. Krukau, O. A. Vydrov, A. F. Izmaylov, and G. E. Scuseria, The Journal of Chemical Physics 125, 224106 (2006), https://doi.org/10.1063/1.2404663 .
- Ehrenreich and Spaepen (1998) H. Ehrenreich and F. Spaepen, Solid State Physics, Vol. 51 (Academic Press, San Diego, 1998).
- Cutler et al. (1964) M. Cutler, J. F. Leavy, and R. L. Fitzpatrick, Phys. Rev. 133, A1143 (1964).
- Snyder and Toberer (2018) G. J. Snyder and E. S. Toberer, Nature Materials 7, 105 (2018).
- Seixas et al. (2016) L. Seixas, A. S. Rodin, A. Carvalho, and A. H. Castro Neto, Phys. Rev. Lett. 116, 206803 (2016).
- Hung et al. (2019) N. T. Hung, A. R. T. Nugraha, T. Yang, Z. Zhang, and R. Saito, J. Appl. Phys. 125, 082502 (2019).
- Pei et al. (2011) Y. Pei, X. Shi, A. LaLonde, H. Wang, C. L., and G. J. Snyder, Nature 473, 66 (2011).