WALLABY Early Science - II. The NGC 7232 galaxy group
Abstract
We report on neutral hydrogen (Hi) observations of the NGC 7232 group with the Australian Square Kilometre Array Pathfinder (ASKAP). These observations were conducted as part of the Wide-field ASKAP L-Band Legacy All-sky Blind surveY (WALLABY) Early Science program with an array of 12 ASKAP antennas equipped with Phased Array Feeds, which were used to form 36 beams to map a field of view of 30 square degrees. Analyzing a subregion of the central beams, we detect 17 Hi sources. Eleven of these detections are identified as galaxies and have stellar counterparts, of which five are newly resolved Hi galaxy sources. The other six detections appear to be tidal debris in the form of Hi clouds that are associated with the central triplet, NGC 7232/3, comprising the spiral galaxies NGC 7232, NGC 7232B and NGC 7233. One of these Hi clouds has a mass of M M⊙ and could be the progenitor of a long-lived tidal dwarf galaxy. The remaining Hi clouds are likely transient tidal knots that are possibly part of a diffuse tidal bridge between NGC 7232/3 and another group member, the lenticular galaxy IC 5181.
keywords:
galaxies: groups: individual: NGC 7232 – galaxies: interactions1 Introduction
Most galaxies in the current epoch of the Universe reside in galaxy groups (Tully, 1987). These groups are ubiquitous and their evolution is often dominated by gravitationally driven interactions between their members (Barnes & Webster 2001, Yang et al. 2007). Neutral atomic hydrogen (Hi) gas can be used to trace disturbed morphologies that are the result of galaxy interactions and detect newly formed tidal features (Mullan et al. 2013, Lee-Waddell et al. 2016). The presence of tidal bridges and tails can constrain the initial properties of the interacting galaxies and the dynamics of the actual encounter (Toomre & Toomre 1972, Bournaud & Duc 2006), aiding in our understanding of this evolutionary process. Within the tidal streams, high-density clumps of Hi can accrete sufficient amounts of material to eventually become self-gravitating tidal dwarf galaxies (TDGs; Mirabel, Dottori, Lutz 1992, Lelli et al. 2015). TDGs can provide further information about the interaction event and possibly strengthen the standard model of cosmology (see Duc et al. 2014, Ploeckinger et al. 2018).
A single galaxy group offers a mere snapshot of this type of evolutionary process. In order to throughly examine galaxy interactions and fully quantify the by-products of these events, large-scale surveys are required. Previous single-dish all sky surveys, such as the Hi Parkes All-Sky Survey (HIPASS; Barnes et al. 2001) and Arecibo Legacy Fast ALFA (ALFALFA; Giovanelli et al. 2005), provided the opportunity to conduct a census of the Hi located in group environments but often higher angular resolution follow-up observations were required to resolve and properly characterize low-mass tidal features (Ryder et al. 2001, English et al. 2010, Janowiecki et al. 2015, Lee-Waddell et al. 2016).
The Australian Square Kilometre Array Pathfinder (ASKAP) is a new radio interferometer that will enable wide-field observations that can also resolve low-mass Hi clouds (Johnston et al. 2007, Johnston et al. 2008). ASKAP consists of 36 12-m antennas equipped with Phased Array Feeds (PAFs) that yield a 30 square degree field of view (DeBoer et al., 2009). All observations are, by default, conducted using full polarization mode (i.e. observing in all four Stokes parameters). The 6-element Boolardy Engineering Test Array (Hotan et al. 2014, McConnell et al. 2016) has demonstrated the potential of ASKAP as an ideal sky survey instrument (e.g. Allison et al. 2015, Serra et al. 2015b, Heywood et al. 2016).
One of the two top-ranked survey science projects planned for ASKAP is the Wide-field ASKAP L-Band Legacy All-sky Blind surveY (WALLABY; PIs B. Koribalski & L. Staveley-Smith), which has been designed to study the properties, environments, and large-scale distribution of Hi-rich galaxies. WALLABY will cover 75 percent of the sky (declination range of ) and is predicted to detect Hi in more than 500,000 galaxies out to a redshift of 0.26 with an angular resolution of 30 arcsec and a spectral resolution of 4 km s-1 (Duffy et al. 2012, Koribalski 2012). This level of resolution is required to resolve the physical characteristics and measure the dynamical properties of tidally formed features in the nearby universe (Mullan et al. 2013, Lelli et al. 2015).
ASKAP Early Science is an observing program aimed at producing scientifically useful data, with at least 12 MkII PAF-equipped ASKAP antennas (i.e. ASKAP-12), while commissioning ASKAP to its full specification. The priorities for this program are to demonstrate the unique capabilities of ASKAP, produce data sets to facilitate the development of data processing and analysis techniques, and achieve high scientific impact. ASKAP survey science teams were given opportunities to select specific science fields to target with ASKAP-12 during the shared-risk and development phases of all aspects of ASKAP. These observations would not only test the capabilities of the array but also the automated data processing pipeline ASKAPsoft111https://data.csiro.au/dap/search?q=ASKAPsoft as well as the CSIRO ASKAP Science Data Archive222https://data.csiro.au/dap/public/casda/casdaSearch.zul (CASDA) for storing the final data products.
The ASKAP Early Science program started in October 2016 with the WALLABY team taking 36-beam observations using ASKAP-12. The first WALLABY Early Science field, the NGC 7232 field, was chosen because it contains 19 detections from HIPASS (Koribalski et al. 2004, Meyer et al. 2004) – including a nearby spiral galaxy (IC 5201), galaxy pairs, and other interacting systems – which would assist in data validation. These varying environments also provide the opportunity to capitalize on ASKAP’s high resolution capabilities, allowing for more detailed spatial studies and the potential for new Hi detections. Although there are several Hi-rich galaxy systems in this field (e.g. Reynolds et al. 2018), this paper will specifically focus on the NGC 7232/3 triplet and its neighbouring galaxies.
The NGC 7232/3 triplet comprises three spiral galaxies, NGC 7232, NGC 7232B and NGC 7233, located in a loose group environment (which is listed as LGG 455 by Garcia et al. 1993 and includes a neighbouring lenticular galaxy, IC 5181) at a Hubble distance of 24 Mpc (Garcia, 1995). Previous interferometric observations with the Australia Telescope Compact Array (ATCA) show Hi streams connecting the galaxies within the triplet (Barnes & Webster, 2001), indicating a recent/on-going interaction event. HIPASS observations show that the triplet system as well as an unresolved starless Hi feature, HIPASS J2214-45, reside in a common gas-rich envelope referred to as the AM2212-460 galaxy group (Koribalski et al., 2004). There are a handful of other neighbouring galaxies, bringing the membership number to 10 galaxies (Barnes & Webster, 2001).
Here we are using ASKAP’s ability to provide a large field of view while maintaining high angular resolution to carry out detailed analysis of the NGC 7232/3 triplet system and its possible connection to other group members. Although ASKAP-12 has a limited number of baselines (compared to the full array), longer integration times can be used to increase the Hi sensitivity in order to detect dwarf companions and faint tidal features. Since the angular resolution of ASKAP is comparable to the ATCA observations, the latter provide a good reference for data verification purposes. The higher frequency resolution of ASKAP will enable further dynamical analysis of spectrally distinct components of the galaxy triplet and its tidal streams.
In Section 2 of this paper, we describe the observational setup used during various commissioning and Early Science phases of the ASKAP-12 array. Section 3 details the data processing and imaging completed with ASKAPsoft. In Section 4, we present our measurements, final Hi maps of the region and stellar properties from ancillary optical imaging. We analyse and discuss the newly resolved Hi sources in Section 5 and Section 6 contains concluding remarks.
2 Observations
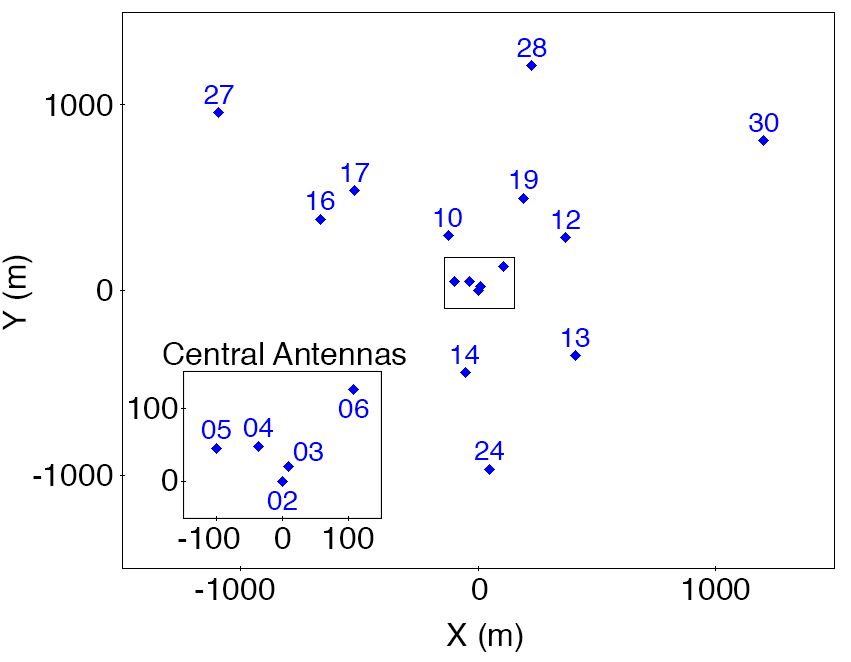
The majority of the observations of the NGC 7232 field were taken during the inaugural month of the ASKAP Early Science program. Additional observations were obtained in August and September during different commissioning phases of the array in 2016 and 2017. The same configuration of antennas was used throughout 2016 when only 48 MHz of simultaneous bandwidth was achievable. The bandwidth was split into 2592 independent channels, each 18.5 kHz wide (equivalent to 3.9 km s-1 at 1420 MHz). After numerous system upgrades and further commissioning, more bandwidth and new antennas were available for the main array, which changed the available baselines in 2017 (see Table 1 and Fig. 1). Nevertheless, due to computing limitations during Early Science and caution exercised during the later commissioning phases, no more than 12 antennas were used on a given night of observations on the NGC 7232 field.
| Date | Observed | Antennas available | Minimum | Maximum |
|---|---|---|---|---|
| frequency range | baseline | baseline | ||
| (MHz) | (m) | (m) | ||
| Aug - Oct 2016 | 1376.5 - 1424.5 | 02, 04, 05, 10, 12, 13, 14, 16, 24, 27, 28, 30 | 60 | 2300 |
| Aug 2017 | 1248.5 - 1440.5 | 03, 04, 05, 06, 10, 12, 14, 17, 19, 24, 30 | 50 | 2120 |
| Sep 2017 | 1200.5 - 1440.5 | 02, 03, 04, 06, 10, 14, 16, 17, 19, 27, 28, 30 | 20 | 2300 |
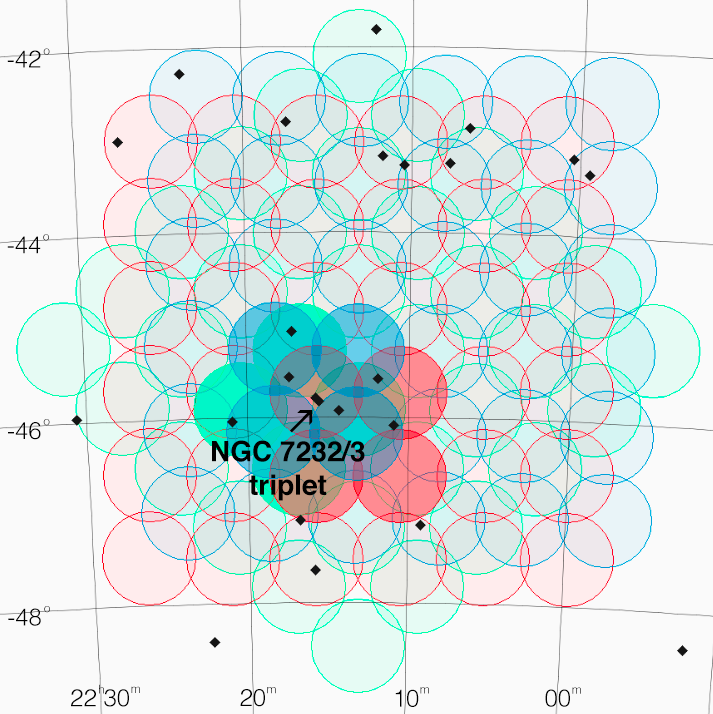
Throughout the Early Science program, science targets were generally observed at night, after ASKAP development and commissioning activities. Table 2 summarizes all commissioning and Early Science observations on the NGC 7232 field, totalling 18 usable nights. A square beam footprint, yielding a degree field of view, was chosen to maximise the sky coverage. Two interleaves – footprint A (centred at RA = 22:13:07.7, Dec = -45:16:57.1, J2000) and footprint B (RA = 22:10:35.41, Dec = -44:49:50.7) – were combined to fill in the gaps between beams and produce a more uniform sensitivity pattern (see Figure 2). The data will be publicly available on CASDA under the appropriate ASKAP scheduling block identifying number (SBID; Table 2). Bhandari et al. (2018) have conducted a search for variable and transient continuum sources using footprint B from the same set of observations.
In September 2016, there was testing of rotating the footprint by 45∘ to better match the configuration of electronics on the PAFs and thereby increase the sensitivity of the corner beams. The formed beams were not re-rotated resulting in a diamond shape on the sky for those observations. This rotated beam forming method proved to be beneficial and became standard starting December 2016. The observations taken in 2017 used re-rotated beams to match the square shape of the October 2016 observations.
Each night began with a few hours of observations on the primary calibrator, PKS1934-638, that was sequentially positioned at the centre of each of the 36 beams for a chosen amount of time per beam (). During our Early Science observations, we were able to determine that 200 seconds per beam was sufficient for post-observing calibrations. Longer integration times would significantly increase observing overheads without appreciably improving the calibration procedure.
Due to technical issues on various nights, which stemmed from commission tests on the overall stability of the array during Early Science, the data from one or two antennas – as specified in Table 2 – were omitted from the processing procedure. The equivalent ASKAP-12 observing time () has been computed using the following relation, based on the standard radiometer equation for interferometry:
| (1) |
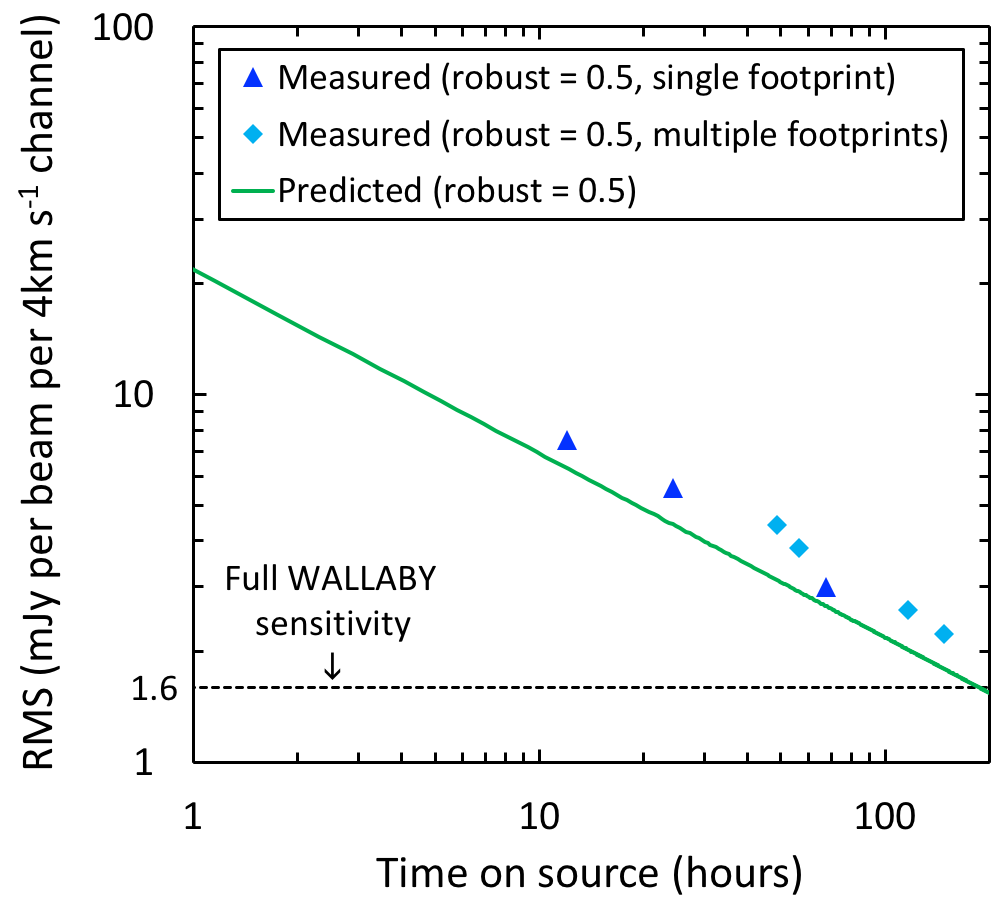
where is the number of antennas used during each observation, is the actual time spent on the science source and the factor of 132 is from 12*(12-1) total antennas. The goal was to achieve full WALLABY sensitivity (i.e. 1.6 mJy per beam per channel; Koribalski 2012) by combining multiple nights of data. Out of the total observing time of = 180h, 150 hours were used to produce the final image cube that has a sensitivity of 2.2 mJy per beam per channel (see Section 3 for further details). Figure 3 shows the ASKAP-12 root-mean-square (RMS) noise measurements and predictions based on a temperature over efficiency value of T = 85K, which was the value estimated for the telescope at the time of the observations.
| Obs. date | ASKAP | Footprint | Omitted | † | Notes | ||
|---|---|---|---|---|---|---|---|
| SBID | interleave | (s) | (s) | antennas | (h) | ||
| 11 Aug 2016 | 1927 | A | 200 | 43207.2 | 02, 14 | 8.2 | |
| 12 Aug 2016 | 1934 | A | 200 | 41525.1 | 14 | 9.6 | |
| 5 Sep 2016 | 2012 | A | 200 | 32348.2 | 02 | 7.5 | footprint rotated 45∘ |
| 6 Sep 2016 | 2025 | A | 200 | 39793.2 | 02 | 11.1 | footprint rotated 45∘ |
| 7 Oct 2016 | 2238 | B | 300 | 37354.7 | 14 | 8.6 | excluded from final cube |
| 8 Oct 2016 | 2247 | B | 300 | 41087.1 | 11.4 | excluded from final cube | |
| 9 Oct 2016 | 2253 | B | 300 | 43535.6 | 12.1 | excluded from final cube | |
| 10 Oct 2016 | 2264 | B | 200 | 39604.1 | 11.0 | ||
| 11 Oct 2016 | 2270 | A | 300 | 44829.6 | 12.5 | ||
| 12 Oct 2016 | 2276, 2280 | B | 200 | 23816.0 | 9.1 | ||
| 13 Oct 2016 | 2289 | A | 200 | 40539.7 | 10, 14 | 7.7 | |
| 14 Oct 2016 | 2299 | B | 200 | 37354.7 | 10.4 | ||
| 16 Oct 2016 | 2325 | A | 200 | 44769.8 | 12.4 | ||
| 17 Oct 2016 | 2329 | B | 200 | 44341.9 | 12.3 | ||
| 18 Oct 2016 | 2338 | A | 200 | 43207.2 | 12.0 | ||
| 19 Oct 2016 | 2347 | B | 200 | 43207.2 | 12.0 | ||
| 23 Aug 2017 | 4002 | A | 200 | 36012.3 | 8.3 | ||
| 27 Sep 2017 | 4399 | A | 200 | 18005.5 | 5.0 |
see Equation 1
3 Data processing and imaging
The observations from individual beams for each night were edited, calibrated, and imaged using ASKAPsoft (Whiting et al., in prep) – the processing pipeline specifically designed and developed for ASKAP – on the Galaxy Cray in the Pawsey Supercomputing Centre. Processing the entirety of the Early Science data for the NGC 7232 field would have taken several weeks of computing time and resulted in over 120 TB of intermediate and final data products. For the purpose of this paper, and in order to save time and disk space, we only used the relevant portion of the entire data set. We processed four beams from each night (footprint A = beams 02,03,11,12; rotated footprint A = beams 01,03,08,09; footprint B = beams 03,09,10,11; see Figure 2) and a reduced bandwidth of 16 MHz around the Hi line. The bandwidth was split into 864 channels, maintaining the 18.5 kHz (= 3.9 km s-1) spectral resolution, covering a frequency range between 1404.5 to 1420.5 MHz and an equivalent velocity range of -16 to 3391 km s-1.
Most of the processing parameters were the default settings for ASKAPsoft version 0.19.7333https://doi.org/10.4225/08/5ac2dc9a16430. These settings included the use of the automated dynamic flagging utility that identifies outlying signals as well as the use of self-calibration to correct the time dependent fluctuations of the antenna gains (both amplitude and phase) during the observation of the science target. Changes to the default processing parameters were selected to omit autocorrelations and any antennas specified in Table 2. The calibrator observations on PKS 1934-638 were often taken at low elevation in the late afternoon. Solar interference can introduce spurious signals that are more pronounced on the shorter baselines. As a cautionary measure, any calibrator data from baselines shorter than 200m were excluded from the processing procedure.
In the imaging stage, due to the limited number of shorter baselines, natural weighting resulted in a “patchy” noise pattern across the spectral line image cube. As such, a weighting of robust = 0.5 was chosen to better utilise the uv-coverage pattern of ASKAP-12, which resulted in smoother background noise. The preliminary image cubes had a beam size of arcsec. A Gaussian taper of 30 arcsec was applied to achieve a synthesized beam of 35.5 30 arcsec and bring out Hi of lower column density. Due to residual artefacts from the uv-based model continuum subtraction, the spectral line image cubes for each beam also went through image-based continuum subtraction prior to being linearly mosaicked together using the linmos task in ASKAPsoft. The details of the final ASKAP image cube are summarized in Table 3.
| On-source observing time (combined hours) | 150 |
| Weighting scheme | robust = 0.5 |
| Pixel size (arcsec) | 4 |
| Gaussian taper (arcsec) | 30 30 |
| Synthesized beam (arcsec) | 35.5 30 |
| Channel width (kHz) | 18.5 |
| Channel width (km s-1) | 3.9 |
| RMS - central region (mJy per beam per channel) | 2.2 |
| RMS - outer edge (mJy per beam per channel) | 7 |
3.1 Data Quality
The 4-beam mosaicked image cubes for each single night of observations, which had a typical RMS noise of 7 mJy per beam per channel near the beam centres, were visually inspected and then combined to decrease the noise of the targeted region, in an attempt to reach the full WALLABY sensitivity level (see Figure 3). Three nights of footprint B observations (7-9 Oct 2016) showed a strong ripple pattern in the beam edge region coinciding with the triplet and were therefore not included in the final mosaic. Overall, 150 hours (footprint A = 76h; rotated footprint A = 19h; footprint B = 55h) of equivalent ASKAP-12 observations were combined to produce the final 12-beam image cube of the NGC 7232/3 triplet and surrounding group members444this final image cube is publicly available on CASDA; https://doi.org/10.25919/5becef4d41dab. The highest sensitivity region of the final cube achieved an RMS noise of 2.2 mJy per beam per channel while the outer edge of the cube was up to three times noisier.
Differences between the measured and predicted RMS in Figure 3 can be attributed to the presence of faint artefacts in the image cubes. Repeat processing with different flagging, calibration, continuum subtraction, and imaging parameters drove a significant portion of ASKAPsoft development; nevertheless, due to the preliminary ASKAP-12 observing techniques as well as the early nature of the ASKAPsoft processing pipeline, some artefacts remain in the final cube. For example, residual RFI signals that were not fully excised from the data produce large scale-striping across certain channels. There are also a handful of spatially compact negative signals that occur in channels with relatively bright Hi emission – possibly due to calibration issues (see Grobler et al. 2014) or that have been introduced during the image combination phase – which require further investigation.
In addition, linmos assumes circular Gaussian beam shapes; however, ASKAP’s electronic beams are currently formed using an algorithm designed to maximise sensitivity rather than constrain beam shape (for further details on PAFs and beam forming, see Hay & O’Sullivan 2008 and Hay & Bird 2016). Holography measurements have shown that the resulting beam patterns have some ellipticity in individual polarisations and are non-Gaussian as a result of coma distortion at the edge of the field of view. The beam shapes also vary slightly from one antenna to another. A quantitative analysis of beam properties and behaviour will be published in future. For this current analysis, we note that errors in the primary beam correction can contribute up to 10 percent uncertainty in source flux estimates and a higher noise level in the multi-footprint combined data (see Serra et al. 2015b, Heywood et al. 2016, McConnell et al. 2016).
The aforementioned artefacts and imaging concerns do not appear to significantly affect the scientific results presented in this paper. As more antennas are commissioned and added to the array, the increased uv-coverage will improve the sensitivity of ASKAP. Furthermore, enhancements to the telescope (e.g. having local ingest nodes to prevent data loss and using an on-dish calibration system to track gain/phase changes) as well as improvements in the observing technique (e.g. using rotated footprints and shape-constrained beams) are progressively improving the data quality with each iteration of Early Science observations.
4 Results
Using our final ASKAP Hi cube of the target region, we detect 17 Hi sources in the immediate vicinity of NGC 7232/3 triplet (i.e. between 1100 - 3300 km s-1) that are likely contained within the NGC 7232 group. Eleven of these detections are identified with stellar counterparts, of which five are newly resolved Hi galaxies. The other six Hi detections are likely tidal debris associated with the triplet.
Source extraction was conducted using an automated application, SoFiA (Serra et al. 2015a). We chose a 5-sigma threshold for source detection with SoFiA and all extracted sources were visually inspected for verification. By choosing a high source finding threshold, most of the processing artefacts are generally rejected by SoFiA; however, not all of the Hi flux is recovered for each source. Alternatively, a lower threshold detects more galaxies and more of their flux but also increases the false detection rate due to the faint artefacts in the ASKAP cube. The number of Hi sources reported here is a conservative value for this field, which will be revisited during the full WALLABY survey with ASKAP-36.
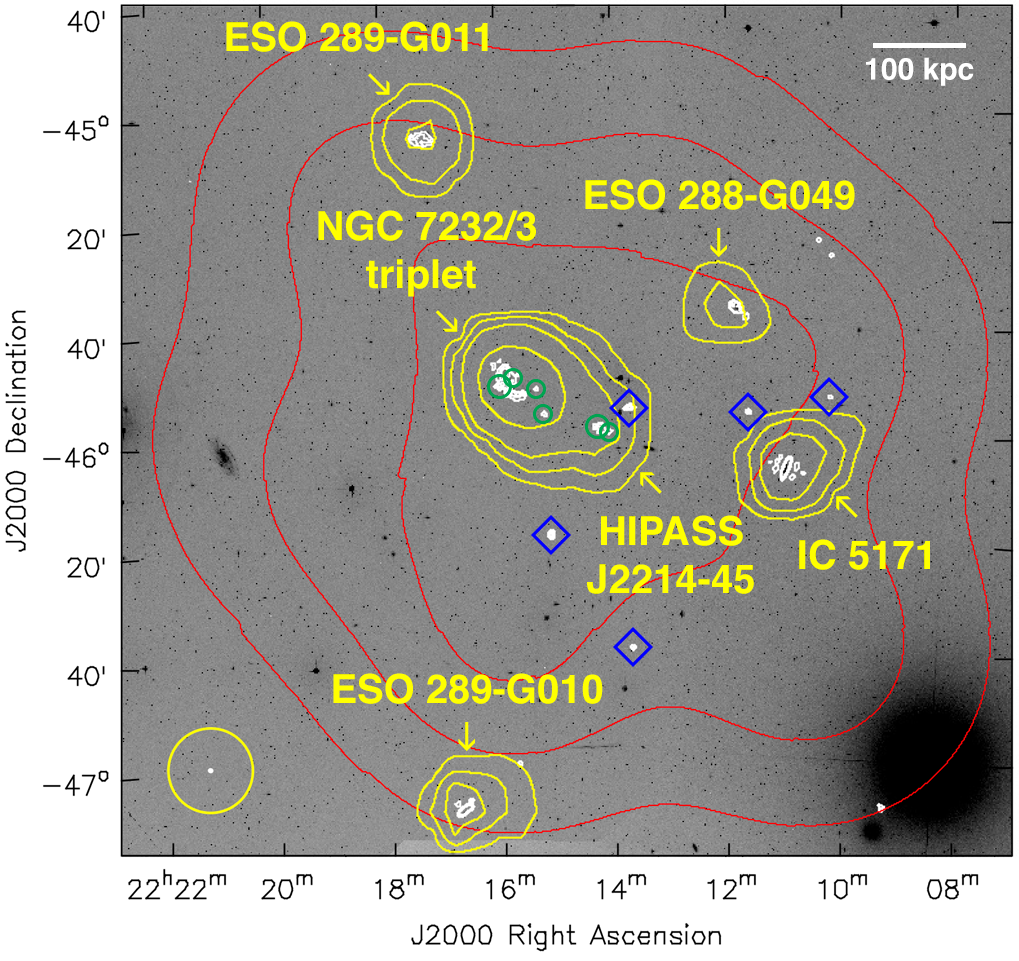
For the purpose of this paper, we consider any SoFiA detections in the ASKAP cube to be authentic Hi sources if they coincide (spatially and spectrally) with previously detected ATCA and/or HIPASS Hi sources or if they appear to have a stellar counterpart. Since we are working with ASKAP Early Science data, we assume any other detections that are identified by SoFiA but do not fit the previously mentioned criteria to be imaging artefacts or residual sidelobe features. Table 4 presents the ASKAP Hi sources and their spatial location, as extracted by SoFiA, crossmatched with HIPASS and ATCA detections as well as likely stellar counterparts, where applicable. All previously known Hi sources that fall within the 12-beam footprint and selected velocity range were detected in the ASKAP cube. We note that Barnes & Webster (2001) focus their ATCA observations on a arcsec region centred on the NGC 7232/3 triplet. As such, we use the wider field HIPASS cube for a more uniform comparison of all Hi sources detected by ASKAP. Figure 4 shows the SoFiA-produced Hi total intensity (moment 0) contours of both the ASKAP and HIPASS data.
The Hi emission from the members directly associated with the interacting triplet system, shown in Figure 5, is complex. In the spectra presented in Figure 6, NGC 7232B is clearly differentiated by its unique velocity range (2120 - 2230 km s-1) in both the ASKAP and HIPASS observations. ASKAP provides sufficient angular resolution to distinguish six Hi clouds – referred to as Hi clouds C1-C6 – from the main body of the triplet (see Figure 7).
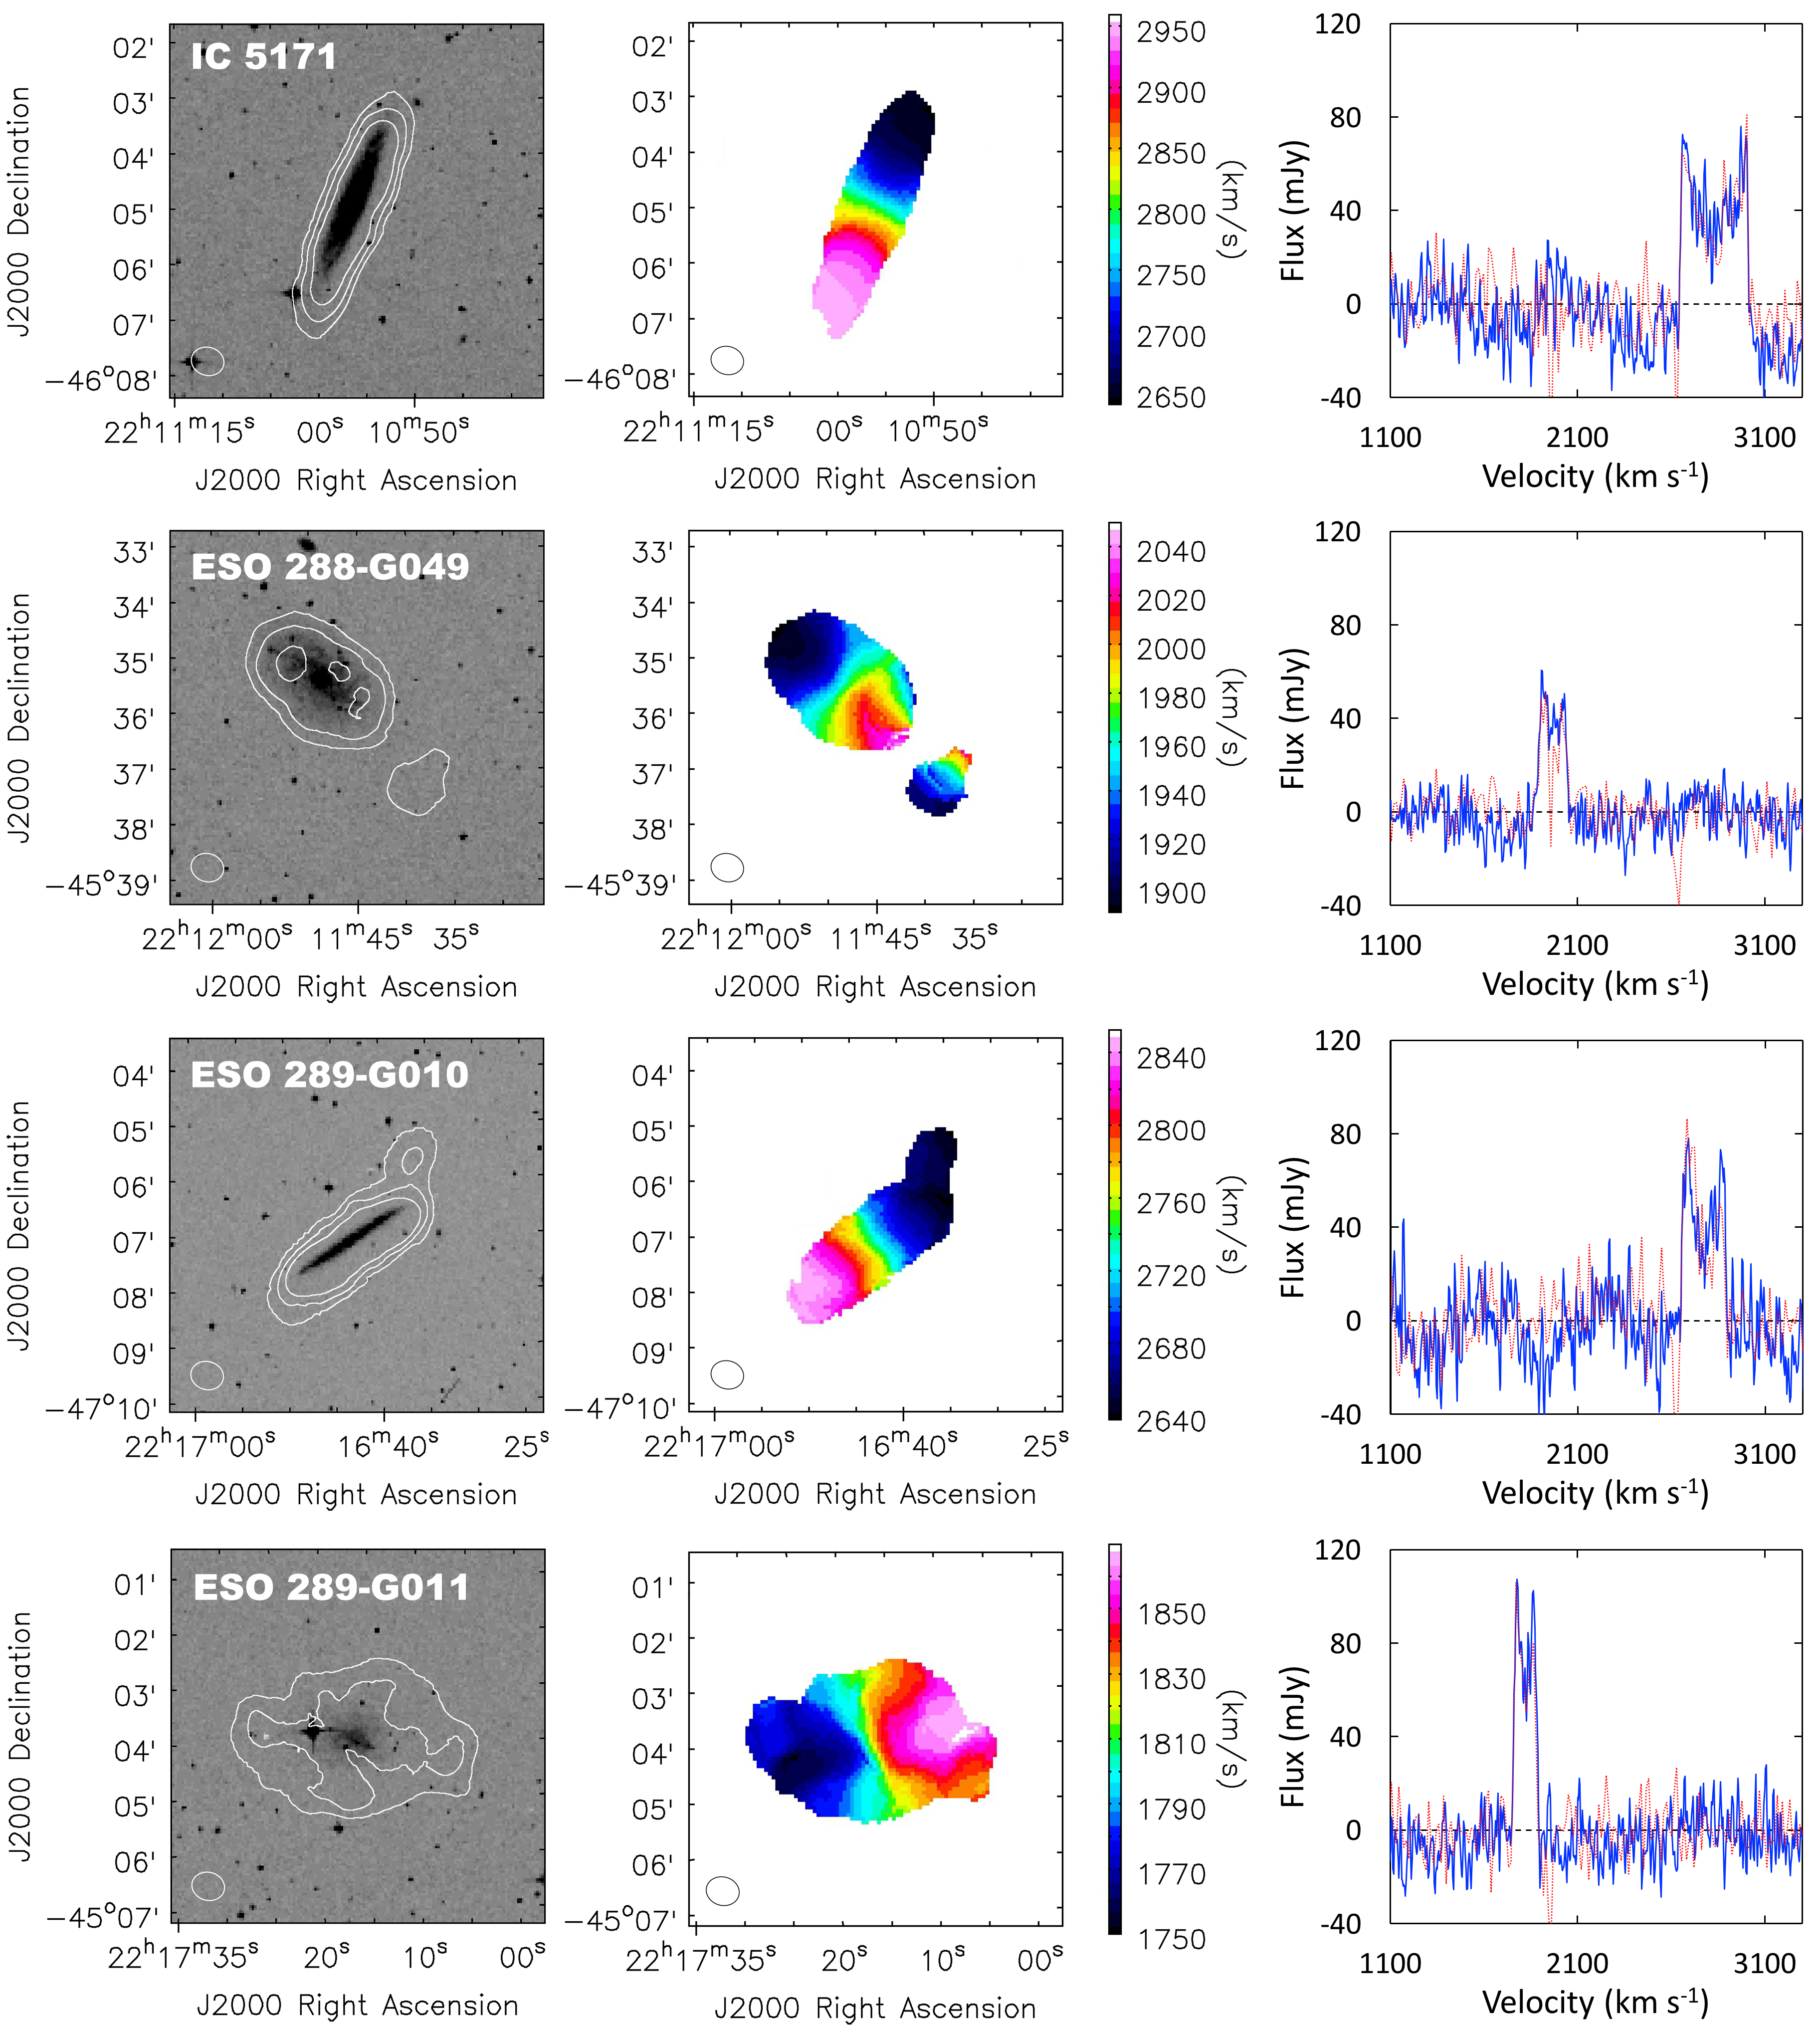
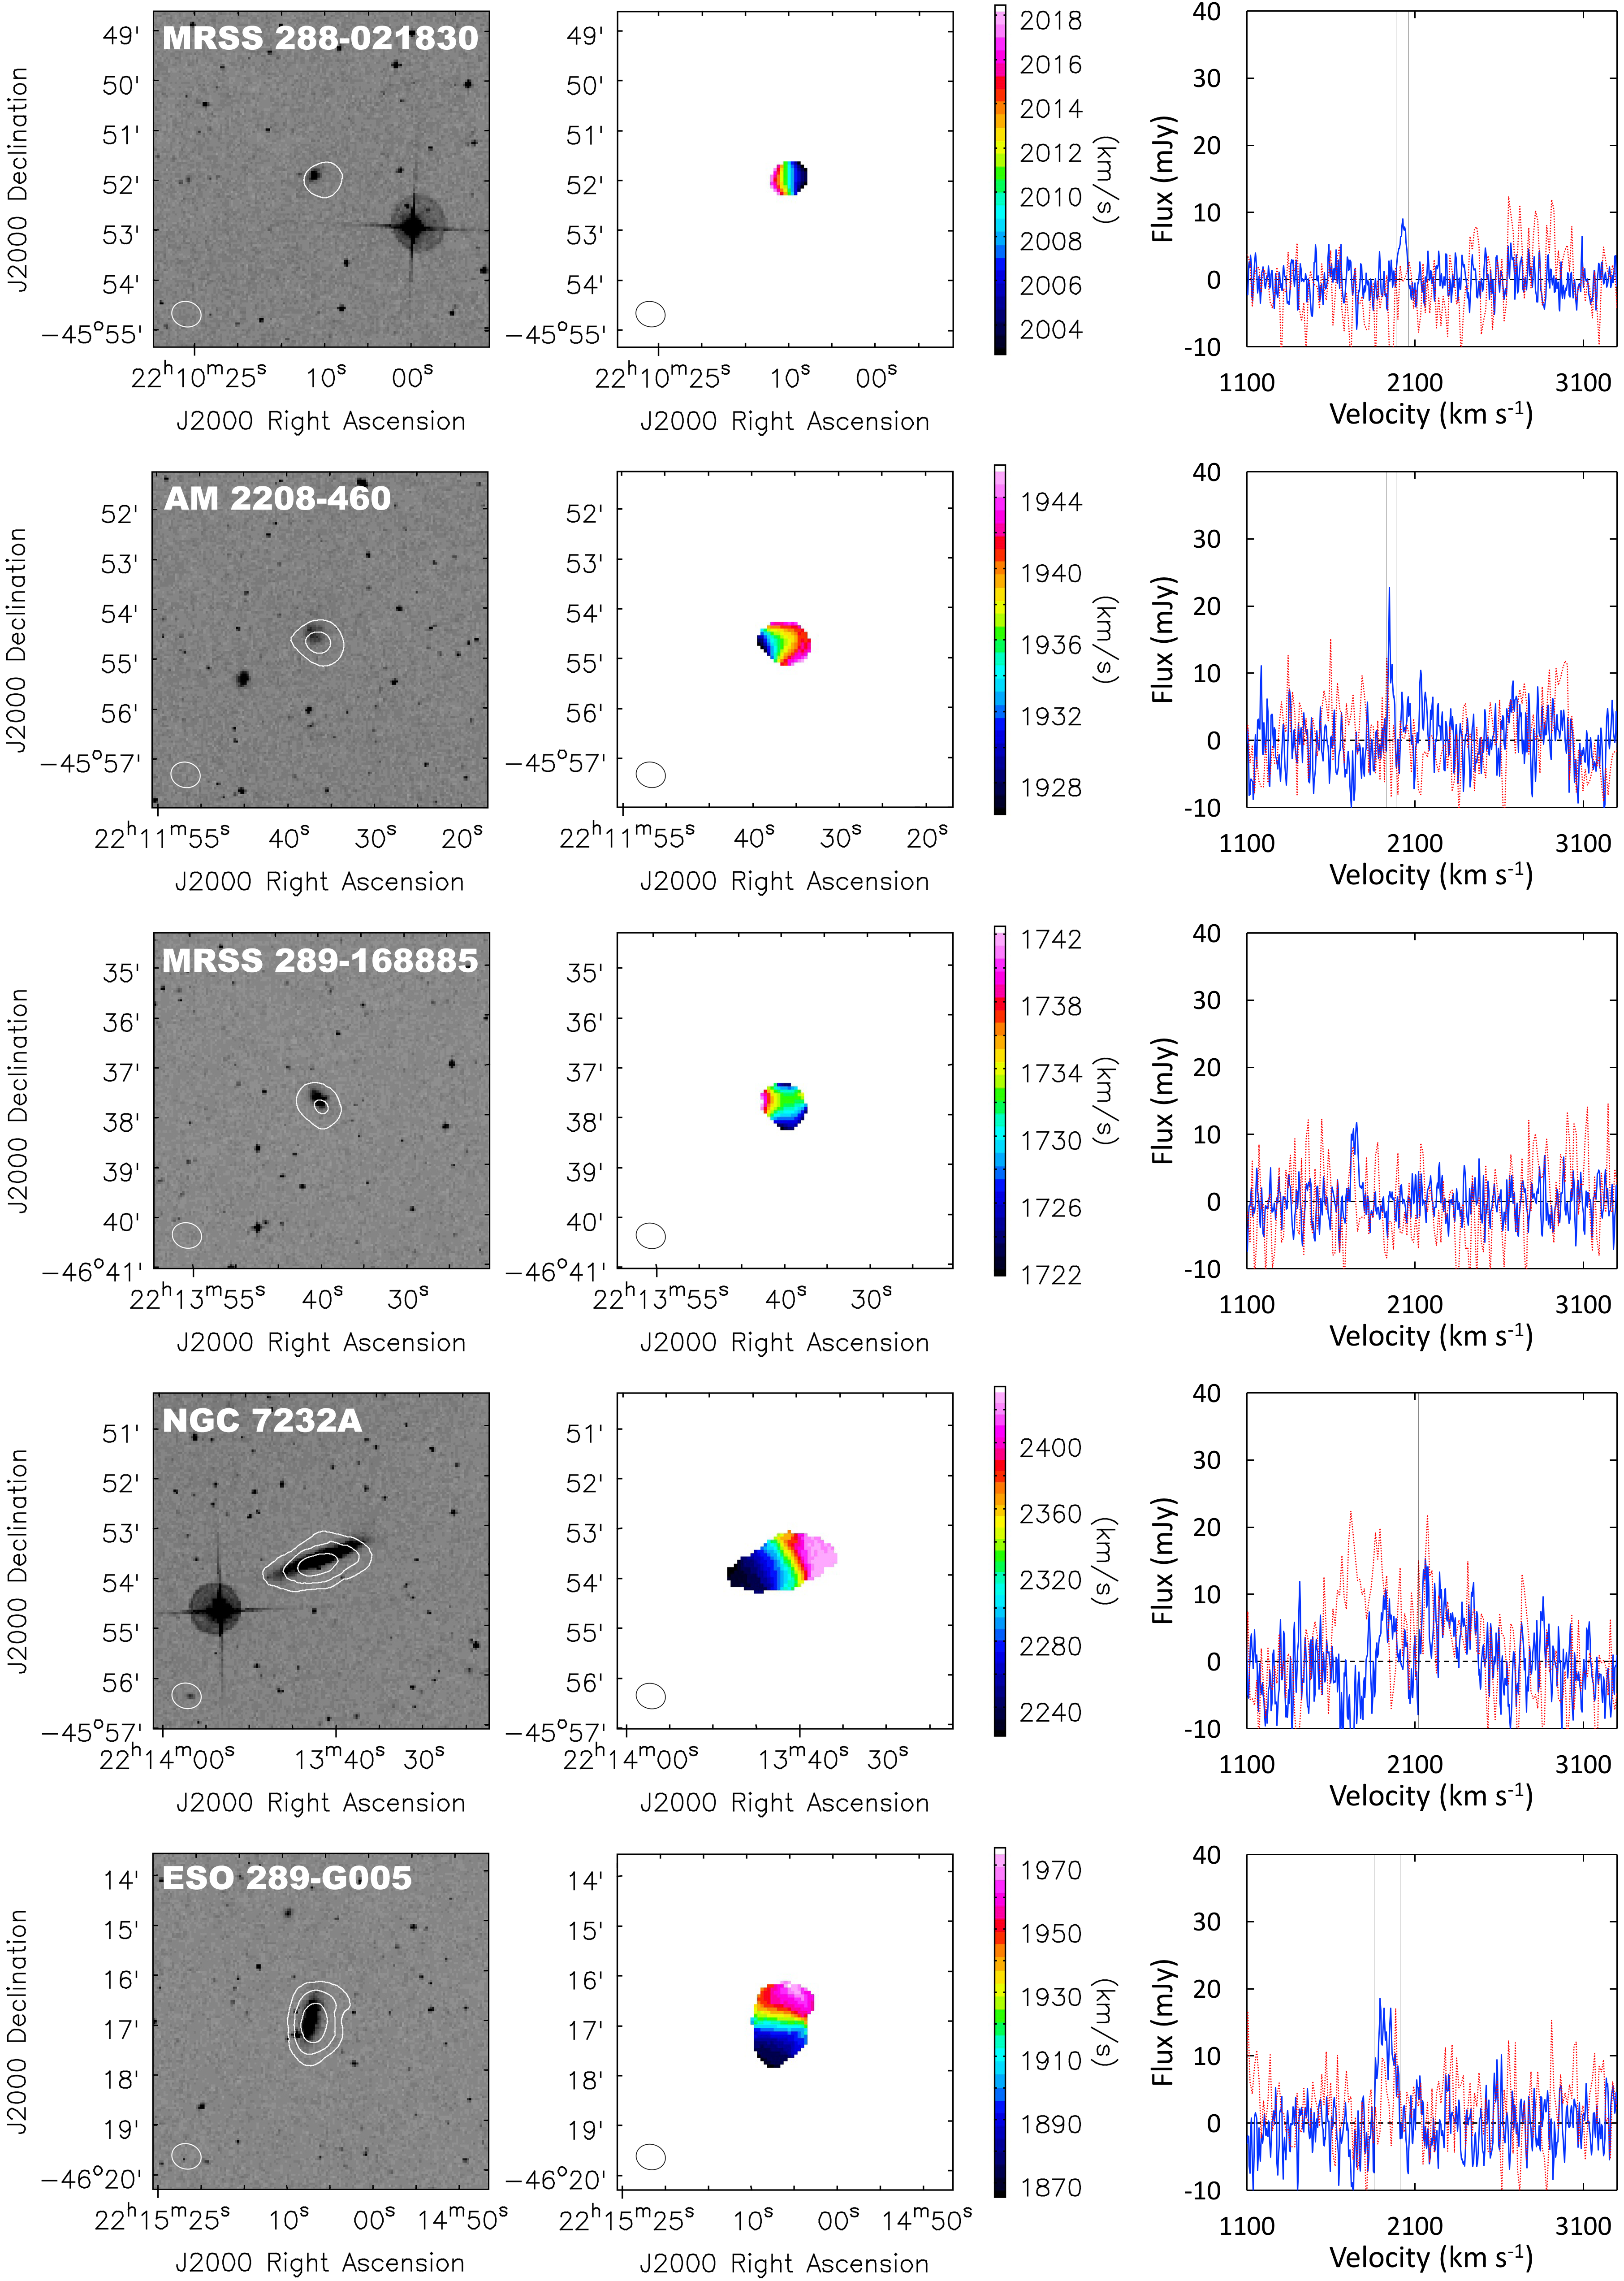
Individual moment maps for Hi sources in the surrounding area can be found in the appendix. Hi galaxies that are also detected in HIPASS and are fairly well resolved in the ASKAP data are shown in Figure A8. Newly detected ASKAP Hi sources that appear to have stellar counterparts (indicated by the blue diamonds in Figure 4) are shown in Figure A9. All Hi velocity (moment 1) maps were generated by applying the SoFiA output mask to the original data cube. Additional masking has been applied for the moment 1 maps of Hi clouds C1-C6 in Figure 7. For each ASKAP detected Hi source, manually defined ellipses on the unmasked cube – using the SoFiA outputs as a guide – were used to create all spectral profiles.
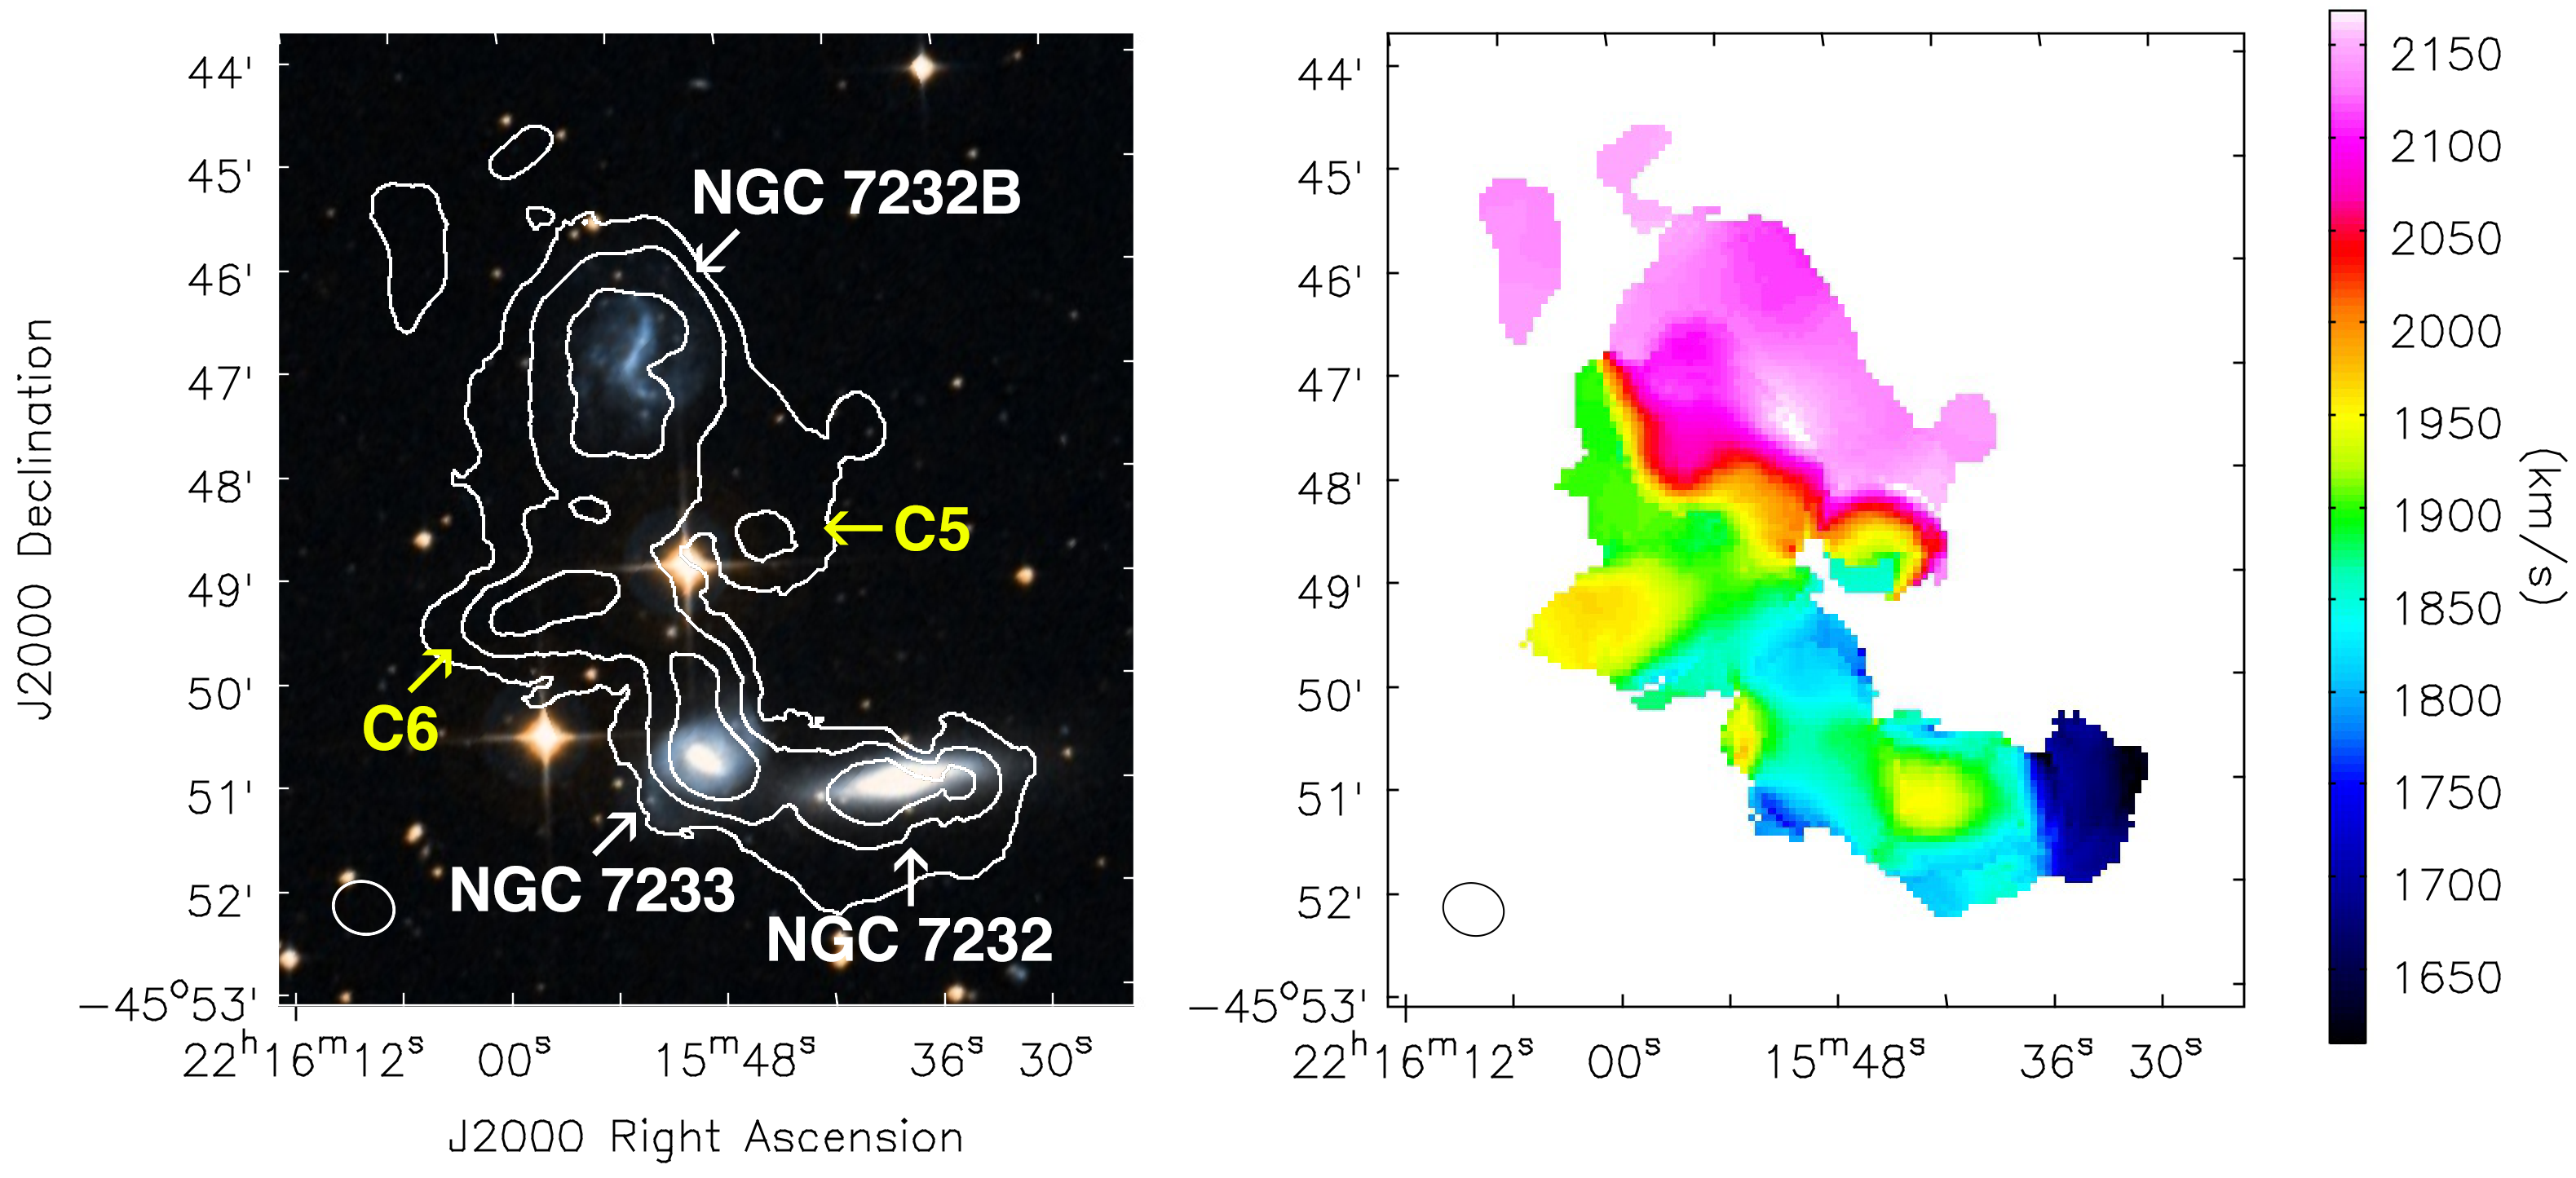
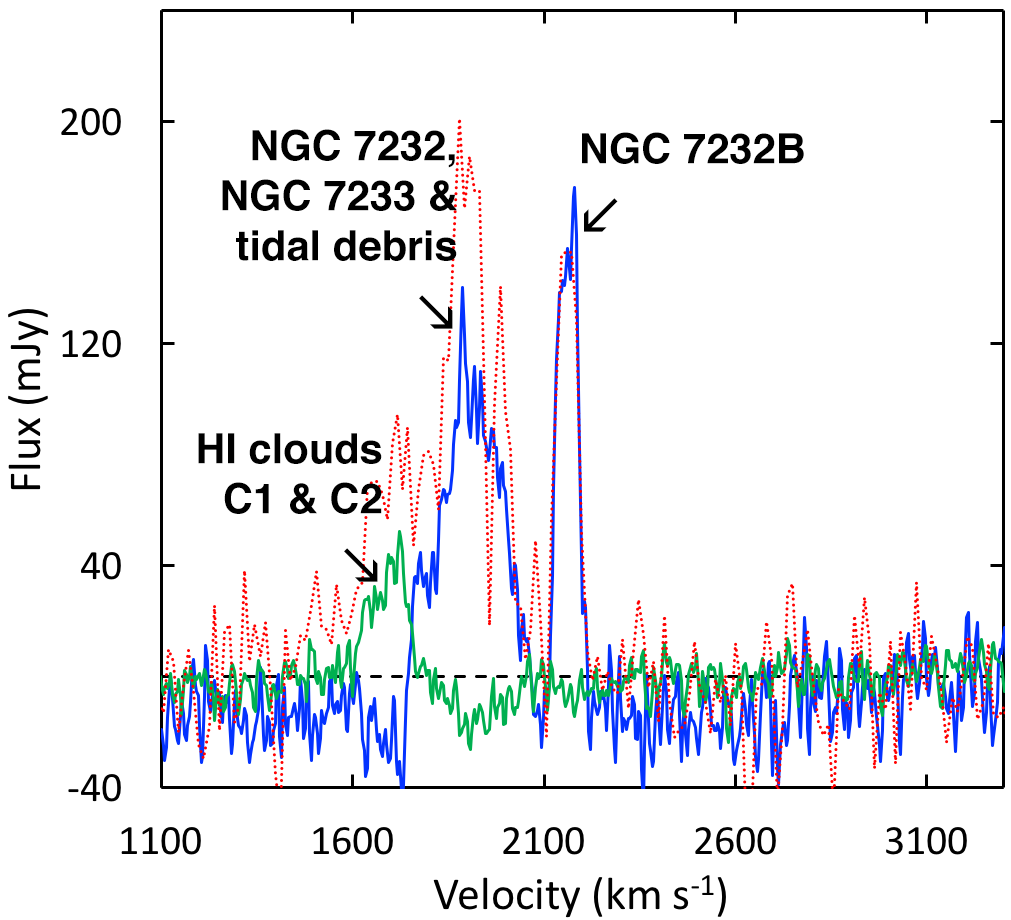
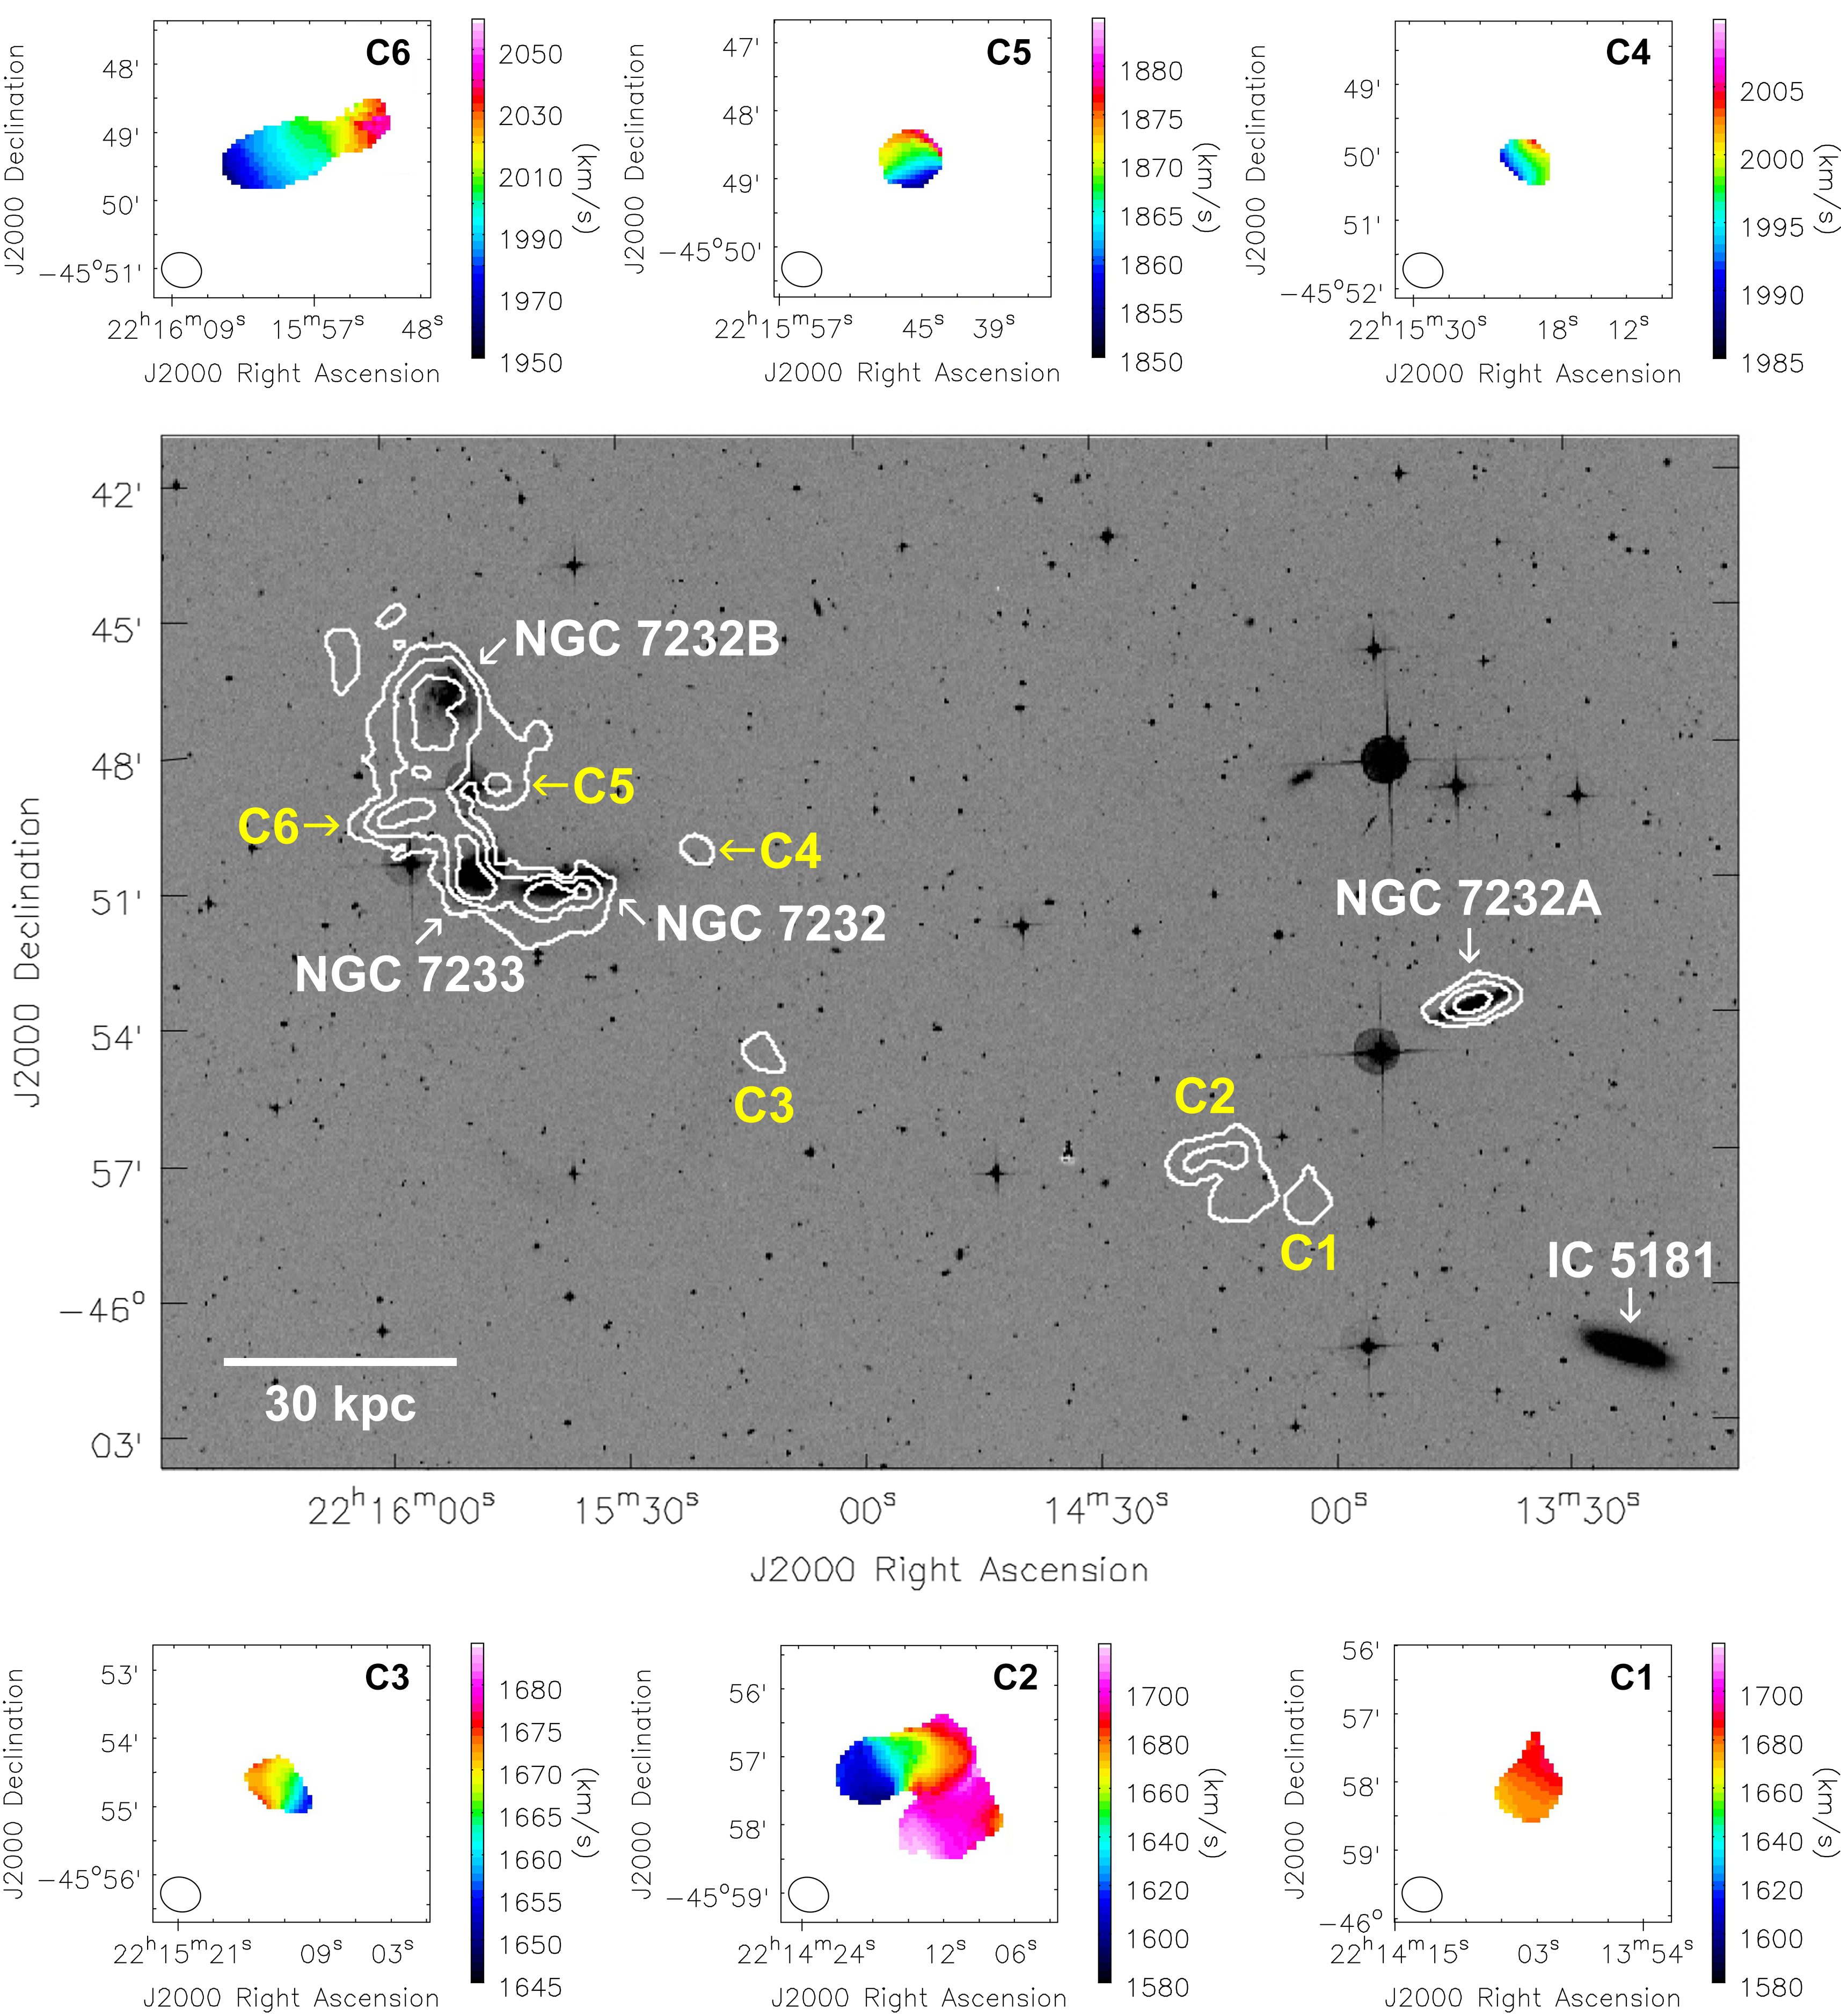
Table 5 summarizes the Hi properties of each source, as measured by SoFiA. The uncertainty in the central velocity (vHI) is
| (2) |
where is the median signal-to-noise ratio of the flux for each source, is half the difference of the velocity width measured at 50 percent (W50) and 20 percent (W20) of the peak flux and = 3.9 km is the spectral resolution of the ASKAP data (see Koribalski et al. 2004 for derivation details). Uncertainties in the line widths are (W50) = 2(vHI) and (W20) = 3(vHI). The 20 percent flux uncertainty takes into account calibration/processing as well as instrumental effects. Even with the 5-sigma detection threshold, the SoFiA computed fluxes are, on average, within 15 percent of the Hi flux manually computed from the spectral profiles of each galaxy. Table 5 also includes the local RMS noise level around each source and the integrated S/N of the detection. A common distance of 24 Mpc is assumed for all group members to compute the Hi masses (MHI).
| Source Name | ASKAP RA, Dec | HIPASS | HIPASS vHI 1 | HIPASS flux1 | ATCA vHI 2 | ATCA flux2 | Stellar counterpart | v |
|---|---|---|---|---|---|---|---|---|
| (J2000) | designation | (km s-1) | (Jy km s-1) | (km s-1) | (Jy km s-1) | (km s-1) | ||
| WALLABY J221010-455159 | 22:10:10.30, -45:51:59.4 | – | – | – | – | – | MRSS 288-021830 | – |
| WALLABY J221056-460500 | 22:10:56.45, -46:05:00.8 | J2210-46 | 2990.9 | 15.8 | – | – | IC 5171 | 2827 26 3 |
| WALLABY J221136-455439 | 22:11:36.26, -45:54:39.6 | – | – | – | – | – | AM 2208-460 | – |
| WALLABY J221148-453525 | 22:11:48.88, -45:35:25.9 | J2211-45 | 1918.2 | 6.6 | – | – | ESO 288-G049 | 1968 4 |
| WALLABY J221339-463746 | 22:13:39.98, -46:37:46.9 | – | – | – | – | – | MRSS 289-168885 | – |
| WALLABY J221341-455343 | 22:13:41.60, -45:53:43.3 | – | – | – | – | – | NGC 7232A (ESO 289-G003) | 2224 55 5 |
| WALLABY J221403-455806 | 22:14:03.51, -45:58:06.9 | – | – | – | – | – | – | – |
| WALLABY J221413-455723 | 22:14:13.86, -45:57:23.1 | J2214-45 | 1864.8 | 11.9 | – | – | – | – |
| WALLABY J221506-461658 | 22:15:06.41, -46:16:58.4 | – | – | – | – | – | ESO 289-G005 | 1885 55 5 |
| WALLABY J221512-455442 | 22:15:12.23, -45:54:42.5 | – | – | – | – | – | – | – |
| WALLABY J221520-455009 | 22:15:20.28, -45:50:09.6 | – | – | – | – | – | – | – |
| WALLABY J221545-454843 | 22:15:45.79, -45:48:43.3 | – | – | – | – | – | – | – |
| WALLABY J221547-455007 | 22:15:47.67, -45:50:07.0 | J2215-45a | 1904.9 | 24.6 | 1735† | 3.5† | NGC 7232 and NGC 7233 | 1887 25 3, 1862 26 3 |
| WALLABY J221551-454702 | 22:15:51.58, -45:47:02.7 | J2215-45b | 2158.9 | 9.5 | 2160 | 7.2 | NGC 7232B (ESO 289-G009) | 2152 45 5 |
| WALLABY J221556-454903 | 22:15:56.97, -45:49:03.9 | – | – | – | – | – | – | – |
| WALLABY J221642-470708 | 22:16:42.68, -47:07:08.5 | J2216-47 | 2681.7 | 12.2 | – | – | ESO 289-G010 | 2785 4 |
| WALLABY J221716-450359 | 22:17:16.45, -45:03:59.4 | J2217-45a | 1784.7 | 10.5 | – | – | ESO 289-G011 | 1822 20 3 |
| Source name | ASKAP vHI | ASKAP W50 | ASKAP W20 | ASKAP flux | Local RMS | Integrated | ASKAP MHI | Comments |
|---|---|---|---|---|---|---|---|---|
| (km s-1) | (km s-1) | (km s-1) | (Jy km s-1) | (mJy beam-1) | S/N | ( M⊙) | ||
| WALLABY J221010-455159 | 2026 3 | 44 6 | 50 9 | 0.3 0.1 | 2.2 | 6 | 0.5 0.1 | MRSS 288-021830, first Hi detection |
| WALLABY J221056-460500 | 2831 3 | 365 6 | 380 10 | 11 2 | 2.5 | 49 | 14 3 | IC 5171 |
| WALLABY J221136-455439 | 1953 6 | 30 10 | 40 20 | 0.6 0.1 | 2.2 | 10 | 0.8 0.2 | AM 2208-460 , first Hi detection |
| WALLABY J221148-453525 | 1964 2 | 155 4 | 168 7 | 6 1 | 2.4 | 38 | 8 2 | ESO 288-G049 |
| WALLABY J221339-463746 | 1741 3 | 46 5 | 50 8 | 0.5 0.1 | 2.5 | 7 | 0.6 0.1 | MRSS 289-168885, first Hi detection |
| WALLABY J221341-455343 | 2348 5 | 220 10 | 230 10 | 2.0 0.4 | 2.3 | 15 | 2.7 0.5 | NGC 7232A, first Hi detection |
| WALLABY J221403-455806 | 1692 6 | 40 10 | 60 20 | 0.7 0.1 | 2.4 | 7 | 1.0 0.2 | Hi cloud C1 |
| WALLABY J221413-455723 | 1678 5 | 117 9 | 150 10 | 2.4 0.5 | 2.4 | 15 | 3.3 0.7 | Hi cloud C2 |
| WALLABY J221506-461658 | 1931 7 | 130 10 | 150 20 | 2.1 0.4 | 2.4 | 18 | 2.9 0.6 | ESO 289-G005, first Hi detection |
| WALLABY J221512-455442 | 1668 5 | 30 10 | 50 20 | 0.4 0.1 | 2.4 | 6 | 0.6 0.1 | Hi cloud C3 |
| WALLABY J221520-455009 | 1999 5 | 30 10 | 40 20 | 0.3 0.1 | 2.3 | 5 | 0.4 0.1 | Hi cloud C4 |
| WALLABY J221545-454843 | 1874 6 | 30 10 | 60 20 | 0.5 0.1 | 2.2 | 6 | 0.7 0.1 | Hi cloud C5 |
| WALLABY J221547-455007 | 1863 4 | 152 7 | 260 10 | 12 2 | 2.3 | 33 | 17 3 | NGC 7232 and NGC 7233 |
| WALLABY J221551-454702 | 2159 1 | 64 2 | 81 3 | 7 1 | 2.3 | 38 | 9 2 | NGC 7232B |
| WALLABY J221556-454903 | 2002 7 | 40 10 | 110 20 | 2.1 0.4 | 2.4 | 15 | 2.8 0.6 | Hi cloud C6 |
| WALLABY J221642-470708 | 2768 4 | 230 8 | 240 10 | 12 2 | 4.8 | 32 | 16 3 | ESO 289-G010 |
| WALLABY J221716-450359 | 1821 1 | 113 2 | 121 3 | 8 2 | 3.4 | 30 | 10 2 | ESO 289-G011 |
4.1 Stellar properties of the NGC 7232/3 triplet
To further explore and possibly disentangle some of the complexity of the triplet system, we used ancillary data to estimate the stellar properties of the three major optical galaxies, NGC 7232, NGC 7232B and NGC 7233. We measured the - and -band fluxes using SkyMapper images (Wolf et al., 2018). These fluxes were then used estimate stellar masses (M∗) by applying the relation from Bell et al. (2003). We measured the far-ultraviolet (FUV) flux from GALEX (Martin et al., 2005) and W4 (22 m) flux from WISE (Wright et al., 2010) to estimate the star formation rate (SFR) following the method described in Wang et al. (2017). SFR indicates the dust-attenuated SFR and SFR is the unattenuated portion. As such, the sum of these two values provides the total SFR (Wang et al., 2017). All stellar flux measurements were obtained using Petrosian apertures and with neighbouring galaxies masked out of the images. The -band image was used as the reference for setting the apertures on the SkyMapper images. For GALEX and WISE, the band which produced the largest Petrosian ellipse determined the final aperture used for each galaxy. The stellar properties for the galaxies within the triplet are presented in Table 6.
| Source name | -band | -band | M | FUV | SFR | W4 | SFR | SFR |
|---|---|---|---|---|---|---|---|---|
| magnitude1 | magnitude1 | M⊙ | magnitude2 | M⊙ yr-1 | magnitude3 | M⊙ yr-1 | M⊙ yr-1 | |
| NGC 7232 | 11.99 0.03 | 12.65 0.03 | 120 | 16.93 0.06 | 0.04 | 6.24 0.03 | 0.05 | 0.09 |
| NGC 7232B | 12.65 0.03 | 13.24 0.03 | 55 | 15.73 0.05 | 0.12 | 2.70 0.01 | 1.3 | 1.4 |
| NGC 7233 | 15.7 0.2 | 15.9 0.1 | 1.0 | 14.67 0.05 | 0.3 | 9.1 0.2 | 0.004 | 0.3 |
5 Analysis and discussion
The capabilities of ASKAP, during its Early Science phase, have enabled us to detect and/or resolve the Hi emission of several galaxies. Within the central 12-beam footprint targeting the NGC 7232 group, there are 17 Hi sources. Many of these sources appear to be star-forming galaxies with clear optical counterparts and are further detailed in the appendix. This section will discussion the individual sources within the NGC 7232/3 triplet and its neighbouring Hi clouds.
Due to the proximity of NGC 7232, NGC 7232B and NGC 7233 as well as the common Hi envelope detected by HIPASS (see Figure 4), it appears that these galaxies are actively interacting (Barnes & Webster 2001, Koribalski et al. 2004). The Hi corresponding to the optical galaxies within the triplet is noticeably disturbed. There appears to be an Hi bridge connecting all three galaxies (Figure 5) as well as six tidally formed Hi clouds in the neighbouring area (Figure 7). One of these clouds, Hi cloud C6, was originally detected as an Hi plume by Barnes & Webster (2001) in their ATCA observations and has sufficient mass (i.e. M M⊙) to become a self-gravitating TDG (Lelli et al. 2015, Lee-Waddell et al. 2016). The other clouds are likely more transient tidal features that will fade into the lower column density Hi envelope or fall into one of the larger galaxies (see Bournaud & Duc 2006).
Adding together the HIPASS values for the NGC 7232/3 triplet and neighbouring gas cloud HIPASS J2214-45 (reported by Meyer et al. (2004); see Table 4), the total Hi flux for this region is 46 Jy km s-1; however, HIPASS J2214-45 is likely a confused source that includes some Hi emission also attributed to the NGC 7232 and NGC 7233 pair (i.e. HIPASS J2214-45a). Koribalski et al. (2004), cataloguing the 1000 brightest sources in HIPASS, report an Hi flux of 34.6 4.1 Jy km s-1 for this same region (identified as the AM2212-460 group). From the ASKAP data, we measure a total Hi flux of 26 3 Jy km s-1 for the triplet and surrounding Hi clouds. Looking at the spectra in Figure 6, ASKAP appears to recover at least 70 percent of the Hi flux in the spatial and spectral vicinity of the NGC 7232/3 triplet, which is in agreement with the HIPASS value reported by Koribalski et al. (2004).
The 25 percent flux difference between ASKAP and HIPASS can be attributed to the column density sensitivity limit of the ASKAP data as well as the high source detection threshold chosen for SoFiA. Another minor factor with be the slight negative offset in the current ASKAP spectra (see Figure 6) due to over-subtraction of the continuum near bright Hi sources. Since the galaxies within this region are interacting, it is also likely that a portion of the diffuse gas is resolved out by the interferometer.
NGC 7232 and NGC 7233
The Hi components of NGC 7232 and NGC 7233 are thoroughly blended together and span a broad velocity range (see Figures 5 and 6 ). There does appear to be higher density clumps of Hi coinciding with the stellar disks of the two galaxies; nevertheless, much of the Hi from these galaxies appears to be distributed throughout the spatial region of the triplet system. Discrepancies between source detection and separation has resulted in the inconsistencies of the Hi properties, reported in Tables 4 and 5, from each set of observations on NGC 7232 and NGC 7233.
The wider variety of array baseline lengths and longer integration time of the ASKAP observations enable greater sensitivity to extended emission than the ATCA observations by Barnes & Webster (2001). Although the ATCA observations detect NGC 7233 (see the ATCA Hi moment 0 map in figure 8 of Barnes & Webster 2001), it was determine by those authors that the source is unresolved and no further Hi measurements were reported. Comparing the Hi moment maps, ASKAP does appear to recover more Hi emission that ATCA; however, about half of the Hi flux that was catalogued by HIPASS has not been recovered by ASKAP. Subtracting the ASKAP detections from the HIPASS cube indicates that there is diffuse gas in the area between the NGC 7232/3 triplet and a neighbouring galaxy, IC 5181, suggesting that there is an Hi tail/bridge in this region. Note, no Hi counterpart has been detected across the stellar extent of IC 5181(which is a lenticular galaxy located at RA = 22:13:22, Dec = -46:01:03, v km s-1; Jones et al. 2009).
The stellar component of NGC 7232 is ten times more massive than that of NGC 7233 (Table 6). Although we are unable to distinguish the Hi originating from each galaxy, since they are located within the same group environment, one can assume that NGC 7232 would have started with more Hi than NGC 7233 (see Denes, Kilborn & Koribalski 2014 for more details on mass scaling relations). Currently, the Hi peaks coinciding with the optical centres of the two galaxies are quite comparable in size and column density, suggesting that most of the Hi originating from NGC 7232 is now spread throughout triplet system, which may explain this galaxy’s low SFR.
NGC 7232B
The Hi associated with NGC 7232B, a face-on spiral, is centred at v km s-1 and is kinematically distinct from NGC 7232 and NGC 7233, which span a Hi velocity range of v1600 - 2100 km s-1 (see Figure 6). The gas in the outer region of NGC 7232B shows significant signs of spatial distortion. In the moment maps of this galaxy (Figure 5), there appears to be a southwest extension towards Hi cloud C5 and a clump of gas east of the central region of the galaxy. ASKAP recovers the same amount of Hi flux as ATCA and over 70 percent of the emission detected by HIPASS for this galaxy. This result suggests that most of the gas associated with NGC 7232B is not too diffusely spread out and easily recovered by the two interferometers.
NGC 7232B is actively star forming, especially compared to the other two galaxies in the system. The Hi mass fraction (MHI/M∗) for NGC 7232B (Tables 5 and 6) is comparable to other gaseous galaxies of similar mass in the local universe (Wang et al., 2017). This result indicates that the Hi associated with NGC 7232B remains primarily with this galaxy and has yet to be significantly affected (i.e. tidally stripped) by the ongoing interaction event within the triplet system.
Hi clouds C1 and C2
Interactions between gas-rich galaxies can produce tidal tails several 100 kpc in length (e.g. Leisman et al. 2016, Oosterloo et al. 2018) and within these tails, high density clumps of Hi are formed. Under the right circumstances, these Hi clumps can accrete sufficient amounts of material to eventually become self-gravitating TDGs (Mirabel, Dottori, Lutz 1992, Lelli et al. 2015, Lee-Waddell et al. 2016). Hi clouds C1 and C2 are located in the densest region of HIPASS J2214-45, the latter being a confused HIPASS source with NGC 7232 and NGC 7233. The high-resolution ASKAP observations recover 30 percent of the Hi attributed to HIPASS J2214-45. The remaining portion of the Hi gas is likely fairly diffuse and resides in the aforementioned tidal bridge connecting the NGC 7232/3 triplet with other group members.
Hi cloud C1 has a relatively low Hi mass and is more likely to be a transient tidal feature as it just reaches the M⊙ mass threshold for long term survivability (Bournaud & Duc, 2006); whereas, Hi cloud C2 has an Hi mass of M⊙. In the moment 1 map of Figure 7, the northeast portion of Hi cloud C2 appears to have a smooth velocity gradient. If this portion of the cloud is rotating, then its estimated total dynamical mass would be on the order of M M⊙ (see equation 2 in Lee-Waddell et al. 2016). However, the lack of a clear stellar counterpart combined with this potentially large dynamical mass measurement implies that the velocity gradient across the northeast portion of Hi cloud C2 is not due to self-gravitation induced rotation. Rather, it may be the result of shearing effects from the interaction process between the larger group members. This mass discrepancy between the baryonic (i.e. gas and stellar) mass and total mass does not take into account the ionized gas component, which can be up to three times the mass of the Hi gas in tidal features (see Fox et al. 2014). Nevertheless, the irregular morphology of the southwest portion of Hi cloud C2 also opposes the rotation scenario. With the current data, we are unable to assess the longevity of Hi cloud C2.
It appears that IC 5181 – located 150 kpc in projection from the NGC 7232/3 triplet, at the distance of the group – forms a line with Hi clouds C1 and C2 and the triplet (see Figure 7). Previous optical observations of IC 5181 by Pizzella et al. (2013) suggest that the ionized gas component along the polar regions of this galaxy have an external origin. These Hi clouds could be remnants of the accretion / merging event that deposited ionized gas onto the undisturbed stellar disk of IC 5181 (Pizzella et al., 2013), or tidal debris from the NGC 7232/3 interaction – if the events are separate.
Hi clouds C3 and C4
Hi clouds C3 and C4 are likely high density peaks associated with the tidal bridge. Although these clouds are low in Hi mass and likely to be short-lived (Bournaud & Duc, 2006), they show velocity gradients that are a testament to the high spatial and spectral capabilities of ASKAP. Looking closely at the ASKAP data, there appears to be a tentative detection of very faint Hi emission connecting Hi cloud C3 to the triplet. However, given that much of the gas in the vicinity of Hi clouds C3 and C4 is diffusely distributed and/or below our detection threshold, it is difficult to discern the exact origin and significance of these tidal debris sources.
Hi cloud C5
Hi cloud C5 spatially coincides with the southwest extension from NGC 7232B; however, the former has a lower velocity range that is similar to the Hi emission associated with NGC 7232 and NGC 7233. Within the image cube Hi cloud C5 emerges as a distinct object, brightest between 1870 - 1890 km s-1, alongside the other Hi clouds associated with the major members of the triplet. Based on its location, Hi cloud C5 could be part of a gaseous tidal bridge that is forming between NGC 7232B and the other two spirals in the triplet.
Hi cloud C6
Hi cloud C6 is quite bright and fairly compact with its peak flux at 1990 km s-1. Currently, it appears to be spatially and spectrally embedded in the gas of its parent galaxies but this source has enough mass to become self-gravitating (Bournaud & Duc, 2006). The smooth velocity gradient in Figure 7 suggests rotation, but could be the result of shearing as Hi cloud C6 is moving away from the triplet system. Assuming the former scenario and that Hi cloud C6 is in dynamical equilibrium, then estimated total dynamical mass for this object would be on the order of M M⊙. This dynamical mass value is comparable to MHI, which makes rotation a plausible explanation and would indicate that Hi cloud C6 could be the progenitor of a dark matter poor TDG (see Lelli et al. 2015, Lee-Waddell et al. 2016).
Although the triplet system is complex – and further complicated by projection effects – it is interesting that Hi clouds C5 and C6 are aligned almost perpendicular to a line connecting NGC 7232B and NGC 7233 (Figure 5). It is possible that these clouds indicate two tails that are currently forming from the interaction between the two face-on spirals in the triplet (Toomre & Toomre 1972, Bournaud & Duc 2006).
With its high column density ( atoms cm-2 in the central region), Hi cloud C6 has a sufficient Hi gas density for star formation (see Schaye 2004 for details about star formation thresholds). There appears to be no stellar over-densities associated with this cloud; nevertheless, the archival DSS2 images are likely too shallow to detect the low-surface brightness counterparts that are associated with some tidally-formed Hi features (e.g. Lee-Waddell et al. 2014, Janowiecki et al. 2015, Madrid et al. 2018). Deeper optical imaging could possibly detect faint stellar components related to initial star formation; however, two bright (B-band magnitude 10) foreground stars HD 211111 (at RA = 22:15:50, Dec = -45:48:56) and HD 211121 (at RA = 22:15:58, Dec = -45:50:35) could hinder follow-up observations.
6 Conclusion
The ASKAP Early Science dataset presented in this paper verifies that the array and its associated processing pipeline ASKAPsoft – both in moderately preliminary states – are successfully producing scientifically useful data. Overall, within the 12-beam image cube centred on the NGC 7232 group, we detect 17 Hi sources. Six of these detections are well-known Hi-rich galaxies including one fully interacting pair. Five of these detection are newly resolved Hi galaxies with identifiable stellar counterparts. The remaining six Hi detections are likely tidal debris associated with the NGC 7232/3 triplet.
The triplet is a complex system. The Hi components of NGC 7232 and NGC 7233 appear to be fully intertwined. NGC 7232B still retains most of its gas but shows evidence that it is beginning to interact with the other two galaxies. Hi clouds C5 and C6 are likely tidal clumps that have been produced by the triplet system and possibly indicate the projected spatial location of two tidally-formed tails of Hi. If Hi cloud C6 is moving away from its parent galaxies, it has sufficient mass to eventually decouple from the tidal tail and possibly develop into a long-lived TDG.
Hi clouds C1-C4 might have been produced by the triplet system, or these clouds could indicate an earlier interaction event involving another group member, such as IC 5181. A portion of the Hi within this region, which was originally identified as belonging to HIPASS J2214-45 is likely diffusely distributed and lies below the detection threshold of our current ASKAP observations. Accordingly, it is difficult to ascertain the origins of the Hi bridge that appears to be connecting NGC 7232/3 and IC 5181. Future work would include adding short-spacing / single-dish observations to the ASKAP data in order to recover more of the diffuse gas in and around the tidal features, in order to further understand the interaction processes that are taking place.
The high-resolution capabilities of ASKAP produced moderately well-resolved moment maps of four galaxies (i.e. IC 5171, ESO 288-G049, ESO 298-G010 and ESO 289-G011) that can be used for further kinematic analysis. The newly detected Hi counterparts of five stellar galaxies indicate their membership to the group. These nine galaxies provide a more complete picture of the group environment surrounding the NGC 7232/3 triplet.
There are many areas where the data quality and processing procedure can be greatly improved for ASKAP. The addition of more antennas – to provide more complete sky coverage and achieve higher sensitivity with less integration time – along with the use of the on-dish calibration system and an overall improved observing method will show vast improvements to the data quality. With expanded computing systems and a more robust ASKAPsoft pipeline, larger datasets can be processed more efficiently. The observations and results presented in this paper serve as one of the first steps for a long and fruitful journey of ASKAP Hi science.
Acknowledgements
We thank the reviewer for his/her thoroughly detailed comments and suggestions to improve the clarity of this paper. The Australian SKA Pathfinder is part of the Australia Telescope National Facility which is managed by CSIRO. Operation of ASKAP is funded by the Australian Government with support from the National Collaborative Research Infrastructure Strategy. This work was supported by resources provided by the Pawsey Supercomputing Centre with funding from the Australian Government and the Government of Western Australia, including computational resources provided by the Australian Government under the National Computational Merit Allocation Scheme (project JA3). Establishment of ASKAP, the Murchison Radio-astronomy Observatory and the Pawsey Supercomputing Centre are initiatives of the Australian Government, with support from the Government of Western Australia and the Science and Industry Endowment Fund. We acknowledge the Wajarri Yamatji as the traditional owners of the Observatory site. Parts of this research were conducted by the Australian Research Council Centre of Excellence for All-sky Astrophysics (CAASTRO), through project number CE110001020 as well as by the Australian Research Council Centre of Excellence for All Sky Astrophysics in 3 Dimensions (ASTRO 3D) through project number CE170100013. P.S. acknowledges funding from the European Research Council (ERC) under the European Union’s Horizon 2020 research and innovation programme (grant agreement no. 679627; project name FORNAX).
References
- Allison et al. (2015) Allison J., et al. 2015, MNRAS, 453, 1249
- Barnes et al. (2001) Barnes D.G., et al. 2001, MNRAS, 322, 486
- Barnes & Webster (2001) Barnes D.G., Webster R.L., 2001, MNRAS, 324, 858
- Bell et al. (2003) Bell E.F., McIntosh D.H., Katz N., Weinberg M.D., 2003, ApJS, 149, 289
- Bhandari et al. (2018) Bhandari S., et al. 2018, MNRAS, 478, 1784
- Bournaud & Duc (2006) Bournaud F., Duc P.-A., 2006, A&A, 456, 481
- da Costa et al. (1991) da Costa L.N., Pellegrini P.S., Davis M., Meiksin A., Sargent W.L.W., Tonry J.L., 1991, ApJS, 75, 935
- DeBoer et al. (2009) DeBoer D., et al., 2009, IEEEP, 97, 1507
- Denes, Kilborn & Koribalski (2014) Denes H., Kilborn V.A., Koribalski B.S., 2014, MNRAS, 444, 667
- Duc et al. (2014) Duc P.-A., Paudel S., McDermid R. M., Cuillandre J.-C., Serra P., Bournaud F., Cappellari M., Emsellem, E., 2014, MNRAS, 440, 1458
- Duffy et al. (2012) Duffy A.R.. Meyer M., Staveley-Smith L., Bernyk M., Croton D.J., Koribalski B.S., Gerstmann D., Westerlund S., 2012, MNRAS., 426., 3385
- English et al. (2010) English J., Koribalski B., Bland-Hawthorn J., Freeman K.C., McCain C.F., 2010, AJ, 139, 102
- Fox et al. (2014) Fox A.J., et al., 2014, ApJ, 787, 147
- Garcia (1995) Garcia A.M., 1995, A&A, 297, 56
- Garcia et al. (1993) Garcia A.M., Paturel G., Bottinelli, L., Gouguenheim L., 1993, A&AS, 98, 7
- Giovanelli et al. (2005) Giovanelli R., et al., 2005, AJ, 130, 2598
- Grobler et al. (2014) Grobler T.L., Nunhokee C.D., Smirnov O.M., van Zyl A.J., de Bruyn A.G., 2014, MNRAS, 439, 4030
- Hay & O’Sullivan (2008) Hay S.G., O’Sullivan J.D., 2008, RaSc, 43, 6S04
- Hay & Bird (2016) Hay S.G., Bird T.S., 2016, Applications of Phased Array Feeders in Reflector Antennas, Springer Singapore, p.3139
- Heywood et al. (2016) Heywood I., et al., 2016, MNRAS, 457, 4160
- Hotan et al. (2014) Hotan A.W., et al., 2014, PASA, 31, 41
- Janowiecki et al. (2015) Janowiecki S., 2015, ApJ, 801, 96
- Jarrett et al. (2017) Jarrett T.H., et al., 2017, ApJ, 836, 182
- Johnston et al. (2007) Johnston S., et al., 2007, PASA, 24, 174
- Johnston et al. (2008) Johnston S., et al., 2008, ExA, .22., 151
- Jones et al. (2009) Jones D., et al., 2009, MNRAS, 399, 683
- Koribalski et al. (2004) Koribalski B.S., et al., 2004, AJ, 128, 16
- Koribalski (2012) Koribalski B.S., 2012, PASA, 29, 359
- Lee-Waddell et al. (2014) Lee-Waddell K., et al., 2014, MNRAS, 443, 3601
- Lee-Waddell et al. (2016) Lee-Waddell K., et al., 2016, MNRAS, 460, 2945
- Leisman et al. (2016) Leisman L., Haynes M.P., Giovanelli R., Jozsa G., Adams E., Hess K., 2016, MNRAS, 463, 1692
- Lelli et al. (2015) Lelli F., et al., 2015, A&A, 584,113
- Madrid et al. (2018) Madrid J.P., Lee-Waddell K., Serra P., Koribalski B.S., Schirmer M., Spekkens K., Wang J., 2018, ApJL, 854, 6
- Martin et al. (2005) Martin D.C., et al., 2005, ApJ, 619, 1
- McConnell et al. (2016) McConnell D., et al., 2016, PASA, 33, 42
- Meyer et al. (2004) Meyer M.J., et al., 2004, MNRAS, 350, 1195
- Mirabel, Dottori, Lutz (1992) Mirabel I., Dottori H., Lutz D., 1992, A&A, 256, 19
- Mullan et al. (2013) Mullan B., et al., 2013, ApJ, 768, 194
- Oosterloo et al. (2018) Oosterloo T.A., Zhang M.L., Lucero D.M., Carignan C., arXiv:1803.08263
- Pizzella et al. (2013) Pizzella A., Morelli L., Corsini E. M., Dalla Bonta E., Cesetti M., 2013, A&A, 560, A14
- Ploeckinger et al. (2018) Ploeckinger S., Sharma K., Schaye J., Crain R.A., Schaller M., Barber C., 2018, MNRAS, 474, 580
- Reynolds et al. (2018) Reynolds T.N., et al., 2019, MNRAS, 482, 3591
- Ryder et al. (2001) Ryder S.D., et al., 2001, ApJ, 555, 232
- Schaye (2004) Schaye J., 2004, ApJ, 609, 667
- Serra et al. (2015a) Serra P., et al., 2015, MNRAS, 448, 1922
- Serra et al. (2015b) Serra P., et al., 2015, MNRAS, 452, 2680
- Toomre & Toomre (1972) Toomre A., Toomre J., 1972, ApJ, 178, 623
- Tully (1987) Tully R.B., 1987, ApJ, 321, 280
- Tully et al. (2016) Tully R.B., Courtois H.M., Sorce J.G., 2016, AJ, 152, 50
- Tully et al. (2008) Tully R.B., Shaya E.J., Karachentsev I.D., Courtois H.M., Kocevski D.D., Rizzi L., Peel A., 2008, ApJ, 676, 184
- Wang et al. (2017) Wang J., et al., 2017, MNRAS, 472, 3029
- Whiting & Humphrey (2015) Whiting M., Humphreys B., 2012, PASA, 29, 371
- Wolf et al. (2018) Wolf C., et al., 2018, PASA, 35, 10
- Wright et al. (2010) Wright E.L., et al., 2010, AJ, 140, 1868
- Yang et al. (2007) Yang X., Mo H.J., van den Bosch F.C., Pasquali A., Li C., Barden M., 2007, ApJ, 671, 153
Appendix: Hi in surrounding group members
Within the 12-beam image cube, aside from the sources directly associated with the NGC 7232/3 triplet and surrounding tidal debris, there are nine resolved Hi galaxies. All of these galaxies appear to have stellar counterparts and for those that lie above the HIPASS detection levels, ASKAP recovers similar amounts of flux as HIPASS (see the right column of Figure A8). The new Hi detections appear to have fairly smooth velocity gradients that follow the morphology of the assumed stellar counterpart (Figure A9). The individual characteristics of these nine galaxies are further discussed in this appendix.
IC 5171
IC 5171 is a bright spiral galaxy that has a high amount of associated Hi emission. The residual sidelobe artefacts around IC 5171, shown in Figure 4, are particularly prominent as this galaxy resides in the higher sensitivity region of the Hi cube. To highlight the actual Hi features of the galaxy, these artefacts have been manually masked out of the moment maps in Figure A8. IC 5171 has a higher central velocity than other group members indicating that it is likely in the outskirts of the galaxy group. Overall, IC 5171 looks fairly symmetrical and undisturbed by the group environment.
ESO 288-G049
The southwest portion of ESO 288-G049 appears to have a disturbed velocity gradient. There is also an apparent gas cloud that was picked up by SoFiA as being part of this galaxy. If the cloud is real (i.e. not a sidelobe / imaging artefact resulting from the preliminary nature of the observations and data processing methods used during the Early Science phases of ASKAP), it could be another Hi source that is interacting with ESO 288-G049. However, the stellar disk of this face-on spiral and the spectral profile both show no noticeable asymmetries.
ESO 289-G010
ESO 289-G010 is an edge-on spiral located at the edge of the field of view of the 12-beam footprint. ASKAP recovers the same amount of Hi flux for this galaxy as the HIPASS observations. Nevertheless, the ripple pattern – the same artifact that was previously noticed in the beam edge region for some nights of the footprint B observations – is quite evident in the spectrum for this source. Although there appears to be an Hi extension to the north of the disk of ESO 289-G010, the RMS noise in this region of the cube is higher than the central regions. As such, it is unclear if this feature is real. We only processed and imaged a subset of beams for this paper, the addition of other beams from the same dataset would result in better Hi maps for further investigation of this galaxy.
ESO 289-G011
ESO 289-G011 is optically classified as an irregular galaxy. Its Hi velocity pattern indicates well-behaved rotation and a velocity width that is common for a typical gas-rich dwarf. The asymmetries in the outer regions of the galaxy suggest that there is a possible warp in the Hi disk.
MRSS 288-021830, AM 2208-460 and MRSS 289-168885
Our ASKAP observations are the first to detect and resolve the Hi components associated with these sources. With the high angular and spectral resolution of ASKAP, it is possible to associate these Hi detections with likely stellar counterparts and place constraints on redshift distances. All three galaxies appear to be members of the NGC 7232 galaxy group; however, since their Hi is spatially unresolved, it is difficult to ascertain their dynamical properties or any details about how they are being affected by the group environment.
NGC 7232A
NGC 7232A is a nearly edge-on disk galaxy. In addition to the the spatial and spectral coincidence between the stellar and Hi emission, the Hi velocity gradient follows the major axis of the stellar disk of NGC 7232A across nearly 200 km s-1, confirming that these components belong to the same galaxy. The spectra for this galaxy appear to be quite noisy, for both ASKAP and HIPASS, but three peaks of emission can be discerned in the ASKAP spectra and image cube. There is a noticeable feature between 1600 - 2000 km s-1 in the HIPASS spectrum that is not present in the ASKAP spectrum. This 2-sigma HIPASS peak modestly coincides with spatial region (within the 15.5 arcmin HIPASS beam) and spectral range of Hi clouds C1 and C2. If this feature is diffuse Hi emission, it could be part of the tidal bridge between the NGC 7232/3 triplet and IC 5181.
ESO 289-G005
Similar to NGC 7232A, the Hi emission detected in the same spatial and spectral region of ESO 289-G005 has a velocity gradient across the extent of its stellar disk. However, reflecting the compact morphology of this galaxy, the Hi spans 100 km s-1. This detection is the most prominent of the five newly resolved Hi galaxies.