The Evolution of Massive Helium Stars Including Mass Loss
Abstract
The evolution of helium stars with initial masses in the range 1.6 to 120 is studied, including the effects of mass loss by winds. These stars are assumed to form in binary systems when their expanding hydrogenic envelopes are promptly lost just after helium ignition. Significant differences are found with single star evolution, chiefly because the helium core loses mass during helium burning rather than gaining it from hydrogen shell burning. Consequently presupernova stars for a given initial mass function have considerably smaller mass when they die and will be easier to explode. Even accounting for this difference, the helium stars with mass loss develop more centrally condensed cores that should explode more easily than their single-star counterparts. The production of low mass black holes may be diminished. Helium stars with initial masses below 3.2 experience significant radius expansion after helium depletion, reaching blue supergiant proportions. This could trigger additional mass exchange or affect the light curve of the supernova. The most common black hole masses produced in binaries is estimated to be about 9 . A new maximum mass for black holes derived from pulsational pair-instability supernovae is derived - 46 , and a new potential gap at 10 - 12 is noted. Models pertinent to SN 2014ft are presented and a library of presupernova models is generated.
Subject headings:
stars: supernovae, evolution, black holes1. INTRODUCTION
Half or more of massive stars are found in binaries with such close separations that the stars will interact when one of them becomes a supergiant (Sana & Evans, 2011; Sana et al., 2012). This interaction will radically affect the sorts of supernovae they produce (Podsiadlowski et al., 1992; Wellstein & Langer, 1999; Langer, 2012; De Marco & Izzard, 2017). Many of the supernovae will no longer be Type II, but Type I. More subtle structural changes also happen to the core structure that affect the explosion physics, nucleosynthesis, and remnant properties.
In cases where the stars do not fully merge, binary interaction preferentially removes the low density hydrogen envelope, so binary evolution is often studied using helium stars. Doing so reduces the computational expense trivially, but also isolates the evolution of the central core from uncertainties in red giant mass loss, semiconvection and overshoot mixing during hydrogen core and shell burning, and rotationally-induced mixing on the main sequence. A significant fraction of rapidly rotating massive stars might also experience chemically homogeneous evolution (Maeder, 1987) and end up resembling helium stars. These could be the precursors of merging black hole pairs in binary systems (Mandel & de Mink, 2016) or gamma-ray bursts (Woosley & Heger, 2006).
The study of massive helium stars has a rich history. Some of the first explorations of advanced burning stages were carried out in helium stars by Arnett (e.g. 1974). Nomoto & Hashimoto (1988) systematically explored massive stellar evolution and nucleosynthesis using helium stars. Woosley et al. (1995) included mass loss as a way to get realistic progenitors for Type Ib supernovae. More recently, helium star evolution has been considered specifically in the context of mass exchanging binaries by Kruckow et al. (2018); McClelland & Eldridge (2016); Tauris et al. (2015); Yoon et al. (2010); Yoon (2017), and others. These studies paid close attention to important details of the binary interaction, but did not usually follow the full range of helium star masses expected to give supernovae, nor the evolution through core collapse and beyond. In contrast, the present study includes all massive stars expected to explode or produce compact remnants, and, except for the lightest members, follows the evolution to its completion.
A simple, approximate approach is used to account for binary mass exchange. It is assumed that the dominant effect of binary interaction is to remove the hydrogen envelope, revealing a bare helium star. This could happen due to mass transfer through a Roche lobe or by the formation and ejection of a common envelope. A similar starting point might be generated by chemically homogeneous evolution. The key quantities are then the mass of the initial helium core when it is uncovered, the central abundance of helium then, and the star’s subsequent mass loss history. The simplest assumption, which is adopted here, is to assume that the helium core is always revealed when helium burning ignites. The initial central helium mass fraction is thus near 1, and the final evolution is determined by the progenitor star’s initial mass on the main sequence and the mass loss rate. Given a relation, to be derived, between ZAMS mass and helium core mass at helium ignition, the outcome of stellar evolution for all masses can be surveyed. The results should be useful both to understanding, qualitatively, the outcome of binary evolution for a large range of masses, and for calculating the distribution of compact remnants in binaries (e.g. Fryer et al., 2012).
For mass loss by winds, the recent prescription of Yoon (2017) is used. This, in turn, is a restatement of previous estimates for various kinds of Wolf-Rayet stars. It is neither a unique prescription (see e.g. Vink, 2017), nor one unlikely to change, but it is an improvement over what the KEPLER code has used in the past. The stars studied lack rotation and have solar metallicity. Rotation, even rapid rotation, is not expected to alter the results appreciably. The carbon-oxygen (CO) core may be a bit larger, but post-helium burning phases occur so rapidly that substantial mixing does not occur. The ratio of centrifugal force to gravity is not large, except near the surface. Except during core collapse, the central evolution is unaffected.
Similarly, except for nucleosynthesis, the metallicity does not greatly alter the presupernova evolution, except as it affects the mass loss. The mass loss is varied here to test that sensitivity. To some extent, varying the mass loss rate also accounts for the fact that the helium core may not be uncovered until later in the evolution after appreciable helium has burned.
As in previous studies, one finds domains where white dwarfs or electron-capture supernovae are the likely outcome (§3.1.1); a heavier range where residual degeneracy leads to off-center burning and possible thermonuclear flashes (§3.1.2); a range of normal Type Ib and Ic supernovae and a mixture of neutron stars and black holes (§3.2); and some very heavy stars where the pair instability is important (§3.3). These stars all have counterparts in previous studies of single stars, but happen for different initial masses and differ in outcome in subtle and important ways. For example, the maximum mass for black holes as truncated by the pulsational pair instability is smaller because the the expanding core is not decelerated by a massive hydrogen envelope. The light curves for all models are different, and of course Type I, not II. In §5, a brief survey is given of all the Type I supernova light curves expected from binaries. Emphasis is on low mass models where new phenomena are expected.
While a large network was carried in all models, studies of nucleosynthesis, explosion kinematics and remnant masses are deferred to future papers.
2. Computation and Physics
Over 150 helium star models were evolved with initial masses from 1.6 to 120 . From 1.6 to 4.5 , the mass increment was 0.1 ; from 4.5 to 23.0, 0.25 ; from 23 to 28, 0.5 ; from 28 to 70, 2 ; and from 70 to 120 , 5 . Models were characterized by their initial mass, mass loss rate (§2.1), initial composition, and the physics used in their study.
The initial composition was taken to be the products of hydrogen burning in a massive star with solar metallicity. The particular star used to generate the initial composition was the 13 model of Woosley & Heger (2015). By mass fraction, the abundances of species that constituted more than 0.01% of the mass were 4He (0.9855); 12C (2.2(-4)); 14N (8.98(-3)); 16O (2.07(-4)); 20Ne (1.14(-3)); 23Na (1.47(-4); 24Mg (5.65(-4); 26Mg (1.55(-4)); 28Si (7.55(-4)); 32S (3.96(-4)); and 56Fe (1.26(-3)). The total mass fraction of all isotopes of Mn, Fe, Co and Ni was 1.46(-3). The abundance of nitrogen was sufficiently large that each star experienced a brief stage of convective nitrogen burning (14N(FO) before settling down to burn helium.
Nuclear physics was handled in different ways for the various burning stages and star masses. Four tools are available for tracking nucleosynthesis and energy generation in the KEPLER code: a) an adaptive network that includes all isotopes with any appreciable abundances within user-specified bounds (Rauscher et al., 2002), all coupled to directly to the energy generation (Woosley et al., 2004); b) an approximation network with 19 species from H to 56Ni with steady state assumed for 10 other species (Weaver, Zimmerman, & Woosley, 1978); c) a silicon quasi-equilibrium network that assumes nuclear statistical equilibrium within two large groups from silicon to scandium and titanium to nickel (Weaver, Zimmerman, & Woosley, 1978) and contains 128 species; and d) a large network like in a), but used in passive mode just to follow nucleosynthesis and gradual changes in the electron mole number . Temperature and density-dependent weak interaction rates were included in all cases but b) (e.g., Heger et al., 2001). To save time the network in cases a) and d) was truncated at molybdenum (Z = 42). That will not affect energy generation, but means that the heavy s-process was not tracked in the present study. Typically 300 to 400 isotopes from 1H to 114Mo were carried in cases a) and d), depending on the burning stage.
The large network (case a) was used for the full evolution of all models lighter than 4.5 . This was necessary to follow weak interactions on trace species during high-density carbon, neon, and oxygen burning where the quasi-equilibrium approximation is not valid. The energy generation can become quite complicated when, e.g., in silicon burning, the dominant species are not alpha-particle (Z = N) nuclei and the most abundant species are 30Si and 34S. The large network was also used to study a few pulsational-pair instability supernova where the explosions left silicon-group and iron-group species sitting at low temperature for a long time. Good agreement with runs using approximations b) and c) was found (§3.3; Table 5).
All other cases used a combination of the approximation network (case b) and quasi-equilibrium network (case c) to follow energy generation. The passive network (case d) was also used to track nucleosynthesis and gradual changes in which were fed back into the equation of state and thus, indirectly, affected structure.
Zoning was similar to that employed in Sukhbold et al. (2018) and varied approximately as , with M the initial mass of star. The 2 helium star had about 900 zones; the 120 star, about 7000. Surface zoning and boundary conditions were important in resolving the photosphere. Models up to 10 had surface zoning approaching 1025 gm and a surface boundary pressure of 104 dyne cm-1. From 10 to 20 the boundary pressure was increased to 106 dyne cm-2. Above 10 , severe density inversions and pulsational instabilities developed in a tiny bit of matter at the surface, , that made it difficult to determine the photospheric radius exactly. These heavier stars did not experience radius expansion and coarser zoning sufficed. From 20 to 120 , surface zoning approached 1027 gm and the surface boundary pressure was 108 dyne cm-2.
Fortunately, the mass loss rate employed in this study depends only upon the luminosity (§2.1). Finer zoning was useful for resolving the radius, but not the luminosity. Several limited sets of models were run to test the sensitivity of results to zoning and little variation was found. For example, a 10.0 model with surface zoning to 1027 gm and boundary pressure 108 dyne cm-2 (the standard values for the heavy models) had a final mass, luminosity, and radius of 6.737 , erg s-1, and cm. The same star run with surface zoning of 1021 gm and a boundary pressure of 104 dyne cm-2 had final mass, luminosity, and radius 6.750 , erg s-1, and cm. In this fine zoned model, a radius of cm existed just 10-9 deeper in. Such a small mass can affect the observed temperature of the progenitor star, but not the internal evolution or light curve. The differences were even less for lighter stars. A 4.0 model with its standard zoning had mass, luminosity and radius 3.155 , erg s-1, and cm. With surface zoning of 1022 gm instead of 1025 gm, the mass, luminosity, and radius were 3.158 , erg s-1, and cm.
Resolving temperature and density gradients in the thin helium shell of the lower mass stars also took zoning that approached 10-6 . For models close to the Chandrasekhar mass, gradients in density were so steep that the zoning would have been too fine for the star to evolve, even in hundreds of thousands of steps. This limited the mass to which degenerate core growth was followed for stars in the 1.6 to 2.4 range, typically to around 1.26 where carbon flames ignited.
The treatment of convectively bounded flames (CBFs) during oxygen and silicon burning was as in Woosley & Heger (2015). Opacities, the treatment of convection, the equation of state, reaction rates, simulations of explosions, and radiation transport in supernovae were all the same as in past works using the KEPLER code, (Woosley et al., 2002; Sukhbold et al., 2018).
2.1. Mass Loss
Once revealed, a helium core in a close binary system continues to experience mass loss through winds. The uncertainty in mass loss rate and its dependence on metallicity dominate other factors such as exactly when and how the helium star was formed. Here we use the mass loss rate compilation of Yoon (2017), which is, in turn, an amalgamation of the rates of Tramper, Sana, and de Koter (2016) for Wolf-Rayet stars of types WC and WO and Hanich et al. (2014) for WNE stars. In particular, as Yoon (2017) discusses, we take a mass loss rate for WC and WO stars, defined as when the surface mass fraction of helium drops below , of
| (1) |
The metallicity in the form of iron is assumed to include all isotopes of the iron group and is . All models calculated in this paper had Z = , so the metallicity term in these equations is zero. For further discussion of the metallicity dependence see Eldridge & Vink (2006).
For WNE stars, nominally ,
| (2) |
. For surface helium mass fractions between 0.9 and 0.98, the mass loss rate is linearly interpolated
| (3) |
with ).
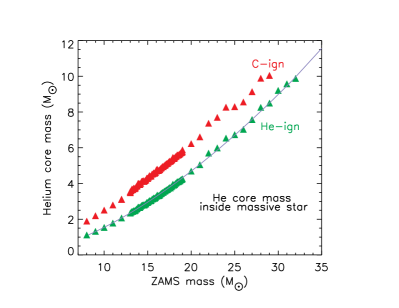

It is assumed that the helium core is revealed at helium ignition and experiences this mass loss throughout its lifetime. Based on the models of Woosley & Heger (2007) and Sukhbold et al. (2018), a fit to the helium core mass in single massive stars, at helium ignition, as a function of zero age main sequence mass (ZAMS mass, i.e., the original hydrogenic star) is
| (4) |
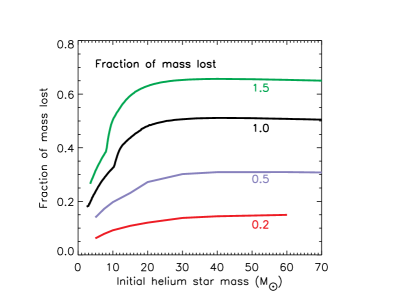
This fit is valid for main sequence masses in the range 6 to 30 . For example, a 6 initial helium core mass corresponds to a 23.3 main sequence star. This expression is plotted as a line through the green points in the upper panel of Fig. 1. Above 30 , and up to at least 140 , a better fit for stars that do not lose their entire hydrogen envelope is
| (5) |
3. Presupernova Evolution
Depending on mass, a wide variety of outcomes is expected. In each case, the range referred to in the section head is the zero age helium core mass, i.e., the mass at helium ignition immediately following the removal of any hydrogen envelope.
3.1. = 1.6 - 3.2 ; White Dwarfs and Unusual Supernovae
Helium stars with initial masses between 1.6 and 3.2 develop degenerate cores of carbon and oxygen ( - 1.8 ); neon, oxygen, and magnesium (1.9 - 2.4 ); or silicon (2.5 - 3.2 ). Their final evolution is characterized by temperature inversions, flashes, off-center ignition, and convectively bounded flames. End states depend upon the mass loss during the final burning stages which may be due to winds or a combination of winds and resumed transfer to the binary companion. Radii exceeding 1013 cm are common (Table 1 and Table 2). Above about 3.2 , for the present choice of mass loss rates, this large expansion does not occur (Table 3). We consider first the case of mass loss by winds alone, and then comment on how the results might be altered by late stage mass loss to a companion (§3.1.3).
3.1.1 = 1.6 - 2.4 ; White Dwarfs and Electron-capture Supernovae
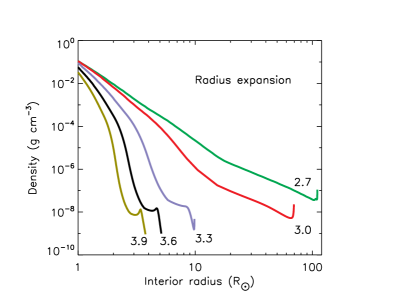
After central helium depletion, helium stars from the least massive considered here (1.6 ) to 2.4 develop degenerate carbon-oxygen or neon-oxygen-magnesium (NeO) cores surrounded by steep density gradients, thin helium-burning shells, and low density, convective helium envelopes. The radii of such stars can become quite large (Table 1), and grows with time Table 2). The degenerate core also increases its mass as carbon and oxygen are added by helium burning. These attributes are similar to Super Asymptotic Giant Branch (SAGB) stars (e.g. Garcia-Berro & Iben, 1994; Siess, 2006), but differ in that the envelope here consists entirely of helium. Nevertheless, the term SAGB will be used to describe this structure. Another key difference is that the helium burning shell here, despite being thin in mass, is not unstable. Perhaps a mild instability is suppressed by the implicit hydrodynamics of the code and large time steps which are typically 106.5 to 107.5 s during the thin shell epoch. Resolving the helium burning shell requires very fine zoning though, down to 10-6 . With this resolution, the burning breaks up into two regions, a nitrogen burning shell which lies just beneath the base of the convective envelope, and a broader helium burning region, which is also radiative.
Provided these stars retain sufficient mass, they have two opportunities to ignite carbon burning, first as the helium burning ashes contract and heat up and second, as the helium burning shell builds up a critical mass and ignites carbon closer to the surface. The critical mass for that second ignition is estimated here to be near 1.26 . Consequently, the most massive white dwarf with a thick carbon shell should be 1.26 .
Ignition of carbon within the helium-depleted core
.
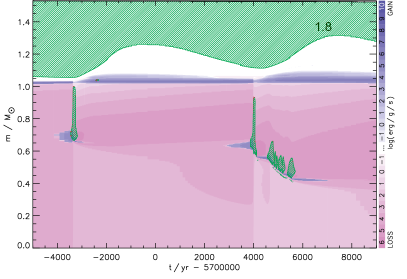
Fig. 2 and Table 1 show some characteristics of “first” carbon ignition in this mass range. Below 1.8 , carbon burning does not ignite prior to the formation of an SAGB-like structure. The CO-core is initially less than the 1.06 necessary for ignition (Nomoto & Hashimoto, 1986, 1988). The 1.8 model itself is a transition case that ignites carbon burning in a flash 0.69 off center (Fig. 2) with a CO-core mass of only 1.03 . A second flash occurs 7500 years later. Both flashes are weak though, and fail to exhaust the carbon at the ignition sites, or to ignite a sustained CBF. The star at this point has not become become a fully developed giant and the pressure of the overlying helium is not negligible, hence the lower carbon ignition mass and incomplete burning. It remains mostly a CO-white dwarf.
It is not uncommon to see separate flashes preceding the formation of a CBF (Siess, 2006; Farmer et al., 2015), or cases where flashes do not lead to flame formation. See, for example, the 7.0 model of Farmer et al. (2015), especially their Figure 3. This sort of evolution is thought to lead to “hybrid CO+NeO white dwarfs” and that is what is also found here for the 1.8 model. Most of the core remains CO, but there is a shell of partly burned carbon.
By comparing diffusion and burning time scales, Farmer et al. (2015) estimate a unique density for off-center carbon ignition, g cm-3. In good agreement, the 1.8 model here ignited carbon at g cm-3 when its central density was g cm-3.
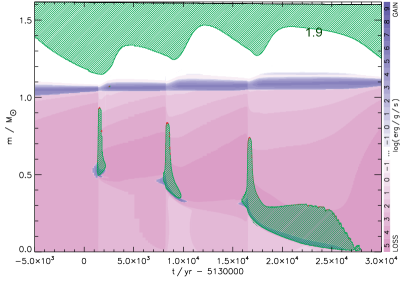
The 1.9 model was the lowest mass to clearly ignite a sustained carbon CBF (Table 1) and did so with a core mass of 1.06 (Table 1). It did so after three flashes (Fig. 2), the third of which developed into a flame that propagated to the center of the star. Even so the composition remained contaminated by a substantial trace of residual, unburned carbon.
From 1.9 to 2.4 , all stars ignite carbon CBFs (Nomoto & Iben, 1985) that burn to the center of the star (Timmes et al., 1994) prior to becoming SAGB stars. This turns the composition of the core to neon, oxygen, and magnesium. As the mass of the core increases, a diminishing number of flashes precedes flame formation (Fig. 2). The flash that bounds the eventual flame ignites systematically deeper in the star at a density that remains near g cm-3. The decreasing central density of more massive stars causes the ignition to move inwards (Farmer et al., 2015). These flashes lead to an expansion of the core that temporarily weakens the helium burning shell so that the base of the convective envelope moves out in mass. The flashes are less violent at higher mass where the degeneracy is less. The 2.5 model was the last to ignite carbon off center, doing so at an offset from the center of only 0.005 .
In all models with a CBF, zoning was sufficiently fine that the flame moved by thermal diffusion. Rezoning was not allowed within the flame, but the calculation included standard overshooting as described in Sukhbold et al. (2018). Thermohaline mixing was not included, though the Ledoux criterion led to the mixing of regions with an inverted atomic mass when the temperature gradient was not strongly inverted. The flame speed is known to be sensitive to zoning, convective overshoot, and thermohaline mixing (Timmes et al., 1994; Siess, 2006; Denissenkov et al., 2013). Sensitivity studies were not carried out, but the speeds here were about five times slower than Timmes et al. (1994) and their speeds should not be critical to the subsequent evolution.
Ignition of carbon as an SAGB star
The luminosity of models during their SAGB phase, which is due to helium shell burning, can be fitted to a power of the core mass, i.e., there is a “core luminosity relation” for helium SAGB stars (Jeffery, 1988). Using the values in Table 1 and Table 2 and earlier data points for core masses in the range 1.0 to 1.3 ,
| (6) |
where is the core mass (CO + NeO) in solar masses (see also Havazelet & Barkat, 1979, their eq. 3.2).
Burning one gram of helium to one gram of carbon and oxygen (50% by mass each) yields erg. The core luminosity relation thus implies that the compact core will increase in mass at a rate
| (7) |
which is about 6 to 8 y-1 for core masses between 1.2 and 1.3 . Growth rates in this range imply that carbon will ignite when the white dwarf reaches a mass of 1.25 - 1.3 (Table 2 Saio & Nomoto, 2004). Combining eq. (6) and eq. (2), the mass loss to winds in the SAGB phase is
| (8) |
so for , the core gains about 2 gm for every 1 gm lost to winds.
| [] | [] | [] | [] | [1038 erg s-1] | [1013 cm] |
|---|---|---|---|---|---|
| 1.6 | 1.36 | 0.953 | - | 1.14 | 0.94 |
| 1.7 | 1.45 | 0.985 | - | 1.20 | 0.96 |
| 1.75 | 1.49 | 1.00 | - | 1.25 | 0.98 |
| 1.8 | 1.53 | 1.03 | 0.622 | 0.955 | 0.83 |
| 1.9 | 1.61 | 1.06 | 0.519 | 1.09 | 0.89 |
| 2.0 | 1.70 | 1.08 | 0.407 | 0.872 | 0.77 |
| 2.1 | 1.78 | 1.12 | 0.306 | 0.787 | 0.66 |
| 2.2 | 1.85 | 1.18 | 0.213 | 0.854 | 0.52 |
| 2.3 | 1.94 | 1.20 | 0.127 | 0.93 | 0.15 |
| 2.4 | 2.01 | 1.24 | 0.057 | 0.99 | 0.063 |
| 2.5 | 2.09 | 1.28 | 0.005 | 1.04 | 0.037 |
| 2.6 | 2.17 | 1.32 | 0 | 1.09 | 0.028 |
| 2.7 | 2.22 | 1.46 | 0 | 1.15 | 0.023 |
Note. — For M , and are the masses of the star and its CO core when carbon first ignites and R13 and L38 are the star’s radius and luminosity. MC-ign is the mass shell where carbon ignites. For the three lighter models, approximate conditions are given when the star first develops a thin helium burning shell. Carbon burning has not ignited.
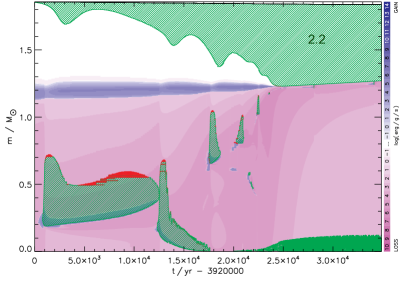
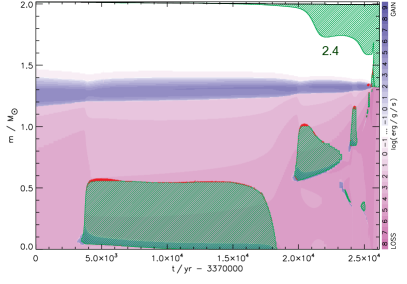
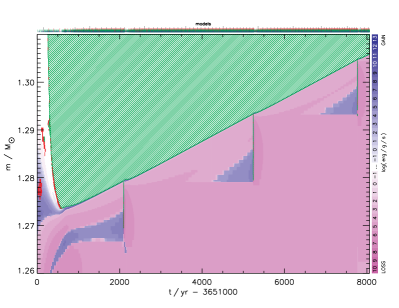
Carbon did not burn continuously in the shell that grew beneath the thin helium burning shell in the SAGB stars. A critical mass of unburned carbon and oxygen accumulated before igniting and running away. Each runaway ignited a localized CBF, and the combination of convection and flame consumed the accumulated carbon layer turning it to neon, oxygen, and magnesium. Similar to the hydrogen critical mass in classical novae, the critical mass of this carbon layer became smaller as the mass of the core and the gravitational potential at its edge increased. For models lighter than 2.1 case, the critical mass, was so large that only one layer was observed to form and run away during the time studied. For example, the 2.0 model ended carbon core burning with a NeO core mass of 1.15 . Once a SAGB structure developed, helium burning in a thin shell increased the mass of the CO core to 1.26 before a runaway ignited at 1.22 . Burning in this layer eventually converted the carbon and oxygen from 1.15 to 1.25 to NeO. Though the subsequent evolution was not followed, the critical mass for later runaways on this larger core will be smaller. That is, the critical mass depends on the current core mass, not the original helium star mass. For the 2.3 model where the initial core mass was similar to the final mass in the 2.0 model, multiple carbon flashes were followed (Fig. 3) and the critical mass was determined to be 0.01 for a core mass of 1.27 . For the 2.4 model carbon burning approached a steady state with helium burning, lagging just a few thousandths of a solar mass beneath, and no flashes were observed.
| [] | [] | [] | [1038 erg s-1] | [1013 cm] | |
|---|---|---|---|---|---|
| 1.6 | 1.21 | 1.21 | - | - | CO WD |
| 1.7 | 1.31 | 1.22 | 2.85 | 1.34 | CO |
| 1.75 | 1.33 | 1.26 | 3.27 | 1.39 | CO |
| 1.8 | 1.39 | 1.24 | 3.03 | 1.33 | CO/NeO |
| 1.9 | 1.48 | 1.26 | 3.18 | 1.41 | NeO |
| 2.0 | 1.59 | 1.26 | 3.25 | 1.48 | NeO |
| 2.1 | 1.73 | 1.23 | 3.19 | 1.53 | NeO |
| 2.2 | 1.80 | 1.28 | 3.71 | 1.63 | NeO |
| 2.3 | 1.87 | 1.32 | 4.16 | 1.74 | NeO |
| 2.4 | 1.96 | 1.32 | 4.18 | 1.77 | NeO |
| 2.5 | 2.07 | 1.37 | 0.96 | 0.72 | Si flash |
Note. — For models from 1.7 to 2.4 , conditions are given at the last model calculated and are not the terminal values. CO and NeO indicate the major constituents of the core at that time. Were the envelope not lost, continued growth of the core to the Chandrasekhar mass would lead to electron-capture supernovae in all cases from 1.8 to 2.5 model.
No SAGB model was followed all the way to the Chandrasekhar mass. As the core grew more massive and compact, its surface gravity strengthened, making the helium and nitrogen burning shells thinner and requiring more zones for their resolution. Burning helium to carbon in zones of ever decreasing mass required more time steps to maintain a given growth rate. The envelope expanded to large radii and partly recombined, causing additional numerical instability. The future evolution of the models can be estimated though assuming: 1) that winds dominate the mass loss; 2) the core grows at twice the rate at which the total star loses mass (eq. (8)), 3) all cores over 1.26 ignite carbon burning in the accumulated layer; and 4) electron-capture supernovae happen when the core reaches 1.38 . This growth rate is consistent with the numerical models evaluated during the last 0.1 of core growth (Table 2). It is estimated that the core of the 1.7 model will grow to 1.27 while the star loses 0.03 to end up as a white dwarf of 1.27 , probably composed of NeO. Similarly, the 1.8 model will end up as a 1.34 NeO white dwarf. The 1.9 model will become an electron-capture supernova when its core mass reaches 1.38 and the envelope’s mass is only 0.05 ; the 2.0 model will make a similar supernova with an envelope mass of 0.16 ; and so on.
3.1.2 = 2.5 - 3.2 ; Silicon Flashes
| Si-Ign | ||||||||
|---|---|---|---|---|---|---|---|---|
| [] | [] | [] | [1013 cm] | [109 g cm-3] | [] | [109 K] | ||
| 2.5 | 2.07 | 1.367 | 0.719 | 1.76 | 0.504 | 9.39 | 3.23 | deflagration |
| 2.6 | 2.15 | 1.414 | 0.778 | 1.36 | 0.414 | 9.13 | 3.23 | weak pulse |
| 2.7 | 2.22 | 1.459 | 0.760 | 1.17 | 0.38 | 9.09 | 3.18 | weak pulse |
| 2.8 | 2.30 | 1.507 | 0.724 | 0.974 | 0.30 | 9.05 | 3.21 | weak pulse |
| 2.9 | 2.37 | 1.556 | 0.647 | 0.772 | 0.18 | 9.04 | 3.18 | weak pulse |
| 3.0 | 2.45 | 1.604 | 0.476 | 0.610 | 0.090 | 9.16 | 3.19 | deflagration |
| 3.1 | 2.52 | 1.656 | 0.191 | 0.495 | 0.011 | 9.27 | 3.18 | deflagration |
| 3.2 | 2.59 | 1.709 | 0.104 | 0.419 | 0 | 8.87 | 3.20 | deflagration |
| 3.3 | 2.67 | 1.761 | 0.070 | 0.341 | 0 | 8.13 | 3.20 | normal |
| 3.4 | 2.74 | 1.809 | 0.053 | 0.299 | 0 | 7.59 | 3.23 | normal |
Note. — , , , and are the masses of the initial helium core, the final presupernova mass, the CO core at silicon ignition, and the shell where silicon burning ignites. and are the temperature (in 109 K) and electron degeneracy parameter at the location where silicon ignites, i.e., at and is the radius of the star then.
Initial helium core masses of 2.5 to 3.2 correspond to stars with main sequence masses 13.5 to 15.8 (eq. (4), Fig. 1). At death, the mass ranges from 2.07 to 2.59 and the CO-core mass from 1.37 to 1.71 (Table 3). This range of final helium and CO core masses is known to be characterized by the lingering effects of off-center ignition and degenerate silicon flashes (e.g. Woosley & Heger, 2015, Table 1).
As with carbon ignition, the displacement of oxygen ignition from the center shrinks with increasing mass. In the 3.5 model, both neon and oxygen burning ignite only 0.004 off center. The oxygen-burning CBF propagates to the center, leaving behind composition and entropy profiles that set the stage for silicon ignition. How these flames progress may be different in a more realistic three-dimensional simulation and the assumption of a spherically symmetric flame propagation by conduction rather than turbulent undershoot mixing is questionable (Woosley & Heger, 2015).
Silicon burning also ignites off center for helium stars up to 3.2 (Table 3) with the displacement, again, a declining function of mass. Silicon ignition is defined as a region with exoergic energy generation capable of driving convection with a base temperature exceeding K. The core’s temperature profile at silicon ignition is inverted by neutrino losses so that higher temperatures occur farther out in the star. Lower mass stars retain their high degeneracy farther out, and this accounts for the violent runaway in the outer regions of the 2.5 model, but not the 2.6 model. At still greater masses, higher temperature migrates deeper into the star allowing another island of instability from 3.0 to 3.2 .
The silicon flash in stars with violent runaways begins at a degeneracy parameter and reaches, locally, very high temperatures, around K, leading either to detonation or deflagration (Woosley & Heger, 2015). If convection is left on until the energy transport exceeds 1049 erg s-1, the “sonic limit”, detonation forms that decays a short time later to a deflagration. If convection is more restricted, a hot, less dense layer of iron forms that is buoyant and also seeds a deflagration.
The strength of these explosions is poorly determined, especially in a 1D study, but the kinetic energy of any ejecta probably does not exceed a few erg. Typically the runaways burn 0.1 to 0.5 of silicon to iron (§5.3). The fusion of a gram of silicon releases erg g-1. This yield is evaluated from the existing composition, but typically the fuel is rich in 30Si and the ash in 56Fe. The burning thus yields about erg per solar mass implying an explosive yield of order erg, but the binding energy of the core at the time of ignition is erg (e.g., erg in the 3.0 model). It is only by transporting some fraction of the explosion energy to the envelope by a shock wave that any mass is ejected. The shock is produced by the large amplitude oscillation of the core and the more burning, the larger the amplitude and the stronger the shock.
Even stars where the runaway was not clearly supersonic, i.e., the 2.6 - 2.9 models, experienced mildly degenerate silicon flashes that gave weak shocks in the envelope. Typically these shocks decayed by momentum conservation to less than 100 km s-1 before reaching the star’s surface. A tiny bit of matter is puffed off at low speeds, but that will be overtaken by the optically thick supernova before it brightens appreciably.
The radii of the star at silicon ignition - the same as “presupernova radius” in Table 4 - ranges from cm (2.5 model) to cm (3.2 model). Given the low energy of the shock and small radius, the display resulting from the silicon flash will not be bright, and would decline rapidly. A much brighter display could result when the remaining core completes silicon burning and collapses to a neutron star. Even a neutrino-powered wind would impacting a solar mass shell at roughly 1 - 10 AU would give a luminous supernova (Woosley & Heger, 2015). These possibilities are explored in §5.3. .
3.1.3 Modifications for late stage mass transfer
Models below 2.5 develop thin helium shells and SAGB-like structure after central helium depletion. This causes the surface to expand to large radii. Heavier stars up to about 3.2 also experience significant radius expansion during carbon burning, even though their helium shells remains thick (Table 3).
For models below 1.8 , using eq. (2), a white dwarf results, even if late stage binary transfer is neglected. If all stars that expand beyond cm are assumed to lose their envelopes, then stars from 1.9 to 2.4 also become NeO white dwarfs (Table 2). From 2.4 to 3.2 things are complicated. The mass of the CO core is already large enough when the radius starts to expand that the central evolution will proceed pretty much as already described. A supernova of some sort will result, but how much helium remains and its radius will greatly affect the light curves. Both these quantities are quite uncertain. For now, we adopt an upper bound to the stars that make white dwarfs of 2.4 (see also Tauris et al., 2015).
Major adjustments to the star’s outer structure happen during the last roughly 10,000 years of its life so the immediate progenitors of Type Ib and Ic supernovae might appear different from ordinary Wolf-Rayet stars (see also Eldridge et al., 2013). For example, assuming only loss by wind, the 2.5 model had a radius of cm at carbon ignition and a radius of cm when the central carbon mass fraction reached 1%.
3.2. = 3.2 - 60 ; “Normal” Evolution
Models with initial masses above 3.2 ignite all phases of nuclear burning, including silicon burning, at their centers (Table 3). Their radii also remain sufficiently small that a second stage of binary mass transfer is probably avoided.
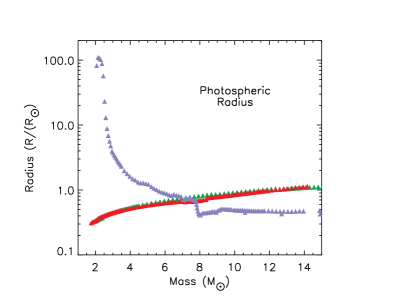
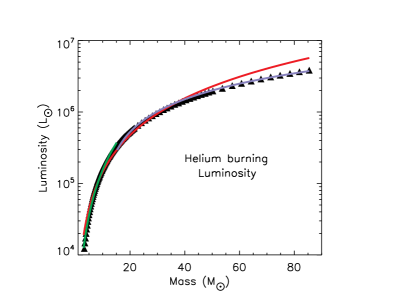
The age, mass, luminosity, and effective temperature of the helium stars on the (helium) main sequence, when convective burning has reduced the central helium mass fraction to 0.50, are given in Table 4 and Fig. 6. The luminosity as a function of mass is given, approximately, for the entire distribution by (Red curve), where is the current mass in solar masses. A better fit can be obtained by breaking the fitting interval into two mass ranges: 3 to 15 (green line in Fig. 6, and above 15 (blue line)
| (9) |
This second equation has the correct form for extrapolating to masses beyond the fit interval because the luminosity approaches the Eddington value at high masses and is thus proportional to M.
Similarly, the lifetimes in Table 4 can be approximated, but are not plotted.
| (10) |
where again, at high masses the lifetime approaches the correct (constant) Eddington value. Here is the initial mass of the helium star.
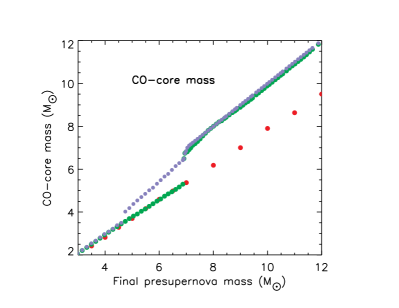
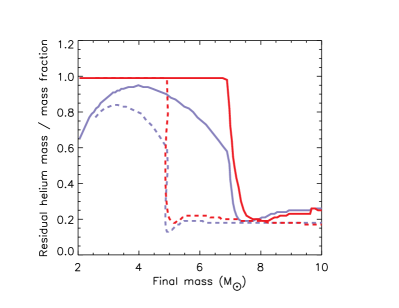
A fit for the final mass as a function of starting helium core mass (see second panel of Fig. 1) that is good to better than a few percent for initial helium core masses up to 10 is
| (11) |
where all masses are in solar masses. For heavier helium cores,
| (12) |
These equations can be combined with eq. (4) and eq. (5) to give
| (13) |
for main sequence masses below 30 and
| (14) |
for main sequence masses above 30 . For very high masses a good rule of thumb is that the final mass is one-fourth of the ZAMS mass. This is for the standard mass loss rate and would need to be modified for other values.
| [] | [105 y] | [] | [] | [K] | [105 y] | [] | [] | [K] | [] | [] | |
|---|---|---|---|---|---|---|---|---|---|---|---|
| Nominal mass loss | |||||||||||
| At helium burning and carbon ignition | |||||||||||
| 1.8 | 19.66 | 1.73 | 3.27 | 4.82 | 57.03 | 1.53 | 4.37 | 3.82 | 1.03 | 0.49 | 0.99 |
| 1.9 | 17.79 | 1.82 | 3.35 | 4.83 | 51.32 | 1.61 | 4.45 | 3.82 | 1.06 | 0.55 | 0.99 |
| 2.0 | 16.04 | 1.92 | 3.41 | 4.84 | 46.59 | 1.70 | 4.35 | 3.83 | 1.08 | 0.59 | 0.99 |
| 2.1 | 14.68 | 2.01 | 3.48 | 4.85 | 42.53 | 1.78 | 4.31 | 4.31 | 1.09 | 0.63 | 0.99 |
| 2.2 | 13.56 | 2.10 | 3.53 | 4.86 | 39.10 | 1.86 | 4.31 | 4.59 | 1.10 | 0.67 | 0.99 |
| 2.3 | 12.50 | 2.20 | 3.59 | 4.87 | 36.19 | 1.94 | 4.33 | 4.67 | 1.14 | 0.70 | 0.99 |
| 2.4 | 11.76 | 2.29 | 3.64 | 4.87 | 33.63 | 2.02 | 4.35 | 4.71 | 1.18 | 0.73 | 0.99 |
| 2.5 | 10.86 | 2.38 | 3.69 | 4.88 | 31.43 | 2.10 | 4.37 | 4.73 | 1.21 | 0.76 | 0.99 |
| At helium burning and oxygen ignition | |||||||||||
| 2.5 | 10.86 | 2.38 | 3.69 | 4.88 | 31.73 | 2.07 | 4.37 | 3.85 | 1.37 | 0.67 | 0.99 |
| 2.6 | 10.28 | 2.47 | 3.74 | 4.89 | 29.76 | 2.15 | 4.47 | 3.86 | 1.41 | 0.70 | 0.99 |
| 2.7 | 9.69 | 2.56 | 3.79 | 4.89 | 28.02 | 2.22 | 4.51 | 3.87 | 1.46 | 0.72 | 0.99 |
| 2.8 | 9.08 | 2.65 | 3.83 | 4.90 | 26.48 | 2.30 | 4.55 | 3.89 | 1.51 | 0.75 | 0.99 |
| 2.9 | 8.64 | 2.74 | 3.87 | 4.91 | 25.10 | 2.37 | 4.59 | 3.92 | 1.56 | 0.77 | 0.99 |
| 3.0 | 8.21 | 2.83 | 3.91 | 4.91 | 23.88 | 2.45 | 4.61 | 3.99 | 1.61 | 0.78 | 0.99 |
| 3.2 | 7.54 | 3.01 | 3.99 | 4.92 | 21.74 | 2.59 | 4.65 | 4.34 | 1.70 | 0.82 | 0.99 |
| 3.5 | 6.65 | 3.28 | 4.09 | 4.93 | 19.18 | 2.81 | 4.69 | 4.55 | 1.85 | 0.86 | 0.99 |
| 4.0 | 5.60 | 3.72 | 4.24 | 4.95 | 16.10 | 3.15 | 4.78 | 4.69 | 2.12 | 0.91 | 0.99 |
| 4.5 | 4.89 | 4.16 | 4.36 | 4.97 | 13.97 | 3.49 | 4.85 | 4.75 | 2.38 | 0.93 | 0.99 |
| 5.0 | 4.75 | 4.55 | 4.47 | 4.98 | 12.37 | 3.82 | 4.91 | 4.86 | 2.65 | 0.94 | 0.99 |
| 6.0 | 3.93 | 5.39 | 4.64 | 5.01 | 10.24 | 4.45 | 5.02 | 4.95 | 3.15 | 0.93 | 0.99 |
| 7.0 | 3.40 | 6.22 | 4.78 | 5.02 | 8.87 | 5.05 | 5.10 | 4.99 | 3.63 | 0.88 | 0.99 |
| 8.0 | 3.05 | 7.03 | 4.90 | 5.04 | 7.91 | 5.64 | 5.17 | 5.00 | 4.11 | 0.82 | 0.99 |
| 9.0 | 2.79 | 7.83 | 5.00 | 5.05 | 7.22 | 6.20 | 5.21 | 5.01 | 4.59 | 0.73 | 0.99 |
| 10.0 | 2.58 | 8.61 | 5.08 | 5.06 | 6.70 | 6.75 | 5.27 | 5.02 | 5.07 | 0.61 | 0.99 |
| 11.0 | 2.43 | 9.39 | 5.16 | 5.05 | 6.30 | 7.05 | 5.27 | 5.24 | 5.45 | 0.35 | 0.64 |
| 12.0 | 2.30 | 10.17 | 5.22 | 5.05 | 5.99 | 7.27 | 5.28 | 5.22 | 5.55 | 0.20 | 0.38 |
| 14.0 | 2.10 | 11.70 | 5.34 | 5.06 | 5.52 | 8.04 | 5.36 | 5.24 | 6.11 | 0.21 | 0.19 |
| 16.0 | 1.95 | 13.20 | 5.43 | 5.06 | 5.18 | 8.84 | 5.39 | 5.25 | 6.79 | 0.24 | 0.22 |
| 18.0 | 1.84 | 14.69 | 5.51 | 5.07 | 4.92 | 9.62 | 5.42 | 5.25 | 7.42 | 0.25 | 0.23 |
| 20.0 | 1.70 | 16.23 | 5.58 | 5.12 | 4.72 | 10.39 | 5.47 | 5.30 | 8.01 | 0.26 | 0.25 |
| 25.0 | 1.59 | 19.68 | 5.71 | 5.12 | 4.35 | 12.53 | 5.61 | 5.34 | 9.76 | 0.25 | 0.22 |
| 30.0 | 1.49 | 22.85 | 5.81 | 5.12 | 4.08 | 14.81 | 5.72 | 5.37 | 11.63 | 0.25 | 0.21 |
| 40.0 | 1.37 | 29.48 | 5.98 | 5.13 | 3.74 | 19.55 | 5.89 | 5.40 | 15.67 | 0.27 | 0.19 |
| 50.0 | 1.29 | 36.32 | 6.11 | 5.13 | 3.52 | 24.48 | 6.02 | 5.42 | 20.00 | 0.32 | 0.18 |
| 60.0 | 1.24 | 43.25 | 6.21 | 5.14 | 3.36 | 29.53 | 6.13 | 5.42 | 24.31 | 0.38 | 0.17 |
| 70.0 | 1.20 | 50.26 | 6.30 | 5.14 | 3.25 | 34.66 | 6.21 | 5.42 | 28.81 | 0.46 | 0.16 |
| 80.0 | 1.17 | 57.32 | 6.37 | 5.14 | 3.16 | 39.83 | 6.29 | 5.40 | 33.38 | 0.53 | 0.16 |
| 90.0 | 1.15 | 64.25 | 6.43 | 5.14 | 3.09 | 45.04 | 6.35 | 5.34 | 38.04 | 0.60 | 0.16 |
| 100.0 | 1.13 | 71.37 | 6.49 | 5.14 | 3.04 | 50.27 | 6.40 | 5.29 | 42.70 | 0.66 | 0.16 |
| 110.0 | 1.12 | 78.41 | 6.54 | 5.15 | 2.99 | 55.51 | 6.45 | 5.22 | 47.45 | 0.71 | 0.16 |
| 120.0 | 1.11 | 85.45 | 6.59 | 5.15 | 2.95 | 60.78 | 6.49 | 5.16 | 52.05 | 0.76 | 0.16 |
| 1.5*Nominal mass loss | |||||||||||
| 3.5 | 6.89 | 3.18 | 4.05 | 4.93 | 19.60 | 2.57 | 4.65 | 4.69 | 1.73 | 0.77 | 0.99 |
| 4.0 | 5.80 | 3.59 | 4.20 | 4.95 | 16.45 | 2.87 | 4.73 | 4.80 | 1.95 | 0.82 | 0.99 |
| 4.5 | 5.08 | 4.00 | 4.32 | 4.97 | 14.26 | 3.16 | 4.79 | 4.86 | 2.16 | 0.84 | 0.99 |
| 5.0 | 4.44 | 4.41 | 4.43 | 4.98 | 12.66 | 3.43 | 4.85 | 4.89 | 2.37 | 0.83 | 0.99 |
| 6.0 | 3.79 | 5.17 | 4.60 | 5.00 | 10.48 | 3.96 | 4.95 | 4.98 | 2.77 | 0.80 | 0.99 |
| 7.0 | 3.35 | 5.92 | 4.73 | 5.02 | 9.09 | 4.45 | 5.03 | 5.05 | 3.17 | 0.72 | 0.99 |
| 8.0 | 2.94 | 6.69 | 4.85 | 5.04 | 8.15 | 4.92 | 5.09 | 5.09 | 3.56 | 0.60 | 0.98 |
| 9.0 | 2.72 | 7.40 | 4.94 | 5.05 | 7.50 | 4.87 | 5.07 | 5.05 | 3.76 | 0.22 | 0.49 |
| 10.0 | 2.52 | 8.13 | 5.03 | 5.06 | 7.05 | 4.96 | 5.08 | 5.06 | 3.73 | 0.13 | 0.22 |
| 12.0 | 2.28 | 9.49 | 5.16 | 5.07 | 6.40 | 5.43 | 5.12 | 5.07 | 4.04 | 0.18 | 0.21 |
| 14.0 | 2.08 | 10.86 | 5.27 | 5.09 | 5.97 | 5.86 | 5.18 | 5.15 | 4.40 | 0.19 | 0.22 |
| 16.0 | 1.96 | 12.14 | 5.36 | 5.10 | 5.64 | 6.34 | 5.20 | 5.15 | 4.79 | 0.18 | 0.21 |
| 18.0 | 1.86 | 13.43 | 5.44 | 5.11 | 5.38 | 6.84 | 5.26 | 5.16 | 5.19 | 0.18 | 0.20 |
| 20.0 | 1.80 | 14.36 | 5.49 | 5.11 | 5.16 | 7.39 | 5.29 | 5.17 | 5.62 | 0.18 | 0.19 |
| 25.0 | 1.65 | 16.82 | 5.60 | 5.12 | 4.74 | 8.85 | 5.38 | 5.18 | 6.78 | 0.18 | 0.18 |
| 30.0 | 1.55 | 19.45 | 5.70 | 5.12 | 4.43 | 10.41 | 5.48 | 5.18 | 8.01 | 0.18 | 0.17 |
| 35.0 | 1.48 | 22.21 | 5.79 | 5.13 | 4.20 | 12.04 | 5.58 | 5.18 | 9.34 | 0.18 | 0.16 |
Note. — Ages, masses, luminosities, and effective temperatures when helium has half burned (“He/2”) and when carbon (first 8 lines) or oxygen (the rest of the table) ignites. The oxygen ignition values are also essentially the presupernova star properties. is the carbon oxygen core mass; , the remaining mass of helium in the star; and the surface helium mass fraction.
3.3. = 60 - 120 ; Pulsational Pair-Instability Supernovae and Black Holes
For the standard choice of mass loss rates (equation 3), the pair instability is first encountered for the 60 model. At the time of the instability (carbon depletion) the core has shrunk to 29.53 and consists mostly of oxygen and heavy elements. Helium has a small surface abundance, 0.16 by mass fraction, and the total mass of the star is small (Table 4). As with models having similar core mass in the study of Woosley (2017) (see his Table 1), the instability in these lighter cores is a weak one, occurring at late times in the oxygen burning shell, and resulting in the low energy ejection of only a few hundredths of a solar mass. The onset of the instability occurs at smaller masses here than in the earlier study because of the larger effective CO-core mass (Fig. 7). As Woosley (2017) pointed out, the strength of the pair instability is most sensitive to the CO-core mass.
The instability continues to be weak and brief for helium stars up to about 75 (final mass 37 ). The instability happens at late times in the oxygen burning shell after a silicon core has already formed in hydrostatic equilibrium and the total energy of the ejecta is less than 1050 erg. These low energy, small ejecta mass, and small radii models will not make luminous supernovae, but if the core collapses uneventfully to a black hole, the small amount of mass ejected may be the only optical display of their death. Their transients will be brief, faint, and very blue (see Woosley (2017) and §5). If, on the other hand, collapse leads to an explosive event, these small masses at radii 1012 to 1013 cm may enable a bright collisionally-powered supernova. The light curves for the heavier more energetic models would be similar to those already published by Woosley (2017).
| E | ||||||
|---|---|---|---|---|---|---|
| [] | [] | [sec] | [1050 erg ] | [] | [] | [] |
| 60 | 29.53 | 6.4(4) | 0.015 | 0.02 | 29.51 | 2.32 |
| 62 | 30.56 | 6.1(4) | 0.020 | 0.05 | 30.51 | 2.36 |
| 64 | 31.57 | 5.8(4) | 0.022 | 0.07 | 31.50 | 2.49 |
| 66 | 32.60 | 5.7(4) | 0.030 | 0.10 | 32.50 | 2.55 |
| 68 | 33.63 | 5.8(4) | 0.038 | 0.18 | 33.45 | 2.67 |
| 70 | 34.66 | 6.7(4) | 0.060 | 0.43 | 34.23 | 2.84 |
| 75 | 36.83 | 8.0(4) | 0.36 | 0.66 | 36.17 | 2.95 |
| 80 | 39.38 | 4.1(5) | 1.5 | 1.95 | 37.43 | 3.22 |
| 85 | 41.95 | 9.4(5) | 4.6 | 3.78 | 38.17 | 2.99 |
| 90 | 44.54 | 2.3(6) | 5.6 | 5.78 | 38.76 | 2.62 |
| 95 | 47.13 | 1.1(7) | 5.8 | 6.37 | 40.76 | 2.52 |
| 100 | 49.75 | 1.1(8) | 5.7 | 7.15 | 42.60 | 2.73 |
| 100* | 50.22 | 8.6(7) | 4.1 | 7.29 | 42.93 | 2.22 |
| 105 | 52.24 | 9.1(9) | 5.2 | 7.21 | 45.03 | 1.73 |
| 105* | 52.82 | 7.6(9) | 3.1 | 6.83 | 45.99 | 2.04 |
| 110 | 54.79 | 5.8(10) | 5.2 | 10.57 | 44.22 | 2.58 |
| 110* | 55.43 | 7.3(10) | 5.9 | 10.63 | 44.80 | 2.14 |
| 115 | 57.42 | 1.5(11) | 14.8 | 16.07 | 41.35 | 2.63 |
| 120 | 60.12 | 1.2(12) | 35.6 | 56.61 | 3.51 | 1.76 |
Note. — is the time between the onset of the first pulse and core collapse. is the total kinetic energy of all mass ejected in units of 1050 erg. Models 105*, 110*, and 115* were run using large networks coupled directly to the burning, but are otherwise like Models 100, 105, and 110. These and all other unstarred models used the approximation network and quasi-equilibrium assumption.
Moving on up in mass, one encounters PPISN of increasing duration and energy that resemble the helium stars of constant mass studied by Woosley (2017). The final mass is offset by about 5% due to the larger CO-core. For example, Woosley (2017) found the maximum helium core mass that made a PPISN rather than experiencing complete disruption in a single pulse (PISN) was about 63 . Here the equivalent value is 60 (Table 5). The maximum remnant mass, 46 , is also lighter. This would be the best current estimate for the onset of the black hole mass gap that might be detected by gravitational radiation experiments. It is considerably smaller than the 52 value given by Woosley (2017) and 50 given by Belczynski et al. (2016). The larger values were for single stars. For helium stars, there is no hydrogen envelope to tamp the explosion and cause more material to fall back. The CO core is also larger in the new models.
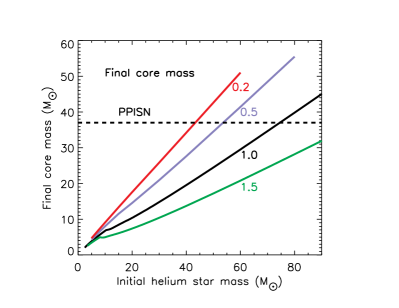
For the standard mass loss rate, the strong pulsational pair instability is first encountered for a final core mass of 37 , (Table 5) which corresponds to an initial helium core mass near 75 . Using equation 5, this corresponds approximately to a star whose main sequence mass was 160 . Reductions in the mass loss rate result in the instability being encountered at lower masses. The reduction may either be because the standard rate assumed for solar metallicity stars here is too large (Vink, 2017), or because of reduced metallicity. Though metallicity scaling is given in equation 1 and equation 2, the exponent is uncertain (Eldridge & Vink, 2006).
An additional 18 models were calculated with initial masses between 5 and 80 . Half of these used a mass loss rate 50% of standard and half used 20%. The results from this sparse grid are displayed along with the more densely sampled grids with normal and 1.5 times normal mass loss in Fig. 8. Reducing the mass loss by a factor of two results in a strong pulsational pair-instability (final mass over 37 ; Table 5) being encountered for an initial helium core mass of only 52 . Reducing the standard mass loss by only a factor of two would allow a 110 star, either single or in a binary system, to become a PPISN.
The fraction of mass lost for high mass helium stars where the luminosity is almost linear in the mass and the lifetime approaches years (i.e., the Eddington limit) is
| (15) |
where F is the factor by which the overall mass loss is multiplied. For example, at F = 1 the star loses half its mass.
4. Presupernova Properties
4.1. Surface Composition
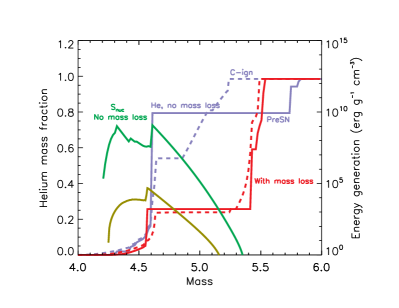
Winds remove the surface layers of the star ultimately revealing what lies beneath. Initially that material consists of almost pure helium, but as mass loss reveals the products of helium burning, a variable amount of carbon and oxygen appear. None of the stars here were so extreme as to lose all their helium. The mass loss occurs mostly during helium core burning, and the outer edge of the convective core recedes as mass is lost, leaving behind a gradient of helium. Table 4 and Fig. 9 show that the surface consists of helium and nitrogen until some critical mass is reached, about 11 (final mass 7 ) for the nominal mass loss case and 9 (final mass 4.9 ) for a loss rate that is 1.5 times higher. Fig. 9 here is very similar to Figure 7 of Yoon (2017).
As Yoon (2017) points out, the higher mass limit is inconsistent with the observed luminosity of the faintest WC/WO stars and this argues for mass loss rates greater than the standard value used here. On the other hand, Yoon (2017) and McClelland & Eldridge (2016), argue that the temperatures of observed Wolf-Rayet stars are cooler than the models unless a low mass loss rate is used. Vink (2017) also predicts mass loss rates that are substantially smaller even than the standard one used here. He gives
| (16) |
For solar metallicity and a 6 star, for example, with log L/= 4.64 (Table 4), this expression gives 10-7 y-1, whereas eq. (2) gives a value 10 times larger.
In this paper, most models use the standard value of Yoon (2017). As we shall see (§5.1), however, a larger value may also be needed to produce Type Ic supernovae if their progenitors must have mass total less than 6 , but lose their helium-rich layers before exploding. There too is an issue of whether mixing or mass loss is the essential ingredient in making a Type Ic.
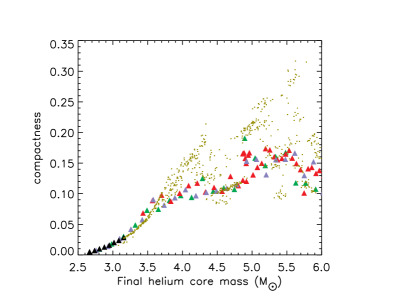
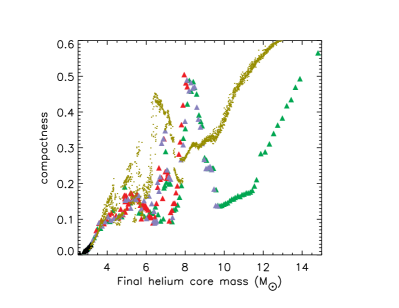
4.2. Compactness
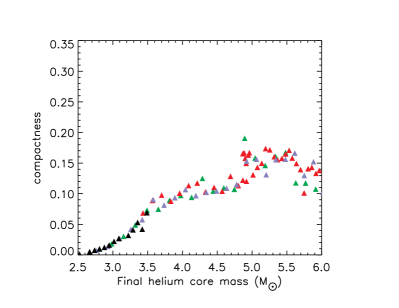
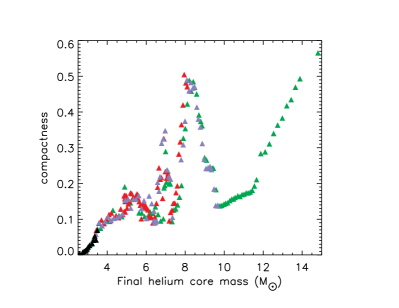
Fig. 10 shows the compactness parameter (O’Connor & Ott, 2011)
| (17) |
as a function of final core mass for a variety of presupernova models. is customarily evaluated at M = 2.5 and denoted . In the figure, black points are for models with initial masses 3.2 to 4.5 which have final masses 2.59 to 3.49 (Table 4). These are in turn derived from stars whose original main sequence masses were 13.8 to 15.6 . For lighter stars, the final mass is less than 2.5 and is undefined, though it approaches zero. The lighter models (above 2.5 ) were evolved to the presupernova state using the large nuclear reaction network to calculate energy generation, neutrino losses, and neutronization. Normal mass loss was assumed. Fine surface zoning was employed, down to , and a relatively small boundary pressure, 104 dyne cm-2, was employed.
Green points in Fig. 10 also assumed the standard mass loss rate, but used a combination of the approximation network and quasiequilibrium network. Surface zoning was coarser than for the black points with finest zones near 10-7 . A surface boundary pressure 108 dyne cm-2 was used. Blue points are for a more limited survey that used similar resolution, but slightly reduced boundary pressure, 107 dyne cm-2. Red points came from a similar survey to the green points, but with 1.5 times the mass loss rate (see Table 4). Good agreement among different sets evolved with different physics where they overlap in presupernova mass suggests the robustness of the pattern.
The overall behavior is less chaotic than found by Sukhbold & Woosley (2014) and Sukhbold et al. (2018) for stars in this mass range (see Fig. 8 of Sukhbold et al. (2018) for final helium cores from 3.5 to 6 ). Though clearer evidence might emerge with a greater number of models, there is less indication here of multiple solutions for a given final mass, especially branches with high compactness parameters. In general, the models, especially the lower mass ones, look more likely to explode. Helium cores up to 6.0 in final mass have . A final helium core mass of 6.2 corresponds to an initial mass of 9.0 (Table 4) which in turn corresponds to a main sequence mass of about 30 . The helium core at death for a 30 star that did not lose its entire envelope would have been 10 (Fig. 1) and would have had (Sukhbold et al., 2018). Such a large difference will very likely affect whether the star explodes or not. Stars evolved in mass exchanging binaries have very different deaths than single stars of the same initial mass.
Most striking is the absence of models with compactness for presupernova masses less than 6 . In Sukhbold et al. (2018), there were many models with between 0.17 and 0.3 for helium core masses around 4.5 to 6.0 (see their Fig. 6). These might have provided a population of low mass black holes. While a single parameter characterization cannot substitute for a full study of core collapse, is known to correlate well with other more physical measures of explodability (Ertl et al., 2016; Sukhbold et al., 2018), as well as with the results of simple 1D neutrino transport calculations (Sukhbold et al., 2016). It thus seems likely that the distribution of black hole masses will be different for binaries and single stars. Since all mass measurements of black hole masses are made in binaries, usually with a history of interaction, this has important implications. The peak in compactness where a large number of black holes are likely to be born is also shifted slightly upwards. in Sukhbold et al. (2018) the peak was centered at helium core masses of 7 . Here it is at 8 .
Why are the results so different, even when compared for the same final helium core masses? Several factors contribute. First, a helium core inside a massive star has different boundary conditions since the former is bounded by a dense, hot hydrogen burning shell and the latter is not. The helium core in a star that still has its hydrogen envelope is arbitrarily defined as where the hydrogen mass fraction first goes below 0.01 moving inwards. Typical temperatures for that shell during helium burning inside a massive star are near , and the pressure is a few times 1016 dyne cm-2. In bare helium stars, such conditions are usually achieved a few tenths beneath the surface. Helium cores in massive stars, so defined, evolve like slightly heavier bare helium cores.
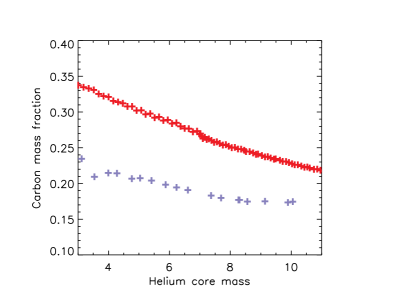
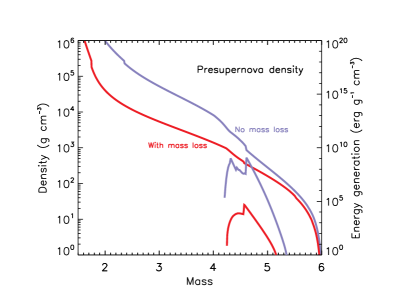
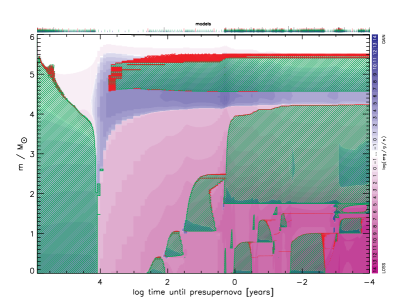
Second, and more importantly, the carbon mass fraction at carbon ignition is substantially higher in the mass-losing helium stars than in in the mass-gaining helium cores of massive hydrogenic stars (Fig. 11). Inside a massive star, the helium core grows because of mass processed through the hydrogen burning shell. As it grows, the extent of the central convective core also increases (Fig. 3 of Woosley et al., 2002). Thus, at late times, extra helium is mixed into the burning region, turning more carbon to oxygen. In a mass-losing star, the opposite occurs. The convective core recedes (second panel of Fig. 12) leaving behind a gradient in the carbon abundance with a larger abundance resulting from less destruction by 12C(O. This larger carbon abundance has a substantial impact on the presupernova core structure. As previously noted (Barkat, 1994; Timmes et al., 1996; Sukhbold & Woosley, 2014), a major change in core structure happens when the star transitions from burning carbon in its center convectively to burning it radiatively. For single stars, this occurs near 20 , or for a final helium core mass of 6.2 . For the mass losing helium stars, the transition is pushed up to 7.2 . A similar shift would occur for a smaller rate for the 12C(O reaction (see Fig 24 of Sukhbold & Woosley, 2014). Here we use an S-factor at 300 keV of 165 keV barns, which is within the current experimental error bar, but could be slightly high (deBoer et al., 2017).
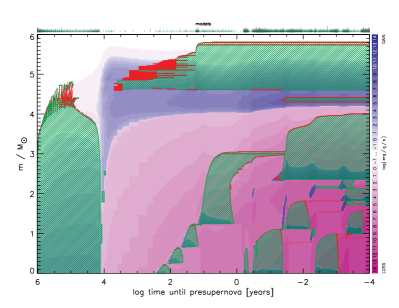
Finally, the outer structure of the helium core, and thus the strength of its helium burning shell are different when the core loses mass. A set of 22 helium stars from 3.5 to 14 was evolved without mass loss. The compactness plot (not shown) in Fig. 10 would be about half way between the Sukhbold et al. (2018) set and the present study. In Table 4.2, a subset of these is compared with their counterparts in the mass losing set that ended up with the same final helium core mass. The final mass of the carbon-depleted core () and compactness parameter, , are given. For comparison, the ONe-core masses and compactness parameters are given for seven equivalent mass-losing stars from the standard set. These stars began their lives as much heavier helium stars, , but ended with final masses, , very close to those of the stars evolved at constant mass. The compactness parameters are systematically lower and less variable than for the constant mass stars.
Fig. 12 shows the convective history and presupernova structure for two of the models in Table 4.2, both of which ended their lives with a mass very near 6.0 . Neither star changed its total mass appreciably after carbon ignition. In the mass losing 8.63 model, a strong, coupled carbon, oxygen, and neon burning shell ignites at 1.75 about a year before the explosion. This burning expands the overlying material making the radius at 2.5 larger, i.e., the compactness parameter smaller. In the constant mass star, a similar shell ignites at 2.36 , but only about a week before the explosion. This burning is too late and too far out to greatly affect the radius at 2.5 and the star dies with a large compactness parameter.
As to why this difference exists, it may have to do with the modulation of the helium burning shell which sets the boundary condition for the core. Fig. 12 shows that while the mass-losing cores initially produce larger CO cores, the helium stars evolved without mass loss develop deeper, stronger helium burning shells in their later evolution that modulate the presupernova density structure.
4.0 & 1.78 0.132 5.25 3.98 1.76 0.097
4.5 1.86 0.162 6.125 4.52 1.71 0.109
5 1.81 0.129 7.00 5.04 1.83 0.159
5.5 2.00 0.200 7.875 5.56 1.87 0.167
6 2.35 0.265 8.625 5.98 1.75 0.102
6.5 2.18 0.180 9.625 6.54 2.02 0.127
7 2.51 0.285 10.75 6.95 2.31 0.194
Note. — The first three columns give the constant mass of the models evolved without mass loss, the location of the combined neon and carbon burning shells in the presupernova star, and the compactness parameter. The next four columns give similar information for the models evolved with mass loss. is the presupernova mass, chosen to be close to that of the models with no mass loss.
5. Light Curves
5.1. Type Ib and Ic
Given the broad range of masses explored, a great variety of supernova light curves are possible. These include essentially all Type I supernovae that do not have rotationally powered light curves and are Type Ia. Some models resemble closely those already in the literature and will have similar observable properties. Based upon Fig. 10, it is expected that most models with final masses up to 6 will explode and leave neutron star remnants. This includes stars with initial helium core masses up to 9 (Table 4) and thus main sequence masses up to 30 . For final masses below about 2.0 , the core is so compact that both the explosion energy and 56Ni production probably decline below what is needed for typical Type Ib and Ic supernovae (Sukhbold et al., 2016). This leaves the 2 to 6 as the likely presupernova mass for common Ibc supernovae. Previous studies of models in this mass range have shown good agreement with observations (Dessart et al., 2012, 2016). The transition from Ib to Ic for progenitor masses around 5 with residual helium masses of found by Dessart et al. (2015) is in reasonable accord with Table 4 which shows the CO-core being uncovered for final masses above 5 for the 1.5 times standard mass loss cases. Residual helium in the present models is . Pending further study, this might be supportive of the higher mass loss rate.
The progenitor of Type Ib supernovae iPTF13bvn was inferred to have a mass at death near 3.5 (Bersten et al., 2014; Eldridge et al., 2015). A final mass of 3.5 corresponds to present models with initial helium cores masses 4.5 - 5 (Table 4). These would have come from main sequence stars of about 20 and would have log luminosity and temperature 4.85 and 4.75 respectively. This is within the allowed observational range (Fig. 1 of Eldridge et al., 2015).
An island of possible Ib or Ic supernovae with progenitor masses near 10 - 12 is also noted, but these will be rarer and probably have broader fainter light curves due to their slower expansion speed. Most of the stars with final masses between 7 and 30 will produce black holes.
For final masses above 30 , and especially above 37 , PPISN result. For a given final mass, the light curves should be similar to those calculated for helium stars evolved without mass loss by Woosley (2017).
5.2. Low mass models with radius expansion
Some models are sufficiently different from those already published to be worthy of immediate attention. Chief among these are the low mass stars with extended envelopes and the stars that experience silicon flashes (see also Kleiser et al., 2018, for more realistic transport studies of similar parametrized models).
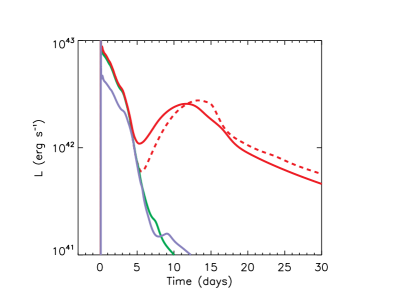
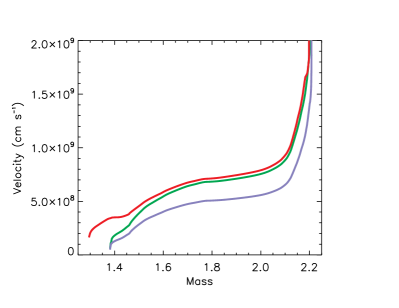
Typical of stars that have large radii as presupernovae, but have not experienced a strong silicon flash, is the 2.7 model (Table 3) which has a presupernova mass of only 2.21 . Assuming that its envelope was not lost to the binary companion during the second phase of expansion, the presupernova star had a radius of cm. Two explosions were introduced in this model using pistons at 1.29 and 1.38 . The smaller piston mass was at the edge of the iron core; the larger, where the entropy per baryon was = 4.0. Explosion energies of 2.6 and 4.7 erg, as measured by the kinetic energy of ejecta at infinity, were generated for the mass cut at 1.38 and one with explosion energy erg for the mass cut at 1.29. These limits on piston mass were chosen to approximate the minimum and maximum 56Ni production. The explosions with the piston farther out produced very little 56Ni, 0.0025 and 0.0029 for the low and high explosion energy respectively. The deeper piston produced 0.071 . This is an upper bound since ejecting neutronized iron from deeper in would not increase 56Ni production. More realistic explosion models usually produce less (Sukhbold et al., 2016). A version of the high nickel yield model was also calculated in which the ejected composition was moderately, but artificially mixed.
Fig. 13 shows the results. All explosions exhibit an initial peak lasting about 4 days. More energetic explosions are brighter, as expected from scaling laws for Type IIP supernovae (Sukhbold et al., 2016). A larger radius would also give a brighter initial explosion, but larger radii were not found for models that did not experience silicon flashes (Fig. 5). The envelope would also be in greater danger of being lost to the companion. Effective temperatures on days 0.5, 1, 3 and 5 for the higher energy model were 33,000, 23,000, 13,000, and 10,500 K, so this would be a very blue transient. Velocities are typically around 5000 km s-1 for the less energetic model and 7000 km s-1 for the more energetic one (Fig. 13). Most of the mass exterior to 1.46 is helium, with about 10% by mass of carbon and oxygen from a prior helium burning shell extending to 1.82 . Matter interior to 1.46 is mostly oxygen with traces of heavier freshly synthesized elements, notably silicon, magnesium, and 56Ni. There is also, of course, a primordial abundance of all elements characteristic of solar metallicity in the ejected helium.
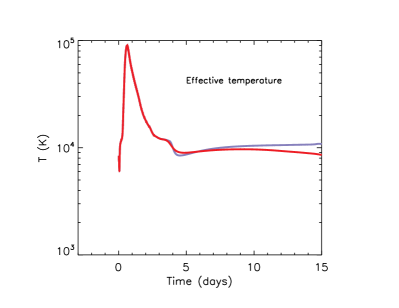
After the first week, the display, in those models that make appreciable 56Ni, is dominated by its decay. In models without mixing this decay produces a pronounced secondary maximum with luminosity roughly proportional to nickel mass. The effective temperature at these later times is not well determined in the KEPLER code, but is estimated to be about 7000 K after the first week. With a moderate amount of mixing (helium mixed to a mass fraction of 0.3 at the bottom of the ejecta and 56Ni exceeding 0.01 out to 1.95 ), the minimum between the two peaks is eroded.
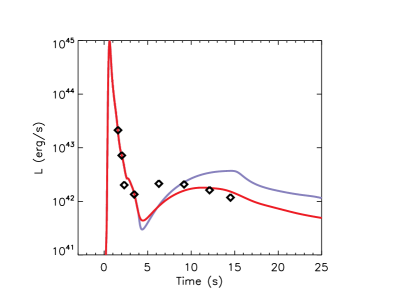
Recently De et al. (2018) have reported observations of SN 2014ft, a Type Ic supernova that they attribute to an “ultra-stripped” helium star in a binary system. This will be discussed further in §5.3, but the models here also bear a superficial resemblance to that event. The observed light curve is initially very blue, evolves rapidly, and has two peaks. The initial peak was brighter than 1043 erg with a temperature greater than 32,000 K, but declined within a day to 10,000 K and luminosity of approximately erg s-1. Over the next 6 days the supernova rebrightened to over erg s-1 while the temperature remained near 10,000 K. Velocities in the second peak were km s-1 and the spectrum showed lines of helium and carbon.
Compared with the 2.7 model (Fig. 13), temperatures, velocities, composition, and even the bolometric light curve agree qualitatively. The initial peak in SN 2014ft was much briefer though, and brighter than the model. The secondary peak also occurred earlier. A model with a larger radius and greater explosion energy would have had a brighter first peak and one with a smaller ejected mass would have evolved more quickly. For the opacities, mass loss, and zoning employed here though, a radius much greater than 100 is unlikely for models that avoid becoming SAGB stars (Fig. 5). Explosion energies much greater than erg are also not expected for stars in this mass range (Sukhbold et al., 2016). A larger explosion energy would also give greater velocities than observed. The observed initial luminosity is thus problematic, though perhaps only by a factor of two. A smaller ejected mass is certainly possible and could be obtained by modestly altering the uncertain mass loss rate or removing only part of the envelope in a final binary interaction. All in all, the model seems promising and worth further exploration. It is similar in properties to the one suggested by De et al. (2018), but somewhat simpler in that it is the first supernova in the binary that makes SN 2014ft, not the second (see their Fig. 6), and all that has been assumed is that a main sequence star of about 14 lost its envelope to a companion when it ignited helium burning.
5.3. Silicon deflagration
Some low mass models may have experienced explosive mass ejection due to silicon deflagration or detonation a few weeks prior to their final explosion (§3.1.2). Here the major uncertainty is how much silicon burns promptly (on a sonic crossing time for the dense core) to iron in the runaway. The greater the speed of the mass ejection, the farther this matter travels before the iron core finally collapses and launches a second, more powerful shock. Ejected envelopes that expand to 1014 - 1015 cm before core collapse give very luminous, long lasting secondary explosions, even for supernovae with low kinetic energies. Those that eject less mass and spread to cm give fainter, briefer ones. If very small mass of silicon burns, less than 0.1 , too little mass is ejected too slowly to greatly modify the light curve of the terminal explosion. The small mass falls back or is overtaken by the terminal shock long before the supernova becomes bright.
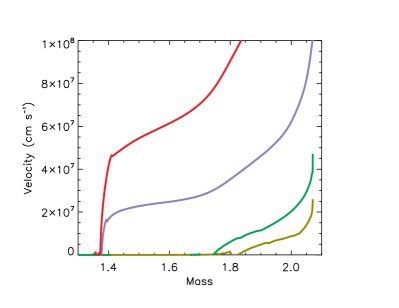
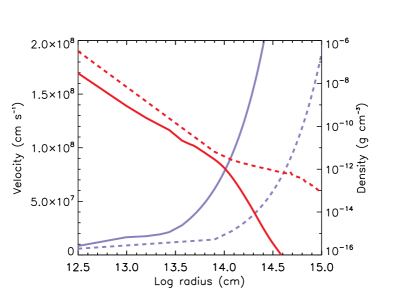
Table 7 shows some results for specific cases. Four presupernova models based on the 2.5 progenitor each had a total mass of 2.07 at the time of their initial instability. Since a remnant of is left by the explosion and additional matter is ejected by the silicon flash, the amount left to be ejected in the final explosion is small. Silicon deflagrations are parametrized by the amount of silicon that burns to iron in the runaway, an adjustable parameter in this study. Since the deflagration ignites far off center in this model (at 0.49 ), and only matter external to the ignition point burns in the initial flash, the amount of silicon that can burn is limited. The most energetic model considered burned 0.294 . On the other hand, about 0.1 of silicon must burn to cause a large amplitude oscillation of bound core and launch an appreciable shock. This determined the least energetic case considered. Typical ejection speeds were 100 km s-1 to 800 km s-1 (Model 2.5D) though higher speeds were present in both (Fig. 14). In Model 2.5A, the ejecta had not reached terminal speed, and some would have fallen back had the supernova not exploded first. For Models 2.5C and 2.5D the entire envelope was ejected.
Table 7 also shows that, usually, the more powerful the silicon flash, the longer the wait until iron-core collapse. Times varied from 19 to 62 days. During this time the ejected or partly ejected envelope expanded to a few cm (Model 2.5A) to 1015 cm (Model 2.5D).
| [] | [] | [] | [] | [day] | [] | [] | [1051 erg] | [] |
|---|---|---|---|---|---|---|---|---|
| 2.5A | 2.07 | 0.102 | 0.11 | 27 | 1.29 | 1.29 | 0.34 | 0.04 |
| 2.5B | 2.07 | 0.124 | 0.25 | 19 | 1.29 | 1.29 | 0.32 | 0.04 |
| 2.5C | 2.07 | 0.171 | 0.70 | 20 | 1.29 | 1.34 | 0.13 | 0.01 |
| 2.5D | 2.07 | 0.294 | 0.70 | 50 | 1.22 | 1.30 | 0.22 | 0.01 |
| 2.7A | 2.21 | - | - | - | 1.29 | 1.38 | 0.26 | 0.0027 |
| 2.7B | 2.21 | - | - | - | 1.29 | 1.38 | 0.47 | 0.0024 |
| 2.7C | 2.21 | - | - | - | 1.29 | 1.29 | 0.52 | 0.071 |
| 2.7Cm | 2.21 | - | - | - | 1.29 | 1.29 | 0.52 | 0.071 |
| 3.0A | 2.45 | 0.446 | 0.73 | 62 | 1.32 | 1.40 | 0.25 | 0.01 |
| 3.0B | 2.45 | 0.446 | 0.73 | 62 | 1.32 | 1.40 | 0.42 | 0.01 |
| 3.0C | 2.45 | 0.446 | 0.73 | 62 | 1.32 | 1.32 | 0.86 | 0.06 |
| 3.2A | 2.59 | 0.138 | 0.016 | 15 | 1.36 | 1.36 | 0.97 | 0.10 |
| 3.2B | 2.59 | 0.138 | 0.016 | 15 | 1.36 | 1.36 | 0.97 | 0.05 |
| 3.2Bm | 2.59 | 0.138 | 0.016 | 15 | 1.36 | 1.36 | 0.97 | 0.05 |
Note. — A suffix “m” indicates a model that was artificially mixed. All models except the 2.7 experienced a silicon deflagration with mass ejection as indicated. .
Following iron-core collapse, terminal explosions were introduced in each model using a piston, , to generate a final kinetic energy of (Table 7). In those cases with low energy flashes where radioactivity might contribute substantially to the light curve, the piston was situated as deeply as possible, at the edge of the iron core, and a moderately high explosion energy was invoked. This resulted in the synthesis of 0.05 to 0.1 of 56Ni, a rather standard amount of 56Ni for Type Ib and Ic supernovae. For other models (2.5C, 2.5D, 3.0A, 3.0B) the piston was placed where the entropy rose to = 4, a standard value often used to describe the mass cut in core collapse supernovae. This was well outside the iron core where the density was lower. As a result, only a small amount of 56Ni was synthesized (Table 7).
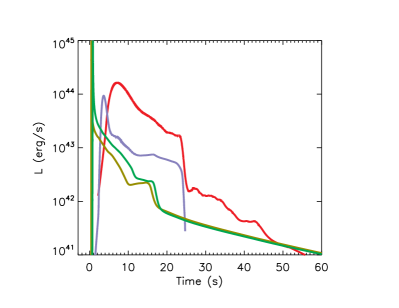
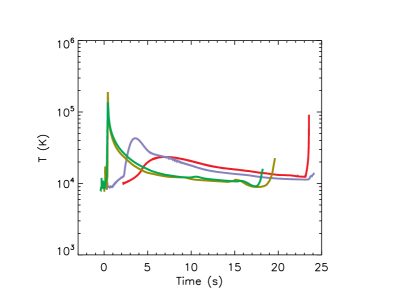
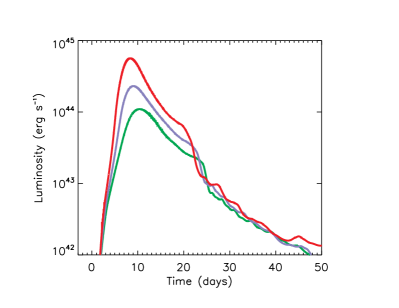
The impact of this piston-ejected mass with the previously ejected envelope had dramatic consequences for the light curve that were most sensitive to the mass of the previously ejected shell and its radius. For the 2.5 models (Fig. 14), the time the light curve stayed near its peak value varied from days to weeks. While the approximate nature of the effective temperature is to be emphasized for a single-temperature code, these are all very blue transients. The brightest events which peaked later had the cooler temperatures, 43,000 K and 23,000 K for Models 2.5C and 2.5D respectively. Still cooler temperatures might have been obtained had the ejected shell been at larger radius.
The sharp falloff in luminosity around 25 days in Models 2.5C and 2.5D occurs as the shock reaches the edge of the shell ejected by the silicon flash and the supernova becomes optically thin. In a sense, these very luminous displays are simply an extension of supernova shock break out as the high velocity ejecta interacts with the circumstellar medium. The photosphere remains outside of the shock until the shock exits the shell, and light diffuses ahead of it. The main source of energy is circumstellar interaction and the radiating region piles up, in the 1D code, in a very thin shell. These light curves are thus also similar to what has been seen for CSM interaction before, e.g., in PPISN (Woosley, 2017).
The faster evolving Models 2.5A and 2.5B, on the other hand, have light curves that, even by day 1, are dominated by diffusion from the shock-heated layers well inside the shell ejected in the flash. The decline rate thus reflects their large initial radius, which even before the silicon flash, was cm, and not so much the mass or energy of the previously ejected shell. A much higher energy explosion would be required for Models 2.5A or 2.5B to decline more quickly. Even before the silicon flash, these models had large radii.
Two other models explored the consequences of silicon deflagration in more massive stars (Table 3). A low energy deflagration in the 3.2 model ejected only 0.02 with energy erg. When the iron core collapsed 15 days later, this matter, with characteristic speeds less than 1000 km s-1 was still within 1014 cm. A simulated explosion with the piston located just outside the iron core at 1.36 with kinetic energy erg gave the light curve in Fig. 15. The initial transient is again essentially shock break out with circumstellar interaction. Matter is piles up in a thin shell beneath ionized matter that is optically thick. Radiation diffuses ahead. The bright emission ceases when the shock reaches the edge of the shell. Substantial radioactivity was produced in Model 3.2A (Table 7) and this powers a bright secondary peak at about 10 days. Due to the uncertainty in where to put the mass cut, the nickel mass was varied. Model 3.2B (red line in the figure) shows the effect of moderately mixing the ejecta and dividing the 56Ni mass by two.
The similarity of this model to the observed properties of SN 2014ft (iPTF14gqr De et al., 2018) is striking and better than for the 2.7 models. Indeed its discoverers proposed a silicon flash as a possible explanation in their paper. At the time of their first observation, the supernova had cooled to 32,000 K with a luminosity of erg s-1. Here that luminosity occurs on the fading tail of a much brighter hotter event when the age of the supernova is 1.6 days and the temperature is 26,000 K. The temperature at the second peak, 10,000 K, and its luminosity, about erg s-1 also agree with SN 2014ft, but the maximum occurs substantially later, at about 11 days post explosion vs 7 days in the observations. This is because of the larger mass of ejected helium and heavy elements in the present model, 1.21 as opposed to the 0.3 estimated by De et al. (2018). One could vary parameters in order to obtain a better match, but until an actual explosion model is available, this would just duplicate what De et al. (2018) have already done.
In the 3.0 models, the effect of more energetic silicon flashes was explored. More mass is ejected to larger radii and the final light curves are brighter. This is perhaps more natural than in the 2.5 models since the flash occurs closer to the center of the star and has the potential of burning more silicon to iron. Explosions with even mild kinetic energies produce very bright light curves in these models (Fig. 16). Varying the explosion energy and the location of the piston did not alter the light curve qualitatively, though larger explosion energies did modestly increase the peak luminosity. Because of the very strong circumstellar interaction, the production of even 0.06 of 56Ni in Model 3.0C had no discernible effect on the light curve. A broader light curve, more consistent with common superluminous Type I supernovae (GalYam, 2019), would be produced had the matter ejected by the silicon flash expanded farther. The amount of silicon burned in the flash is already maximal, but if the mass of the ejected envelope had been smaller, it would have acquired a larger velocity and expanded farther before core collapse. The time scale for silicon shell burning and flame propagation might possibly be lengthened by a factor of two. Models like 3.2 that burn a lot of silicon in the flash are thus worth further exploration as SLSN-I prototypes.
6. Conclusions
The evolution of mass losing helium stars with initial masses 1.6 to 120 has been surveyed with a sufficient number of models to determine the systematics of the supernovae and compact remnants they produce. The mass loss rates are those of Yoon (2017), with some variation to test the sensitivity of results. These stars are taken to represent the outcomes of mass exchanging binaries in which the helium core is uncovered near the time of helium ignition. That is, early Case B mass transfer is assumed to completely remove the hydrogen envelope. Alternatively such stars could be formed by chemically homogeneous evolution with only a small modification of composition, but not essential hydrodynamics.
| ZAMS | Initial | Pre-SN | |
|---|---|---|---|
| Star | He star | Mass | Characteristics |
| [] | [] | [] | |
| 13 | 2.4 | - | SAGB star, WD |
| 13 - 13.5 | 2.4 - 2.5 | 2.0 - 2.1 | SAGB star, rad-expansion |
| ECSN, fast SN Ib, little 56Ni | |||
| 13.5 - 16 | 2.5 - 3.2 | 2.1 - 2.6 | Si Flash, rad-expansion, |
| peculiar SN Ib | |||
| 16 - 30 | 3.2 - 10 | 2.6 - 7 | Ordinary SN Ib, Ic |
| 30 - 120 | 10 - 60 | 7 - 30 | Mostly BH, Massive SN Ic |
| 120 - 140 | 60 - 70 | 30 - 35 | Weak PPISN, BH |
| 140 - 250 | 70 - 125 | 35 - 62 | Strong PPISN, BH |
| 250 - 500 | 125 - 250 | 62 - 133 | PISN, no remnant |
| 500 | 250 | 133 | Black holes |
Note. — These are for non-rotating solar metallicity stars using the standard mass loss rate. The “Initial He star masses” correspond to section headers in §3 and §6. Equivalent main sequence masses are particularly uncertain at very high mass and crude estimates are given. The transition mass between NeO white dwarfs and electron-capture supernovae, shown here as initial helium core mass = 2.4 , is also very uncertain.
The evolution of such stars is qualitatively different from that of the helium cores inside single stars (Table 8; Pols & Dewi, 2002). For comparison, for single stars the main sequence mass range for ECSN and silicon flash supernovae would extend to 9 and 10.5 respectively (Woosley & Heger, 2015). Most normal Type IIP supernovae would come from stars lighter than 20 (Sukhbold et al., 2016); substantial black hole formation would start at 20 , followed by the possibility of black hole formation or Type Ic supernovae at higher masses, depending on mass loss and uncertain explosion physics.
These changes reflect chiefly the different relation between initial (main sequence) mass and final (presupernova) mass, and the larger fraction of the the presupernova star that is carbon and oxygen in the mass-losing models. Approximations are given relating the presupernova mass to both the initial helium core mass (eq. (11)) and the original main sequence mass (eq. (13)). For example, a 15 single star, when it dies, has a helium core of 4.3 . A 15 star in a binary that loses its envelope at helium ignition and experiences mass loss to a wind has a final helium core mass of only 2.4 . These lighter presupernova stars develop more compact structures (i.e., small compactness parameters; Fig. 10) and are probably easier to explode. A large fraction will have the right masses and structures to make Type Ib and Ic supernovae (§5). Others have unusual light curves that may or may not yet have been observed.
Particularly interesting are the light curves of low mass stars, those here with initial helium core masses between 2.5 and 3.2 (Table 7). These stars experience significant radius expansion after helium depletion (Fig. 5). A subset also experiences a violent silicon flash similar to that in the 10 single stars studied by Woosley & Heger (2015). When these stars explode, the larger radius leads to a bright, brief, blue display (Fig. 13) that lasts a few days to a week. The emission arises from the diffusion of shock deposited energy out of the ejected helium envelope. If the explosion makes substantial 56Ni, then the light curve may have two peaks, the second resembling a Type Ib supernova, but occurring somewhat earlier because of the low ejected mass. For those events that experience silicon deflagration a wide variety of light curves are possible (Fig. 14, Fig. 15, and Fig. 16), depending chiefly on the mass and radius of the shell ejected by the silicon flash (Table 7). Even a weak terminal explosion can give supernovae that would be classified as superluminous (SLSN-I; Fig. 16). A weaker flash can still cause radius expansion. Coupled with the production of 56Ni, an event resembling SN 2014ft (De et al., 2018) might be produced (Fig. 15, §5.3).
Several light curves might agree better with observations had the mass loss rate been higher. A lower mass helium envelope, given the same energy and time, would have expanded to larger radii and produced a longer, cooler transient more consistent with observed SLSN-I. A lower mass envelope would also decrease the wait for the second peak in Model 3.2. This would be more consistent with observations of SN 2014ft. The mass loss has to occur at the right time though, after the core structure has already been determined, or more mass loss will just shift the evolution downwards in mass and change its outcome. As Yoon (2017) has noted, a somewhat larger mass loss rate might also be more consistent with observations of WO stars (Fig. 9), producing them at lower mass. More mass loss would also decrease the mass of Type Ic supernova progenitors (§5.1).
Other conclusions are summarized by mass range (see also Table 8).
6.1. = 1.6 - 2.5
Stars in this mass range develop SAGB-like structures with low density helium envelopes surrounding dense cores that slowly grow as mass accretes through a stable, thin, helium-burning shell. Helium stars with initial masses below 2.5 also fail to ignite silicon burning (Table 2) and thus avoid iron-core collapse. Below 1.8 , even carbon burning does not ignite promptly following central helium burning. From 1.9 to 2.4 stars ignite carbon-burning off center, forming flames that eventually burn to the center of the star (Fig. 2). The subsequent evolution depends upon how much low density envelope is retained and burns though the thin shell.
If the envelope is lost to a companion when the star first expands and develops an SAGB-like structure, helium stars with initial masses below 1.9 end up as CO white dwarfs with masses up to 1.05 (Table 1). Stars from 1.9 to 2.4 become NeO white dwarfs, but can retain up to 0.1 of unburned carbon on their outsides (less for higher masses). This might be important if the star ever becomes a classical nova.
If the envelope is lost only to winds and not the companion, the core continues to grow until the envelope is gone or the star explodes. Carbon eventually ignites when the core mass approaches 1.26 , i.e., for all models with initial masses greater than 1.7 (Table 2). If this is the first time carbon has ignited, a flame might move to the center of the star producing a NeO white dwarf, or it may stall (Denissenkov et al., 2013; Farmer et al., 2015; Brooks et al., 2016). If carbon has already burned in the interior, then it ignites again, sometimes repeatedly as thick layers of carbon-rich ash accumulate beneath the thin helium shell. The critical mass for these carbon flashes decreases as the mass of the core grows and eventually, for the highest masses in this range, carbon burns steadily in a thin shell.
For this wind-dominated case, the 1.6 model is the heaviest to unambiguously make a CO white dwarf. Higher mass loss rates or late stage mass transfer would raise this limit. In principle, a CO white dwarf as massive as 1.26 could be created in a model that had not yet ignited carbon (e.g., the 1.7 model) and lost its envelope just as the core reached 1.26 . If the envelope is not lost in heavier models, the core ignites carbon at 1.26 and eventually grows to the Chandrasekhar mass, about 1.38 , producing an electron-capture supernova. This explosion would transpire in an extended red-giant like structure composed entirely of helium, and these Type I supernovae would have different properties from both Type IIP or Ib events (§5; Fig. 14). With no mass loss except winds, this would happen for all models between 1.9 and 2.5 , a broad range. In practice, the wind dominated case may only be appropriate for the more massive stars in this range. The radii of the 2.4 and 2.5 models at carbon ignition are relatively small (Table 1) and might not readily interact with a companion.
6.2. = 2.5 - 3.2
Off-center silicon ignition characterizes all models in this mass range. The 2.5 model is the lightest to experience iron-core collapse. It ignites silicon 0.504 off center (Table 3) under very degenerate circumstances. Depending upon the degeneracy and and offset of the ignition, the silicon flash develops into a violent runaway with properties that cannot be accurately represented in a one-dimensional study. Similar behavior was observed for the 3.1, 3.2, and 3.3 models where the temperature ran away to a peak value near K and initiated a deflagration or detonation (§3.1.2).
The explosive silicon burning does not unbind the core, but initiates a large amplitude oscillation that launches a shock into the helium envelope. Depending upon how much silicon burns, a parameter in these calculations, either a small fraction of the envelope may be ejected at a few hundred km s-1, or the entire envelope, with a speed of about 1,000 - 2,000 km s-1. After the oscillations damp, the remaining core evolves as in the lower mass stars. A silicon flame is kindled that burns to the center of the star. After a bit more silicon burning in a shell, the core collapses to a neutron star. Even the neutrino-powered wind from the proto-neutron star has the potential of creating a bright display when it runs into the ejected envelope in some of these models (§5.3; Fig. 16).
6.3. = 3.2 - 9
Common Type Ib and Ic supernovae should come from these stars. Presupernova masses range from 2.6 to 6 (Table 4). This is also the region where the greatest number of successful explosions might make appreciable 56Ni. Even should helium stars below 2.5 keep their envelopes until they die, the steep density gradient at their edges (Fig. 5) would preclude making much nickel. Stars in this mass range should be comparatively easy to explode (Fig. 10). Thus it is reassuring that this is also the mass range that produces explosions whose light curves and spectra agree with observations Dessart et al. (2012, 2015, 2016). A scarcity of Type Ib and Ic supernovae with final masses above 6 or 7 would be consistent with the lack of Type IIP progenitors with helium cores above 6 i.e., main sequence masses above 20 (Smartt, 2009). Perhaps both have a common cause - the difficulty exploding more massive cores (Fig. 10).
Of course, the compactness parameter, is, by itself, an overly simple representation of core structure, but it is known to correlate with other measures of explodability (e..g., Ertl et al., 2016; Sukhbold et al., 2018). Somewhat surprisingly, in addition to being smaller for presupernova masses less than 6 , the compactness parameter is less chaotic for stars in binaries where the hydrogen envelope is lost than in single stars (Fig. 10;§4.2). Pending further study, fewer low mass black holes are expected in this range.
The small mass of the exploding star compared to its companion, which now has its original mass plus, perhaps, the hydrogen envelope of the primary, suggests that, absent strong kicks, the system will remain bound. These are thus the likely progenitor systems of massive x-ray sources that contain neutron stars.
6.4. = 9 to 70
Most of the helium stars in this range seem likely to make black holes, with a pronounced peak between 7 and 9 (Fig. 10). There is also a narrow range of models with final masses around 10 - 12 that might explode. Given their large masses, these (neutrino-powered) explosions might produce broader, fainter light curves (Ensman & Woosley, 1988), inconsistent with common Type Ic supernovae. Because of their high mass, they may also be relatively rare. The black hole peak at 8 is derived from helium stars with initial masses near 14 , which, in turn, come from main sequence masses near 40 . The 11 supernova would be derived from a star with original helium core mass 22 and main sequence mass near 55 . If these models do explode, then a new potentially detectable mass gap in black hole masses would exist around 10 - 12 . This is a less robust gap than the one above 46 (see below), and more sensitive to uncertain physics like the rates for 12C(O and mass loss.
The new results for compactness differ substantially from those for single stars (Fig. 10; Sukhbold et al., 2018) and suggest the distribution of black hole masses will be different in mass exchanging binaries and single stars.
The relation between helium core mass and main sequence mass used here applies to non-rotating stars only, which is probably an unrealistic approximation. With substantial rotation, Gamma-ray bursts and magnetars might come from these sorts of stars. With rotation, the main sequence mass required to produce a given helium core mass would be reduced, especially in the case of chemically homogeneous evolution.
6.5. = 30 - 120
A new limit is derived for the maximum black hole mass implied by the pulsational pair instability. In a binary system, pulses will eject all mass external to 46 (Table 5). This is smaller than the previous limit, 52 , given by Woosley (2017) because: a) the limit is smaller for helium cores that lack a hydrogen envelope to tamp the explosion (see also Woosley, 2017); and b) the CO-core is larger in presupernova stars for helium stars that lose their hydrogen envelope early on. This limit is consistent with all LIGO detections thus far (Abott et al., 2018)
Helium cores with solar metallicity and initial masses greater than 60 encounter a weak instability in the oxygen burning shell (Table 5) that results in the low energy ejection of a small amount of mass. The stronger instability, with ejected kinetic energies greater that 1049 erg, begins for helium core masses greater than 75 . These corresponds to main sequence masses of roughly 130 and 160 (eq. (5)) for the weak and strong pulsational pair-instability respectively. If the mass loss rate is reduced by a factor of two as might occur for lower metallicity, these numbers are about 70% as great (Fig. 8), i.e., a main sequence mass of only 110 could produce violent PPISN. Of course these numbers can be reduced if the core is a product of chemically homogeneous evolution. Then a 75 “helium star” could be produced by a rapidly rotating main sequence star with just a slightly larger mass.
6.6. Subsequent interactions with the other star
While the mass loss history of the first star in the binary to fill its Roche lobe is uncertain, the evolution of the second, the mass acceptor, is even more so. If the mass exchange is conservative, the “effective” main sequence mass for the secondary in equation 4 and equation 5 is its initial mass plus the mass lost by the primary which is the main sequence mass minus the final mass (eq. (13)). This is an upper bound since some mass will be lost, especially if there is a common envelope phase.
Several caveats should be noted. First, the 46 limit derived here for black holes remaining following pulsational pair-instability supernovae (§3.3) strictly applies only to the mass of the primary immediately after the first explosion. An uncertain amount of matter could accrete onto the black hole, especially if it experiences “hypercritical” accretion (e.g. Belczynski et al., 2002; Bethe et al., 2007) during a second common envelope stage. O’Shaughnessy et al. (2005) estimate the fractional increase in black hole mass to be 5 to 25%. When the second explosion happens, assuming the envelope has been lost, that helium star too will be subject to the 46 limit, but the original primary could have grown to over 46 .
Second, in addition to increasing the mass of the secondary, accretion may also increase its spin. If the star rotates rapidly enough, it will evolve chemically homogeneously. Very massive helium stars could result, even at solar metallicity and a second common envelope might be avoided, though the orbit would remain wide.
Finally, because the more massive stars have a constant hydrogen burning lifetime given by the Eddington limit, about 3 million years, and a constant helium burning lifetime % of that, it may not not be uncommon for very massive stars born at the same time to die at nearly the same time, even if they have different masses. The delay time between supernovae could be short and the first mass exchange might begin when both stars have already developed helium cores.
6.7. Type II supernovae in binaries
While this paper is about stars that lose their hydrogen envelopes near helium ignition, binary mass transfer is certainly capable of producing supernovae that retain at some of their hydrogen. Interacting binaries are the probable origin of Type IIb supernovae like SN 1993J. Mergers can also produce supernovae like 1987A. For a recent discussion including many light curves, see Eldridge et al. (2018). In general, a presupernova star that retains even a small hydrogen envelope in an interacting binary will resemble much more closely the outcome of single star evolution. The small mass of the envelope will affect the optical display, but the helium core, explosion physics, remnant masses, and nucleosynthesis will be more like single stars of the same initial mass.
Acknowledgments
This work has been partly supported by NASA NNX14AH34G. The author acknowledges valuable advice from Sung-Chul Yoon on the mass loss rates and helpful discussions with Thomas Ertl, Alexander Heger, Thomas Janka, and Tuguldur Sukhbold. Sukhbold also provided data for Fig. 10.
References
- Abott et al. (2018) Abbott, B P., Abott, R., Abott, T. D., Abott, S. et al, 2018, astro-ph, 1811-12097
- Arnett (1974) Arnett, W. D. 1974, ApJ, 194, 373
- Barkat (1994) Barkat, Z. 1994, Supernovae, NATO Advanced Science Institutes (ASI) Series C, (North-Holland, Amsterdam), 31
- Belczynski et al. (2002) Belczynski, K., Kalogera, V., & Bulik, T. 2002, ApJ, 572, 407
- Belczynski et al. (2016) Belczynski, K., Heger, A., Gladysz, W., et al. 2016, A&A, 594, A97
- Bersten et al. (2014) Bersten, M. C., Benvenuto, O. G., Folatelli, G., et al. 2014, AJ, 148, 68
- Bethe et al. (2007) Bethe, H. A., Brown, G. E., & Lee, C.-H. 2007, Phys. Rep., 442, 5
- Brooks et al. (2016) Brooks, J., Bildsten, L., Schwab, J., & Paxton, B. 2016, ApJ, 821, 28
- De et al. (2018) De, K., Kasliwal, M. M., Ofek, E. O., et al. 2018, Science, 362, 201
- Dessart et al. (2012) Dessart, L., Hillier, D. J., Li, C., & Woosley, S. 2012, MNRAS, 424, 2139
- Dessart et al. (2015) Dessart, L., Hillier, D. J., Woosley, S., et al. 2015, MNRAS, 453, 2189
- Dessart et al. (2016) Dessart, L., Hillier, D. J., Woosley, S., et al. 2016, MNRAS, 458, 1618
- Denissenkov et al. (2013) Denissenkov, P. A., Herwig, F., Truran, J. W., & Paxton, B. 2013, ApJ, 772, 37
- deBoer et al. (2017) deBoer, R. J., Görres, J., Wiescher, M., et al. 2017, Reviews of Modern Physics, 89, 035007
- De Marco & Izzard (2017) De Marco, O., & Izzard, R. G. 2017, Pub. Astron. Soc. Australia, 34, e001
- Eldridge & Vink (2006) Eldridge, J. J., & Vink, J. S. 2006, A&A, 452, 295
- Eldridge et al. (2013) Eldridge, J. J., Fraser, M., Smartt, S. J., Maund, J. R., & Crockett, R. M. 2013, MNRAS, 436, 774
- Eldridge et al. (2015) Eldridge, J. J., Fraser, M., Maund, J. R., & Smartt, S. J. 2015, MNRAS, 446, 2689
- Eldridge et al. (2018) Eldridge, J. J., Xiao, L., Stanway, E. R., Rodrigues, N., & Guo, N.-Y. 2018, arXiv:1811.00282
- Ensman & Woosley (1988) Ensman, L. M., & Woosley, S. E. 1988, ApJ, 333, 754
- Ertl et al. (2016) Ertl, T., Janka, H.-T., Woosley, S. E., Sukhbold, T., & Ugliano, M. 2016, ApJ, 818, 124
- Farmer et al. (2015) Farmer, R., Fields, C. E., & Timmes, F. X. 2015, ApJ, 807, 184
- Fryer (1999) Fryer, C. L. 1999, ApJ, 522, 413
- Fryer et al. (2012) Fryer, C. L., Belczynski, K., Wiktorowicz, G., et al. 2012, ApJ, 749, 91
- GalYam (2019) GalYam, A. 2019, ARA&A, 37, in press
- Garcia-Berro & Iben (1994) Garcia-Berro, E., & Iben, I. 1994, ApJ, 434, 306
- Hanich et al. (2014) Hainich, R., Rühling, U., Todt, H., Oskinova, L.M., Liermann, A., Gräfener, G., Foellmi, C., Schnurr, O., & Hamann, W.-R. 2014, A&A565, A27
- Havazelet & Barkat (1979) Havazelet, D., & Barkat, Z. 1979, ApJ, 233, 589
- Heger et al. (2001) Heger, A., Woosley, S. E., Martínez-Pinedo, G., & Langanke, K. 2001, ApJ, 560, 307
- Jeffery (1988) Jeffery, C. S. 1988, MNRAS, 235, 1287
- Kleiser et al. (2018) Kleiser, I. K. W., Kasen, D., & Duffell, P. C. 2018, MNRAS, 475, 3152
- Kruckow et al. (2018) Kruckow, M. U., Tauris, T. M., Langer, N., Kramer, M., & Izzard, R. G. 2018, MNRAS, 481, 1908
- Langer (2012) Langer N., 2012, ARA&A, 50, 107
- Maeder (1987) Maeder, A. 1987, A&A, 178, 159
- McClelland & Eldridge (2016) McClelland, L. A. S., & Eldridge, J. J. 2016, MNRAS, 459, 1505
- Mandel & de Mink (2016) Mandel, I., & de Mink, S. E. 2016, MNRAS, 458, 2634
- Nomoto & Iben (1985) Nomoto, K., & Iben, I., Jr. 1985, ApJ, 297, 531
- Nomoto & Hashimoto (1986) Nomoto, K., & Hashimoto, M.-A. 1986, Progress in Particle and Nuclear Physics, 17, 267
- Nomoto & Hashimoto (1988) Nomoto, K., & Hashimoto, M. 1988, Phys. Rep., 163, 13
- O’Connor & Ott (2011) O’Connor, E., & Ott, C. D. 2011, ApJ, 730, 70
- O’Shaughnessy et al. (2005) O’Shaughnessy, R., Kaplan, J., Kalogera, V., & Belczynski, K. 2005, ApJ, 632, 1035
- Petrovic et al. (2006) Petrovic, J., Pols, O., & Langer, N. 2006, A&A, 450, 219
- Podsiadlowski et al. (1992) Podsiadlowski, P., Joss, P. C., & Hsu, J. J. L. 1992, ApJ, 391, 246
- Pols & Dewi (2002) Pols, O. R., & Dewi, J. D. M. 2002, Pub. Astron. Soc. Australia, 19, 233
- Rauscher et al. (2002) Rauscher, T., Heger, A., Hoffman, R. D., & Woosley, S. E. 2002, ApJ, 576, 323
- Saio & Nomoto (2004) Saio, H., & Nomoto, K. 2004, ApJ, 615, 444
- Sana & Evans (2011) Sana, H., & Evans, C. J. 2011, Active OB Stars: Structure, Evolution, Mass Loss, and Critical Limits, 272, 474
- Sana et al. (2012) Sana, H., de Mink, S. E., de Koter, A., et al. 2012, Science, 337, 444
- Siess (2006) Siess, L. 2006, A&A, 448, 717
- Smartt (2009) Smartt, S. J. 2009, ARA&A, 47, 63
- Sukhbold & Woosley (2014) Sukhbold, T., & Woosley, S. E. 2014, ApJ, 783, 10
- Sukhbold et al. (2016) Sukhbold, T., Ertl, T., Woosley, S. E., Brown, J. M., & Janka, H.-T. 2016, ApJ, 821, 38
- Sukhbold et al. (2018) Sukhbold, T., Woosley, S. E., & Heger, A. 2018, ApJ, 860, 93
- Tauris et al. (2015) Tauris, T. M., Langer, N., & Podsiadlowski, P. 2015, MNRAS, 451, 2123
- Timmes et al. (1994) Timmes, F. X., Woosley, S. E., & Taam, R. E. 1994, ApJ, 420, 348
- Timmes et al. (1996) Timmes, F. X., Woosley, S. E., & Weaver, T. A. 1996, ApJ, 457, 834
- Tramper, Sana, and de Koter (2016) Tramper, F., Sana, H., & de Koter, A. 2016, ApJ, 833, 133
- Vink (2017) Vink, J. S. 2017, A&A, 607, L8
- Weaver, Zimmerman, & Woosley (1978) Weaver, T. A., Zimmerman, G. B., & Woosley 1978, ApJ, 225, 1021
- Wellstein & Langer (1999) Wellstein, S., & Langer, N. 1999, A&A, 350, 148
- Woosley et al. (1995) Woosley, S. E., Langer, N., & Weaver, T. A. 1995, ApJ, 448, 315
- Woosley et al. (2002) Woosley, S. E., Heger, A., & Weaver, T. A. 2002, Reviews of Modern Physics, 74, 1015
- Woosley et al. (2004) Woosley, S. E., Heger, A., Cumming, A., et al. 2004, ApJS, 151, 75
- Woosley & Heger (2006) Woosley, S. E., & Heger, A. 2006, ApJ, 637, 914
- Woosley & Heger (2007) Woosley, S. E., & Heger, A. 2007, Phys. Rep., 442, 269
- Woosley & Heger (2015) Woosley, S. E., & Heger, A. 2015, ApJ, 810, 34
- Woosley (2017) Woosley, S. E. 2017, ApJ, 836, 244
- Yoon et al. (2010) Yoon, S.-C., Woosley, S. E., & Langer, N. 2010, ApJ, 725, 940
- Yoon (2017) Yoon, S.-C. 2017, MNRAS, 470, 3970