Abstract
Results of comparison of Gaia DR2 parallaxes with data derived from a combined analysis of 2MASS (Two Micron All-Sky Survey), SDSS (Sloan Digital Sky Survey), GALEX (Galaxy Evolution Explorer), and UKIDSS (UKIRT Infrared Deep Sky Survey) surveys in four selected high-latitude sky areas are presented. It is shown that multicolor photometric data from large modern surveys can be used for parameterization of stars closer than 4400 pc and brighter than , including estimation of parallax and interstellar extinction value. However, the stellar luminosity class should be properly determined.
keywords:
parallax; photometry; interstellar extinction; surveys; Gaia7 \issuenum1 \pubvolume7 \historyReceived: 7 November 2018; Accepted: 25 December 2018; Published: 29 December 2018 \updatesyes \TitleVerification of Photometric Parallaxes with Gaia DR2 Data \Author Oleg Malkov 1,*\orcidA, Sergey Karpov 2,3,4\orcidB, Dana Kovaleva 1\orcidC, Sergey Sichevsky 1\orcidD, Dmitry Chulkov 1\orcidE, Olga Dluzhnevskaya 1\orcidF, Alexey Kniazev 3,5,6,7\orcidG, Areg Mickaelian 8\orcidH, Alexey Mironov 7, Jayant Murthy 9\orcidJ, Alexey Sytov 1\orcidK, Gang Zhao 10\orcidL and Aleksandr Zhukov 1,7,11 \AuthorNames Oleg Malkov, Sergey Karpov, Dana Kovaleva, Sergey Sichevsky, Dmitry Chulkov, Olga Dluzhnevskaya, Alexey Kniazev, Areg Mickaelian, Alexey Mironov, Jayant Murthy, Alexey Sytov, Gang Zhao and Aleksandr Zhukov \corresCorrespondence: malkov@inasan.ru; Tel.: +7-495-951-7993
1 Introduction
One of the main problems of astrophysics is the study of the physical properties belonging to the surface layers of stars. Because these stars are observed through interstellar dust, their light is dimmed and reddened, complicating their parameterization and classification. The parameters of a given star (temperature, gravity, metallicity, etc.), as well as the interstellar reddening, may be obtained from its optical, infrared, and ultraviolet spectrum. However, one must either use large telescope or bright objects to get spectral energy distributions with good resolution and sufficient accuracy. For instance, spectroscopic observations with 1-h exposure time on a 2-m telescope with low () and high ( 100,000) resolution allow limiting magnitudes of 16–17 mag and 11–12 mag, respectively. An 8-m telescope adds 3 mag to these estimations. This work was performed by various authors, and a number of empirical atlases were constructed (Straizys and Sviderskiene (1972), Glushneva et al. (1992), Alekseeva et al. (1996), Alekseeva et al. (1997), Pickles (1998), Bagnulo et al. (2003), Le Borgne et al. (2003), Valdes et al. (2004), Heap and Lindler (2007), Falcón-Barroso et al. (2011), Wu et al. (2011)). However Mironov et al. (2014) made a critical analysis, compared data for stars included in several atlases, and found many discrepancies.
Another way to construct a map of interstellar extinction is its estimation (as well as stellar parameters) from evolutionary tracks. Corresponding procedures were developed in Sichevsky and Malkov (2016), Sichevskij (2016), Sichevskij (2017a) and applied to LAMOST data by Sichevskij (2017b). However, a knowledge of stellar atmospheric parameters is highly desirable for the application of these procedures, limiting the number of stars available for such a parameterization.
Therefore, the solution of the problem of parameterization of stars based on their photometry is a topical issue Malkov (2003). A great variety of photometric systems (see, e.g., Straižys (1992) for references) and recently constructed large photometric surveys (like SDSS Aihara et al. (2011) and GALEX Martin et al. (2005)) as well as VO-tools for cross-matching surveys’ objects provide with a possibility to get multicolor photometric data for millions of objects. Consequently, it allows the user to parameterize objects and determine interstellar extinction in the galaxy.
A comparative analysis of available 3D maps of interstellar extinction was made by Kilpio and Malkov (1997a), and contradictory results were found. As a temporary solution of that problem, a synthetic map of the galactic interstellar extinction can be compiled (see, e.g., (Kilpio and Malkov, 1997b; Hakkila et al., 1997; Malkov and Kilpio, 2002)).
Early dust maps used the correlation between the dust column density and the distribution of neutral hydrogen (Burstein and Heiles, 1982). These data were supplanted by the dust maps produced by Schlegel et al. (1998), who used full sky microwave data made available by the IRAS (Infrared Astronomical Satellite) mission and the DIRBE (Diffuse Infrared Background Experiment) instrument on the COBE (Cosmic Background Explorer) mission. Mapping the dust column densities via the calibrated dust temperature, the extinction maps, assuming a standard reddening law, were shown to be at least twice as accurate as those of Burstein and Heiles (1982). An advantage of this method is that it does not rely on a predefined model for the stellar population.
The successful implementation of the European astrometric space mission Gaia (the second version of the mission catalog, Gaia DR2, was published in April 2018 Gaia Collaboration et al. (2018)) allows the solving of several stellar astronomy problems, like determination of stellar mass, age estimation and others. In particular, it became possible to improve the results of the parameterization of stars, carried out from multicolor photometry.
In this paper, the verification of the method and stellar sample analyzed in Malkov et al. (2018) using Gaia DR2 data is described. We also discuss how including the Gaia parallaxes into the procedure would improve the accuracy of parameterization, and how to select/process objects with unknown Gaia parallax for parameterization.
2 Data and Method
In Malkov et al. (2018) (hereinafter—Paper18) objects in four selected areas in the sky were cross-matched (see details of the procedure in Malkov and Karpov (2011); Karpov et al. (2012); Malkov et al. (2012)) with 2MASS (Two Micron All-Sky Survey) Skrutskie et al. (2006), SDSS (Sloan Digital Sky Survey) Aihara et al. (2011), GALEX (Galaxy Evolution Explorer) Martin et al. (2005), and UKIDSS (UKIRT Infrared Deep Sky Survey) Lawrence et al. (2007) surveys, and multi-wavelength photometric data were used to determine the parameters of stars. The galactic coordinates of the areas are (334, +61.9), (257, +48.7), (301, +62.1), and (129, 58.1). For the studied objects MK (Morgan-Keenan) spectral types (SpT), distances () and interstellar extinction values () were estimated, minimizing the function
| (1) |
where and are the apparent magnitude and its observational error, respectively, in the -th photometric band from a given survey, and the summation is over up to N = 14 photometric bands (JHKS from 2MASS, ugriz from SDSS, FUV and NUV from GALEX, YJHK from UKIDSS), and
| (2) |
or
| (3) |
Here is the extinction in the i-th photometric band, and can be determined from the interstellar extinction law. To retrieve from we have used data from Yuan et al. (2013) for 2MASS Skrutskie et al. (2006), SDSS Aihara et al. (2011) and GALEX Martin et al. (2005), whereas data for UKIDSS Lawrence et al. (2007) and Johnson V-band were adopted from Schlafly and Finkbeiner (2011). Both teams made calculations for SDSS photometry, and our comparison shows a very good agreement between their results (see Paper18 for details).
is the absolute magnitude in i-th photometric band taken from calibration tables. To obtain absolute magnitudes for stars of different spectral types in the corresponding photometric systems , we have compiled a table of absolute magnitudes in 2MASS, SDSS and GALEX surveys using Kraus and Hillenbrand (2007), and Findeisen et al. (2011) data. Due to lack of published data, UKIDSS absolute magnitudes were calculated from 2MASS magnitudes and 2MASS-UKIRT relations from Hodgkin et al. (2009).
The distance and parallax are expressed in parsec and arcsec, respectively. It should be noted that Equation (3) is not correct when using observational data. The mean value of the parallax is not enough and their errors should be considered to derive a good value for the distance to be substituted in Equation (2) to derive Equation (3) (see Bailer-Jones et al. (2018)).
Altogether 251 objects were found in at least three of the four surveys and cross-matched in the four areas, but only 26 of them were successfully parameterized. The following reasons to remove objects from further consideration were considered.
First, the original surveys contain various flags which allow us to remove unsuitable objects, namely, “Binary object” (2MASS, UKIDSS), “Non-stellar/extended object” (2MASS, SDSS, GALEX, UKIDSS), “Observation of low quality” (SDSS). Secondly, overly bright objects and objects with large observational errors were not considered.
Also, only areas located at relatively high galactic latitudes () are considered in this work. Consequently, is assumed to be smaller than 0.5 mag, and distance is assumed to be closer than 8000 pc. Objects which presented larger values for those parameters were removed from further consideration.
Finally, for every object a rough parameterization was performed (based on 2MASS+SDSS photometry only) with Covey et al. (2007) absolute magnitude tables. An object was removed if this procedure showed that there was a high probability for it to be a non-MS star (giant or supergiant). It should be reminded that in the current study only MS (Main-Sequence) stars are considered.
A comparison of our results for 26 selected stars with independent results obtained from the LAMOST (Large Sky Area Multi-Object Fiber Spectroscopic Telescope) Luo et al. (2015) for some of the studied stars has demonstrated a good agreement. Interstellar extinction as a function of distance () was constructed for the four selected areas (see Figures 1–4 in Paper18). These relations were extrapolated to infinity (). Please note that the extrapolation is formal, and can introduce some uncertainty. For the resulting values in three of the four areas (Nos 1, 5, and 6 in Paper18), a good agreement was found with the data used in the study of supernovae Perlmutter et al. (1999) to confirm the accelerated expansion of the Universe. For the remaining area, No 2, an agreement was not achieved (see Table 2 in Paper18).
To identify the conditions under which stars are properly parameterized from multicolor photometry, we relied upon the results obtained in our pilot study of interstellar extinction in four areas (see Paper18), and Gaia data. A cross-matching of Paper18 objects with Gaia DR2 catalog was made. Among 251 objects, studied in Paper18, only 72 were found in Gaia DR2 (such a very small fraction is understandable, as about 80% of the Paper18 objects are fainter than ), and seven of them have no Gaia parallaxes. Among 26 objects, selected in Paper18 for construction of relation, one is absent in Gaia DR2, and two more objects have no parallaxes.
The Gaia trigonometric parallaxes (hereafter ) are compared with photometric parallaxes obtained in Paper18 (hereafter ). When analyzing Gaia data, the recommendations published in Lindegren et al. (2018) were considered. In particular, the filters, designed on the basis of the photometric and astrometric flags contained in Gaia DR2, were taken into account. They were used to construct a so-called astrometrically clean sample, hereafter ACS.
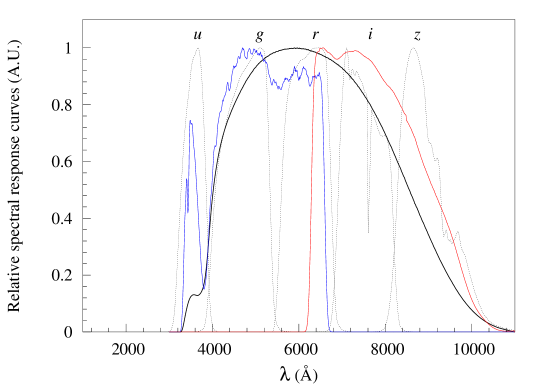
Photometric passbands used in SDSS Doi et al. (2010) and Gaia DR2 Evans et al. (2018) are presented in Figure 1. In this work, we deal with gSDSS and Gaia G, BP, and RP magnitudes of the studied stars.
3 Results and Conclusions
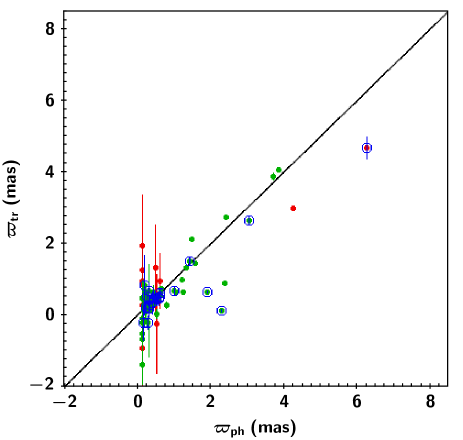
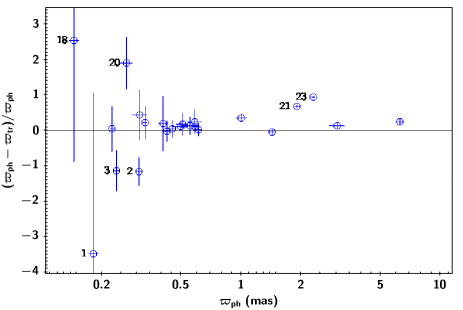
A comparison of the photometric and trigonometric parallaxes of stars used in Paper18 for the construction is shown in Figure 2. The ratio between the difference in parallax and the photometric parallax as a function of and is shown in Figure 3. In the current study observational photometric errors are considered to be the only source for the resulting parameters errors. Consequently, here we underestimate the error values. To calculate errors more correctly, one should also consider calibration tables errors and relations errors.
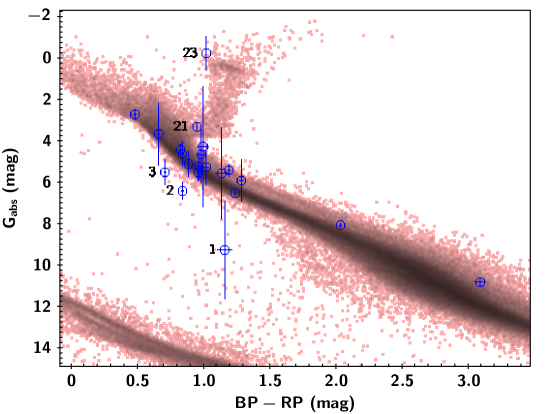
Most stars demonstrate a satisfactory agreement but with some outliers which require an explanation. The Hertzsprung-Russell diagram (HRD) was constructed for Gaia DR2 stars with trigonometric parallax mas, with relative parallax uncertainty , with relative error of BP and RP fluxes better than 10%, and satisfying the ACS requirements (Figure 4). The studied stars were added to the plot, and their positions on HRD were analyzed. Data for the studied stars are presented in Table 1.
| N | SDSS | Gaia DR2 | RA2000 (deg) | DEC2000 (deg) | ||||||
| 1 | 752-301-2-0325-0286 | 3683644191076349312 | 192.1701 | 0.8165 | ||||||
| 2 | 6005-301-2-0158-0092 | 3689648868888993920 | 192.2168 | 0.7911 | ||||||
| 3 | 6005-301-2-0158-0061 | 3683643881838700800 | 192.1728 | 0.8335 | ||||||
| 4 | 1241-301-1-0173-0042 | 3801228953847961600 | 164.2724 | 3.5562 | ||||||
| 5 | 752-301-2-0324-0052 | 3683656594941905920 | 192.0763 | 0.7852 | ||||||
| 6 | 1462-301-4-0543-0082 | 3665039324758041600 | 206.7882 | 2.4288 | ||||||
| 7 | 6121-301-2-0157-0087 | 3683657110337986048 | 192.1002 | 0.7568 | ||||||
| 8 | 6121-301-2-0157-0037 | 3683644569033472512 | 192.1050 | 0.8108 | ||||||
| 9 | 1462-301-4-0543-0066 | 3665227032008658560 | 206.7471 | 2.4403 | ||||||
| 10 | 2194-301-1-0361-0007 | 3801228683265104640 | 164.1956 | 3.5772 | ||||||
| 11 | 1241-301-1-0173-0102 | 3801228610250558848 | 164.2084 | 3.5842 | ||||||
| 12 | 7727-301-3-0174-0108 | 2552008097711479808 | 16.2328 | 4.5274 | ||||||
| 13 | 2194-301-1-0361-0119 | 3801227819976566272 | 164.2968 | 3.5978 | ||||||
| 14 | 752-301-2-0325-0136 | 3689650277638267392 | 192.1738 | 0.7430 | ||||||
| 15 | 1462-301-4-0543-0182 | 3665226581036533504 | 206.7508 | 2.4200 | ||||||
| 16 | 756-301-1-0510-0121 | 3683643679975511808 | 192.1394 | 0.8415 | ||||||
| 17 | 7727-301-3-0174-0122 | 2552021880262020608 | 16.2512 | 4.6030 | ||||||
| 18 | 1462-301-4-0544-0120 | 3665040626132812800 | 206.8532 | 2.4438 | ||||||
| 19 | 7727-301-3-0175-0149 | 2552009442036732416 | 16.2885 | 4.5344 | ||||||
| 20 | 752-301-2-0324-0183 | 3689662230532099200 | 192.0995 | 0.7200 | ||||||
| 21 | 1462-301-4-0543-0079 | 3665039290398303104 | 206.7741 | 2.4244 | ||||||
| 22 | 2194-301-1-0361-0077 | 3801228644610295680 | 164.1954 | 3.5860 | ||||||
| 23 | 1462-301-4-0543-0060 | 3665226615396253824 | 206.7224 | 2.4265 | ||||||
| N | Sp | |||||||||
| 1 | 20.384 | 0.021 | 19.718 | 4.3 10-3 | 0.1811 | 0.0097 | 0.8123 | 0.821 | G8 | 5.3 |
| 2 | 17.674 | 0.005 | 17.260 | 8.4 10-4 | 0.3086 | 0.0115 | 0.667 | 0.1211 | G0 | 4.47 |
| 3 | 17.269 | 0.005 | 16.974 | 8.7 10-4 | 0.2375 | 0.0067 | 0.5096 | 0.1363 | F5 | 3.61 |
| 4 | 16.408 | 0.003 | 15.646 | 1.4 10-3 | 1.4285 | 0.0592 | 1.4892 | 0.0784 | K2 | 6.08 |
| 5 | 17.335 | 0.005 | 16.882 | 7.4 10-4 | 0.4255 | 0.0168 | 0.4383 | 0.1179 | G5 | 4.89 |
| 6 | 17.076 | 0.005 | 16.597 | 1.2 10-3 | 0.6116 | 0.0219 | 0.6022 | 0.1014 | G8 | 5.3 |
| 7 | 17.251 | 0.005 | 16.998 | 7.8 10-4 | 0.2252 | 0.0047 | 0.2149 | 0.1413 | F5 | 3.61 |
| 8 | 16.788 | 0.004 | 16.387 | 6.3 10-4 | 0.4524 | 0.0191 | 0.4361 | 0.1048 | G0 | 4.47 |
| 9 | 14.645 | 0.003 | 14.512 | 6.5 10-4 | 0.4975 | 0.0421 | 0.439 | 0.0439 | F2 | 2.89 |
| 10 | 16.200 | 0.003 | 15.816 | 7.9 10-4 | 0.5882 | 0.0159 | 0.5176 | 0.0594 | G0 | 4.47 |
| 11 | 18.110 | 0.006 | 17.596 | 1.9 10-3 | 0.3300 | 0.0066 | 0.2585 | 0.1536 | G5 | 4.89 |
| 12 | 17.327 | 0.005 | 16.824 | 1.0 10-3 | 0.5571 | 0.0541 | 0.4783 | 0.1317 | G8 | 5.3 |
| 13 | 18.699 | 0.009 | 18.025 | 3.2 10-3 | 0.4048 | 0.0206 | 0.3235 | 0.3079 | K0 | 5.69 |
| 14 | 17.689 | 0.005 | 17.169 | 8.9 10-4 | 0.5102 | 0.0343 | 0.4149 | 0.153 | G8 | 5.3 |
| 15 | 18.616 | 0.008 | 18.106 | 2.0 10-3 | 0.3095 | 0.0258 | 0.1714 | 0.217 | G8 | 5.3 |
| 16 | 18.440 | 0.007 | 17.658 | 1.2 10-3 | 0.5865 | 0.0510 | 0.4417 | 0.1949 | K2 | 6.08 |
| 17 | 17.004 | 0.004 | 16.281 | 9.1 10-4 | 1.0050 | 0.0601 | 0.6621 | 0.0933 | K2 | 6.08 |
| 18 | 19.437 | 0.012 | 19.017 | 4.1 10-3 | 0.1455 | 0.0075 | 0.2226 | 0.4955 | G0 | 4.47 |
| 19 | 17.547 | 0.005 | 15.965 | 9.4 10-4 | 3.0303 | 0.2470 | 2.6283 | 0.102 | M0 | 7.6 |
| 20 | 18.248 | 0.006 | 17.784 | 1.2 10-3 | 0.2673 | 0.0174 | 0.2431 | 0.1933 | G0 | 4.47 |
| 21 | 14.820 | 0.003 | 14.332 | 4.9 10-4 | 1.9047 | 0.0447 | 0.626 | 0.0398 | G8 | 5.3 |
| 22 | 19.643 | 0.015 | 17.431 | 7.7 10-3 | 6.25 | 0.2734 | 4.6726 | 0.2955 | M4 | 9.92 |
| 23 | 14.901 | 0.003 | 14.361 | 3.7 10-4 | 2.2988 | 0.0497 | 0.1203 | 0.0418 | K2 | 6.08 |
Stars 21 and 23 belong to red giants. Obviously, they were wrongly accepted as Main-Sequence stars in Paper18, which resulted in erroneous values.
According to Figure 4, stars 1, 2 and 3 are sub-dwarfs, and, if that is true, they have erroneous for the same reason as above. However, we pay attention to their relatively large trigonometric parallax errors (see values in Table 1), which could lead to their shift under the Main Sequence in HRD.
Lastly, stars 18 and 20 have negative parallaxes and for that reason their absolute magnitudes cannot be calculated and, consequently, they are not shown in Figure 4. Apparently the negative parallaxes indicate that these stars belong to supergiants. Again, they were wrongly accepted to be Main-Sequence stars in Paper18, which resulted in erroneous values.
The results of the comparison allow us to make the following conclusions.
-
1.
A parameterization of stars with mas (i.e., closer than about 4400 pc) and (see Figure 3) is successful, subject to a proper determination of luminosity class.
-
2.
A rough estimate of the probability of stars belonging to the Main Sequence was carried out in Paper18 (basing on 2MASS and SDSS photometry data), and only MS stars were parameterized. Obviously, for several stars that estimation turned out to be erroneous (see Figure 4). It seems appropriate to include in the parameterization procedure information about the photometry of non-MS stars (sub-dwarfs, giants and supergiants), drawn from the literature or determined by our own efforts.
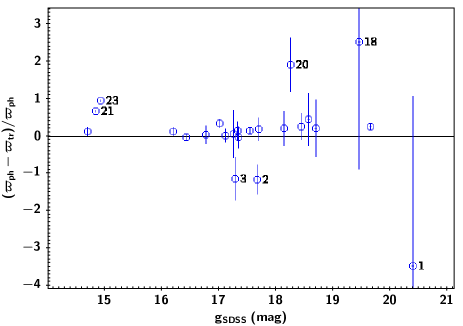
The distribution of stars used in Paper18 for the construction by the ratio between the difference in parallax and the photometric parallax is presented in Figure 5. Seven outliers demonstrate , they were discussed above (stars 1, 2, 3, 18, 20, 21, 23).
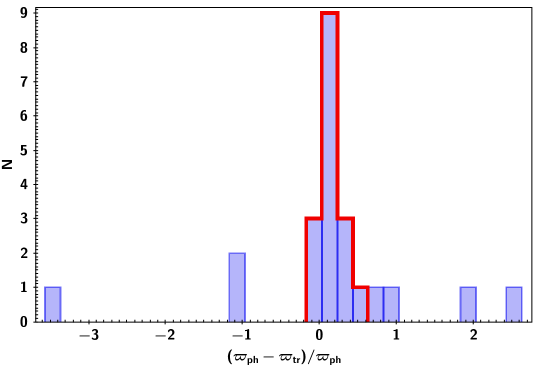
The remaining stars distribution is shown with the red contour. For them mean value of is 0.15 with standard deviation of 0.13. Mean and values for the red contour group are 0.997 and 0.89, respectively.
It should be noted that area No 2, which showed a poor agreement with the Perlmutter et al.’s Perlmutter et al. (1999) data in Paper18, does not stand out in the current analysis.
It should be also noted that the cross-matching of Paper18 objects with Gaia DR2 catalog was made correctly. Angular distance on the sky between a Paper18 object and its Gaia DR2 counterpart () does not exceed 1 arcsec, and only for 2 of 72 objects arcsec (those two stars were not selected in Paper18 for construction of relation, and consequently, are not shown in Figures 3–5).
Based on the conclusions derived above, our procedure of parameterization of stars will be modified. In particular, the procedure will be extended to sub-dwarf, giant and supergiant stars. Also, at this stage, distant ( mas) and faint () objects will be removed from consideration. We will also reconstruct the procedure to use Gaia DR2 parallaxes (and future releases, when available), as an input parameter. It is also planned to use data from other multicolor surveys, such as WISE (Wide-Field Infrared Survey Explorer), DENIS (Deep Near Infrared Survey of the Southern Sky), etc., and extend this procedure to lower galactic latitudes.
The authors made equal contribution to this work; O.M. wrote the paper.
This research was partly funded by the Russian Foundation for Basic Research grant 17-52-45076. A.K. acknowledges the National Research Foundation of South Africa and the Russian Science Foundation (project no. 14-50-00043). G.Z. acknowledges support by NSFC grant No. 11390371.
Acknowledgements.
We are grateful to our reviewers whose constructive comments greatly helped us to improve the paper. We thank E. Kilpio for fruitful collaboration. This work has made use of data from the European Space Agency (ESA) mission Gaia (https://www.cosmos.esa.int/gaia), processed by the Gaia Data Processing and Analysis Consortium (DPAC, https://www.cosmos.esa.int/web/gaia/dpac/consortium). Funding for the DPAC has been provided by national institutions, in particular the institutions participating in the Gaia Multilateral Agreement. \conflictsofinterestThe authors declare no conflict of interest. \reftitleReferencesReferences
- Straizys and Sviderskiene (1972) Straizys, V.; Sviderskiene, Z. Energy distribution in the stellar spectra of different spectral types and luminosities. Vilnius Astron. Obs. Biul. 1972, 35, 3.
- Glushneva et al. (1992) Glushneva, I.N.; Kharitonov, A.V.; Kniazeva, L.N.; Shenavrin, V.I. Secondary spectrophotometric standards. Astron. Astrophys. Suppl. Ser. 1992, 92, 1–29.
- Alekseeva et al. (1996) Alekseeva, G.A.; Arkharov, A.A.; Galkin, V.D.; Hagen-Thorn, E.I.; Nikanorova, L.N.; Novikov, V.V.; Novopashenny, V.B.; Pakhomov, V.P.; Ruban, E.V.; Shchegolev, D.E. The Pulkovo Spectrophotometric Catalog of Bright Stars in the Range from 320 to 1080 NM. Baltic Astron. 1996, 5, 603–838. [CrossRef]
- Alekseeva et al. (1997) Alekseeva, G.A.; Arkharov, A.A.; Galkin, V.D.; Hagen-Thorn, E.I.; Nikanorova, L.N.; Novikov, V.V.; Novopashenny, V.B.; Pakhomov, V.P.; Ruban, E.V.; Shechegolev, D.E. The Pulkovo spectrophotometric catalog of bright stars in the range from 320 to 1080 NM—A supplement. Baltic Astron. 1997, 6, 481–496. [CrossRef]
- Pickles (1998) Pickles, A.J. A Stellar Spectral Flux Library: 1150–25000 Å. Publ. Astron. Soc. Pac. 1998, 110, 863–878. [CrossRef]
- Bagnulo et al. (2003) Bagnulo, S.; Jehin, E.; Ledoux, C.; Cabanac, R.; Melo, C.; Gilmozzi, R.; ESO Paranal Science Operations Team. The UVES Paranal Observatory Project: A Library of High-Resolution Spectra of Stars across the Hertzsprung-Russell Diagram. Messenger 2003, 114, 10–14.
- Le Borgne et al. (2003) Le Borgne, J.F.; Bruzual, G.; Pelló, R.; Lançon, A.; Rocca-Volmerange, B.; Sanahuja, B.; Schaerer, D.; Soubiran, C.; Vílchez-Gómez, R. STELIB: A library of stellar spectra at R 2000. Astron. Astrophys. 2003, 402, 433–442. [CrossRef]
- Valdes et al. (2004) Valdes, F.; Gupta, R.; Rose, J.A.; Singh, H.P.; Bell, D.J. The Indo-US Library of Coudé Feed Stellar Spectra. Astrophys. J. Suppl. Ser. 2004, 152, 251–259. [CrossRef]
- Heap and Lindler (2007) Heap, S.R.; Lindler, D.J. Hubble’s Next Generation Spectral Library (NGSL). In From Stars to Galaxies: Building the Pieces to Build Up the Universe; Vallenari, A., Tantalo, R., Portinari, L., Moretti, A., Eds.; Astronomical Society of the Pacific Conference Series; Astronomical Society of the Pacific: Los Angeles, CA, USA, 2007; Volume 374, p. 409.
- Falcón-Barroso et al. (2011) Falcón-Barroso, J.; Sánchez-Blázquez, P.; Vazdekis, A.; Ricciardelli, E.; Cardiel, N.; Cenarro, A.J.; Gorgas, J.; Peletier, R.F. An updated MILES stellar library and stellar population models. Astron. Astrophys. 2011, 532, A95. [CrossRef]
- Wu et al. (2011) Wu, Y.; Singh, H.P.; Prugniel, P.; Gupta, R.; Koleva, M. Coudé-feed stellar spectral library—Atmospheric parameters. Astron. Astrophys. 2011, 525, A71. [CrossRef]
- Mironov et al. (2014) Mironov, A.V.; Zakharov, A.I.; Moshkalev, V.G.; Malkov, O.Y.; Kilpio, E.Y. On the construction of a new 3d atlas of stellar spectral energy distributions. Baltic Astron. 2014, 23, 286–290. [CrossRef]
- Sichevsky and Malkov (2016) Sichevsky, S.; Malkov, O. Estimating stellar parameters and interstellar extinction from evolutionary tracks. Baltic Astron. 2016, 25, 67–74. [CrossRef]
- Sichevskij (2016) Sichevskij, S.G. Estimation of a star’s radius from its effective temperature and surface gravity taking into account stellar evolution. Astron. Rep. 2016, 60, 816–830. [CrossRef]
- Sichevskij (2017a) Sichevskij, S.G. Determining basic characteristics of stars from evolutionary computations. Astron. Rep. 2017, 61, 193–205. [CrossRef]
- Sichevskij (2017b) Sichevskij, S.G. Estimates of the radii, masses, and luminosities of LAMOST stars. Astrophys. Bull. 2017, 72, 51–57. [CrossRef]
- Malkov (2003) Malkov, O.Y. Interstellar Extinction from Large Surveys. Baltic Astron. 2003, 12, 514–519. [CrossRef]
- Straižys (1992) Straižys, V. Multicolor Stellar Photometry; Pachart Pub. House: Tucson, AZ, USA, 1992.
- Aihara et al. (2011) Aihara, H.; Allende Prieto, C.; An, D.; Anderson, S.F.; Aubourg, É.; Balbinot, E.; Beers, T.C.; Berlind, A.A.; Bickerton, S.J.; Bizyaev, D.; et al. The Eighth Data Release of the Sloan Digital Sky Survey: First Data from SDSS-III. Astrophys. J. Suppl. Ser. 2011, 193, 29. [CrossRef]
- Martin et al. (2005) Martin, D.C.; Fanson, J.; Schiminovich, D.; Morrissey, P.; Friedman, P.G.; Barlow, T.A.; Conrow, T.; Grange, R.; Jelinsky, P.N.; Milliard, B.; et al. The Galaxy Evolution Explorer: A Space Ultraviolet Survey Mission. Astrophys. J. Lett. 2005, 619, L1–L6. [CrossRef]
- Kilpio and Malkov (1997a) Kilpio, E.Y.; Malkov, O.Y. A study of interstellar absorption in the galaxy. Astron. Rep. 1997, 41, 10–18.
- Kilpio and Malkov (1997b) Kilpio, E.Y.; Malkov, O.Y. Development of a synthetic model of interstellar extinction. Baltic Astron. 1997, 6, 358. [CrossRef]
- Hakkila et al. (1997) Hakkila, J.; Myers, J.M.; Stidham, B.J.; Hartmann, D.H. A Computerized Model of Large-Scale Visual Interstellar Extinction. Astron. J. 1997, 114, 2043. [CrossRef]
- Malkov and Kilpio (2002) Malkov, O.; Kilpio, E. A Synthetic Map of the Galactic Interstellar Extinction. Astrophys. Space Sci. 2002, 280, 115–118. [CrossRef]
- Burstein and Heiles (1982) Burstein, D.; Heiles, C. Reddenings derived from H I and galaxy counts—Accuracy and maps. Astron. J. 1982, 87, 1165–1189. [CrossRef]
- Schlegel et al. (1998) Schlegel, D.J.; Finkbeiner, D.P.; Davis, M. Maps of Dust Infrared Emission for Use in Estimation of Reddening and Cosmic Microwave Background Radiation Foregrounds. Astrophys. J. 1998, 500, 525–553. [CrossRef]
- Gaia Collaboration et al. (2018) Gaia Collaboration.; Brown, A.G.A.; Vallenari, A.; Prusti, T.; de Bruijne, J.H.J.; Babusiaux, C.; Bailer-Jones, C.A.L.; Biermann, M.; Evans, D.W.; Eyer, L.; et al. Gaia Data Release 2. Summary of the contents and survey properties. Astron. Astrophys. 2018, 616, A1. [CrossRef]
- Malkov et al. (2018) Malkov, O.; Karpov, S.; Kilpio, E.; Sichevsky, S.; Chulkov, D.; Dluzhnevskaya, O.; Kovaleva, D.; Kniazev, A.; Mickaelian, A.; Mironov, A.; et al. Interstellar extinction from photometric surveys: Application to four high-latitude areas. Open Astron. 2018, 27, 62–69. [CrossRef]
- Malkov and Karpov (2011) Malkov, O.; Karpov, S. Cross-Matching Large Photometric Catalogs for Parameterization of Single and Binary Stars. In Astronomical Data Analysis Software and Systems XX; Astronomical Society of the Pacific Conference Series; Evans, I.N., Accomazzi, A., Mink, D.J., Rots, A.H., Eds.; Astronomical Society of the Pacific: Los Angeles, CA, USA, 2011; Volume 442, p. 583.
- Karpov et al. (2012) Karpov, S.V.; Malkov, O.Y.; Mironov, A.V. Cross-identification of large surveys for finding interstellar extinction. Astrophys. Bull. 2012, 67, 82–89. [CrossRef]
- Malkov et al. (2012) Malkov, O.; Dluzhnevskaya, O.; Karpov, S.; Kilpio, E.; Kniazev, A.; Mironov, A.; Sichevskij, S. Cross Catalogue Matching with Virtual Observatory and Parametrization of Stars. Baltic Astron. 2012, 21, 319–330.
- Skrutskie et al. (2006) Skrutskie, M.F.; Cutri, R.M.; Stiening, R.; Weinberg, M.D.; Schneider, S.; Carpenter, J.M.; Beichman, C.; Capps, R.; Chester, T.; Elias, J.; et al. The Two Micron All Sky Survey (2MASS). Astron. J. 2006, 131, 1163–1183. [CrossRef]
- Lawrence et al. (2007) Lawrence, A.; Warren, S.J.; Almaini, O.; Edge, A.C.; Hambly, N.C.; Jameson, R.F.; Lucas, P.; Casali, M.; Adamson, A.; Dye, S.; et al. The UKIRT Infrared Deep Sky Survey (UKIDSS). Mon. Not. R. Astron. Soc. 2007, 379, 1599–1617. [CrossRef]
- Yuan et al. (2013) Yuan, H.B.; Liu, X.W.; Xiang, M.S. Empirical extinction coefficients for the GALEX, SDSS, 2MASS and WISE passbands. Mon. Not. R. Astron. Soc. 2013, 430, 2188–2199. [CrossRef]
- Schlafly and Finkbeiner (2011) Schlafly, E.F.; Finkbeiner, D.P. Measuring Reddening with Sloan Digital Sky Survey Stellar Spectra and Recalibrating SFD. Astrophys. J. 2011, 737, 103. [CrossRef]
- Kraus and Hillenbrand (2007) Kraus, A.L.; Hillenbrand, L.A. The Stellar Populations of Praesepe and Coma Berenices. Astron. J. 2007, 134, 2340–2352. [CrossRef]
- Findeisen et al. (2011) Findeisen, K.; Hillenbrand, L.; Soderblom, D. Stellar Activity in the Broadband Ultraviolet. Astron. J. 2011, 142, 23. [CrossRef]
- Hodgkin et al. (2009) Hodgkin, S.T.; Irwin, M.J.; Hewett, P.C.; Warren, S.J. The UKIRT wide field camera ZYJHK photometric system: Calibration from 2MASS. Mon. Not. R. Astron. Soc. 2009, 394, 675–692. [CrossRef]
- Bailer-Jones et al. (2018) Bailer-Jones, C.A.L.; Rybizki, J.; Fouesneau, M.; Mantelet, G.; Andrae, R. Estimating Distance from Parallaxes. IV. Distances to 1.33 Billion Stars in Gaia Data Release 2. Astron. J. 2018, 156, 58. [CrossRef]
- Covey et al. (2007) Covey, K.R.; Ivezić, Ž.; Schlegel, D.; Finkbeiner, D.; Padmanabhan, N.; Lupton, R.H.; Agüeros, M.A.; Bochanski, J.J.; Hawley, S.L.; West, A.A.; et al. Stellar SEDs from 0.3 to 2.5 m: Tracing the Stellar Locus and Searching for Color Outliers in the SDSS and 2MASS. Astron. J. 2007, 134, 2398–2417. [CrossRef]
- Luo et al. (2015) Luo, A.L.; Zhao, Y.H.; Zhao, G.; Deng, L.C.; Liu, X.W.; Jing, Y.P.; Wang, G.; Zhang, H.T.; Shi, J.R.; Cui, X.Q.; et al. The first data release (DR1) of the LAMOST regular survey. Res. Astron. Astrophys. 2015, 15, 1095. [CrossRef]
- Perlmutter et al. (1999) Perlmutter, S.; Aldering, G.; Goldhaber, G.; Knop, R.A.; Nugent, P.; Castro, P.G.; Deustua, S.; Fabbro, S.; Goobar, A.; Groom, D.E.; et al. Measurements of and from 42 High-Redshift Supernovae. Astrophys. J. 1999, 517, 565–586. [CrossRef]
- Lindegren et al. (2018) Lindegren, L.; Hernández, J.; Bombrun, A.; Klioner, S.; Bastian, U.; Ramos-Lerate, M.; de Torres, A.; Steidelmüller, H.; Stephenson, C.; Hobbs, D.; et al. Gaia Data Release 2. The astrometric solution. Astron. Astrophys. 2018, 616, A2. [CrossRef]
- Doi et al. (2010) Doi, M.; Tanaka, M.; Fukugita, M.; Gunn, J.E.; Yasuda, N.; Ivezić, Ž.; Brinkmann, J.; de Haars, E.; Kleinman, S.J.; Krzesinski, J.; French Leger, R. Photometric Response Functions of the Sloan Digital Sky Survey Imager. Astron. J. 2010, 139, 1628–1648. [CrossRef]
- Evans et al. (2018) Evans, D.W.; Riello, M.; De Angeli, F.; Carrasco, J.M.; Montegriffo, P.; Fabricius, C.; Jordi, C.; Palaversa, L.; Diener, C.; Busso, G.; et al. Gaia Data Release 2. Photometric content and validation. Astron. Astrophys. 2018, 616, A4. [CrossRef]