Predicting Group Cohesiveness in Images
Abstract
The cohesiveness of a group is an essential indicator of the emotional state, structure and success of a group of people. We study the factors that influence the perception of group-level cohesion and propose methods for estimating the human-perceived cohesion on the group cohesiveness scale. In order to identify the visual cues (attributes) for cohesion, we conducted a user survey. Image analysis is performed at a group-level via a multi-task convolutional neural network. For analyzing the contribution of facial expressions of the group members for predicting the Group Cohesion Score (GCS), a capsule network is explored. We add GCS to the Group Affect database and propose the ‘GAF-Cohesion database’. The proposed model performs well on the database and is able to achieve near human-level performance in predicting a group’s cohesion score. It is interesting to note that group cohesion as an attribute, when jointly trained for group-level emotion prediction, helps in increasing the performance for the later task. This suggests that group-level emotion and cohesion are correlated.
I Introduction
The concept of ‘teamwork’ is defined as the collaborative effort of a group of people to accomplish a common goal in the most well-organized way [1]. One of the most important requirements for effective teamwork is cohesion. The main motivation of our work is to understand the human perception of Group Cohesiveness Score (GCS) [2] from images and map the attributes to an Automatic Group Cohesion (AGC) pipeline. Group cohesiveness is defined as the measure of bonding between group members. Higher cohesiveness implies stronger group-level bonding. According to psychological studies, group cohesion depends on several factors such as members’ similarity [3], group size [4], group success [5] and external competition and threats [6, 7]. The reason behind a strong group bonding can be positive (e.g. group success) or negative (e.g. threats). One of the key factors behind any group-level success is high group cohesiveness [8] as it affects group-level performance. Beal et al. [8] argue that group cohesion plays the most important role in group performance. Similarly, group members’ satisfaction [9] also plays an important role in deciding the cohesiveness of a group.


Hackman et al. [9] state that members belonging to a cohesive group have more satisfaction as compared to a non-cohesive group. Myers [10] indicates that people belonging to a cohesive group are less prone to anxiety and tension. Lott et al. [11] found that group cohesion helps improve individual members’ learning processes. Inspired by the aforementioned studies, in this work we are interested in investigating the following research questions:
-
•
How useful are holistic (image-level) and facial information for predicting cohesion in a group?
-
•
What are the factors that affect the perception of the cohesiveness in a group?
-
•
What is the usefulness of cohesiveness as an attribute for tasks such as group emotion prediction?
In this work, we investigate AGC analysis from an early prediction perspective. This can also be viewed as a first impression of a group’s cohesion, similar to the early personality assessment [12] problem in affective computing. The main contributions of this paper are as follows:
-
1.
To the best of our knowledge, this is the first study proposing AGC prediction in images;
-
2.
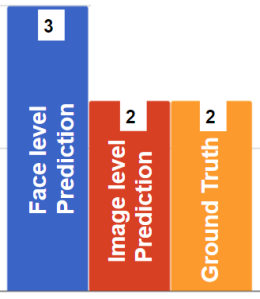
We compare two cohesion models, representing scene (holistic) and face-level information respectively, and show that the former contributes more to the perception of cohesion;
- 3.
-
4.
From our experimental results, we observed that the perceived group emotion is related to group cohesiveness (Section VI).
The rest of the paper is structured as follows: Section II describes the prior works on Group cohesion. Section III explains the challenges involved in predicting the GCS task and the procedure of our survey. Section IV discusses the data and labeling process. The details of the proposed methods are described in Section V. Experiments are discussed in Section VI. Section VII describes regarding the visual attributes that our network learn. Conclusion, limitations and future research directions are discussed in Section VIII.
II Prior Work
II-A Group-level Cohesion (Psychological Aspects)
According to Barsade et al. [14], several factors impact the perception of a group’s cohesion and emotion. The authors [14] argued that social norms and constraints (i.e. interpersonal bonding and individual emotional responses) are important cues for group emotion and cohesion. Gallagher et al. [15] modelled the group as a min span tree based on facial locations and inferred the gender and age of group members using the group-level contextual information. Tajfel et al. [3] stated that one of the main factors which affect a group’s cohesiveness is its group members’ similarity. Here, similarity can be measured in terms of their occupation, ethnicity, age and relationship etc. This may also imply that due to these factors group members may have a similar point of view about certain issues, which may cause strong bonding between them. Another interesting study by Carron et al. [4] suggested that a small group implies strong cohesion. The reason behind this is that as the number of group members increases, their opinions may vary. This may lead to weaker cohesiveness as compared to small groups. Zaccaro et al. [5] argued that group-level success (towards a task) is another factor, which influences cohesiveness, along with the group’s size and its members’ similarity. Apart from the positive factors, some negative factors may also influence a group’s cohesiveness. Several studies [6, 7] revealed that threats to a group and competition with another group may also increase a group’s cohesiveness.
In a seminal work, Hung et al. [16] studied group cohesion in a constrained environment using audiovisual-based group meeting data. Several audio and video features were extracted to test their importance on group cohesion. For audio analysis, pauses between individual turns, pauses between floor exchanges, turn lengths, overlapping speech, prosodic cues etc. are taken into consideration. Similarly, video features include pauses between individual turns, pauses between floor exchanges, motion turn lengths, overlapping visual activity, visual energy cues, ranking participants’ features and group distribution features etc. Further, an SVM based classifier is used for predicting overall cohesion score. To the best of our knowledge, this is the first work that investigates the automatic cohesion of a group of people in videos.
II-B Study of ‘Group of People’
In recent years, computer vision researchers have studied automatic analysis of ‘group of people’ for different tasks. In an interesting work, Chang et al. [17] predicted group-level activity via hierarchical agglomerative as well as the divisive clustering algorithm. In order to track the group-level activity, multiple cameras are placed in different environments (e.g. in an abandoned prison yard) which first detect group related information such as group formation, dispersion and distinct groups. Further, it investigates motion patterns (Loitering, Fast Moving, Approaching, Following) and behaviour (e.g. Flanking, Agitation, Aggression). In another work, Wang et al. [18] proposed a method to infer the relationship between group members via geometric structure and appearance based features of the group. The AMIGOS database [19] has been recently proposed to study different aspects of affect in a group-level setting.
II-C Group Emotion
One of the first group emotion analyses was proposed by Dhall et al. [20]. They proposed the Group Expression Model (GEM) to predict happiness intensity of a group of people in images. Several other studies [21, 22, 23, 24, 25, 26, 27] mainly extracted scene, face and pose features to predict group emotion. In another recent paper, Singh et al. [28] studied the effect of a group on a person’s smile. They evaluated the usefulness of visual features in predicting the task.
III Challenges and Survey Result
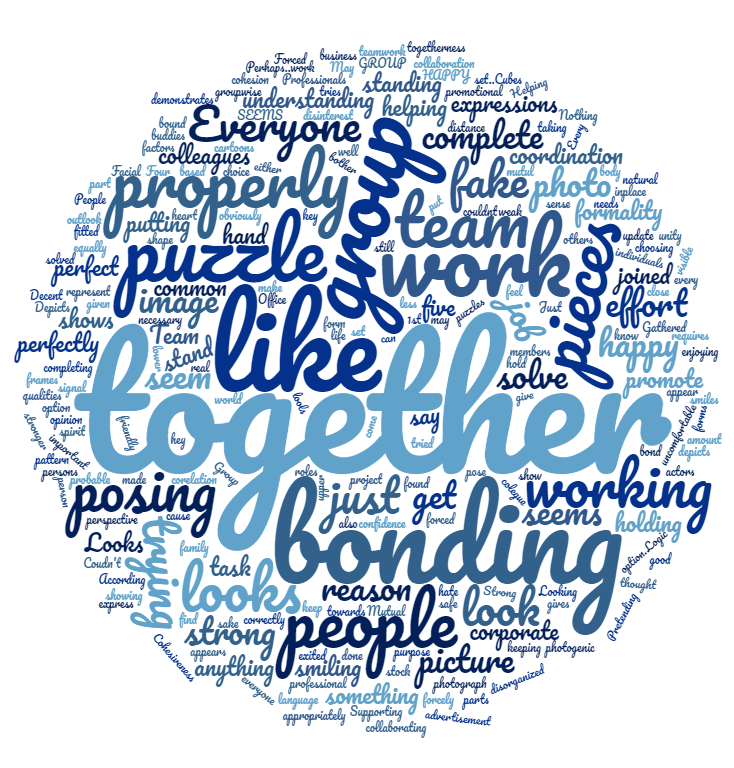
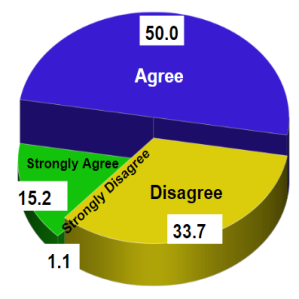
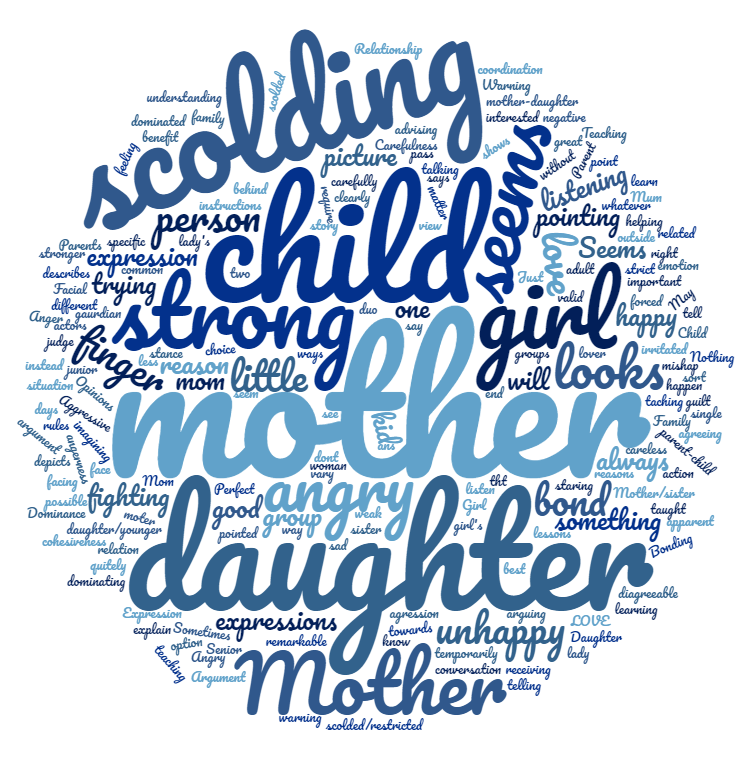
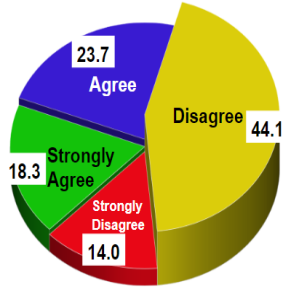
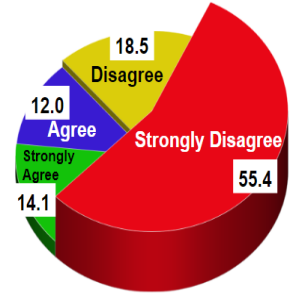
This section describes the challenges involved in designing an AGC prediction network. To design an automated system for AGC prediction, we wish to know the factors which affect the perception of cohesion of a group. In the existing literature, the perception of members’ similarity [3] is claimed to be a vital visual cue; however, the first perception after viewing an image differs considerably from person to person. To understand the important visual cues, we have conducted a survey. The survey is conducted via Google form with 102 participants. There are 59 male and 43 female participants belonging to age group 22-54 years. The participants are from different backgrounds like student, businessman, corporate employee etc. The form consists of 24 images (as shown in Fig. 3) of groups of people in different contexts and having different GCS values (6 images for each GCS value). Based on Treadwell et al. [2], we use four levels of cohesion. Before filling in the form, the participants are familiarized with the concept of group cohesion labels [2] with images. The participants have to select one of the four cohesion levels for each image and they have to provide reasons behind their choice. Thus, we are provided some keywords related to the AGC score and corresponding image. After analyzing the responses, we get the statistics as shown in Fig. 5. From the word clouds of Fig. 5, we can see that ‘team’, ‘bonding’ and ‘together’ are the most frequent keyword responses which indicate that we are dealing with group-level effects. Further, ‘winning’, ‘trophy’, ‘work’, ‘scolding’, ‘fight’ etc. reflect some holistic level features which motivate us to study image-level analysis. Similarly, some keywords such as ‘happy’, ‘cheering’, ‘angry’, ‘violence’ etc. tell about the mood of the individuals as well as the group. Thus, the survey motivates us to utilize both image-level features and face-level emotion features of an image. Our experiments are based on the understandings from the survey.

IV Database
To create the database, we have used and extended the images from the GAF 3.0 database [13]. GAF 3.0 has been created via web crawling of various keywords related to social events (for example world cup winners, wedding, family, laughing club, birthday party, siblings, riot, protest and violence etc.). Images are added to GAF 3.0 to get a total of 14,175 images. We split the data into three parts: 9,815 images for training, 4,349 images for validation and 3011 images for testing purposes.
IV-A Data Labeling
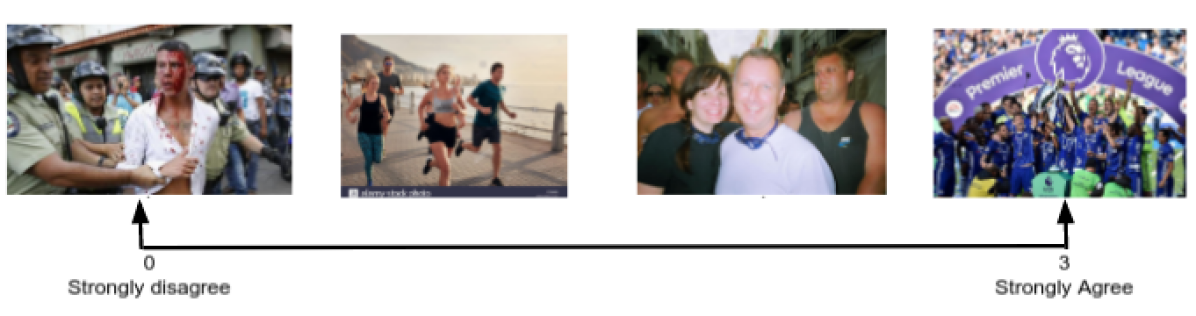
The GAF 3.0 database was labelled by 5 annotators (3 females and 2 males) of age group 21-30 years. In order to annotate data, the survey results assist about human perception regarding AGC. We have labelled each image for its cohesiveness in the range [0-3] [2] as shown in Fig. 2. Treadwell et al. [2] argued that it is better to have these four ‘anchor points’ (i.e., strongly agree, agree, disagree and strongly disagree) instead of having low to high scores. The low to high score scaling may vary perception-wise from person to person. Thus, these soft scaled ‘anchor points’ are reliable. Along with GCS, GAF 3.0 database is also labelled with three group emotions (positive, negative and neutral) across the valance axis. Before the annotation, the annotators are familiarized with the concepts of GCS labels [2] with corresponding images.
IV-B Annotation Statistics
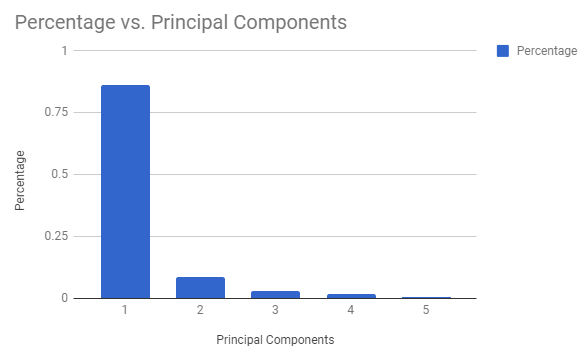
We further investigate the agreement between the annotators. The average variance and standard deviation between the annotators are 0.31 and 0.54, respectively. Further, we conduct a principal component analysis on the annotations as shown in Fig. 4. It is evident that approx. 86% of the distribution lies in the first component, which suggests that there is a strong agreement between the annotators. Since the annotations were based on a ‘mutually exclusive category’, we also measure the weighted generalized Cohen’s kappa coefficient [29] to determine the inter-rater agreement. The mean of the kappa coefficients value is 0.51. This also indicates high inter-rater agreeableness.
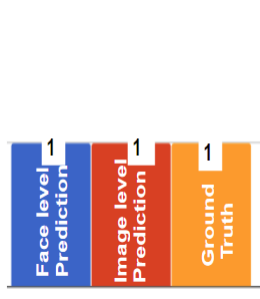
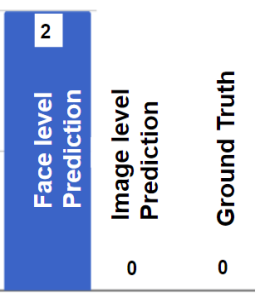
Images Word Cloud Survey Responses Network Predictions


V Proposed Method
In this section, we discuss our approach for AGC analysis. We examined two networks one of which examines the image as a whole and another examines the facial expression of the group members.
| GAF 3.0 | Ours | VGG 16 | AlexNet | ||
|---|---|---|---|---|---|
| MSE, GCS | 0.8181 | 0.8967 | 1.0375 | ||
|
85.58 | 40.26 | 72.21 |
V-A Image-level Analysis
The motivation of this part is to collectively analyze the group and its surroundings. This should also provide contextual information about the group i.e. where the group is and what type of event they are participating in. We use the Inception V3 [30] to train our model for predicting GCS. The main reason behind choosing inception V3 is that it provides a good trade-off between the number of parameters and accuracy in the case of the ImageNet challenge [30]. We have also conducted experiments on several deep Convolutional Neural Networks (CNNs), and results are shown in TABLE I. The inception V3 network is similar to the original work [30], which was proposed for the classification on the ImageNet task except for the last few dense layers including the regression layer. The details of the layers are shown in TABLE II.
| Layers | Input | Output | Layer Details | ||
| Inception V3 | b,224,224,3 | b,2048 | similar to [30] | ||
| Dense | b,2048 | b,4096 | 4096 | ||
| Activation | b,4096 | b,4096 | Relu/Swish | ||
| Dense | b,4096 | b,4096 | 4096 | ||
| Activation | b,4096 | b,4096 | Relu/Swish | ||
| Dense | b,4096 | b,4096 | 4096 | ||
| Activation | b,4096 | b,4096 | Relu/Swish | ||
|
b,4096 | b,1 | 1 |
In the word cloud of the survey result, people mentioned some group-level emotion-related keywords such as ‘violence’, ‘happy’, ‘angry’, ‘upset’ etc. Thus, we perform experiments with joint training for GCS and group emotion (three classes positive, neutral and negative [13]). The motivation is to explore the usefulness of GCS of a group as an attribute for group emotion prediction. The network structure is the same as shown in TABLE II except for the last layer which predicts three group emotion probabilities and one GCS.

V-B Face-Level Analysis
Motivated by the result of joint training of the AGC and group emotion and survey results (apart from team, group keywords people are mainly focused on the mood like keywords such as angry, cheering, unhappy, violence etc.), we attempt to infer GCS based on the face-level emotion information as well. For facial emotion analysis, we use the recently proposed CapsNet [32] architecture as shown in Fig. 6. In order to overcome the drawbacks of traditional CNNs, Sabour et al. [32] proposed a new CNN like architecture Capsule Network (CapsNet), which keeps the spatial orientation related information along with deep features. Here, capsules are a group of neurons which include the instantiation parameters of a certain object. For example, a face has eyes, nose, lips with certain constraints. The main difference between a CNN and a capsule Network is that the later stores the state of the feature (neuron output) in the form of a vector instead of a scalar. Another salient property of CapsNet is routing by agreement, which means activated capsules follow a hierarchy. Higher level capsules become activated if and only if lower level capsule outputs agree with it. As per [32], CapsNet is invariant to rotation and it can model a spatial hierarchy via dynamic routing and reconstruction regularization. Thus, the network can learn the pattern of viewpoint invariance between the object part and the whole object. From TABLE III, we can observe that CapsNet performs better than the other state-of-the-art networks. CapsNet can explicitly model the pose and illumination of an object. Inspired by this argument, we choose to train CapsNet.
We slightly modified the proposed architecture of CapsNet [32] used for digit classification. CapsNet takes cropped face as input and predicts the seven basic emotions (i.e. happy, neutral, sad, angry, surprise, disgust and fear) as a output. Thus, we get emotion probability predictions for each of the faces present in a group image. Further, we pool the predicted emotion labels by computing the average, maximum and minimum (get dimensional output). This small feature is then fed to two dense layers of 16 and 32 nodes (empirically) respectively before predicting the GCS. This whole network structure is shown in TABLE IV.
| Layers | Input | Output | Layer Details | ||
| Dense | b,3,7 | b,3,16 | 16 | ||
| BN and Activation | b,3,16 | b,3,16 | Relu/Swish | ||
| Dense | b,3,16 | b,3,32 | 32 | ||
| BN and Activation | b,3,32 | b,3,32 | Relu/Swish | ||
| Max Pooling | b,3,32 | b,1,32 | 3(1-D) | ||
| Flatten | b,1,32 | b,32 | - | ||
|
b,32 | b,1 | 1 |
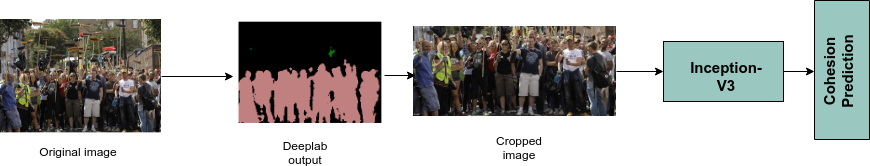
V-C Effect of Background
Further, we also investigate how the background effects AGC. We use the segmentation technique to crop people from group images via Deeplab V3plus [31] library. We consider an area-wise threshold, i.e. if the segmented area is less than 50% of the total area of the image then this image is considered for analysis (pipeline is shown in Fig. 6). Thus, we observed that when we use the segmented image for training, then there is a drop (around 0.103 MSE decreased) in performance. It indicates that the background around a person also plays a vital role in the perception of a group’s cohesiveness. The background may reflect something about the social event in which the group is participating and is important for the prediction.
VI Experimental Details and Results
In this section, we discuss the experimental settings and results. First of all, we treat cohesion as a regression problem (as also defined in [2]) and the group emotion as a classification problem (defined in [13]). We use the Keras [33] deep learning library for the implementation.
VI-A Image-Level Analysis Results
We train Inception V3 network for image-level analysis. We initialize the network with ImageNet pre-trained weights and fine-tune the network with SGD optimizer having a learning rate of 0.001 and momentum 0.9 without any learning rate decay. Our image-level experimental results are shown in TABLE VI. With similar hyperparameters, we jointly train an inception V3 network for both emotion and cohesion prediction. The results (TABLE V) show an interesting pattern. When the inception V3 is individually used for group emotion and cohesion prediction, its performance is lower than the joint training. Thus, it suggests that the network learns more relevant representations of group emotion. We can conclude that the emotion and cohesion at group-level are interrelated terms. Human perception behind group emotion and cohesion has some sort of similarity.
| Network | Accuracy (%) | MSE | ||
|---|---|---|---|---|
|
85.58 | 0.8181 | ||
|
65.41 | NA | ||
|
NA | 0.8537 |
This is in accord with psychology studies [14]. It is also interesting to note that the effect of joint training is opposite to the GCS prediction as the prediction error increases. One possible reason is that GCS and group emotion features contradict each other. Let us consider the example of a sobbing family, which has high GCS and negative group emotion and compare that with of a celebrating sports team, which will also have high GCS. In the later, the group emotion will be positive. Scenarios like this may lead to ambiguity during the joint training from the GCS prediction perspective.
| Network Details | Image-Level | Face-level | EmotiW Baseline |
|---|---|---|---|
| GCS (MSE on Val. set) | 0.85 | 1.11 | 0.84 |
| GCS (MSE on Test set) | 0.53 | 0.91 | 0.50 |
| Cross validation |
|
|
||||
|---|---|---|---|---|---|---|
| 1st | 0.63958 | 0.65662 | ||||
| 2nd | 1.10628 | 1.06666 | ||||
| 3rd | 0.70162 | 0.67964 | ||||
| 4th | 0.60604 | 0.76320 | ||||
| 5th | 0.93969 | 0.89159 | ||||
| Average | 0.79864 | 0.81155 |

VI-B Face-Level Analysis Results
In order to predict GCS, we pre-trained a CapsNet (Capsule Net) on RAF-DB [34]. RAF-DB [34] is a facial expression database containing around 30K single person face images which are labeled for seven basic emotion classes as well as 12 compound emotions. We take basic emotions (i.e. happy, neutral, sad, angry, surprise, disgust and fear) to train our CapsNet. From group images, we extracted faces via MTCNN [35]. After training on RAF-DB, we take the output probability vector for each face in the group image. Further, we compute statistics over these emotion probabilities and pass it through two more dense layers before final cohesion score prediction. Our statistics include maximum, average and minimum of respective emotion probabilities. The motivation behind this is that we need to conclude over a group. Hence, these three intensity level analyses perform better for group-level tasks.
We train a CapsNet with hyperparameters from the original paper (Adam optimizer with default settings in the Keras library and learning rate decay of 0.001 in every 10th epoch to avoid local minima). We train the rest of the network via SGD optimizer with learning rate 0.01 and without any learning rate decay. TABLE VI presents the results of the image-level and face-level networks in GAF Cohesion database. TABLE VII describes 5-fold cross-validation results of the GAF cohesion database. In TABLE VIII, we predict group emotion, when AGC information is used for joint training. The results of the GAF 2.0 show better performance than the other state-of-the-art methods. This shows that cohesiveness information is useful for group emotion prediction.
VII Visualization (Saliency vs Class Activation)
In this section, we discuss visual attributes that our network learns. We visualize the class activation map and discuss its comparison with the saliency. From Fig. 7, we can observe that in spite of non-frontal, rotated, occlusion, blurred faces, CapsNet can handle each case efficiently. Especially, it deals with the rotation and scaling of different objects in an image individually and shows better performance over both occluded and partially occluded images which is beneficial for our problem. Moreover, it did not require data augmentation while training and thus it is efficient regarding time complexity. Similarly, for image-level analysis, (as shown in Fig. 8) the top row activates the background, the second row activates the foreground, the third row activates the subject and the last row activates both the front person and background. In the case of the top row, it activates the background, as the group takes up a small space as compared to the visible background. Similarly, in the second case the foreground is more dominant as compared to the background. In the third row, the main features of the protests that are activated are the banners. In the last picture, it activates both foreground and background, especially the facial region.


The image saliency and class activation have a significant difference. From Fig. 7 and Fig. 8, respectively, it is visible that AGC is not directly labeled as well as predicted via image saliency. Although, there are some regions in images, which are common in both cases. Of course, sometimes the human mind is also influenced by some salient feature of the images.
VIII Conclusion, Limitation and Future Work
The main motivation behind our approach is to achieve human-level perception regarding cohesion and to study the reason behind it. Here, we use the term human-level because we consider human annotation as the ground truth. From our experimental results, it can be deduced that AGC and emotion are interrelated. This work leverages the usefulness of both facial and scene features. We also observed that the newly proposed CapsNet [32] also performs well on facial expression recognition without data augmentation. Although the faces in a group image vary largely, i.e. the face can be occluded, blurred or non-frontal and others. Via visualization, we observed that scene information encodes the background, clothes and various objects in an image. This information is also known as the top-down contextual information. The main limitation of our work is the cultural influence in data annotation as it is related to the perception of cohesion. A potential future direction for our work is to investigate how facial attributes effect AGC prediction. It will be interesting to analyze the role of the body pose of the group members along with the face. Although, the image-level network does encode the body pose, however, its complete contribution requires further investigation. It will be of interest to analyze the fashion quotient of the group by parsing the clothes for patterns and themes, which correspond to specific social events, although, some patterns are already encoded in our scene level analysis. Furthermore, another possible direction is to include kinship related information in the network because irrespective of visual expression, sometimes kinship indicates strong cohesion.
Acknowledgement
We acknowledge the support of NVIDIA for providing us TITAN Xp G5X GPU for research purposes.
References
- [1] E. Salas, N. J. Cooke, and M. A. Rosen, “On teams, teamwork, and team performance: Discoveries and developments,” Human Factors, vol. 50, no. 3, pp. 540–547, 2008.
- [2] T. Treadwell, N. Lavertue, V. Kumar, and V. Veeraraghavan, “The group cohesion scale-revised: reliability and validity,” Journal of Group Psychotherapy, Psychodrama and Sociometry, vol. 54, no. 1, p. 3, 2001.
- [3] H. Tajfel, Social identity and intergroup relations. Cambridge University Press,2010.
- [4] A. V. Carron and K. S. Spink, “The group size-cohesion relationship in minimal groups,” Small group research, vol. 26, pp. 86–105, 1995.
- [5] S. J. Zaccaro and M. C. McCoy, “The effects of task and interpersonal cohesiveness on performance of a disjunctive group task,” Journal of Applied Social Psychology, vol. 18, no. 10, pp. 837–851, 1988.
- [6] W. R. Thompson and D. P. Rapkin, “Collaboration, consensus, and detente: The external threat-bloc cohesion hypothesis,” Journal of Conflict Resolution, pp. 615–637, 1981.
- [7] M. W. Rempel and R. J. Fisher, “Perceived threat, cohesion, and group problem solving in intergroup conflict,” International Journal of Conflict Management, vol. 8, no. 3, pp. 216–234, 1997.
- [8] D. J. Beal, R. R. Cohen, M. J. Burke, and C. L. McLendon, “Cohesion and performance in groups: a meta-analytic clarification of construct relations.” Journal of Applied Psychology, vol. 88, no. 6, p. 989, 2003.
- [9] J. R. Hackman, Group influences on individuals in organizations. Consulting Psychologists Press, 1992.
- [10] A. E. Myers, “Team competition, success, and the adjustment of group members.” Illinois University Urbana Group Effectiveness Research Lab, Tech. Rep., 1961.
- [11] A. J. Lott and B. E. Lott, “Group cohesiveness as interpersonal attraction: A review of relationships with antecedent and consequent variables.” Psychological Bulletin, 1965.
- [12] V. Ponce-López, B. Chen, M. Oliu, C. Corneanu, A. Clapés, I. Guyon, X. Baró, H. J. Escalante, and S. Escalera, “Chalearn lap 2016: First round challenge on first impressions-dataset and results,” in European Conference on Computer Vision, 2016.
- [13] A. Dhall, R. Goecke, S. Ghosh, J. Joshi, J. Hoey, and T. Gedeon, “From individual to group-level emotion recognition: Emotiw 5.0,” in ACM International Conference on Multimodal Interaction, 2017.
- [14] S. G. Barsade and D. E. Gibson, “Group emotion: A view from top and bottom.” Composition., 1998.
- [15] A. C. Gallagher and T. Chen, “Understanding images of groups of people,” in IEEE Computer Vision and Pattern Recognition, 2009.
- [16] H. Hung and D. Gatica-Perez, “Estimating cohesion in small groups using audio-visual nonverbal behavior,” IEEE Transactions on Multimedia,2015, vol. 12, no. 6, pp. 563–575.
- [17] M. C. Chang, N. Krahnstoever, S. Lim, and T. Yu, “Group level activity recognition in crowded environments across multiple cameras,” in IEEE International Conference on Advanced Video and Signal-based Surveillance, 2010.
- [18] X. Wang, G. Guo, M. Rohith, and C. Kambhamettu, “Leveraging geometry and appearance cues for recognizing family photos,” in IEEE Automatic Face and Gesture Recognition Workshop, 2015.
- [19] J. A. Miranda-Correa, M. K. Abadi, N. Sebe, and I. Patras, “Amigos: A dataset for mood, personality and affect research on individuals and groups,” IEEE Transactions on Affective Computing, 2019.
- [20] A. Dhall, R. Goecke, and T. Gedeon, “Automatic group happiness intensity analysis,” IEEE Transactions on Affective Computing, vol. 6, no. 1, pp. 13–26, 2015.
- [21] J. Hernandez, M. E. Hoque, W. Drevo, and R. W. Picard, “Mood meter: counting smiles in the wild,” in ACM UbiComp, 2012.
- [22] X. Huang, A. Dhall, G. Zhao, R. Goecke, and M. Pietikäinen, “Riesz-based volume local binary pattern and A novel group expression model for group happiness intensity analysis,” in British Machine Vision Conference, 2015.
- [23] J. Li, S. Roy, J. Feng, and T. Sim, “Happiness level prediction with sequential inputs via multiple regressions,” in ACM International Conference on Multimodal Interaction, 2016.
- [24] B. Sun, Q. Wei, L. Li, Q. Xu, J. He, and L. Yu, “Lstm for dynamic emotion and group emotion recognition in the wild,” in ACM International Conference on Multimodal Interaction, 2016.
- [25] Q. Wei, Y. Zhao, Q. Xu, L. Li, J. He, L. Yu, and B. Sun, “A new deep-learning framework for group emotion recognition,” in ACM International Conference on Multimodal Interaction, 2017.
- [26] X. Guo, L. F. Polanía, and K. E. Barner, “Group-level emotion recognition using deep models on image scene, faces, and skeletons,” in ACM International Conference on Multimodal Interaction, 2017.
- [27] S. Ghosh, A. Dhall, and N. Sebe, “Automatic group affect analysis in images via visual attribute and feature networks,” in IEEE International Conference on Image Processing, 2018.
- [28] V. K. Singh, A. Atrey, and S. Hegde, “Do individuals smile more in diverse social company?: Studying smiles and diversity via social media photos,” in Proceedings of the ACM on Multimedia Conference, 2017.
- [29] K. L. Gwet, “Computing inter-rater reliability and its variance in the presence of high agreement,” British Journal of Mathematical and Statistical Psychology, 2008.
- [30] C. Szegedy, V. Vanhoucke, S. Ioffe, J. Shlens, and Z. Wojna, “Rethinking the inception architecture for computer vision,” in Proceedings of the IEEE Conference on Computer Vision and Pattern Recognition, 2016.
- [31] L. C. Chen, Y. Zhu, G. Papandreou, F. Schroff, and H. Adam, “Encoder-decoder with atrous separable convolution for semantic image segmentation,” arXiv:1802.02611, 2018.
- [32] S. Sabour, N. Frosst, and G. E. Hinton, “Dynamic routing between capsules,” in Advances in Neural Information Processing Systems, 2017.
- [33] F. Chollet, “keras,” GitHub Repository,2015.
- [34] S. Li, W. Deng, and J. Du, “Reliable crowdsourcing and deep locality-preserving learning for expression recognition in the wild,” in IEEE Computer Vision and Pattern Recognition, 2017.
- [35] K. Zhang, Z. Zhang, Z. Li, and Y. Qiao, “Joint face detection and alignment using multitask cascaded convolutional networks,” IEEE Signal Processing Letters, 2016.
- [36] L. Tan, K. Zhang, K. Wang, X. Zeng, X. Peng, and Y. Qiao, “Group emotion recognition with individual facial emotion cnns and global image based cnns,” in ACM International Conference on Multimodal Interaction, 2017.