Topological properties of fractal Julia sets related to the signs and magnitudes of the real and reactive powers.
Héctor A. Tabares-Ospina111Facultad de Ingeniería, Institución Universitaria Pascual Bravo, Medellín, Colombia. Email: h.tabares@pascualbravo.edu.co and John E. Candelo-Becerra222Facultad de Minas, Universidad Nacional de Colombia, Medellín, Colombia. Email: jecandelob@unal.edu.co
Abstract
In AC electrical systems, the power depends on the real power (P) due to resistive elements and the reactive power (Q) due to the inductive and capacitive elements, which are commonly studied by using phasor and scalar methods. Thus, this paper focuses on applying the fractal Julia sets to observe the topological properties related to the signs and magnitudes of the real and reactive powers consumed or supplied by an electrical circuit. To perform this, different power combinations were used to represent the fractal diagrams with an algorithm that considers the mathematical model of Julia sets. The study considers three type of loads: the first study considers the change of real power when the reactive power is fixed; the second study deals with the change of the reactive power when the real power is fixed; and finally, the third study contemplates that both real and reactive powers change. Furthermore, the fractal diagrams of the power in the four quadrants of the complex plane are studied to identify the topological properties that each sign and magnitude represent. A qualitative analysis of the diagrams helps to identify that the complex power loads present some fractal graphic patterns, with respect to the signs and magnitudes considered in the different quadrants of the complex planes. The diagrams represented in the complex planes save a relation in the forms and structure with other points studied, concluding that the power is related to other figures in other quadrants. Thus, this result allows a new study of the behavior of the power in an electrical circuit, showing a clear relation of the different fractal diagrams that the Julia sets obtained.
Keywords: Real power, reactive power, fractal geometry, Julia set, Mandelbrot set, behavior patterns, power factor
1 Introduction
In 1975, the mathematic Benoit Mandelbrot was the responsible to define the concept of fractal as a semi geometric element with a repetitive structure at different scales [1], with characteristics of self-similarity as some nature elements such as snowflakes, ferns, peacock feathers, and romanesco broccoli. Fractal theory has been applied to various fields such as biology [2,3], health sciences [4–8], stock markets [9], network communications [10–12], and others. Fractal theory is one of the methods used to analyze data and obtain relevant information in a highly complex problem. Thus, it has been used to study the price of highly variable markets, which are not always explainable from classical economic analyzes.
For example, in [9] the authors demonstrate that the current techniques have some issues to explain the real market operation, and a better understanding is achieved by using techniques as theory of chaos and fractals. In their publication, the authors show how to apply the fractal behavior of stock markets. Besides, the authors refer to multifractal analysis and multifractal topology. The first describes the invariability of scaling properties of time series and the second is a function of the Hölder exponents that characterize the degree of irregularity of the signal and their most significant parameters.
In [13], the authors discuss the basic principle of fractal theory and how to use it to forecast the short-term electricity price. In the first instance, the authors analyze the fractal characteristic of the electricity price, confirming that price data have this property. In the second instance, a fractal model is used to build a forecasting model, which offers a wide application in determining the price of electricity in the markets.
Similarly, the authors of [14] demonstrate that the price of thermal coal has multifractal features by using the concepts introduced by Mandelbrot-Bouchaud. Hence, a quarterly fluctuation index (QFI) for thermal power coal price is proposed to forecast the coal price caused by market fluctuation. This study also provides a useful reference to understand the multifractal fluctuation characteristics in other energy prices.
The fractal geometry analysis has been also applied to study the morphology and the population growth of cities, and that the electricity demand is related to the demography of cities. In [15] a multifractal analysis is used to forecast the electricity demand, explaining that two fractals are found, showing the behavior pattern of the power demand. Two concepts linked to fractal geometry are fractal interpolation and extrapolation, related to the resolution of a fractal-encoded image. In [16], an algorithm to forecast the electric charge, in which fractal interpolation and extrapolation are also involved. For the forecast data set, the average relative errors are only 2.303% and 2.296%. The result shows that the algorithm has advantages in improving forecast accuracy.
In the literature, there are not papers related to the study of the signs and magnitudes of real and reactive powers by using Mandelbrot and Julia sets. Besides, the characteristics of the real and reactive powers are not deeply analyzed applying the fractal geometry, concluding that these techniques are not commonly used to study the different behaviors of the power consumption and supply. For this reason, this work focuses on performing a detailed analysis of the characteristics of the real and reactive powers based on the Julia and Mandelbrot sets. Particularly in this work, the real and reactive powers are changed to represent the different Julia sets that allow performing observations to determine a qualitative study. With the purpose to characterize the real and reactive power with the Julia sets as to observe other behavior with the fractal geometry such as: fractal graphic pattern, which requires a new interpretation to identify the different signs. Thus, the following hypothesis is tested: the signs and magnitudes of the real and reactive electrical powers show some related fractal topology patterns in the Julia set, which allows to identify the behavior of the electricity consumption and supply.
The rest of this document is organized as follows. Section 2 includes the brief explanation of the theory of the Mandelbrot sets and Section 3 presents the theory of Julia sets. Section 4 presents the method applied in this research and the algorithm used to identify the topological properties of the different Julia sets of real and reactive power in electric systems. Section 5 presents the results and discussion of the most relevant examples of signs and magnitudes of real and reactive powers. Finally, the main conclusions of this research work are summarized.
1.1 Mandelbrot set
Mandelbrot set, denoted as , represents the sets of complex numbers obtained after iterating the from the initial point and the selected constant as shown (1), the results form a diagram with connected points remaining bounded in an absolute value. One property of is that the points are connected, although in some zones of the diagram it seems that the set is fragmented. The iteration of the function generates a set of numbers called orbits. The results of the iteration of those points out of the boundary set tend to infinity.
| (1) |
From the term , a successive recursion is performed with as the initial term. If this successive recursion is dimensioned, then the term belongs to the Mandelbrot set; if not, then they are excluded. Therefore, Figure 1 shows the Mandelbrot set with points in the black zone that are called the prisoners, while the points in other colors are the escapists and they represent the velocity that they escape to infinite.
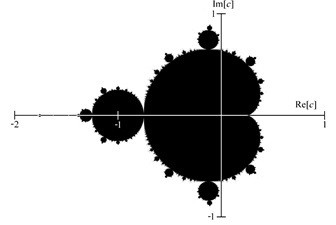
From this figure, the number -1 is inside of the set while the number 1 is outside of the set. In the Mandelbrot set, the fractal is the border and the dimension of Hausdorff is unknown. If the image is enlarged near the edge of the set, many areas the Mandelbrot set are represented in the same form. Besides, different types of Julia sets are distributed in different regions of the Mandelbrot set. Whether a complex number appears with a greater value than 2 in the 0 orbit, then the orbit tends to infinity.
The pseudocode of the algorithm that is used to represent the Mandelbrot set is presented as follows:
Start
For each point in the complex plane do:
Fix
For to do:
Calculate
If then
Break
End if
If then
Draw in white (the point does not belong to the set)
Else if then
Draw in black (as the point does belong to the set)
End if
End For
End
In this research, the presented algorithm has been used to obtain the Mandelbrot set and the diagram that represent it. Some points related to the real and reactive powers with the respective signs are studied in the Mandelbrot set and related to those points created for the Julia sets as explained in the following sections.
1.2 Julia sets
The mathematics Gastón Julia and Pierre Fatuo, at the beginning of the century , developed a fractal sets that are obtained by iterating complex numbers. The Julia sets of a holomorphic function is constituted by those points that under the iteration of have a chaotic behavior and each point of the set forms a different set that is then denoted by . The Fatou set consists of the points that have a stable behavior when they are iterated. The Fatou set of a holomorphic function is denoted by and it is a complement of . An important family of the Julia sets is obtained from the simple quadratic functions, for example , where is a complex number. The values obtained from this function are denoted the , with points of obtained from the parameter that belong to the Julia sets. Other points obtained during the iteration are excluded from the Julia sets as they tend to infinite.
For example, Figure 2 shows a simulation performed to obtain the Julia sets for two complex numbers. Figure 2(a) shows the Julia sets calculated by iterating the function when and Figure 2(b) shows the Julia sets by iterating the same function when . The results show that the complex number represented in Figure 2(a) produces a Julia set of points in black and other points with different colors tend to the infinity according to the number of iterations they require to obtain the result. However, the complex number represented in Figure 2(b) produces a Julia set with non-connected points.
![[Uncaptioned image]](/html/1812.11078/assets/Fig2.jpg)
| (a) | (b) |
An important relation between the Mandelbrot and the Julia sets is given when the point belongs to the Mandelbrot set, then the Julia set obtain a series of points that are connected. On the other side, when the point does not belong to the Mandelbrot set, then the Julia set is formed by non-connected points. Therefore, there are two main classes of Julia sets: points that form a unique piece and points that represent many pieces in the complex plane.
One property of the Mandelbrot set is that the different types of Julia sets are distributed in different regions of the set . For all the above, it is concluded that in Figure 2, is in the set of , and is not in the set. In general, any point within the cardioid or its boundary, the Julia set of the has points that are connected. The most interesting values are those near the border of the Mandelbrot set, because it is there when the set passes, suddenly, from connected points to non-connected points.
2 Procedure implemented in the research
As the electrical power can be expressed as a complex expression given by , the combination values with the respective signs and magnitudes of the real and reactive powers are studied through the representation of the Julia sets, obtaining fractal geometric patterns that allow a qualitative analysis. To validate the hypothesis, the procedure of this research was developed to evaluate certain properties of the electrical power by using the fractal geometry.
The first part of the procedure starts with the analysis of the real and reactive power in the complex plane of the electric power. The following cases are considered in the study:
-
a)
The real power and the reactive power corresponds to the first complex plane.
-
b)
The real power and the reactive power corresponds to the second complex plane.
-
c)
The real power and the reactive power corresponds to the third complex plane.
-
d)
The real power and the reactive power corresponds to the fourth complex plane.
In the second part, an algorithm was programmed to perform the numerical experiments on the Mandelbrot and Julia sets by using the real and reactive power with different power factors. To test the system, the most representative Julia sets were executed.
As the set has infinite values in the quotation, the third part of this work dedicates on determining two quotation points. The limits of in the positive axis are represented in the diagrams and the values of and are scale in the set of with values and .
In order to validate the work hypothesis, the fourth part consisted of operating the program to find a pattern from the fractal geometries, depending on the different signs of the real and reactive powers. In the fifth part, Julia sets were classified, according to their symmetry and degree of irregularity in their borders, selecting the most interesting by their degree of dispersion. Finally, the Julia sets related to each complex plane are found and the conclusions are obtained.
3 Results and analysis
The following figures present the diagrams created with the Julia sets generated from the real and reactive components of the electrical power. These generated fractal geometries do not give a quantitative information of the fact under study; however, the study of the fractals can be performed by a qualitative analysis, whose interpretation is based on the experience.
3.1 Julia sets for the real power
In order to simplify the analysis, the study is performed first for the change of real power with the power factor equal to or the reactive power equals to . This study relates to a resistive circuit where the voltage is in phase with the current. Thus, Figure 3 presents the transformation of the geometric fractal patterns according to the change of real power. These figures are plotted in the complex plane, in which the axis corresponds to the real component and the axis corresponds to the imaginary component . Figure 3(a) shows the fractal when real and reactive powers are equal to , which obtains as a result a circle with radius equal to . Figure 3(b) presents the fractal when , showing a transformation of the closed fractal curve and evidencing contraction in its symmetry axes. Figure 3(c) shows a fractal when , showing that the Julia set is close to the limit of the set or to separate the points. Figure 3(d) shows that when or exceeds the limit of the set , the Julia set presents several points that are not connected or explode in a point cloud.
![[Uncaptioned image]](/html/1812.11078/assets/Fig3.jpg)
| (a) | (b) | (c) | (d) |
Therefore, the Julia sets form a simple closed curve that transforms to a fractal form with the following relations: the upper and lower half-planes are reflections of each other, while the right and left half planes are reflections of each other. Besides, the points of the upper and lower half-planes are symmetrical with respect to the real axis of the complex plane, while the points of the right and left half planes are symmetrical with respect to the imaginary axis of the complex plane.
In conclusion, reflective symmetry is presented with respect to the origin point and it is confirmed that there exists a fractal geometric pattern as a function of . The relation found in this research is because the origin Mandelbrot set is symmetric with respect to the real axis of the complex plane. With respect to the fractal curve in the limits of the set, it reveals the approximation that has the magnitude of the real power with respect to the limit of the set of . If the real power exceeds the limit of on the x axis, the Julia set is not connected and presents several points as exploding.
3.2 Julia sets for the reactive power
Now, the fractal geometry obtained as a function of reactive power is studied. This case represents a motor or generator without load, which considers only reactive power for the magnetization of its coils, which is also evidenced by a low power factor. Thus, Figure 4 shows the transformation of the fractal geometry as a function of the change of the reactive power . Figure 4(a) shows the fractal geometry when and are equal to , which represents is a circle of radius equal to . Figure 4(b) shows the fractal geometry when , which is transformed into a closed fractal curve. Figure 4(c) shows the fractal geometry when , presenting the Julia set next to its separation because is above the limit of . Figure 4(d) shows the fractal geometry when , which exceeds the limit of the set of , and the points of the Julia sets are not connected, with separated zones.
![[Uncaptioned image]](/html/1812.11078/assets/Fig4.jpg)
| (a) | (b) | (c) | (d) |
In this case, there are different fractal patterns when the reactive power is studied, showing the inverse reflective symmetry with respect to the origin. In Figures 4(a), (b), and (c), the Julia set is a simple closed curve that becomes a fractal curve. However, unlike the relationships shown in 3(a), (b) and (c), in this case the half-planes keep inverted reflections of one another. The relationship between the quadrants is the following: the upper and lower half-planes are reflections inverted one from the other, while the right and left half planes are reflections inverted one from the other. The points of the upper and lower half planes are symmetrical inverted with respect to the real axis of the complex plane, while the points of the right and left half planes are symmetrical inverted with respect to the imaginary axis of the complex plane.
In conclusion, it is confirmed that there exists another fractal geometric pattern for the reactive power , which show the inverted reflective symmetry with respect to the origin point is presented. The fractal geometry in the limits reveals the approximation that the magnitude of the reactive power has with respect to the limit of the set of . If the reactive power exceeds the limit of on the y axis, the Julia sets becomes not connected, exploding in point cloud.
3.3 Julia sets of the real and reactive power values
Next, the fractal diagrams obtained from the changes of real and reactive powers are presented. Therefore, the following figures show fractals for the four quadrants. To perform the tests and show the results clearly, all values were considered with the values , .
3.3.1 Analysis on the first quadrant
Figure 5 shows the fractal diagrams related to the Mandelbrot and Julia sets when the real and reactive power is located in the first quadrant of the complex plane. Figure 5(a) shows the real and reactive powers with an inductive element. Figure 5(b) shows the Mandelbrot diagram created by the algorithm that iterates the complex number created by the real and reactive power . Besides, a point in yellow is marked in this figure to adjust the real and reactive power to the diagram. Figure 5(c) shows the Julia set that is created from the point selected from the Mandelbrot diagram and related to the real and reactive power studied. In general, when and are positive and located within the set , then the equivalent set is connected and its graph is a closed curve with inverted reflective symmetry with respect to the origin point, and with dendrites oriented in a clockwise direction.
![[Uncaptioned image]](/html/1812.11078/assets/Fig5.jpg)
| (a) first quadrant | (b) Mandelbrot diagram | (c) Julia diagram |
3.3.2 Analysis on the fourth quadrant
Figure 6 shows the fractal diagrams related to the Mandelbrot and Julia sets when the power is at the fourth quadrant of the complex plane. Figure 6(a) shows the real and reactive power with a capacitive element (). Figure 6(b) shows the Mandelbrot diagram created by the algorithm that iterates the complex number created by the real and reactive power. Besides, a point in yellow is marked in this figure to adjust the real and reactive power to the diagram. Figure 6(c) shows the Julia set that is created from the point selected from the Mandelbrot diagram and related to the real and reactive power studied.
![[Uncaptioned image]](/html/1812.11078/assets/Fig6.jpg)
| (a) fourth | (b) Mandelbrot diagram | (c) Julia diagram |
3.3.3 Analysis on the second quadrant
Figure 7 shows the fractal diagrams related to the Mandelbrot and Julia sets when the power is at the second quadrant of the complex plane. Figure 7(a) shows the real power supplied to the circuit with a capacitive reactive power . Figure 7(b) shows the Mandelbrot diagram created by the algorithm that iterates the complex number created from the power of the electric circuit. Besides, a point in yellow is marked in this figure to adjust the real and reactive power to the diagram. Figure 7(c) shows the Julia set that is created from the point selected from the Mandelbrot diagram and related to the real and reactive powers studied. When this values are in , the equivalent set is connected and the figure forms a closed fractal different to the other two cases, with apparent clockwise direction with respect to the real axis of the complex plane.
![[Uncaptioned image]](/html/1812.11078/assets/Fig7.jpg)
| (a) second quadrant | (b) Mandelbrot diagram | (c) Julia diagram |
3.3.4 Analysis on the third quadrant
Figure 8 shows a new fractal diagrams related to the Mandelbrot and Julia sets when the power is at the third quadrant of the complex plane. Figure 8(a) shows the real power supplied to the circuit with an inductive reactive power . Figure 8(b) shows the Mandelbrot diagram created by the algorithm that iterates the complex number created from the power of the electric circuit. Besides, a point in yellow is marked in this figure to adjust the real and reactive power to the diagram. Figure 8(c) shows the diagram created with the Julia set from the point selected in the Mandelbrot diagram and related to the real and reactive power studied. Figure 8 presents a fractal geometry of Julia set with inverted symmetry with respect to Figure 7. When the power is in the third quadrant and inside the main bulb of the set of , the equivalent set is connected and its graph is a closed curve, which appears in a clockwise rotation with respect to the real axis of the complex plane.
![[Uncaptioned image]](/html/1812.11078/assets/Fig8.jpg)
| (a) third quadrant | (b) Mandelbrot diagram | (c) Julia diagram |
Figures 7 and 8 showed that the forms have the same relation, but they are symmetrically inverted with respect to the origin. Again, a qualitative interpretation is that the capacitive and inductive electric power corresponds to two types of electrical phenomena contrary to each other. These two figures showed the behavior of the power with fractal diagrams: the first figure represented the reactive power related to capacitive elements as the current leads the voltage; and the second figure represented the reactive power related to inductive elements as the current lags the voltage.
4 Conclusions
This paper used the fractal Julia sets to observe the topological properties related to the signs and magnitudes of the real and reactive powers consumed or supplied by an electrical circuit. The method consisted in considering different power combinations to represent the fractal diagrams with an algorithm that iterates the mathematical expressions of the Julia sets. The study considered the change of real power when the reactive power is fixed, the change of the reactive power when the real power is fixed, and the change of both real and reactive powers. Furthermore, the fractal diagrams of the power in the four quadrants of the complex plane were studied to identify the topological properties that each sign and magnitude represent.
The study of the fractal diagrams helped to identify that the real and reactive powers represents clear fractal patterns with the Julia sets. When the reactive power is greater than zero and the real power changes, the Julia set presents an inverted symmetry with respect to the origin point. Besides, when the real and reactive powers are equal to zero, the fractal diagram is a circle with a radius of one in the complex plane. As a function of real power, two Julia sets are generated with different fractal patterns that characterize the signs and magnitudes. The characteristics of the Julia sets depend on the values of the initial point . Additionally, these are groups with a chaotic behavior, because their fractal curve cannot be predicted. When numerical analysis is repeated for different real and reactive powers, they produce different fractal curves that are symmetrically inverted with respect to the origin, as explained in this work.
5 Acknowledgement
This work was supported by the Agencia de Educación Superior de Medellín (Sapiencia), under the specific agreement celebrated with the Institución Universitaria Pascual Bravo. The project is part of the Energy System Doctorate Program and the Department of Electrical Energy and Automation of the Universidad Nacional de Colombia, Sede Medellín, Facultad de Minas.
6 References
[1] Barnsley, M. F., Devaney, R. L., Mandelbrot, B. B., Peitgen, H.-O., Saupe, D., and Voss, R. F., 1988, The Science of Fractal Images, Springer New York, New York, NY.
[2] Strogatz, S. H., 2018, Nonlinear Dynamics and Chaos, CRC Press.
[3] Losa, G. A., 2012, “Fractals and Their Contribution to Biology and Medicine,” Medicographia, 34, pp. 365–374.
[4] Garcia, T. A., Tamura Ozaki, G. A., Castoldi, R. C., Koike, T. E., Trindade Camargo, R. C., and Silva Camargo Filho, J. C., 2018, “Fractal Dimension in the Evaluation of Different Treatments of Muscular Injury in Rats,” Tissue Cell, 54, pp. 120–126.
[5] Rodríguez V, J. O., Prieto B, S. E., Correa H, S. C., Soracipa M, M. Y., Mendez P, L. R., Bernal C, H. J., Hoyos O, N. C., Valero, L. P., Velasco R, A., and Bermudez, E., 2016, “Nueva Metodología de Evaluación Del Holter Basada En Los Sistemas Dinámicos y La Geometría Fractal: Confirmación de Su Aplicabilidad a Nivel Clínico,” Rev. la Univ. Ind. Santander. Salud, 48(1), pp. 27–36.
[6] Popovic, N., Radunovic, M., Badnjar, J., and Popovic, T., 2018, “Fractal Dimension and Lacunarity Analysis of Retinal Microvascular Morphology in Hypertension and Diabetes,” Microvasc. Res., 118, pp. 36–43.
[7] Hernández Velázquez, J. de D., Mejía-Rosales, S., and Gama Goicochea, A., 2018, “Fractal Properties of Biophysical Models of Pericellular Brushes Can Be Used to Differentiate between Cancerous and Normal Cervical Epithelial Cells,” Colloids Surfaces B Biointerfaces, 170, pp. 572–577.
[8] Moon, P., Muday, J., Raynor, S., Schirillo, J., Boydston, C., Fairbanks, M. S., and Taylor, R. P., 2014, “Fractal Images Induce Fractal Pupil Dilations and Constrictions,” Int. J. Psychophysiol., 93(3), pp. 316–321.
[9] Mandelbrot, B. B., and Hudson, R. L., 2004, The (Mis) Behaviour of Markets: A Fractal View of Risk, Ruin and Reward, Profile Books, London.
[10] Kumar, R., and Chaubey, P. N., 2012, “On the Design of Tree-Type Ultra Wideband Fractal Antenna for DS-CDMA System,” J. Microwaves, Optoelectron. Electromagn. Appl., 11(1), pp. 107–121.
[11] Ma, Y.-J., and Zhai, M.-Y., 2018, “Fractal and Multi-Fractal Features of the Broadband Power Line Communication Signals,” Comput. Electr. Eng.
[12] Ye, D., Dai, M., Sun, Y., and Su, W., 2017, “Average Weighted Receiving Time on the Non-Homogeneous Double-Weighted Fractal Networks,” Phys. A Stat. Mech. its Appl., 473, pp. 390–402.
[13] Cui, H., and Yang, L., 2009, “Short-Term Electricity Price Forecast Based on Improved Fractal Theory,” 2009 International Conference on Computer Engineering and Technology, IEEE, pp. 347–351.
[14] Zhao, Z., Zhu, J., and Xia, B., 2016, “Multi-Fractal Fluctuation Features of Thermal Power Coal Price in China,” Energy, 117, pp. 10–18.
[15] Salvó, G., and Piacquadio, M. N., 2017, “Multifractal Analysis of Electricity Demand as a Tool for Spatial Forecasting,” Energy Sustain. Dev., 38, pp. 67–76.
[16] Zhai, M.-Y., 2015, “A New Method for Short-Term Load Forecasting Based on Fractal Interpretation and Wavelet Analysis,” Int. J. Electr. Power Energy Syst., 69, pp. 241–245.
7 Bibliography of authors
 |
 |
| First Author’s | Second author’s |
Firts Author’s: Héctor A. Tabares-Ospina: received his Bs. degree in
Electrical Engineering in 1997 and his Master in Systems Engineering in 2005
from Universidad Nacional de Colombia. He is now studing doctoral studies.
He is an Assistant Professor of Institución Universitaria Pascual Bravo.
His research interests include: Fractal geometry, artificial intelligence,
operation and control of power systems; and smart grids. He is a Junior
Researcher in Colciencias and member of the Research Group - GIIEN, at
Institución Universitaria Pascual Bravo.
https://orcid.org/0000-0003-2841-6262
Second Author’s:John E. Candelo-Becerra: received his Bs. degree in Electrical Engineering in 2002 and his PhD in Engineering with emphasis in Electrical Engineering in 2009 from Universidad del Valle, Cali - Colombia. His employment experiences include the Empresa de Energía del Pacífico EPSA, Universidad del Norte, and Universidad Nacional de Colombia - Sede Medellín. He is now an Assistant Professor of the Universidad Nacional de Colombia - Sede Medellín, Colombia. His research interests include: engineering education; planning, operation and control of power systems; artificial intelligence; and smart grids. He is a Senior Researcher in Colciencias and member of the Applied Technologies Research Group - GITA, at the Universidad Nacional de Colombia. https://orcid.org/0000-0002-9784-9494.