Three new Galactic star clusters discovered in the field of the open cluster NGC 5999 with Gaia DR2
Abstract
We report the serendipitous discovery of three new open clusters, named UFMG 1, UFMG 2 and UFMG 3 in the field of the intermediate-age cluster NGC 5999, by using Gaia DR2 data. A colour-magnitude filter tailored for a proper selection of main-sequence stars and red clump giants turned evident the presence of NGC 5999 and these three new stellar groups in proper motion space. Their structural parameters were derived from King-profile fittings over their projected stellar distributions and isochrone fits were performed on the clusters cleaned colour-magnitude diagrams built with Gaia bands to derive their astrophysical parameters. The clusters projected sky motion were calculated for each target using our members selection. Distances to the clusters were inferred from stellar parallaxes through a bayesian model, showing that they are marginally consistent with their isochronal distances, considering the random and systematic uncertainties involved. The new clusters are located in the nearby Sagittarius arm ( kpc) with NGC 5999 at the background ( kpc). They contain at least a few hundred stars of nearly solar metallicity and have ages between 100 and 1400 Myr.
keywords:
Galaxy: stellar content – open clusters and associations: general – surveys: Gaia1 Introduction
The spatial density fluctuations of low Galactic latitude stellar populations make difficult the identification and characterization of open clusters for studies of the history and structure of the Galactic disk. The recent Gaia DR2 (Gaia Collaboration et al., 2016, 2018a; Evans et al., 2018) provides precise astrometric and photometric data for an unprecedented number of stars, allowing us to better investigate and/or find many of these objects, normally suppressed by both high density stellar fields and extinction.
Nowadays there are more than 2500 known open clusters (Dias et al., 2002; Kharchenko et al., 2013). With the advent of near-infrared surveys such as 2MASS (Skrutskie et al., 2006) and VVV (Minniti et al., 2010), new objects have been discovered, notably young clusters embedded in molecular clouds that were invisible in the optical due to high absorption (e.g. Barbá et al., 2015; Borissova et al., 2014; Bica et al., 2003). In the optical, the Gaia mission has acquired whole sky high precision proper motions and paralaxes which are suited to an accurate distinction between cluster and field stars due to the expected confined loci of cluster stars in the astrometric space. This has led to an increase of the number of open clusters discovered recently (Ryu & Lee, 2018; Cantat-Gaudin et al., 2018; Castro-Ginard et al., 2018; Torrealba et al., 2018).
We have been carrying out a study of open clusters in dense stellar fields using VVV, 2MASS and more recently Gaia to fully characterize such objects. One of these objects is NGC 5999, located in the direction of the Galactic disk, with Galactic coordinates and (Dias et al., 2002). NGC 5999 is approximately 400 Myr old, with distance determinations ranging from 1.6 to 2.5 kpc and reddening (Dias et al., 2002; Piatti et al., 1999; Kharchenko et al., 2013; Netopil et al., 2007; Santos & Bica, 1993; Moni Bidin et al., 2014). The Milky Way Star Clusters project (MWSC; Kharchenko et al., 2013), which is based on 2MASS photometry and PPMXL (Roeser et al., 2010) astrometry, gives for NGC 5999: (with 2 stars used to calculate the age), pc, , core radius pc, and tidal radius pc. Piatti et al. (1999) employed observations aided by integrated spectroscopy from Santos & Bica (1993) to derive for NGC 5999 the following parameters: Myr, kpc, and . Moni Bidin et al. (2014) investigated a possible connection between NGC 5999 and the planetary nebulae VBe 3, located at 5 arcmin from the cluster centre. To do this, they observed spectroscopically 4 members of the cluster and the planetary nebulae, caming to the conclusion that there is no association between them as indicated by their large radial velocity difference. An average of kms-1 for the cluster radial velocity was derived from the velocities of the 4 member stars. Netopil et al. (2007) searched for chemically peculiar stars in NGC 5999 employing observations in the photometric system, specifically designed to detect such objects. They obtained , and kpc by fitting isochrones to a colour-magnitude diagram (CMD) in that photometric system. In this paper we propose to improve NGC 5999 parameters taking advantage of the Gaia DR2 data precision, both astrometric and photometric, leading to the possibility of a clear distinction of members and field stars.
A method often employed to detect a star cluster is the search for spatial stellar overdensities with respect to the background (e.g. Froebrich et al., 2007; Kronberger et al., 2006). However, crowded fields make difficult the analysis and overdensities are not always perceptible. The Gaia DR2 allowed automatic overdensity searches based on 5-parameters, efficiently exploring the mission capabilities (Cantat-Gaudin et al., 2018; Castro-Ginard et al., 2018; Gaia Collaboration et al., 2018b). Although operating on the full Gaia DR2 database needs data mining techniques, serendipitous discoveries based on local strategies to enhance the contrast between field and a hidden cluster are not improbable as the ones reported in this study.
This paper is structured as follows. In Sect. 2 the data is presented. In Sect. 3 the method used in the detection of the new clusters is described. In Sect. 4 the analysis procedures are developed, including membership assessment, determination of astrophysical and structural parameters, and distance inference via a bayesian method. The sky region investigated is discussed in the context of the newly found clusters in Sect. 5 and the concluding remarks are given in Sect. 6.
2 Data
The Gaia DR2 catalogue provides positions, proper motions in right ascension and declination, parallaxes and magnitudes in three bands (, and ) for more than 1.3 billion sources (Gaia Collaboration et al., 2018a; Evans et al., 2018). Parallax uncertainty goes from 0.04 mas for sources at mag, to about 0.1 mas at mag and up to 0.7 mas at mag. The corresponding uncertainty in the respective proper motion components goes from 0.06 mas yr-1 (for mag) to about 0.20 mas yr-1 (for mag) and up to 1.2 mas yr-1 (for mag). Both parallax and proper motion are also affected by systematic errors, on the order of 0.1 mas and 0.1 mas yr-1, respectively (Lindegren et al., 2018; Luri et al., 2018).
We have extracted Gaia DR2 data using the Vizier service. In order to clean our work sample from contamination due to double stars, astrometric effects from binary stars and calibration problems, we used equations (1), (2) and (3) from Arenou et al. (2018). This is a recommended basic filter aimed to assure the best quality of the data for analysis, after which around 20% of the total sample was kept.
3 Discovery of the new clusters
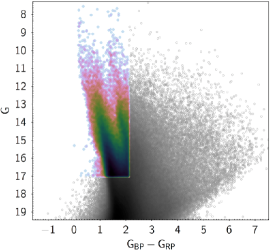
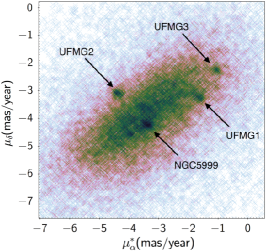
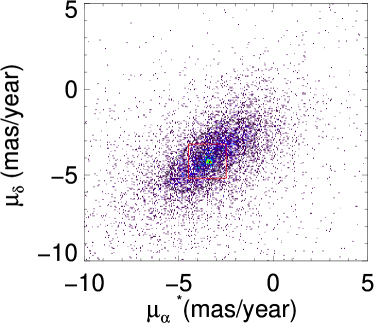
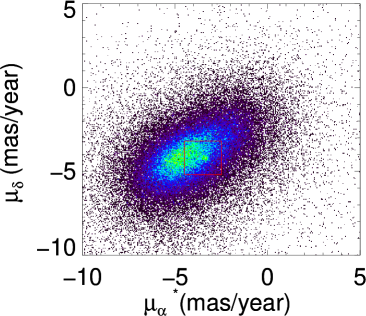
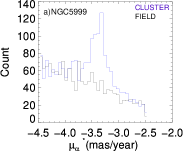
Analyzing the region adjacent to NGC 5999, we have noticed the existence of other clusters not yet reported in the literature as to our best knowledge. To arrive at this conclusion, we took the following steps. After the basic filter was applied, we selected data from a region of 1.3 degrees radius centred in NGC 5999. Since the cluster is immersed in a dense star field, it was impossible to contrast it over the background. In order to highlight the cluster members in the proper motion diagram (VPD), we performed cuts in colour and magnitude (left panel of Fig. 1), limiting our sample to magnitude and colour (), thus excluding faint and highly reddened stars. This subsample clearly revealed NGC 5999 and three unexpected overdensities in the VPD (middle panel of Fig. 1).
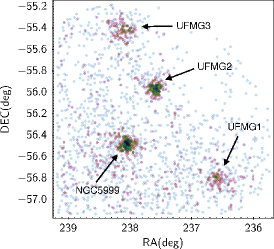
Exploration of the spatial region associated with each of these clumps in the VPD, showed that their stars, besides having similar movements, also own a spatial bond. Specifically, VPD boxes of 2 mas yr-1 were defined to contain each of the four comoving structures as a constraint to look for members in right ascension and declination. The boxes size was big enough to completely select the proper motion clumps and small enough to mitigate the field background, therefore optimizing the process of obtaining the clusters’ centres and sizes. From the stellar positions in this subsample, a preliminary centre was determined, which was then used to analyse the stellar distribution around 30 arcmin from each clump centre. We advance that the stellar distribution in the colour-magnitude diagram (see Sect. 4.3.1) also made evident that the overdensities are indeed star clusters. The spatial distribution of NGC 5999 stars and those of the three discovered clusters, named UFMG 1, UFMG 2 and UFMG 3, is shown in the right panel of Fig. 1. The abbreviation UFMG accounts for Universidade Federal de Minas Gerais.
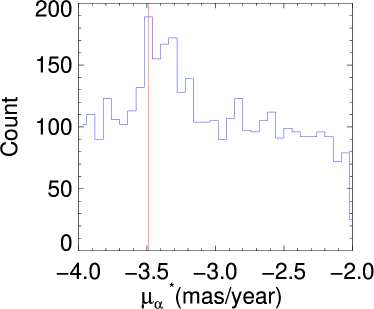
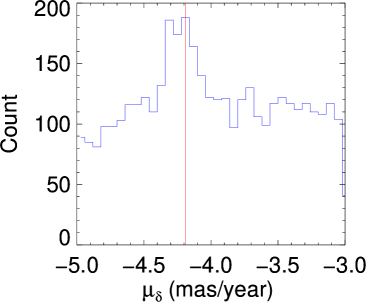
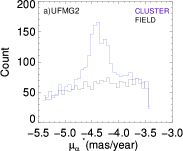
We emphasize that the constraints defined by the colour and magnitude cuts in the sample were only performed to enhance the overdensities in the VPD, as exemplified in Fig. 2, allowing us to locate them and compute the mode of the proper motion components distribution by making histograms in and for the data in the 2 mas yr-1 box defined for each clump (Fig. 3). Thereafter the colour-magnitude filter was dismissed and the sample only subjected to the basic filter was employed in the subsequent analysis.
4 Analysis
4.1 Centre and size determination
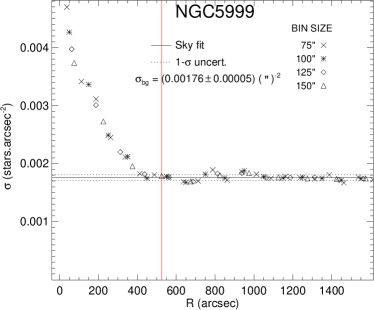
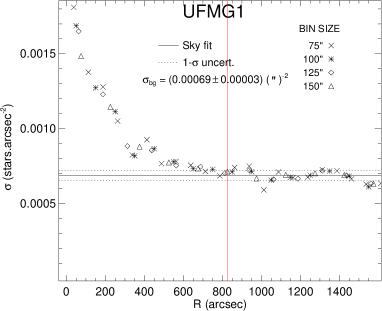
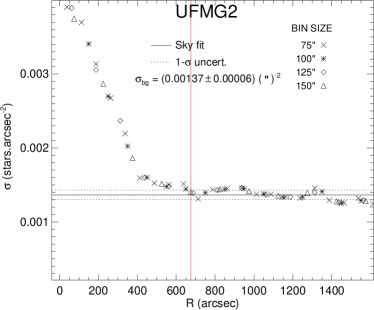
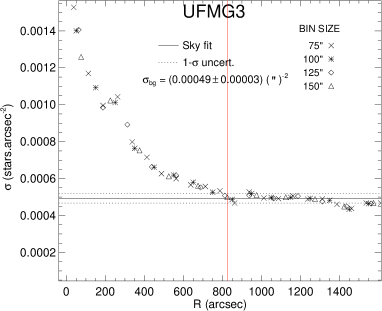
Having defined our working sample, i.e., best quality Gaia data within the 2 mas yr-1 proper motion box and 30 arcmin from the objects centres, we built radial density profiles (RDP) to determine the size of the objects, the local background and fine tune their centres. The stellar density was calculated by measuring the number of stars in concentric rings around the initial visual centre and dividing it by the rings area. Independent RDPs were obtained by using four different ring widths and the results merged in a single profile.
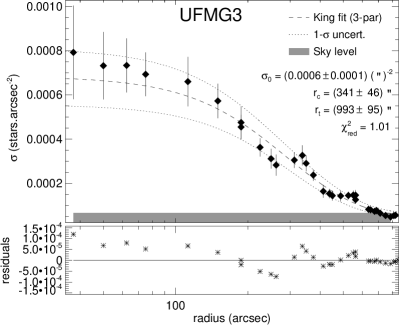
We refined the visual center by making small adjustments to its coordinates, searching for the maximum central density of the profile. The sky background level () and its uncertainty was determined by fitting a straight line to the stellar density for rings well beyond the objects core, between 15 and 25 arcmin. The limiting radius (), defined as the radius where the stellar density reaches the sky level, resulted between 7 and 15 arcmin for all clusters. Fig. 4 shows the radial density profiles of each cluster and the derived sky density level used to determine the limiting radius, as given in Table 1.
| NGC 5999 | UFMG 1 | UFMG 2 | UFMG 3 | |
|---|---|---|---|---|
| (J2000) | 15 52 11.3 | 15 46 24.5 | 15 50 23.3 | 15 52 26.2 |
| (J2000) | -56 29 17 | -56 48 29 | -55 57 32 | -55 25 19 |
| (∘) | 326.00 | 325.19 | 326.14 | 326.70 |
| (∘) | -1.94 | -1.70 | -1.37 | -1.13 |
| () | -3.374(3)a | -1.634(4)a | -4.420(3)a | -1.040(4)a |
| () | -4.216(3)a | -3.220(4)a | -3.068(3)a | -2.238(4)a |
| (pc) | 4.60.6 | 6.30.7 | 4.80.6 | 6.00.7 |
| (pc) | 1.50.2 | 1.90.2 | 1.60.2 | 2.50.4 |
| (pc) | 6.00.7 | 10.41.5 | 6.40.7 | 7.31.0 |
| 8.500.10 | 8.900.05 | 9.150.05 | 8.00.1 | |
| 11.30.2 | 11.00.2 | 10.850.2 | 10.90.2 | |
| 0.60 | 0.74 | 0.60 | 0.46 | |
| -0.20.2 | 0.2 | 0.00.2 | 0.00.2 | |
| d (kpc) | 1.820.19 | 1.580.16 | 1.480.15 | 1.510.14 |
| 0.640.04 | 0.750.03 | 1.060.04 | 0.990.02 | |
| 405 | 191 | 592 | 261 |
a uncertainties on and are given within parenthesis in as yr-1; and are also affected by systematic uncertainties of 0.1 mas yr-1
4.2 Assessing membership
4.2.1 Proper motion selection
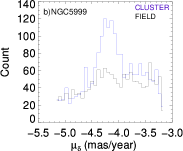
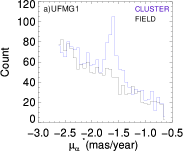
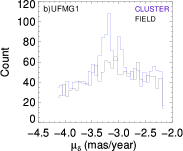
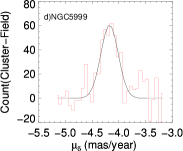
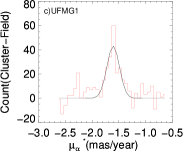
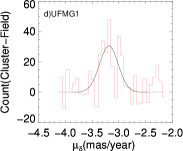
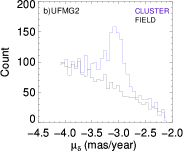
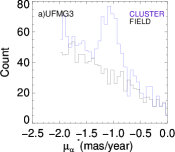
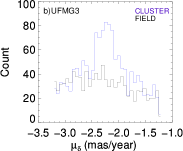
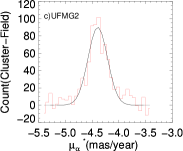
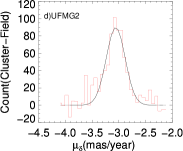
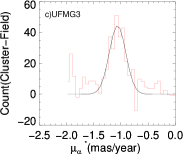
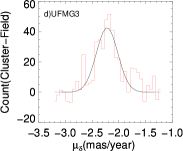
Histograms of the proper motion components and were built for stars inside the limiting radii of each cluster and for an adjacent annular field with the same respective area. The proper motion distributions in the clusters’ regions were then subtracted from the field contribution to determine a clean sample.
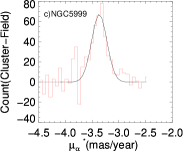
The most probable values of the proper motion distribution centres were obtained from Gaussian fittings on the resulting histograms (Fig. 5). In this procedure, proper motion outliers were removed from the sample, i.e., those stars with proper motion components outside 2- of the mean values obtained in the Gaussian fittings. The mean proper motion components and the 1- deviation found for each cluster are given in Table 1.
4.2.2 Colour-magnitude diagram decontamination
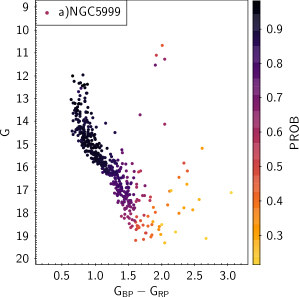
After the proper motion selection of members, CMDs were built for each cluster and the CMD cleaning tool devised by Maia et al. (2010) was applied to statistically evaluate and remove the field population from the clusters CMDs. The method has been recently updated in Angelo et al. (2018) to employ control fields of arbitrary shapes, assigning photometric membership probabilities to cluster stars based on the local overdensity in the cluster’s CMD relative to the field CMD and on their distance to the cluster centre, according to the relation:
| (1) |
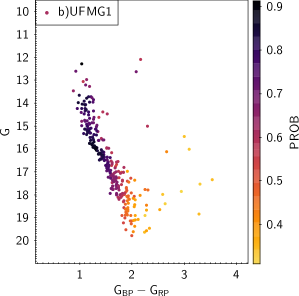
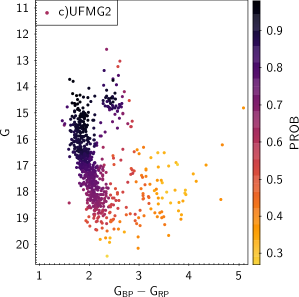
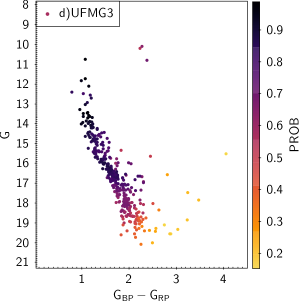
where and are the local density in the cluster and field CMDs, respectively, and measures a star distance to the cluster centre. The membership probabilities associated to the stars in each cluster CMD are shown in Fig. 6. The definitive member list was defined by selecting stars with photometric membership greater than 60%. The resulting number of selected member stars () is shown in Table 1 for each cluster.
4.3 Astrophysical and structural parameters
In the sequence, we performed isochrone fittings on the proper motion filtered (4.2.1) and decontaminated CMD (4.2.2) samples to determine the clusters’ astrophysical parameters. Structural parameters were obtained by King (1962) model fittings to the proper motion filtered samples. Since the CMD cleaning tool operates on the star distances from the clusters’ centre (Eq. 1), we refrained to use the photometrically cleaned sample so as to not bias the model fittings. So, we only used the proper motion selected samples to get structural parameters.
Given the reported offsets between distances as obtained from parallaxes and CMD distance moduli (e.g Cantat-Gaudin et al., 2018) and the rather different methodology employed in each case, we have opted to keep the photometric analysis completely independent from the parallaxes. We will address the parallax inversion problem in Sect. 4.4, making full use of the distance moduli derived with the photometry. In addition, since we have not applied any parallax constraint to our data, it can be used as a posteriori check to see how clustered the cleaned samples are in parallax space.
4.3.1 Isochrone fittings
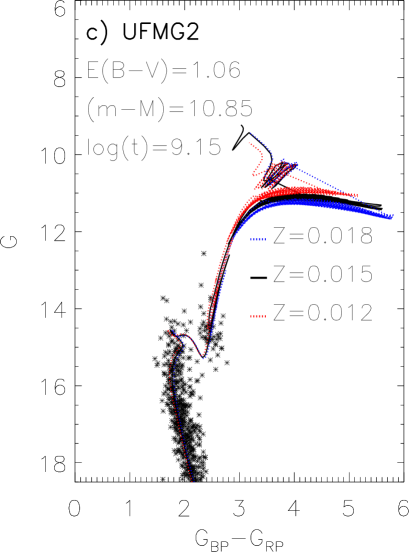
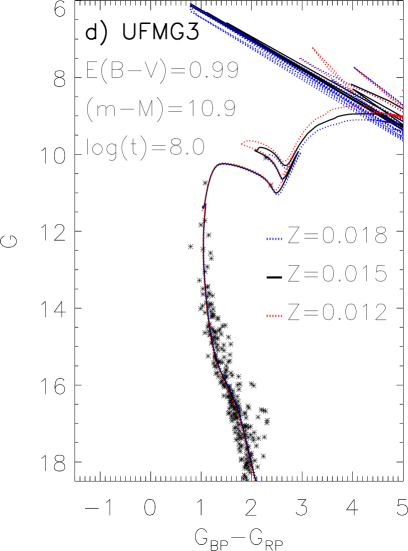
A set of PARSEC-COLIBRI isochrones (Marigo et al., 2017) was employed to perform fittings on the decontaminated samples to determine age, metallicity, distance and reddening. A reddening law (Cardelli et al., 1989; O’Donnell, 1994) was used to convert to . We did not use the extinction values, as quoted in the Gaia catalogue, because they are only satisfactory when applied, in a statistical sense, to large samples (Andrae et al., 2018) and therefore are not useful to correct the photometry of smaller groups. Instead, we derived extinction towards the clusters from the isochrone fitting.
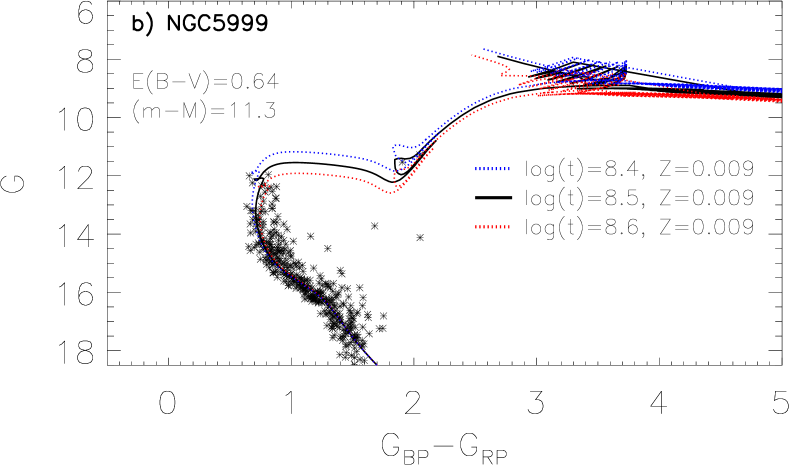
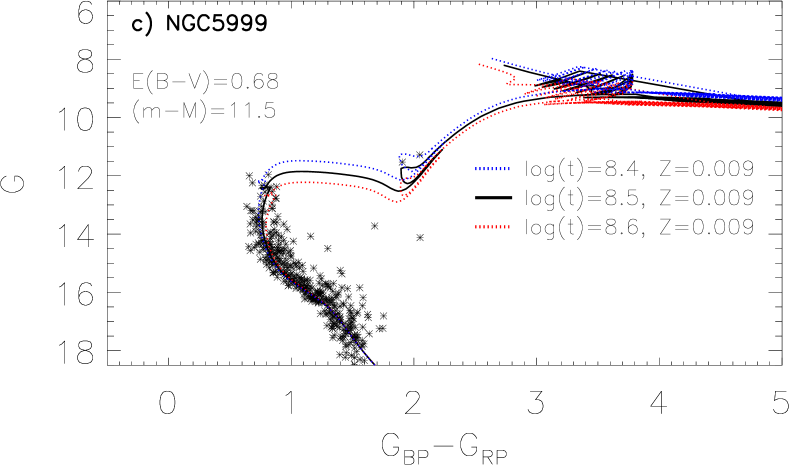
We have found the best-fitting isochrone by carefully inspecting the matching of key evolutionary regions such as the lower main sequence, the turnoff, and the giant clump across several isochrones covering a range of ages and metallicities. Then, to evaluate the uncertainty in the parameters, since reddening and distance modulus produce only a shift of the isochrone, we changed them simultaneously to get a maximum deviation from the central solution that still encompass the data towards both bluer/brighter and redder/dimmer extremes.
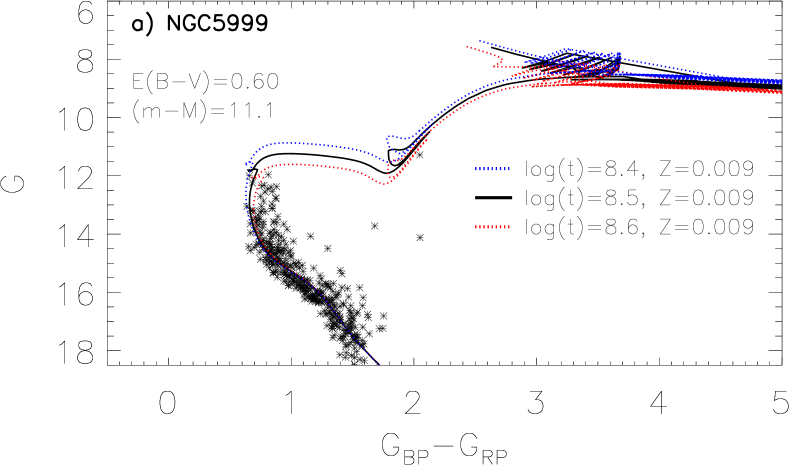
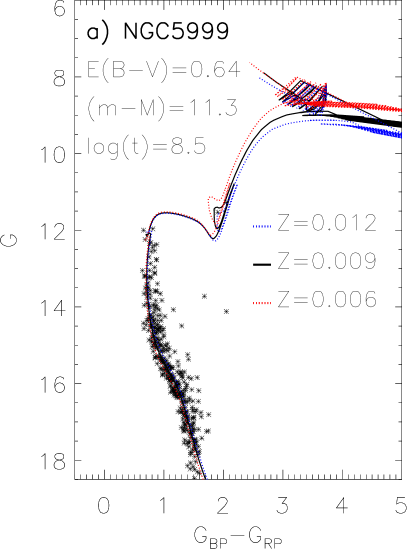
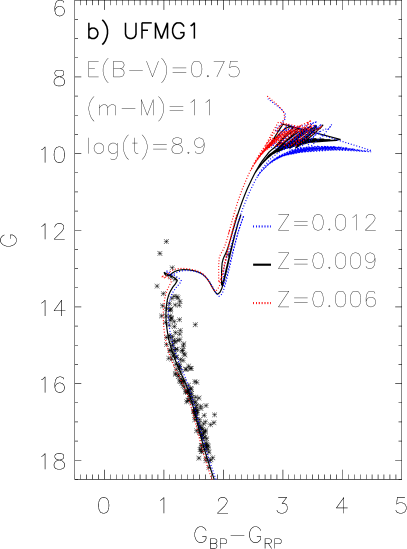
As an example, Fig. 7 presents this procedure for NGC 5999, where three isochrones of different ages and same metallicity are overplotted on the cluster CMD. Note how the giant clump provides a strong constraint to the match. The same procedure was applied to the other clusters. The continuous line in the central panel of Fig. 7 gives the best isochrone match, which was then refined by exploring adjacent metallicities from the central value. Fig. 8 shows the final match (continuous black line) for all clusters, making evident the influence of metallicity on the evolved stellar population.
In summary, the best-fitting isochrones along with conservative estimates that encompass reasonable matches to the stars loci, provided the uncertainties in the parameters. All parameters derived from the isochrone matches are presented in Table 1.
4.3.2 King model fittings
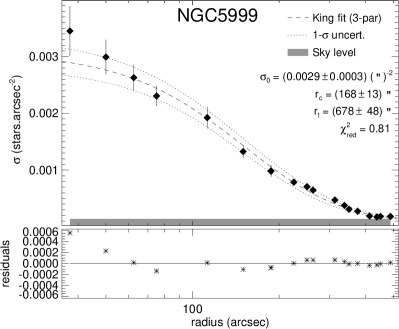
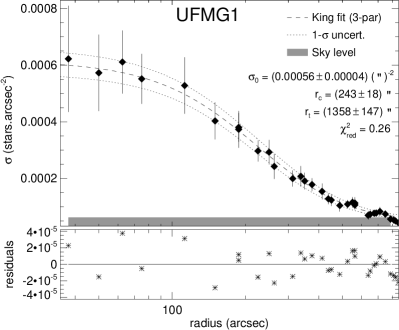
The structural parameters central density (), core () and tidal () radii were obtained by fitting King (1962) models to the RDP of each cluster member stars. Four sets of radial bins were used to represent the radial density profile of the clusters. Fig. 9 shows the best King models (dashed lines) fitted to each cluster radial density profile and the respective 1- uncertainties (dotted lines). Error bars correspond to Poisson uncertainties. Table 1 presents the obtained parameters.

4.4 Distance inference
Distances for the individual stars in each cluster were calculated using Markov Chain Monte-Carlo (MCMC) simulations in a bayesian framework, according to the prescription by Bailer-Jones (2015, hereafter BJ15). The exponentially decreasing space density (EDSD) prior defined in BJ15 was employed using the typically adopted scale length of 1.35 kpc (e.g. see Astraatmadja & Bailer-Jones, 2016).
The distance for each star was calculated as the mode of its posterior distribution (also called maximum a posteriori - MaP) and the corresponding uncertainty using the 68.27% ( 1-sigma) confidence interval () around this value. The resulting distance (MaP) distribution of our targets is compared with the parallaxes () distribution in Fig. 10. It can be seen that the MaP distribution does not deviate severely from the distances obtained by simply inverting the parallaxes (), but it does show significant differences.
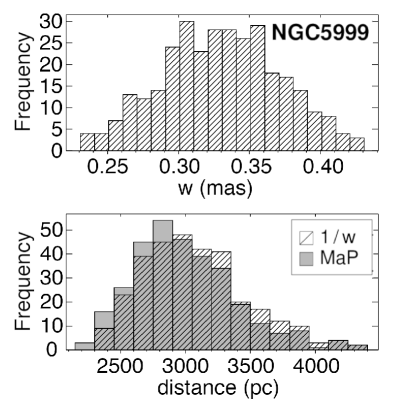
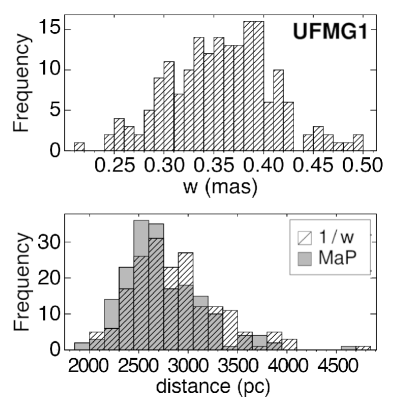
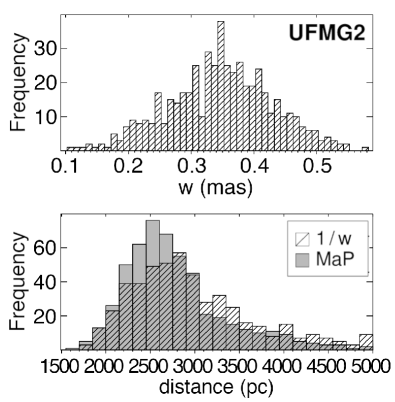
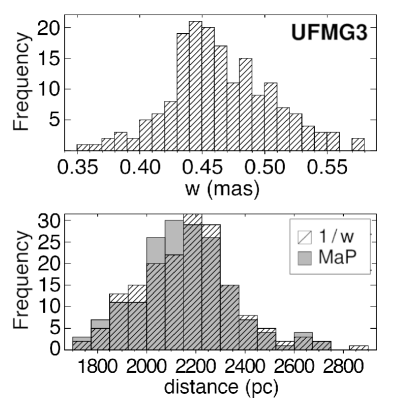
Concerning parallaxes, we have added in quadrature the random errors resulting from the bayesian model (1-sigma of the stellar parallax distribution shown in Fig. 10) to the systematic uncertainty of 0.1 mas affecting the astrometric solution in Gaia DR2. Furthermore, the clusters’ parallaxes were obtained by adding 0.03 mas to those derived from the bayesian model, corresponding to the zero-point offset of Gaia DR2 parallaxes (Luri et al., 2018). The final distances and uncertainties are then determined by inverting the parallaxes and by propagating their errors as calculated above. Table 2 presents these results compared to those obtained from the isochrone fittings.
Although the errors are large, it can be seen that distances from both methods appears to agree on the limit of their uncertainties for NGC 5999 and UFMG 3 and nearly so for UFMG 1 and UFMG 2. This behaviour was also found in previous works (e.g. Cantat-Gaudin et al., 2018), where isochronal distances agreed with parallaxes ones for some clusters and did not for others. Several factors could contribute to this difference such as the calibration of GAIA photometry, issues with the model isochrones and/or their fitting process and/or systematics in the astrometric solution of GAIA DR2.
| mcmc | (m-M) | ||
|---|---|---|---|
| [mas] | [kpc] | [kpc] | |
| NGC 5999 | |||
| UFMG 1 | |||
| UFMG 2 | |||
| UFMG 3 |
Recently, Bailer-Jones et al. (2018) used a smooth Galaxy model to improve the EDSD prior by calculating a length scale as a function of the Galactic longitude and latitude of each source in Gaia DR2, thus determining distances for the entire catalogue. When compared to the distances reported by their work, our results show very similar distances distributions for our targets, with nearly identical mode values. This is a expected result given that the EDSD is a weak prior and that the length scale reported by their galactic model towards the studied clusters ( pc) is close to the length scale adopted.
5 Clusters in the sky region
Fig. 11 shows the field panoramic in Galactic coordinates built from a DSS2 colour image covering 2.5 2.5 degrees. The cluster sizes are indicated by circles and their proper motion in Myr represented by lines.
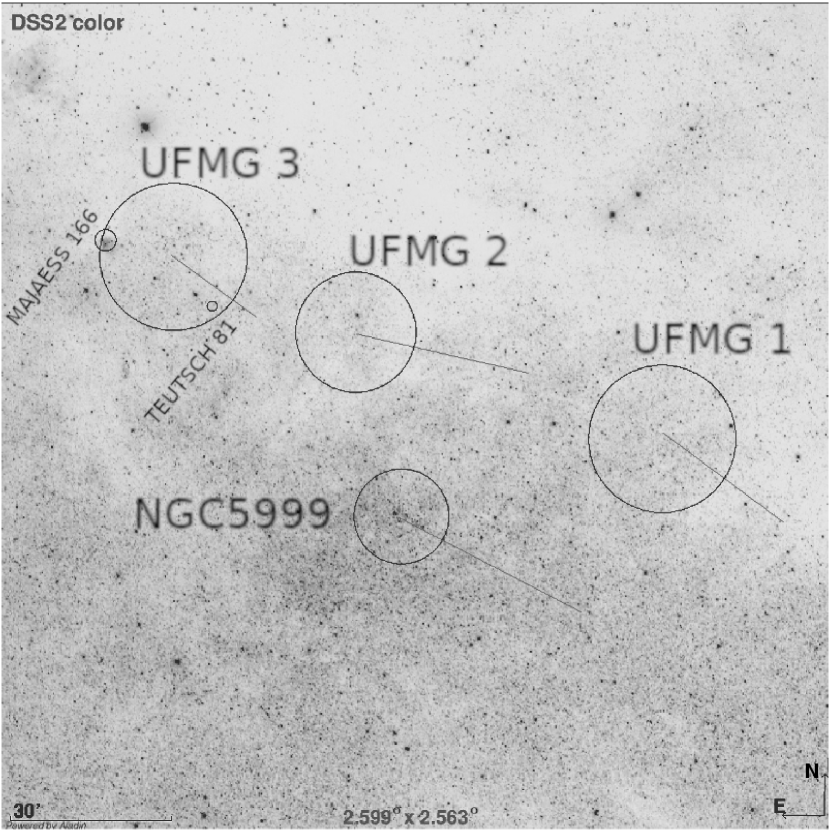
One of the clusters (UFMG 3) is located near two other known clusters: Majaess 166 (Majaess, 2013) and Teutsch 81 (Kronberger et al., 2006), which appears to be different objects located 13 arcmin from UFMG 3 central coordinates. Teutsch 81 was catalogued as a suspected open cluster candidate on the basis of visual inspection of DSS and 2MASS images. Given the small diameter reported by Kronberger et al. (2006), i.e., 1.8 arcmin, which is much smaller than that found for UFMG 3 (see Sect. 4.1), we dismiss as a coincidence in this case. Majaess 166 was identified as a very young cluster with a size of 4 arcmin (Majaess, 2013) and it is easily distinguished from UFMG 3 in DSS images for its nebulous nature, the cluster being still embedded in the progenitor gas cloud.
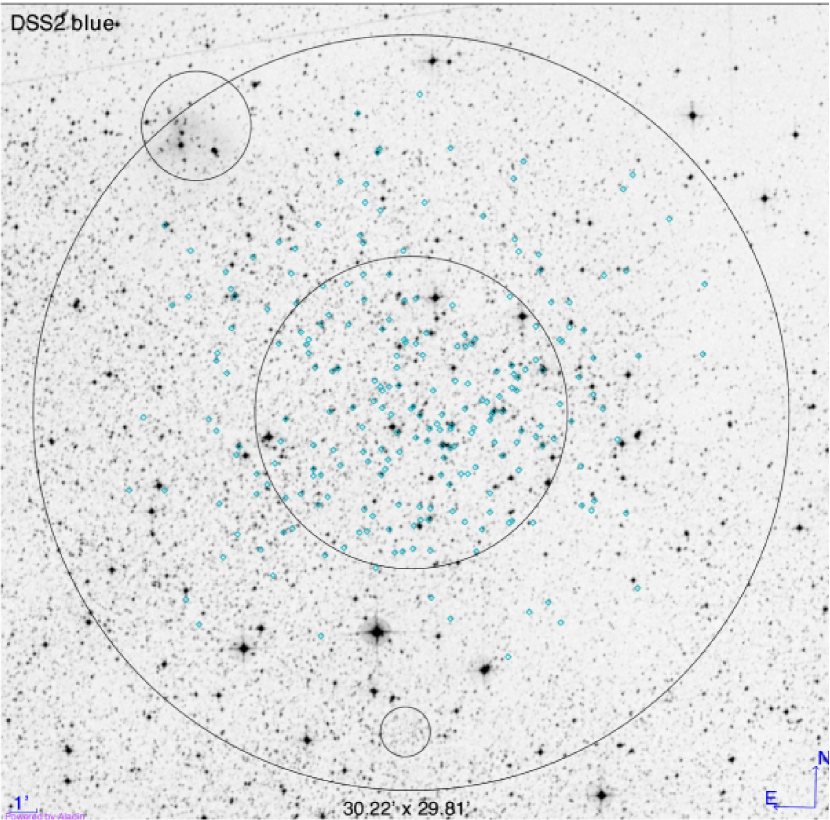
Since there is some superposition of the area covered by the three clusters, we further searched for additional evidences that would clarify their natures as distinct stellar systems. Fig. 12 shows a zoomed DSS2 image of the three clusters area with circles indicating their limiting radii and, in the case of UFMG 3, also its core radius. The UFMG 3 members are also shown, confirming that most of them lie within its core radius, particularly the relatively bright stars belonging to the red clump and turnoff stars. Given the size differences and the disposition of the stellar content of UFMG 3, it is clear that these are distinct objects. The proper motion of Majaess 166 based on UCAC4 data, and (Dias et al., 2014), is the only additional information for this cluster and it differs from the proper motion of UFMG 3 (Table 1).
Being probably distant clusters projected in the direction of UFMG 3, Teutsch 81 and Majaess 166 could be better investigated using near-infrared bands, possibly allowing their stellar content to be distinguished from field stars.
6 Concluding remarks
We report the serendipitous discovery of three star clusters projected towards the Norma constellation around the open cluster NGC 5999, in the Sagittarius spiral arm. The discovery was possible due to filtering procedures on Gaia DR2 data. A colour-magnitude filter applied to select young to intermediate-age main-sequence stars and red clump giants turned evident the presence of NGC 5999 and the three new stellar groups in proper motion space. We then determined their centres and limiting radii by analysing their projected stellar distributions. Gaia photometry and proper motions were employed to characterize the new clusters at tandem with isochrone fitting of their stellar populations, from which a consistent set of astrophysical parameters was obtained.
All clusters have well-defined main sequences and contain at least two giants, facilitating the isochrone fitting procedure. The oldest cluster (UFMG 2) has a developed red giant clump and presents a broader main sequence, possibly indicating differential reddening and/or stellar populations with slow rotators (bluer stars) and fast rotators (redder stars), as exhibited by the open cluster M 11 (Marino et al., 2018).
King-profile fittings over the clusters RDP have shown that our targets present tidal boundaries between 5-10 pc, typical of relaxed open clusters. Their concentration parameter () corroborate our derived ages, indicating a more dense core () for evolved targets NGC 5999, UFMG 1 and UFMG 2, possible as result of internal stellar collisions and energy equipartition during their long term evolution and a sparser central structure () for the much younger UFMG 3.
When compared to previous studies of NGC 5999 (Santos & Bica, 1993; Piatti et al., 1999; Dias et al., 2002; Roeser et al., 2010; Kharchenko et al., 2013; Moni Bidin et al., 2014) we have found consistent values of colour excess, age, distance and tidal radius. In addition, owing to the high quality of the photometric and astrometric data from Gaia DR2 we were able to achieve a considerably smaller uncertainty (at least 50%) for its distance estimate. For UFMG 1, UFMG 2 and UFMG 3 we are providing the structural and astrophysical parameters for the first time.
By employing the bayesian inference method described in BJ15 to estimate individual stellar distances of the studied clusters members and by properly applying the systematic corrections to GAIA DR2 data, we have found that their probable distances are marginally consistent with those found by isochrone fitting. Although the distances inferred from the parallax are systematically higher, their relatively large uncertainties puts them within the 1-sigma range of the isochronal distances. This systematic difference cannot be attributed to the adopted methodology as it is also present in the distances calculated by Bailer-Jones et al. (2018) for our targets. While this effect has been seen before (e.g. Cantat-Gaudin et al., 2018), we are not sure of its exact origin. It could be attributed to uncertainties linked to the model isochrones, the photometry and/or the astrometric solution of Gaia DR2.
Acknowledgements
The authors wish to thank the Brazilian financial agencies FAPEMIG, CNPq and CAPES (finance code 001). F. Maia acknowledge FAPESP funding through the fellowship no 2018/05535-3. This research has made use of the VizieR catalogue access tool, CDS, Strasbourg, France. This work has made use of data from the European Space Agency (ESA) mission Gaia (https://www.cosmos.esa.int/gaia), processed by the Gaia Data Processing and Analysis Consortium (DPAC, https://www.cosmos.esa.int/web/gaia/dpac/consortium). Funding for the DPAC has been provided by national institutions, in particular the institutions participating in the Gaia Multilateral Agreement. This research has made use of TOPCAT (Taylor, 2005).
References
- Andrae et al. (2018) Andrae R., et al., 2018, A&A, 616, A8
- Angelo et al. (2018) Angelo M. S., Piatti A. E., Dias W. S., Maia F. F. S., 2018, MNRAS, 477, 3600
- Arenou et al. (2018) Arenou F., et al., 2018, A&A, 616, A17
- Astraatmadja & Bailer-Jones (2016) Astraatmadja T. L., Bailer-Jones C. A. L., 2016, ApJ, 832, 137
- Bailer-Jones (2015) Bailer-Jones C. A. L., 2015, PASP, 127, 994
- Bailer-Jones et al. (2018) Bailer-Jones C. A. L., Rybizki J., Fouesneau M., Mantelet G., Andrae R., 2018, AJ, 156, 58
- Barbá et al. (2015) Barbá R. H., et al., 2015, A&A, 581, A120
- Bica et al. (2003) Bica E., Dutra C. M., Soares J., Barbuy B., 2003, A&A, 404, 223
- Borissova et al. (2014) Borissova J., et al., 2014, A&A, 569, A24
- Cantat-Gaudin et al. (2018) Cantat-Gaudin T., et al., 2018, preprint, (arXiv:1805.08726)
- Cardelli et al. (1989) Cardelli J. A., Clayton G. C., Mathis J. S., 1989, ApJ, 345, 245
- Castro-Ginard et al. (2018) Castro-Ginard A., Jordi C., Luri X., Julbe F., Morvan M., Balaguer-Núñez L., Cantat-Gaudin T., 2018, preprint, (arXiv:1805.03045)
- Dias et al. (2002) Dias W. S., Alessi B. S., Moitinho A., Lépine J. R. D., 2002, A&A, 389, 871
- Dias et al. (2014) Dias W. S., Monteiro H., Caetano T. C., Lépine J. R. D., Assafin M., Oliveira A. F., 2014, A&A, 564, A79
- Evans et al. (2018) Evans D. W., et al., 2018, A&A, 616, A4
- Froebrich et al. (2007) Froebrich D., Scholz A., Raftery C. L., 2007, MNRAS, 374, 399
- Gaia Collaboration et al. (2016) Gaia Collaboration et al., 2016, A&A, 595, A1
- Gaia Collaboration et al. (2018a) Gaia Collaboration et al., 2018a, A&A, 616, A1
- Gaia Collaboration et al. (2018b) Gaia Collaboration et al., 2018b, A&A, 616, A10
- Kharchenko et al. (2013) Kharchenko N. V., Piskunov A. E., Schilbach E., Röser S., Scholz R.-D., 2013, A&A, 558, A53
- King (1962) King I., 1962, AJ, 67, 471
- Kronberger et al. (2006) Kronberger M., et al., 2006, A&A, 447, 921
- Lindegren et al. (2018) Lindegren L., et al., 2018, A&A, 616, A2
- Luri et al. (2018) Luri X., et al., 2018, A&A, 616, A9
- Maia et al. (2010) Maia F. F. S., Corradi W. J. B., Santos Jr. J. F. C., 2010, MNRAS, 407, 1875
- Majaess (2013) Majaess D., 2013, Ap&SS, 344, 175
- Marigo et al. (2017) Marigo P., et al., 2017, ApJ, 835, 77
- Marino et al. (2018) Marino A. F., Milone A. P., Casagrande L., Przybilla N., Balaguer-Núñez L., Di Criscienzo M., Serenelli A., Vilardell F., 2018, ApJ, 863, L33
- Minniti et al. (2010) Minniti D., et al., 2010, New Astron., 15, 433
- Moni Bidin et al. (2014) Moni Bidin C., et al., 2014, A&A, 561, A119
- Netopil et al. (2007) Netopil M., Paunzen E., Maitzen H. M., Pintado O. I., Claret A., Miranda L. F., Iliev I. K., Casanova V., 2007, A&A, 462, 591
- O’Donnell (1994) O’Donnell J. E., 1994, ApJ, 422, 158
- Piatti et al. (1999) Piatti A. E., Claria J. J., Bica E., 1999, MNRAS, 303, 65
- Roeser et al. (2010) Roeser S., Demleitner M., Schilbach E., 2010, AJ, 139, 2440
- Ryu & Lee (2018) Ryu J., Lee M. G., 2018, ApJ, 856, 152
- Santos & Bica (1993) Santos Jr. J. F. C., Bica E., 1993, MNRAS, 260, 915
- Skrutskie et al. (2006) Skrutskie M. F., et al., 2006, AJ, 131, 1163
- Taylor (2005) Taylor M. B., 2005, in Shopbell P., Britton M., Ebert R., eds, Astronomical Society of the Pacific Conference Series Vol. 347, Astronomical Data Analysis Software and Systems XIV. p. 29
- Torrealba et al. (2018) Torrealba G., Belokurov V., Koposov S. E., 2018, preprint, (arXiv:1805.06473)