The role of particle, energy and momentum losses in 1D simulations of divertor detachment
Abstract
A new 1D divertor plasma code, SD1D, has been used to examine the role of recombination, radiation, and momentum exchange in detachment. Neither momentum or power losses by themselves are found to be sufficient to produce a reduction in target ion flux in detachment (flux rollover); radiative power losses are required to a) limit and reduce the ionization source and b) access low-target temperature, , conditions for volumetric momentum losses. Recombination is found to play little role at flux rollover, but as drops to temperatures around eV, it becomes a strong ion sink. In the case where radiative losses are dominated by hydrogen, the detachment threshold is identified as a minimum gradient of the energy cost per ionisation with respect to . This is also linked to thresholds in and in the ratio of upstream pressure to power flux.
A system of determining the detached condition is developed such that the divertor solution at a given (or lack of one) is determined by the simultaneous solution of two equations for target ion current – one dependent on power losses and the other on momentum. Depending on the detailed momentum and power loss dependence on temperature there are regions of where there is no solution and the plasma ‘jumps’ from high to low states. The novel analysis methods developed here provide an intuitive way to understand complex detachment phenomena, and can potentially be used to predict how changes in the seeding impurity used or recycling aspects of the divertor can be utilised to modify the development of detachment.
Keywords: tokamak, detachment, SD1D
1 Introduction
It has long been recognised that divertor plasma detachment will be required in future fusion devices such as ITER and DEMO, in order to keep divertor target heat loads below technological limits (e.g. [1, 2, 3]). Modelling of divertor detachment in magnetic confinement fusion devices is often done using 2D models [4, 5, 6], but simplified analytic [7, 8] and 1D computational models [9, 10, 11, 12, 13] can provide insight into the underlying processes, and provide guidance for optimisation of future devices. Here the SD1D model is presented (section 2), which has been developed using BOUT++ [14, 15] to study detachment dynamics. It is a time-dependent code, which enables the study of the detachment process, feedback control of detachment, and the response to plasma transients such as ELMs, in addition to steady-state solutions.
Before applying this model to time-dependent problems, we first use SD1D to understand the roles of particle, power and momentum loss mechanisms involved in detached steady state solutions. The importance of power loss vs momentum loss to the detachment process has been debated in the literature [7, 8, 16] and studied experimentally [17, 18]. In addition, simplified models have been constructed which emphasise power losses to predict the detachment threshold [19, 20, 21, 22] and sensitivity of the detached region extent/location to external controls [21].
All simulations are carried out in MAST-Upgrade like geometry, with a parallel heat flux of MW/m2 at the X-point, m connection length comprising m above the X-point and m from X-point to target. These are typical of expected conditions in the first phase of MAST-Upgrade operation [23]. The effect of gradients in the total magnetic field (total flux expansion [21, 24]) is included, with an area expansion factor of 2 (ratio of the total field at the X-point to that at the target) between X-point and target in all cases shown here.
2 The SD1D model
A 1D time dependent fluid model [7, 11, 12] is solved for the plasma density , parallel momentum and static pressure , assuming equal isotropic ion and electron temperatures .
| (1a) | |||||
| (1b) | |||||
| (1c) | |||||
| (1d) | |||||
where . As discussed in [25], the use of isotropic pressure likely overestimates the magnetic mirror effect in low collisionality regimes. It is also known experimentally that in general [26, 27]. More sophisticated models retaining both parallel and perpendicular ion pressures have been developed [10, 28], together with separate ion and electron temperatures. Those models used a simpler neutral gas model than is employed here, discussed below. Here we focus mainly on high collisionality regimes, and leave removing these limitations to future work.
An external source of power injects energy at a constant rate into a volume above the X-point, in this case the first m of the domain. The external source of particles is varied using a proportional-integral (PI) feedback controller to achieve a specified upstream plasma density. Coupling to neutrals occurs through particle sources and sinks (ionisation and recombination) represented by ; energy exchange ; radiation due to hydrogen excitation and impurity radiation; and friction forces due to ionisation, recombination and charge exchange. These hydrogenic rates are calculated using semi-analytic approximations [13, 29]. Unless otherwise stated, in these simulations a 1% fixed fraction carbon impurity model is used, based on coronal equilibrium and calculated using ADAS data [30]. In all results shown here where both are included, hydrogenic radiation exceeds the carbon impurity radiation.
A similar set of three equations is evolved for the neutral fluid density , parallel momentum and pressure . The neutrals are not confined by the magnetic field, so transport of neutrals across the magnetic field can provide a way for neutrals to migrate upstream. To mimic this process in a 1D model, the effective parallel velocity is given by the sum of a parallel flow and parallel projection of a perpendicular diffusion:
| (1b) |
where the collision frequency includes charge exchange, ionisation, and neutral-neutral collisions. The factor is set to in all simulation results shown here.
One of the assumptions made in going to a one-dimensional model concerns the handling of momentum losses. In particular, fast charge-exchanged neutrals can leave the thin SOL, transferring their momentum directly to the walls of the device without interacting with the rest of the neutral gas. In most of the simulations shown here charged exchanged neutrals do not escape; momentum is conserved, so that the total pressure (plasma + neutrals) is constant.
3 Detachment development
The definition of detachment varies amongst publications. In this paper our focus is on the particle flux to the divertor target, , which goes through at least two stages during detachment in the context of the simple equation for sheath ion flux:
| (1c) |
During the attached phase rises as the target pressure is constant. During the first stage of detachment the rise of slows through a combination of ionization source loss and drop. We define the second stage, and the focus of most of this study, to be the point in any scan (e.g. upstream density, impurity seeding, SOL power) where ‘rolls over’; in other words the rate of change of becomes negative with respect to what is being varied. In this paper there are only density scans, although the carbon fraction in some cases is held constant leading to the carbon density rising.
The effects of a reference upstream density scan on target ion flux are shown in figure 1, and this scan will serve as a benchmark for other cases shown in this paper. We find that target ion flux rollover for the case labelled “Carbon + Hydrogen” occurs at an upstream density of around m-3 for fixed input power flux of MW/m2. The “Carbon + Hydrogen” cases include radiative power losses from both hydrogen excitation radiation and 1% carbon impurity.
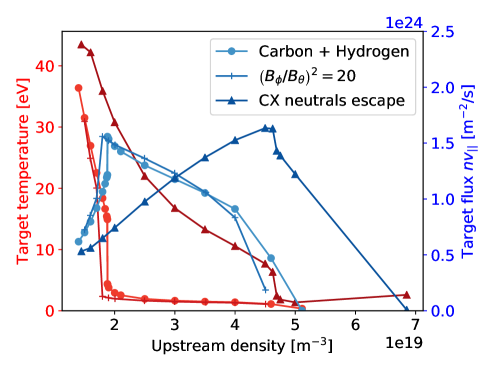
Also shown in figure 1 are results for a case where the cross-field neutral diffusion is doubled (equation 1b, “”), and a case in which charge exchanged neutrals remove momentum from the simulation instead of transferring it to the neutral fluid (“CX neutrals escape”). Variation in the cross-field diffusion (due to changes in field-line pitch in equation 1b) has a modest effect on the results, but modification to the total (plasma + neutral) momentum loss has a large effect. This effect of neutrals escaping the SOL is examined further in section 5, where it is shown to be important in determining the total momentum loss fraction (figure 4). This neutral loss process will depend on the device and configuration, so an improved model for neutral momentum loss is likely required for quantitative agreement with experiment.
In order to understand the behaviour of this model, and the underlying physical mechanisms, we here examine the plasma-neutral processes occuring during detachment. Of particular interest is the role of particle and energy loss (section 4), and the role of momentum loss (section 5) on the flux rollover at detachment.
SD1D has been benchmarked against the modified two-point model [31, 24], with good agreement for upstream densities below the flux rollover. As the momentum and power loss fractions ( and ) increase, the result becomes sensitive to small errors in these quantities, so the agreement deteriorates: relative error is at m-3 (, ); % after flux rollover at m-3 (, ); % at m-3 (, ); % error at m-3 (, ). Some initial comparisons have also been made to the SOLPS-ITER code [6, 32], with agreement of the order of %, but this is the subject of ongoing work, in particular to understand the validity of the fluid neutral model used here. Grid convergence tests have been performed for these simulations, and many of the operators used in SD1D have been verified using the Method of Manufactured Solutions (MMS) [15] though not yet the full model. Simulation results shown here used 800 grid cells, with convergence tests done at half and double resolution. Grid cells are packed close to the target so that the resolution parallel to the magnetic field is mm at the target and cm upstream.
4 The role of particle and energy loss
The parallel heat flux to the divertor target consists of plasma thermal energy, and the ionisation energy released by surface recombination. Both of these heat fluxes are proportional to the particle flux . Reducing target particle flux is therefore considered here as the important outcome of detachment for extending high power divertor lifetime.
Volume recombination of plasma ions at low temperatures (of the order of 1eV) provides a mechanism by which plasma ion flux to the target can be reduced, converting plasma flux to neutral flux before the plasma reaches the target. To examine the importance of recombination to these 1D results we have performed the same density scan but with recombination turned off.
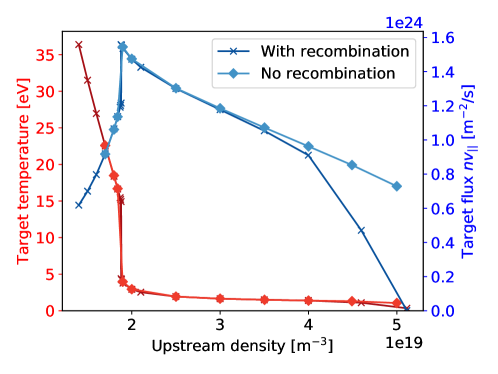
Results are shown in figure 2, and indicate that recombination plays little role at the rollover in flux at an upstream density of m-3, but becomes important at higher upstream densities of around m-3. This makes sense because target eV at this higher upstream density, whereas at target flux rollover target eV. This is in contrast to some previous results [33] in which flux rollover occurred at lower temperatures, but in agreement with recent experiments [34, 18] and simulations [35] of TCV. There are several ways in which target flux can be reduced, recombination being one of them, so discrepancies may be seen between studies in different regimes.
From particle conservation the target flux is given by the sum of the flux from the SOL into the divertor and the ionisation flux, less the ions lost to recombination. Other mechanisms such as cross-field transport may also contribute, but are not included in this 1D model, and will typically average to zero over the divertor volume. In these simulations the recycling coefficient is set to so the upstream flux is small, and in the absence of significant recombination the drop in target flux must be due to a drop in ionisation. The input power is fixed, so this drop in ionisation is due to either a reduction in power available for ionisation (due to increased impurity radiation losses), or an increase in the effective energy cost per ionisation , or both. This effective ionisation cost is calculated as the ratio of the total power lost to hydrogen ionisation and excitation, divided by the rate of ionisations. increases as falls, due to excitation radiation, in this simulation from eV per ionisation at m-3 to eV per ionisation at rollover (averaged over the domain; shown in more detail in figure 6).
One way to quantify this power limitation picture of detachment is in terms of the fraction of power available which goes into hydrogen excitation and ionisation, with the remainder being transmitted through the sheath [18]. In these simulations the radiation and ionisation regions overlap, complicating the analysis. Nevertheless, at flux rollover the fraction of the power into the divertor going to ionisation increases from % to % during the strong drop in , supporting the association between power limitation and flux rollover [17, 36, 8, 33, 18].
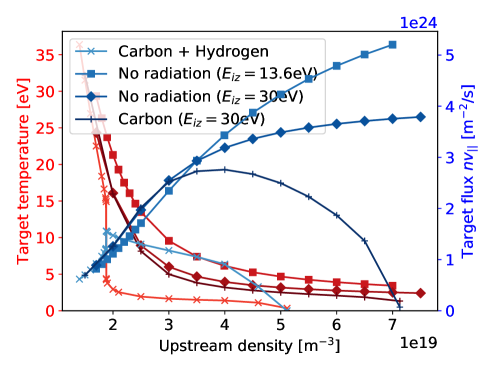
To test the importance of power dissipation, figure 3 data labelled “No radiation (eV)” shows the effect of removing all power radiation mechanisms, so that the energy cost per ionisation is only the ionisation potential eV, and there is no impurity radiation. In this case rollover during detachment does not occur in the range of upstream density studied, though the target temperature falls to eV at an upstream density of m-3, comparable to the target temperature at flux rollover in the case with radiation included, at an upstream density of m-3. The fraction of available power going to ionisation only reaches % in this case, which though significant is less than the original case discussed above.
A similar result is found when a fixed ionisation cost of eV is used, to account for some hydrogen excitation radiation, also shown in figure 3. In this case the fraction of available power going to ionisation reaches %. Assuming all of the divertor input power, , is used for ionisation, and taking into account the eV Franck-Condon energy with which dissociated neutral atoms are recycled, the upstream input power would lead to a target flux of m-2s-1 (in the limit of zero target temperature). The highest fluxes reached in the eV scan, m-2s-1, imply that around % of the input power is going to ionisation. Though the rate of change of target flux with upstream density is reducing, no rollover () in the target flux is seen in this case. A scan with eV still does not produce a flux rollover.
This lack of flux rollover in cases with fixed ionisation cost can be understood by considering the power balance and temperature dependence of power losses. In the absence of significant recombination the target particle flux is given by the ionisation rate. The input power into the simulation, , therefore goes either to impurity radiation (), ionisation (), or to target heat flux () as given in equation 1d
| (1d) |
where is the target particle flux, labelled “pow” here since this expression is derived from power balance. The sheath heat transmission coefficient is set to in these simulations, and the temperature at the target (assumed to be the same as at the sheath entrance). is the power available for ionisation, some of which is used for ionisation , and the remainder going to the target in the form of kinetic energy . is the energy cost of each ionisation, consisting of the ionisation potential (13.6eV) and the radiation due to excitations preceding ionisation. From equation 1d we can write down the power balance constraint for the target ion flux
| (1e) |
If and are fixed, and impurity radiation is negligible, then with cannot be reduced without increasing , clearly not the desired outcome. The detached solution with a reduction of both target temperature and particle flux is therefore not available. This is discussed in more detail in section 5.
In this picture there are three ways in which particle flux can be reduced: recombination; an increasing as drops; or impurity radiation , which reduces power available for ionisation. In the original “Carbon + Hydrogen” case shown in figure 3 the dominant mechanism is an increase in (hydrogen radiation) as drops. In the case labelled “Carbon eV” with a % fixed fraction carbon impurity and eV fixed ionisation cost, particle flux rollover is also achieved, with the fraction of available power going to ionisation () around % at rollover (m-3). High power fractions going to ionisation appears to be associated with flux rollover, consistent with the power limitation picture, but is not by itself sufficient to produce flux rollover. To understand this further we next examine the role of momentum losses and the description of target ion flux as in equation 1e but based on momentum ().
5 The role of momentum loss
As briefly mentioned in section 3, one of the robust experimental characteristics of detachment is loss of target plasma pressure, implying a loss of momentum to neutrals or other sinks. Simple arguments indicate that the target particle flux varies as in equation 1c, reproduced here as equation 1f and labelled to indicate that the origin of this relationship is the momentum balance:
| (1f) |
where the pressure and temperature are evaluated at the divertor target. In the absence of momentum losses, a sonic boundary condition implies that the static target plasma pressure is proportional to the upstream pressure . As mentioned, a fall in the target pressure, faster than the drop in , is therefore necessary to reduce target particle flux, overcoming the increase in flux associated with a drop in target temperature. We note here that the drop in can be due either to volumetric momentum losses or a drop in the upstream pressure, or some combination of both [18]. For a steady-state solution to exist, the plasma must self-organise into a configuration which satisfies both this momentum constraint as well as particle flux and power balance constraints discussed in section 4.
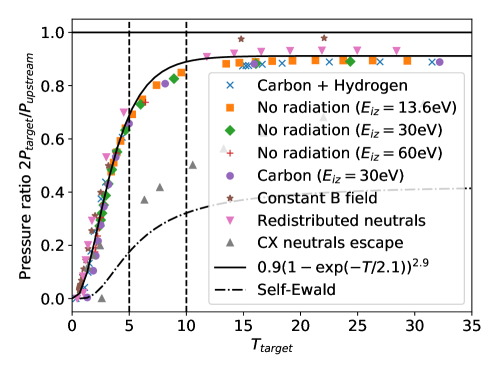
A measure of the pressure loss from X-point to target is the ratio of target pressure to upstream pressure , shown in figure 4. As has been shown previously [37, 38, 16], this pressure ratio is found to be mainly a function of target temperature, and here is shown to be independent of the power dissipation model (Carbon, Hydrogen radiation, or fixed ). In addition, a case with no flux expansion (Constant B field), and a case where 50% of recycled neutrals are distributed evenly along the divertor leg (Redistributed neutrals) follow the same trend. The one case which follows a different trend in figure 4 is labelled “CX neutrals escape”, in which charge-exchanged neutrals escape the SOL, lose their momentum, and return at a random location along the divertor leg. This results in a loss of total (plasma + neutral) momentum, modifying . As discussed in section 2, the treatment of neutral momentum is likely to be important in quantatively matching experiment.
As in [7, 16], the pressure ratio and hence the fraction of total momentum lost, , fits a function of the form in equation 1g and shown in figure 4:
| (1g) |
The fit coefficients found here are comparable to those from experimental data e.g. C-MOD [37] and SOLPS modelling of AUG [16] H-mode . Possible sources of discrepancy include radial momentum transport, and variations in how plasma momentum is transferred to neutrals and the walls of the device discussed further below. As discussed elsewhere [38, 16], this strong dependence on target temperature is consistent with a simple model in which neutrals ionise in a narrow region close to the target, so that the neutral density and electron temperature can be considered homogenous over the interaction region. In this Self-Ewald model [39], given in equation 1ha, is only a function of ionisation and charge exchange rate coefficients, which to first approximation depend only on the temperature:
| (1ha) | |||||
| (1hb) | |||||
where and are the ionisation and charge-exchange rate coefficients. This Self-Ewald solution overestimates the momentum loss, as shown in figure 4, since it assumes that all charge exchange events remove momentum from the system, in addition to occuring in an isothermal environment.
The drop in pressure from upstream to target shown in figure 4 is commonly associated with detachment, but is not sufficient to lead to rollover: Here all scans with conserved momentum follow the same pressure ratio curve, but the scans with fixed energy cost per ionisation do not have a roll over in target flux, as shown in figure 3.
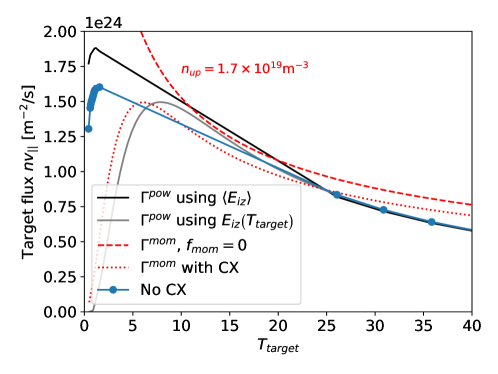
To further understand the lack of rollover in target flux in cases with fixed energy cost per ionisation , figure 5 shows the target flux against target temperature for three scans with no impurity radiation and different fixed values for .
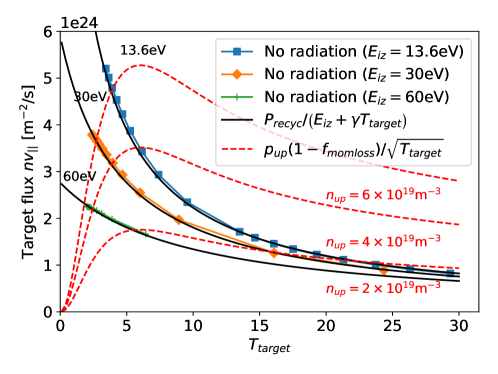
As discussed in section 4, power balance dictates that the target flux and target temperature follows equation 1d, shown as solid black lines for each of the three values of . In steady state this solution must also be consistent with momentum balance (equation 1f), shown as dashed red curves for three different upstream densities. The intersection of the solid black (power) and dashed red (momentum) curves is therefore the consistent steady-state solution.
The expression for flux from momentum balance (equation 1f) can be written as the upstream pressure multiplied by a function which only depends on target temperature (equation 1hi):
| (1hi) |
In all SD1D cases discussed here the variation in upstream temperature is small, eV, so . The dashed red curves in figure 5 therefore scale up and down in proportion to the upstream pressure ( density), whilst retaining a constant shape . The black curves scale in proportion to the input power, whilst also retaining a constant shape. As these inputs are changed, the intersection of the two curves moves. Since for large the flux from momentum balance (equation 1f) goes like , whilst the flux from power balance (equation 1d) goes like , there is always a solution for these scans. It can be seen in figure 5 that as the upstream density is increased the red curve () moves upwards; this causes the intersection point to move to the left, corresponding to a lowering of target temperature and an increase in target flux, which asymptotically approaches the limit . Note that recombination could produce a rollover in these scans, by removing flux before it reaches the target, but is not sufficient in the cases studied here.
Having understood why the cases with fixed do not have a rollover in target flux, we now turn to the more experimentally relevant cases which do have a flux rollover. From figure 5 it can be seen that in order to have a rollover in target flux, the black curve derived from power balance (equation 1d), must change slope so that . This is in addition to the requirement for momentum loss which determines the shape of the red curve.
Assuming a fixed input (upstream) power, , the power to the recycling region is given by (equation 1d), where is the impurity radiation [18]. The gradient of the flux with respect to target temperature is given in equation 1hj.
| (1hj) |
The gradient of can therefore be changed by either impurity power radiation which depends on target temperature, or through an which depends sufficiently strongly on target temperature.
Impurity radiation can drive a change in sign of , but is complicated by the dependence of on plasma density. Here we consider the case without impurity radiation, . This is relevant to the scan labelled “Carbon + Hydrogen” since in those cases the hydrogen radiation dominates the power loss. The criterion for a change in gradient of , and so a rollover of target flux, is therefore given by equation 1hk:
| (1hk) |
The effective value of from the SD1D simulation with varying (labelled “Carbon + Hydrogen”) is shown in figure 6, averaged over the field line for each case corresponding to the solution .
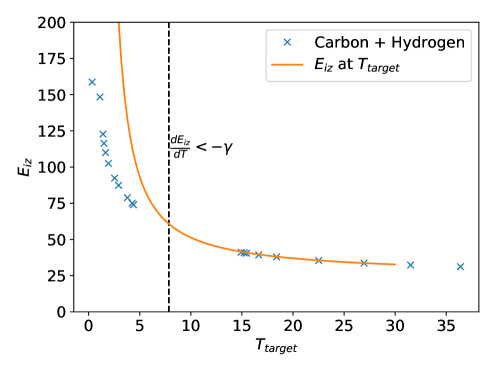
Since is an increasingly steep function of temperature as the target temperature falls, equation 1hk can be related to a threshold for rollover at eV, eV in the red curve of figure 6 (point-wise value, not averaged over the domain). By combining equations 1hi and 1d, this threshold in the gradient of can also be related to a critical ratio of upstream pressure to recycling power , which has been proposed as a detachment threshold [36, 33, 18], and which is a function only of target temperature as shown in equation 1hla:
| (1hla) | |||||
| (1hlb) | |||||
where equation 1g has been used for . This value is smaller than the N/MW threshold found in [33] for SOLPS4.3 simulations of pure Deuterium DIII-D-like equilibria, but larger than that derived and measured [18]. This difference may be due to different effective , which here uses a simplified semi-analytic model, to differences in , or to a difference in , which varies somewhat between devices and simulations [16]. The effective averaged over the domain (data points in figure 6) deviates from at the target temperature (curve in figure 6), which also shifts equation 1hla to higher .
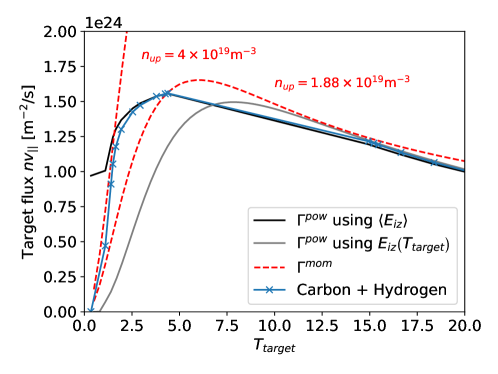
The target flux for this scan with varying (labelled “Carbon + Hydrogen” in figures 1 and 3) is shown in figure 7. This is similar to figure 5, but now the black and grey curves which represent the power balance constraint (equation 1d) are not monotonic and so a flux rollover is possible. The grey curve shows the power balance obtained by using the target temperature in the rates used in SD1D. This fits the simulation results well at high target temperatures, but at an upstream density m-3 a transition is seen in the target temperature. Figure 7 shows that the reason for this transition is that at the corresponding target temperature eV the gradients of the grey and red curves are such that so that these curves no longer intersect as the upstream density is increased. This loss of steady-state solution results in a rapid change in density and temperature profiles, approximately doubling the peak density. This moves the peak in ionisation away from the target, modifying the power dissipation curve (from the grey to the black line in figure 7) with an average which deviates from the value at , as shown in figure 6. The solution moves to a different point on the same red curve at a similar upstream density (m-3 to m-3), but now with a target temperature of eV rather than eV.
Rapid transitions into detachment are common (e.g. [40, 41, 42]) but are undesirable in a tokamak divertor, both for design and control. The above discussion implies that power dissipation mechanisms which dissipate strongly at high temperatures, particularly at target temperatures above the peak in (equation 1hi), have the potential to result in sudden transitions. This is because at these high temperatures so that sufficiently strong power dissipation can produce a situation where , the black and red curves in figure 7 no longer intersect, and a smooth change is no longer possible. For these simulations the peak in occurs at eV when the fit in equation 1g is used. This analysis points to a possible solution: mechanisms which remove momentum at higher target temperatures, perhaps including radial transport, which modify and increase , would reduce the likelihood of sudden transitions.
We conclude that when recombination is not significant, momentum loss without sufficient power loss results in a lack of target flux rollover (figure 5); power loss without sufficient pressure loss can result in rapid transitions between states (figure 7). More specifically, a change in gradient of w.r.t is needed for target flux rollover. If this change in gradient is driven by hydrogen excitation radiation, then there is a threshold in the gradient of (equation 1hk) which can be related to a threshold in (figure 6) and to a threshold in N/MW (equation 1hla). If this threshold is reached at a higher temperature than the rollover in at eV then a rapid transition may occur (figure 7), since a smooth variation in plasma state is no longer possible.
5.1 Removing charge exchange
In previous sections the effect of removing power dissipation mechanisms has been studied, identifying the potential for transitions to occur when insufficient momentum is removed. We now test the effect of removing the dominant plasma momentum loss mechanism in these simulations, charge exchange. At rollover the pressure loss due to charge exchange is times larger than the sum of all other effects; the next most significant effect is ionisation ( times smaller) which acts in the opposite direction. Given the discussion above of equation 1f, it might be expected that turning off charge exchange would raise target flux and inhibit the roll-over during detachment. What is seen in figure 8 is more nuanced: At low densities the target flux is indeed increased relative to the case with charge exchange, but the sharp drop in target temperature and roll-over of target flux associated with detachment is seen to occur at a lower upstream density.
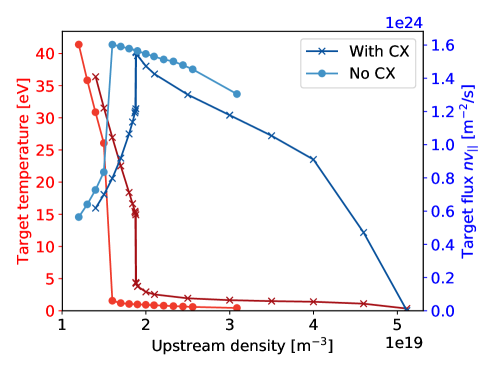
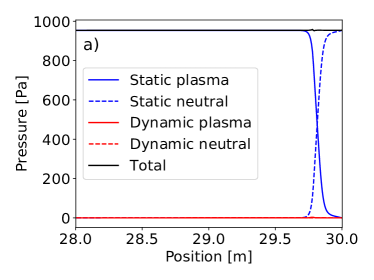
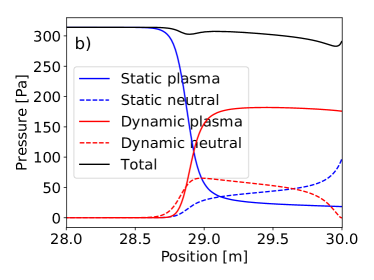
The plasma profiles are qualitatively different in the cases with and without charge exchange: When charge exchange is included, conservation of momentum between plasma and neutral fluids results in a static solution shown in figure 9a, in which the plasma fluid pressure is balanced by a neutral cushion in front of the target: since neutrals do not escape, the total plasma + neutral pressure is conserved. When charge exchange is turned off, this static solution is not possible because the required momentum exchange cannot occur. Instead in the solution shown in figure 9b a part of the plasma momentum is lost to neutral pressure through ionisation ( Pa) and some through the magnetic mirror effect [25] ( Pa), but the majority of the upstream static plasma pressure ( Pa) is balanced by plasma dynamic pressure ( Pa). Power is radiated in a quasi-neutral thermal front (gradient) region, and acceleration of the plasma into the low pressure region behind the thermal front converts internal energy to kinetic energy. In the absence of momentum loss this results in a cold supersonic flow of plasma to the target, reminiscent of a de Laval rocket nozzle [43]. Note that in this case anisotropic pressure (viscous) effects are likely to be important [25], but are not included here. The model is quasi-neutral by construction, so if space charge effects play a role in the thermal front then these would not be observed here.
The rarefaction front at which plasma static pressure drops moves upstream as the upstream density is increased. This results in a larger drop in the upstream temperature: Between upstream densities m-3 the upstream temperature falls from eV if charge exchange is included, and eV if charge exchange is excluded. Over the same range of upstream densities the front moves from m to m, close to the X-point at m. The drop in upstream temperature is consistent with a simple 2-point scaling [7] with parallel connection length , where is the location of the density peak. Such a use of the 2-point scaling treats the density peak as a ’virtual target’ [44, 45].
The transition at lower upstream density in the case without charge exchange, compared to the case with charge exchange, can be understood by considering the power and momentum balance as done in figures 5 and 7.
This is shown in figure 10: Removing charge exchange momentum losses reduces and so increases (equation 1hi). This moves the location where the curve intersects the curve, so that the same target temperature occurs at a lower upstream density. This lowers the upstream density at which a transition is observed, relative to the case with charge exchange (figure 7). Setting , the momentum balance curves (red dashed lines) in figure 10 cease to insersect the power balance curve at an upstream density of around m-3, at which point a transition is observed in the SD1D simulation.
It seems unlikely that this solution with supersonic flow could ever occur in tokamak experiments, though the possibility of transitions to supersonic flow in divertor plasmas has been shown previously [25]. The dramatic change in plasma solutions when momentum exchange is modified demonstrates the importance of momentum exchange to determining the divertor detachment thresholds and dynamics. It also shows the utility of the analysis in figure 10 to explaining the observed simulation results.
6 Conclusions
We have undertaken steady-state, 1D, simulations of divertor plasma detachment, specifically target ion flux rollover, utilizing a new computational tool, SD1D. The importance of recombination, radiative power loss, and momentum exchange in the detachment process with emphasis on the behavior of the target ion current rollover has been evaluated.
We find that for MAST-Upgrade like simulation parameters recombination does not play a significant role at flux rollover (target temperature eV), though is significant when drops to eV.
It is shown that in these simulations momentum loss, as characterised by a drop in total pressure along the magnetic field, is insufficient, by itself, to produce flux rollover during detachment. Impurity and/or hydrogenic radiative losses are also required to increase at low temperatures. In the particular case studied where excitation power losses dominate over impurity radiation, this corresponds to . We conclude that when recombination is not significant, momentum loss without sufficient power loss results in a lack of target flux rollover.
The precise dependence of momentum and power losses on target temperature has implications for the availability of steady state solutions. We have found that when the target flux is characterized in terms of power balance, , and momentum balance, , the allowed intersections of the two curves readily predict available steady state solutions. In some cases (e.g. power dissipation occurring without sufficient momentum removal) we find that there are regions of where there are no solutions – leading to rapid drops in temperature for essentially no increase in upstream density.
One implication of this work is that modification of the shape of and can be used to influence detachment behavior. One can envision causing such shape modifications by changing the escape probability of CX neutrals carrying momentum (e.g. changing divertor target geometry) or changing the temperature dependence of radiative losses (e.g. switching from one seeded impurity to another).
The SD1D code is available at https://github.com/boutproject/SD1D. All inputs, data and processing scripts are available at DOI 10.5281/zenodo.1410281.
Acknowledgements
This work has received funding from the EPSRC under grant EP/N023846/1. B. Lipschultz was funded in part by the Wolfson Foundation and UK Royal Society through a Royal Society Wolfson Research Merit Award as well as by the RCUK Energy Programme (EPSRC grant number EP/I501045).
This work has been carried out within the framework of the EUROfusion Consortium and has received funding from the Euratom research and training programme 2014-2018 under grant agreement No 633053. The views and opinions expressed herein do not necessarily reflect those of the European Commission
References
References
- [1] ITER Physics Expert Group on Divertor et al. Nucl. Fusion, 39:2391, 1999.
- [2] A Loarte et al. Nucl. Fusion, 47:S203, 2007.
- [3] F Romanelli et al. Fusion Electricity - A roadmap to the realisation of fusion energy. Technical report, EFDA, 2012.
- [4] T D Rognlien, D D Ryutov, N Mattor, and G D Porter. Physics of Plasmas, 6:1851, 1999.
- [5] A V Chankin, J P Coad, G Corrigan, S J Davies, S K Erents, H Y Guo, G F Matthews, G J Radford, J Spence, P C Stangeby, and A Taroni. Contrib. Plasma Phys., 40(3-4):288–294, 2000.
- [6] R Schneider, X Bonnin, K Borrass, D P Coster, H Kastelewicz, D Rieter, V A Rozhansky, and B J Braams. Contrib. Plasma Phys., 46(1-2):3–191, 2006.
- [7] P C Stangeby. The Plasma Boundary of Magnetic Fusion Devices. IoP, 2000.
- [8] S I Krasheninnikov and A S Kukushkin. J.Plasma Phys., 83:155830501, 2017.
- [9] S Nakazawa et al. Plasma Phys. Control. Fusion, 42:401, 2000.
- [10] R Goswami et al. Physics of Plasmas, 8:857, 2001.
- [11] M Nakamura et al. J. Plasma Fusion Res., 6:2403098, 2011.
- [12] S Togo et al. J. Plasma Fusion Res., 8:2403096, 2013.
- [13] E Havlíčková et al. Plasma Phys. Control. Fusion, 55:065004, 2013.
- [14] B D Dudson et al. J.Plasma Phys., 81(01):365810104, 2015.
- [15] B D Dudson, J Madsen, J Omotani, P Hill, L Easy, and M Loiten. Physics of Plasmas, 23(6):062303, 2015.
- [16] P C Stangeby. Plasma Phys. Control. Fusion, 60:044022, 2018.
- [17] B Lipschultz et al. Physics of Plasmas, 6:1907, 1999.
- [18] K Verhaegh et al. doi:10.13140/rg.2.2.24292.48005/1. Preprint, 2018.
- [19] L L Lengyel. IPP 1/191. Rep. Max-Planck-Institut für Plasmaphysik, Garching, 1981.
- [20] I H Hutchinson. Nucl. Fusion, 34(10):1337–1348, 1994.
- [21] B Lipschultz et al. Nucl. Fusion, 56:056007, 2016.
- [22] R J Goldston et al. Plasma Phys. Control. Fusion, 59:055015, 2017.
- [23] E Havlíčková, W Fundamenski, M Wischmeier, G Fishpool, and A W Morris. Plasma Phys. Control. Fusion, 56:075008, 2014.
- [24] D Moulton, J Harrison, B Lipschultz, and D Coster. Plasma Phys. Control. Fusion, 59:065011, 2017.
- [25] Ph Ghendrih, K Bodi, H Bufferand, G Chiavassa, G Ciraolo, N Fedorczak, L Isoardi, A Paredes, Y Sarazin, and E Serre. Plasma Phys. Control. Fusion, 53(5):054019, 2011.
- [26] M Kočan et al. Plasma Phys. Control. Fusion, 50:125009, 2008.
- [27] S Elmore et al. Plasma Phys. Control. Fusion, 54(6):065001, 2013.
- [28] S Togo et al. J. Nucl. Materials, 463:502, 2015.
- [29] J Leddy, B Dudson, and H Willett. Nucl. Mat. and Energy, 12:994–998, 2017.
- [30] H P Summers. The ADAS user manual, version 2.6, 2004.
- [31] V Kotov and D Reiter. Plasma Phys. Control. Fusion, 51:115002, 2009.
- [32] S Wiesen et al. J. Nucl. Materials, 463:480–484, 2015.
- [33] A A Pshenov. Nucl. Mat. and Energy, 12:948–952, 2017.
- [34] K Verhaegh et al. Nucl. Mat. and Energy, 12:1112–1117, 2017.
- [35] A Fil et al. Contrib. Plasma Phys., 58:746–750, 2018.
- [36] S I Krasheninnikov et al. J. Nucl. Materials, 266-269:251–257, 1999.
- [37] B Lipschultz et al. Fusion Sci. & Tech., 51:369–389, 2007.
- [38] I Paradela Perez. Nucl. Mat. and Energy, 12:181–186, 2017.
- [39] S A Self and H N Ewald. Phys. Fluids, 9:2486, 1966.
- [40] B Lipschultz et al. Proc. 16th Int. Conf. Plasma Physics and Controlled Fusion Research, IAEA, FI-CN-640A4-5, 1996.
- [41] S I Krasheninnikov. Physics of Plasmas, 4:3741, 1997.
- [42] A G McLean et al. J. Nucl. Materials, 463:533–536, 2015.
- [43] L D Landau and E M Lifshitz. Fluid Mechanics. Elsevier, 2013.
- [44] A Kukushkin et al. J. Nucl. Materials, 241-243:268–272, 1997.
- [45] P C Stangeby and A W Leonard. Nucl. Fusion, 51:063001, 2011.