Droplets capped with an elastic film can be round, elliptical, or nearly square
Abstract
We present experiments which show that the partial wetting of droplets capped by taut elastic films is highly tunable. Adjusting the tension allows the contact angle and droplet morphology to be controlled. By exploiting these elastic boundaries, droplets can be made elliptical, with an adjustable aspect ratio, and can even be transformed into a nearly square shape. This system can be used to create tunable liquid lenses, and moreover, presents a unique approach to liquid patterning.
pacs:
Wetting has been the subject of intense research for well over a century, motivated largely by industrial applications, ranging from designing tires to treating textiles and choosing coatings for surfaces, but also by the academic interest in a field which is undeniably rich de Gennes et al. (2008). A common theme in wetting phenomena is that boundary conditions and substrate play a pivotal role. For instance, when the substrate is replaced by a soft solid, elastocapillary interactions lead to deviations from the classical Young-Dupré’s law due to the formation of a wetting ridge at the contact line Pericet-Cámara et al. (2008); Jerison et al. (2011); Style and Dufresne (2012); Style et al. (2013a); Marchand et al. (2012); Park et al. (2014); Hui and Jagota (2014); Bostwick et al. (2014). The substrate can also be replaced by a thin free-standing elastic film, serving as a compliant boundary for the droplet Shanahan (1985); Nadermann et al. (2013); Hui et al. (2015); Hui and Jagota (2015); Schulman and Dalnoki-Veress (2015); Liu et al. (2016); Fortais et al. (2017); Schulman et al. (2017). In this geometry, the contact angles are set by a Neumann construction with mechanical and interfacial tensions balanced at the contact line Nadermann et al. (2013); Hui et al. (2015); Schulman and Dalnoki-Veress (2015); Fortais et al. (2017); Schulman et al. (2017).
Compliant elastic surfaces also show novel wetting behaviours and morphologies. For instance, droplets have been observed to migrate towards regions of increased compliance Style et al. (2013b); Alvarez et al. (2018); Liu et al. (2017), and interact with other droplets due to deformations induced in the elastic films Karpitschka et al. (2016); Liu et al. (2016). Dewetting liquid films capped by a thin elastic layer can have their dynamics and dewetting morphologies controlled by adjusting the tension Schulman et al. (2018a). Anisotropic tension in a supporting free-standing film causes sessile droplets to elongate along the high tension direction, and thus, droplets map out the stress field in the elastomer Schulman et al. (2017). Furthermore, droplets pressed between a rigid surface and a soft solid acquire the shape of a flattened ellipsoid Martin et al. (1997).
Although partial wetting on soft or compliant solids has received significant attention, here, we examine partial wetting in a novel geometry wherein droplets are capped by a thin elastic film under tension. This system could serve as a model for blisters or droplets trapped beneath drying paint Farinha et al. (2000). We show that the contact angle of these droplets decreases with increased tension which is well described through an analogy made with Young-Dupré’s law which incorporates mechanical tension. The model contains a free parameter from which the elastomer-liquid interfacial tension may be determined. We extract reasonable values for this quantity for four different liquid-solid combinations. Finally, we show that biaxial stresses in the capping elastic boundary can produce elliptical droplets with tuneable aspect ratio, and even droplets with nearly-square morphology using a suitable sample geometry.
Thin elastomeric films of Elastollan (elast) TPU 1185A (BASF) and styrene-isoprene-styrene (SIS) triblock copolymer (14% styrene content, Sigma-Aldrich) are prepared by spincoating out of cyclohexanone and toluene solutions respectively. Films are spun onto silicon wafers to create substrates and also onto freshly cleaved mica. The films are annealed at 150∘C (elast) or 100∘C (SIS) for 10 min to remove solvent and relax the polymer chains. The substrate films are of thickness 200 nm (elast) and 400 nm (SIS), as measured using ellipsometry (Accurion, EP3). One edge of each substrate is brushed with an acetone-wetted cotton swab to remove the elastomer from this edge. Small droplets of glycerol (Caledon Laboratories Ltd.) or polyethylene glycol (PEG) with = 0.6 kg/mol (Sigma-Aldrich) are deposited onto substrates. These sessile droplets are capped with a thin film of the same elastomer as the substrate film (simplifying the boundary conditions) as follows: capping films are prepared on mica and transferred onto a home-built straining set-up following the protocol described in Ref. Schulman et al. (2018a). Using this apparatus, films are strained isotropically , or biaxially with principal strains and . The substrate with droplets is then brought into contact with the strained capping film such that adhesive contact is formed between the two elastic films, thus completing the sample depicted in Fig. 1(a). We study four different pairings of liquid and elastomer. In the region where the substrate film was removed from the silicon using the cotton swab, we use ellipsometry to determine the thickness of the capping film. We employ films with between 150-1700 nm (Elastollan) and 550-3000 nm (SIS).
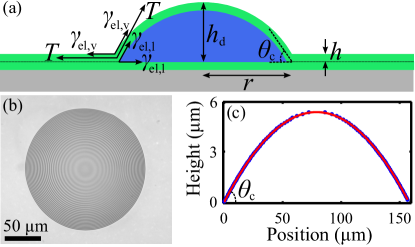
After being capped, the droplets are circular with a contact radius when viewed from above. Only droplets which are not visibly pinned are measured. The droplets are in the range 30 m 300 m, which is large enough that evaporation can be ignored. Furthermore, these are much larger than the bulk elastocapillary length such that elastic substate films are not significantly deformed by capillarity and can be thought of as uncompliant substrates Style et al. (2013a). In addition, bending of the capping film is only relevant locally at the contact line and tension dominates the global picture Andreotti and Snoeijer (2016). Due to the high tension in the capping film, the droplets are sufficiently flattened (to a height ) to exhibit interference fringes when viewed under an optical microscope with a red ( = 632.8 nm) filter (Newport, 10LF10-633), as seen in Fig. 1(b). From this interference pattern, the height profile of the droplet is determined. A height profile from a horizontal slice through the droplet in Fig. 1(b) is shown by the data points in Fig. 1(c). The profile is in excellent agreement with a circular cap fit, shown by the solid curve, from which the radius of curvature of the capped droplet is measured. If the droplets are large enough, it is also possible to directly image the droplet’s profile by acquiring images from a side view, and fit this profile to a circle to extract . We find good agreement between both techniques. The contact angle of the capped droplet is evaluated using the geometric relation . Several droplets are measured and the average is determined. The contact angles are reproducible from one droplet to the next and independent of the size of the droplet over the range studied.
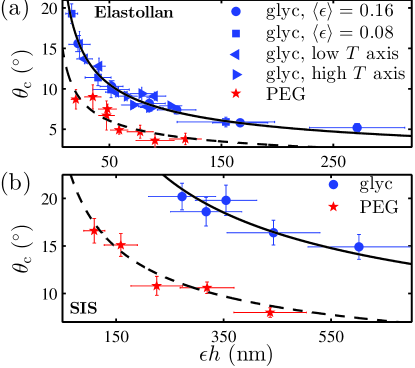
Although elastomers are not Hookean over large strains, we work exclusively with small strains ( 0.2), such that we can approximate a linear relationship between stress and strain foo . As such, the mechanical tension in an isotropically strained film is , where is the Young’s modulus of the elastomer and is the Poisson ratio. Thus, the mechanical tension in a capping film can be varied by tuning film thickness or strain. In Fig. 2(a), we plot the contact angle as a function of the product for Elastollan with glycerol (glyc) droplets. Two data sets are shown wherein is varied while the isotropic strain is held constant: () and (). The data sets collapse on the same curve and show that contact angle decreases with . This observation is consistent with previous work which found dewetting rims of a liquid capped with an elastic film to be increasingly more flattened with higher Schulman et al. (2018a). Our experiment is repeated with PEG droplets with strains in the range of 0.1-0.2 and variable film thicknesses, and the data is plotted in Fig. 2 (). Once again, the same trend is seen, but the two liquids, PEG and glycerol, do not collapse onto the same curve. In Fig. 2(b), the two liquids are paired with SIS elastomer instead (again with strains in the range 0.1-0.2 and variable film thicknesses).
To understand these trends, we construct a balance of mechanical and interfacial tensions at the contact line akin to previous work Nadermann et al. (2013); Hui et al. (2015); Schulman and Dalnoki-Veress (2015); Fortais et al. (2017); Schulman et al. (2017). We note that this balance is not truly a force balance, as the substrate exerts horizontal and vertical forces at the contact line as well. Rather, the balance represents changes in free energy for virtual motion of the contact line, in complete analogy with Young-Dupré’s law. In the simplest model, we make the assumption that the tension in the capping film is not significantly altered by the deformation induced by the droplet (elastic membrane limit) and remains uniform throughout Landau and Lifshitz (1986). This assumption is discussed later in more detail. Although the balance is not truly a force balance, we can make use of the analogy with Young-Dupré’s law of partial wetting, and as such, the solution can be heuristically obtained by balancing the mechanical and interfacial tensions in the horizontal direction, as shown in Fig. 1(a), where represents interfacial tensions between elastomer (”el”), liquid (”l”), and vapour (”v”). Since the substrate is intentionally chosen to be the same material as the capping film, there is no interfacial tension between these. Motivated by previous work on these elastomers, we further assume that the interfacial tensions remain constant with strain (i.e. no Shuttleworth effect) Schulman et al. (2018b). The horizontal balance gives . Note that, just as for Young-Dupré’s law, the same result is obtained by a free-energy minimization. Given measured modulus values MPa and MPa foo , we calculate that mN/m for all our samples. Thus, we make the approximation that is much greater than any interfacial tension in the system, as interfacial tensions involving polymeric materials are typically mN/m. Finally, we employ the small angle approximation (since all our contact angles are less than 20∘), and uncover a simple prediction for the contact angle:
| (1) |
Thus, is fully determined by the mechanical tension and elastomer-liquid interfacial tension. To test the model, we fit Eq. 1 to each data set in Fig. 2, leaving as a free parameter. The fits are plotted in Fig. 2 as solid (glyc) and dashed (PEG) curves, and are in excellent agreement with the data. The fit values of are shown in Table 1. Using our measured values of , we compute . In addition, we have measured the Young’s contact angle () of each solid/liquid combination tested, and the values are listed in Table 1. Using the Young-Dupré equation, we can calculate the elastomer-vapour interfacial tension as , where is found in the literature to be 63 mN/m Lide (2004) and 46 mN/m Korosi and Kovats (1981) for glycerol and PEG. These interfacial energies (Table 1) are of typical magnitudes for interfacial tensions involving polymeric solids. In fact, for SIS is within error of that quoted in Ref. Zuo et al. (2012). Furthermore, the values of are determined twice (using the two liquids) for each solid, and are within error of each other, which further validates the simple model.
| Solid/Liquid | ||||
|---|---|---|---|---|
| (nm) | (mN/m) | (∘) | (mN/m) | |
| Elast/glyc | ||||
| Elast/PEG | ||||
| SIS/glyc | ||||
| SIS/PEG |
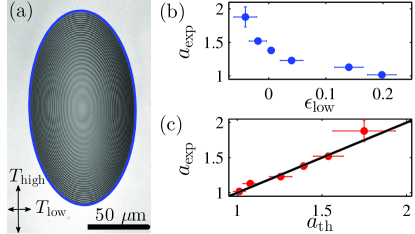
To further characterize this system, we perform experiments with Elastollan and glycerol, wherein the droplets are capped by films with a biaxial tension with principal strains and . In doing so, droplets assume an elongated shape (Fig. 3(a)) which is well described by an ellipse whose major axis aligns with the high tension direction (plotted as a curve around the perimeter). To understand how the elliptical droplet’s measured aspect ratio, , varies with strain, we perform experiments where and . As seen in Fig. 3(b), the aspect ratio decreases as increases, and approaches unity in the limit of isotropic strain ().
We find that height profiles of the droplet along the high- and low-tension axes are well described by circular cap fits once again, and from these, we determine the contact angles along both axes ( and ). Along each of the principal axes, the heuristic tension balance at the contact line, and the final prediction of Eq. 1, is identical to the isotropic case, but with replaced by or respectively. Applying Hooke’s law, one can calculate the tension along the principal strain direction to be where is the orthogonal principal strain direction and for elastomers we can set . At this point, an effective strain can be defined for this direction , such that the isotropic expression is recovered for the biaxial case as well: . In this way, the elliptical droplet data for () and () is plotted against in Fig. 2(a). In doing so, the biaxial strain data collapses onto the same curve as the isotropic strain data.
Since the droplet profiles along both principal directions are well fit to circular caps, the droplet height can be evaluated using the circular cap identity , where subscript once again denotes a principal direction and the small angle approximation was employed. The droplet height must be the same for profiles taken along either principal direction (). Therefore, the theoretical aspect ratio can be calculated as to be
| (2) |
where we have made use of Eq. 1 and the Hookean relationships described above. For a quantitative test of this result, we refer to Fig. 3(c), where all measurements of the aspect ratio are plotted against their predicted values , computed using Eq. 2 and the applied strains. Plotted in this way we find good agreement between theory and experiment (see solid line ).
The theory outlined in this study relies on the assumption that the tension of the film is not significantly changed by the deformation induced by the droplet. To construct a comprehensive theoretical treatment to calculate the additional stresses created by this deformation, one may follow the methodology presented in articles by Davidovitch, Vella, and co-workers, where the Föppl-von Kármán equations are solved in the limit of vanishing bending contributions Davidovitch et al. (2011); King et al. (2012); Schroll et al. (2013). However, results we have presented suggest that our assumption is appropriate. Droplets under isotropic tension are well described as spherical caps, consistent with the notion that the tension in the deformed elastic film is isotropic and uniform (though not necessarily equal to the outside tension in the film) and is acting against a constant pressure within the capped liquid. The deformation of the capping film must introduce an additional strain, leading to an increased mechanical tension in this region. However, several pieces of empirical evidence suggest that this additional tension is negligible. The contact angles depend on the prepared tension, i.e. the product . If the tension was significantly modified during capping, one would expect the additional tension to depend individually on as well (through the stretching modulus ), and would disrupt the collapse of the data seen in Fig. 2(a). Further evidence of the assumption’s validity stems from the success and self-consistency of the model presented herein (success of predictions made by Eq. 1 and Eq. 2, sensible values of and , and the collapse of biaxial and isotropic strain data in Fig. 2(a)). However, we note that for our largest contact angles (), the assumption may begin to break down, and would certainly not be applicable for the significant deformations at large angles ().
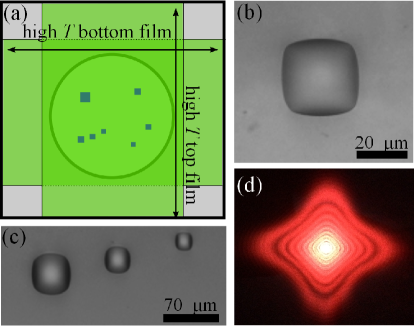
Motivated by previous work Schulman et al. (2018a), we perform an experiment with a unique combination of elastic boundary conditions, in the sample depicted in Fig. 4(a). An Elastollan film with biaxial tension (, ) is placed atop a washer with a circular hole. Glycerol droplets are deposited on the free-standing portion of this film. Finally, a second Elastollan film subjected to the same biaxial strains is placed on top, but with its high tension axis oriented perpendicular to the bottom film. Thus, the droplets are capped by an elastomer on either side, and the whole system is free-standing. As seen in Figs. 4(b)-(c), droplets in such a sample assume a remarkable square morphology with the sides oriented along the principal strain directions. In this free-standing sample geometry (Fig.4(a)), droplets act as lenses whose focal length and shape can be tuned. As a proof of principle, we shine a laser through a pinhole (150 m in diameter) onto a square droplet. The resultant focal spot (with the diffraction pattern) is shown in Fig. 4(d). As an elliptical droplet resembles a cylindrical lens producing a focal spot in the shape of a line, a square droplet creates a focal spot resembling a cross.
Here we have investigated the partial wetting of droplets capped by thin elastic films. When the tension in the elastic film is isotropic, droplets assume the shape of spherical caps which flatten with increasing tension. A balance of interfacial and mechanical tensions at the contact line made in analogy with Young-Dupré’s law well describes the change in contact angle with tension with only one free parameter. From this free parameter, the elastomer-liquid interfacial tension – a notoriously difficult quantity to measure – can be determined. Finally, we show that elastic films as boundary conditions for partial wetting can produce droplets with novel morphologies. Droplets can be designed to have elliptical shapes with aspect ratios that depend on the strains in the elastic film, and it is even possible to generate droplets with square morphology using suitable choices of the elastic boundary conditions. Thus, elastic membranes can be used to create highly tunable liquid morphologies.
The financial support by the Natural Science and Engineering Research Council of Canada the Joliot chair from ESPCI Paris is gratefully acknowledged. We thank A. Fortais for performing modulus measurements.
References
- de Gennes et al. (2008) P. de Gennes, F. Brochard-Wyart, and D. Quere, Capillarity and Wetting Phenomena (Springer, 2008).
- Pericet-Cámara et al. (2008) R. Pericet-Cámara, A. Best, H. J. Butt, and E. Bonaccurso, Langmuir 24, 10565 (2008).
- Jerison et al. (2011) E. R. Jerison, Y. Xu, L. a. Wilen, and E. R. Dufresne, Phys. Rev. Lett. 106, 186103 (2011).
- Style and Dufresne (2012) R. W. Style and E. R. Dufresne, Soft Matter 8, 7177 (2012).
- Style et al. (2013a) R. Style, R. Boltyanskiy, Y. Che, J. Wettlaufer, L. A. Wilen, and E. Dufresne, Phys. Rev. Lett. 110, 066103 (2013a).
- Marchand et al. (2012) A. Marchand, S. Das, J. H. Snoeijer, and B. Andreotti, Phys. Rev. Lett. 109, 236101 (2012).
- Park et al. (2014) S. J. Park, B. M. Weon, J. S. Lee, J. Lee, J. Kim, and J. H. Je, Nat. Comm. 5, 4369 (2014).
- Hui and Jagota (2014) C.-Y. Hui and A. Jagota, Pro. R. Soc. A 470 (2014).
- Bostwick et al. (2014) J. B. Bostwick, M. Shearer, and K. E. Daniels, Soft Matter 10, 7361 (2014).
- Shanahan (1985) M. E. Shanahan, The Journal of Adhesion 18, 247 (1985).
- Nadermann et al. (2013) N. Nadermann, C.-Y. Hui, and A. Jagota, Proc. Natl. Acad. Sci. U.S.A. 110, 10541 (2013).
- Hui et al. (2015) C.-Y. Hui, A. Jagota, N. Nadermann, and X. Xu, Procedia IUTAM 12, 116 (2015).
- Hui and Jagota (2015) C.-Y. Hui and A. Jagota, Soft Matter 11, 8960 (2015).
- Schulman and Dalnoki-Veress (2015) R. D. Schulman and K. Dalnoki-Veress, Phys. Rev. Lett. 115, 206101 (2015).
- Liu et al. (2016) T. Liu, X. Xu, N. Nadermann, Z. He, A. Jagota, and C.-Y. Hui, Langmuir 33, 75 (2016).
- Fortais et al. (2017) A. Fortais, R. D. Schulman, and K. Dalnoki-Veress, Eur. Phys. J. E 40, 69 (2017).
- Schulman et al. (2017) R. D. Schulman, R. Ledesma-Alonso, T. Salez, E. Raphaël, and K. Dalnoki-Veress, Phys. Rev. Lett. 118, 198002 (2017).
- Style et al. (2013b) R. W. Style, Y. Che, S. J. Park, B. M. Weon, J. H. Je, C. Hyland, G. K. German, M. P. Power, L. A. Wilen, J. S. Wettlaufer, and E. R. Dufresne, Proc. Natl. Acad. Sci. U.S.A. 110, 12541 (2013b).
- Alvarez et al. (2018) J. B. Alvarez, Y. Bazilevs, R. Juanes, and H. Gomez, Soft Matter (2018).
- Liu et al. (2017) T. Liu, N. Nadermann, Z. He, S. H. Strogatz, C.-Y. Hui, and A. Jagota, Langmuir 33, 4942 (2017).
- Karpitschka et al. (2016) S. Karpitschka, A. Pandey, L. A. Lubbers, J. H. Weijs, L. Botto, S. Das, B. Andreotti, and J. H. Snoeijer, Proc. Natl. Acad. Sci. U.S.A. 113, 7403 (2016).
- Martin et al. (1997) P. Martin, P. Silberzan, and F. Brochard-Wyart, Langmuir 13, 4910 (1997).
- Schulman et al. (2018a) R. D. Schulman, J. F. Niven, M. A. Hack, C. DiMaria, and K. Dalnoki-Veress, Soft matter 14, 3557 (2018a).
- Farinha et al. (2000) J. Farinha, M. Winnik, and K. Hahn, Langmuir 16, 3391 (2000).
- Andreotti and Snoeijer (2016) B. Andreotti and J. H. Snoeijer, Europhys. Lett. 113, 66001 (2016).
- (26) We measure the modulus using tensile stress-strain measurements on fibers consisting of Elastollan and SIS with diameters between 5 and 40 microns. The stress-strain curves are linear within experimental error for strains up to 0.2.
- Landau and Lifshitz (1986) L. Landau and E. Lifshitz, Theory of Elasticity, 3rd (Butterworth-Heinemann, New York, 1986).
- Schulman et al. (2018b) R. D. Schulman, M. Trejo, T. Salez, E. Raphaël, and K. Dalnoki-Veress, Nat. Commun. 9, 982 (2018b).
- Lide (2004) D. R. Lide, CRC Handbook of Chemistry and Physics (CRC Press, 2004) pp. 6–154.
- Korosi and Kovats (1981) G. Korosi and E. Kovats, J. Chem. Eng. Data 26, 323 (1981).
- Zuo et al. (2012) B. Zuo, F. F. Zheng, Y. R. Zhao, T. Chen, Z. H. Yan, H. Ni, and X. Wang, Langmuir 28, 4283 (2012).
- Davidovitch et al. (2011) B. Davidovitch, R. D. Schroll, D. Vella, M. Adda-Bedia, and E. A. Cerda, Proc. Natl. Acad. Sci. U.S.A. 108, 18227 (2011).
- King et al. (2012) H. King, R. D. Schroll, B. Davidovitch, and N. Menon, Proc. Natl. Acad. Sci. U.S.A. 109, 9716 (2012).
- Schroll et al. (2013) R. Schroll, M. Adda-Bedia, E. Cerda, J. Huang, N. Menon, T. Russell, K. Toga, D. Vella, and B. Davidovitch, Phys. Rev. Lett. 111, 014301 (2013).