Stephan Narison
Laboratoire
Univers et Particules , CNRS-IN2P3,
Case 070, Place Eugène
Bataillon, 34095 - Montpellier Cedex 05, France.
Email address: snarison@gmail.com
Abstract
This note complements and clarifies the results obtained in the original paper QCD Parameters Correlations from Heavy Quarkonia [1]
where, here, we present a more detailed discussion of the results obtained @ N2LO at two different subtraction scales =2.85 and 9.50 GeV from the (pseudo)scalar heavy quarkonia mass-spliitings . We obtain from the sum rule:
QCD spectral sum rules, Perturbative and Non-Pertubative calculations, Hadron and Quark masses, Gluon condensates.
1 Optimized subtraction scales
Besides the usual sum rules optimization procedure (sum rule variables and QCD continuum threshold) studied in details in Ref. [1], we deduce from Figs. 4 and 8 of Ref. [1] that the ratios of charmonium and bottomium moments are optimized respectively at the values of the subtraction scales:
(2)
2 and correlation
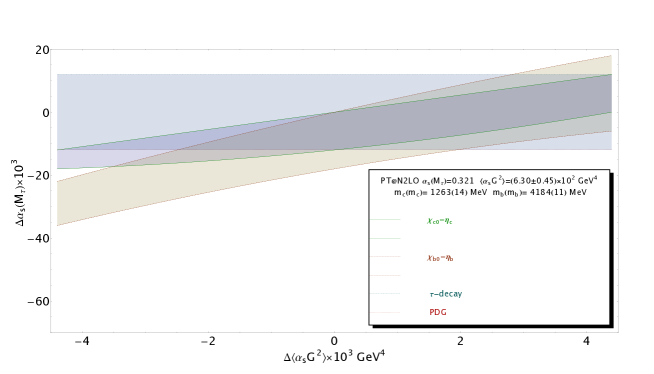
Figure 1: Correlation between and by requiring that the sum rules reproduce the (pseudo)scalar mass-splittings within MeV.
We study, in Fig. 15 of Ref. [1] (see Fig.1), the correlation between and where the charmonium (resp. bottomium) sum rules have been evaluated at (resp. ) but runned to the scale for a global
comparison of the results.
For the range of values allowed by different analysis (-axis) and requiring that the sum rule reproduces the experimental mass-splittings by about MeV, one obtains the grey band limited by the two green (continuous) curves in Fig.1 which lead to :
(3)
In the same way, the bottomium sum rule evaluated at the optimization scale 9 GeV gives (sand colour band limited by two dotted red curves):
(4)
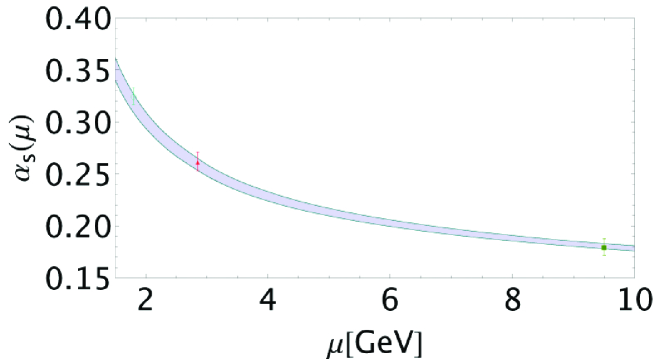
Figure 2: Comparison with the running of the world average [2, 3] (grey band limited by the two green curves) of our predictions at three different scales: for the original -decay width [4] (open circle), =2.85 GeV for (full triangle) and 9.5 GeV for (full square) [1].
3 Comparison with the world average
These values of estimated at different -scales are shown in Fig. 2 where they are compared with the running of the world average
[2, 3]. We have added, in the figure, your previous estimate of [4] obtained from the original -decay rate (lowest moment)[5, 6]:
(5)
where one should note that non-perturbative corrections beyond the standard OPE (tachyonic gluon mass and duality violations) do not affect sensibly the above value of as indicated by the coïncidence of the central value with the recent one from high-moments [7].
Our most precise prediction for from the heavy-quarkonia mass-splittings comes from the (pseudo)scalar charmonium one in Eq. 3 which corresponds to:
(6)
References
[1] S. Narison, Int. Journ. Mod. Phys.A33(2018) no.10, 1850045.
[2] For a review, see e.g: S. Bethke, Nucl. Part. Phys. Proc.282-284 (2017)149.
[3] PDG, C. Patrignani et al. (Particle Data Group), Chin. Phys.C40, 100001 (2016) and 2017 update.
[4]S. Narison, Phys. Lett.B673 (2009) 30.
[5]E. Braaten, S. Narison and A. Pich, Nucl. Phys.B373 (1992) 581.
[6]S. Narison and A. Pich, Phys. Lett.B211 (1988) 183.
[7]A. Pich and A. Rodriguez-Sanchez, Phys.Rev.D94 (2016) no.3, 034027.