iint \savesymboliiint \restoresymbolTXFiint \restoresymbolTXFiiint
The globular cluster system of the isolated elliptical NGC 6411: An old system in an intermediate-age galaxy? ††thanks: Based on observations obtained at the Gemini Observatory, which is operated by the Association of Universities for Research in Astronomy, Inc., under a cooperative agreement with the NSF on behalf of the Gemini partnership: the National Science Foundation (United States), the National Research Council (Canada), CONICYT (Chile), Ministerio de Ciencia, Tecnología e Innovación Productiva (Argentina), and Ministerio da Ciencia, Tecnologia e Inovasao (Brazil).
Abstract
We present a photometric study of the isolated elliptical NGC 6411 and its globular cluster (GC) system, based on Gemini/GMOS , , photometry. This galaxy has been the host of a SNIa. Spectral studies indicate an intermediate-age and very metal-rich stellar population in its inner region. The extent of the globular cluster system is about 65 kpc. Its population contains members, implying a rather poor system, as normally found for isolated ellipticals. The colour bimodality and luminosity distribution are typical of old GC systems. An excess of bright GCs with intermediate colours might evidence an intermediate-age merger, but their colours indicate an older event than ages derived from spectroscopic studies of the diffuse light of the galaxy.
keywords:
galaxies: elliptical and lenticular, cD – galaxies: evolution – galaxies: star clusters: individual: NGC 64111 Introduction
Elliptical galaxies (Es) usually inhabit groups and clusters of galaxies (Dressler 1980; Bamford et al. 2009), where the density of neighbours favoured merging processes, which are thought to be the main source of mass accretion for bright ellipticals since (e.g. van Dokkum et al. 2010; Jiménez et al. 2011; Schawinski et al. 2014). On the other hand, isolated ellipticals (iEs) might have experienced less mergers, evolving more quietly. From numerical simulations Hirschmann et al. (2013) indicated that iEs have been shaped by late mergers in larger proportion than Es in denser environments. Similar results have been reported by Niemi et al. (2010), who also found that iEs in the Millenium Simulation are typically bluer and present lighter haloes than Es in clusters. These results are supported by observational studies who found tidal features in a large fraction of iEs (e.g. Hernández-Toledo et al. 2008; Tal et al. 2009), bluer colours than Es in clusters (Lacerna et al. 2016) and evidence for light dark matter haloes (Méndez et al. 2009; Salinas et al. 2012; Richtler et al. 2015), but in some cases results differ, pointing to a variety of evolutionary histories (e.g. Marcum et al. 2004).
As the study of Es has been biased by high-density environments, the analyses of globular cluster systems (GCSs) in iEs have been limited to a few cases (e.g. Spitler et al. 2008; Lane et al. 2013; Richtler et al. 2015). This is in part motivated by the small number of iEs found in the local Universe, but also due to the rather poor GCSs they normally have (Caso et al. 2013b; Salinas et al. 2015, and references therein) in comparison with bright Es in clusters of galaxies (Harris et al. 2015; Caso et al. 2017).
It is believed that the origin of globular clusters (GCs) is directly related to the merger history of the galaxy they belong to, either by the extreme conditions needed to form GCs (Kruijssen 2014, 2015), or by the accretion of GCs during the merging process (Tonini 2013). Hence, the study of GCSs might bring evidence about the evolutionary history of a galaxy (e.g. Caso et al. 2015; Richtler et al. 2012; Richtler 2013; Richtler et al. 2014; Bassino & Caso 2017). In the present paper we perform a study of the iE NGC 6411, a moderately bright galaxy with an estimated distance of 40 Mpc based on surface-brightness fluctuations (SBF Blakeslee et al. 2001). It hosted a supernovae Ia (SN 1999da Filippenko 1999) at 75 arcsec from the galaxy centre, classified as a subluminous SNIa. The distances derived in this latter way are larger, ranging from 50 to 70 Mpc according to NED111This research has made use of the NASA/IPAC Extragalactic Database (NED) which is operated by the Jet Propulsion Laboratory, California Institute of Technology, under contract with the National Aeronautics and Space Administration.. Spectroscopic analysis from the CALIFA survey (González Delgado et al. 2015) reveals an intermediate age of Gyr and a high metallicity of , if fitted as a single stellar population. Sánchez-Blázquez et al. (2006) also analysed spectroscopic observations from NGC 6411, obtaining a similar metallicity for the central region, but a slightly older population, Gyr. Our aim is to characterise the GCS of the galaxy, in order to contribute to the analysis of its evolutionary history.
This paper is organised as follows. The observations and data reduction are described in Section 2, the results are presented in Section 3 and Section 4 is devoted to the discussion. Finally, a summary and the concluding remarks are given in Section 5.
2 Observations and data reduction
2.1 Observations
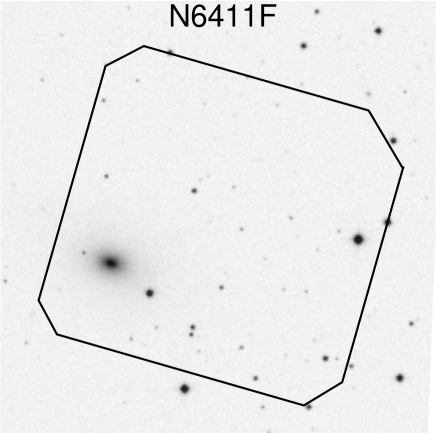
The data set consists of a field observed with the GMOS camera at Gemini North (programme GN-2015A-Q-70, PI: L.P. Bassino), containing the galaxy NGC 6411 (hereafter N6411F, see Figure 1), plus science verification observations from the Gemini Observatory Archive (GOA), which correspond to the programme GN-2001B-SV-67 (hereafter CompF) in order to estimate the field contamination. The GMOS field of view (FOV) is arcmin. Both programmes were observed in , and filters with similar exposure times (see Table 1), using binning, which results in a scale of arsec pixel-1. Considering the Galactic coordinates of the CompF (, ) and those of the N6411F (, ), the foreground contamination is expected to be small in comparison with that corresponding to background galaxies, and the overall contamination is expected to be similar. In Section 3.2 we detail this point.
The reduction was carried out with the tasks from the GEMINI-GMOS package, within IRAF. Around 20 bias exposures from nearby dates were used to built-up the master bias. Flat-fielding was performed using flats retrieved from the GOA website. The reduction also included detector mosaicking, image co-addition and the registration of the final images in the three filters. Basic data from the observations are listed in Table 1.
| Name | Filter | Obs. date | Exp. time | |
|---|---|---|---|---|
| dd mm yyyy | s | ′′ | ||
| N6411F | ||||
| CompF | ||||
2.2 Photometry and point-source selection
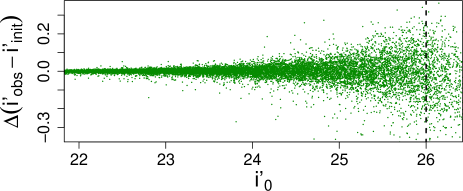
First, the galaxy light was subtracted from the GMOS original images of the N6411F in order to perform photometry on a more or less flat background and detect sources that are immersed in the galaxy light. We applied to the images a square median filter of side 200 px using FMEDIAN task from iraf. This filtered image was subtracted from the original image, and the procedure was repeated a second time with a median filter of side 40 px to discard weak halos around objects near the galactic centre. Figure 2 shows the difference between the initial and final magnitudes for artificial stars added to the N6411F for completeness calculation. The dashed vertical line indicates completeness limit mag chosen in Section 2.4. Similar comparisons were carried out for the three filters in both fields, proving that the procedure did not affect the point source photometry.
The software SExtractor (Bertin & Arnouts 1996) was applied to the images to generate a source catalogue. This filter was selected because it has the higher signal-to-noise ratio (S/N). Considering that GCs usually have effective radii smaller than pc (Brüns & Kroupa 2012), extragalactic GCs are detected as point sources at the distance of NGC 6411. Hence, we used the stellarity index from SExtractor in order to identify extended sources. This parameter spans from 0 for resolved objects to 1 for ideal point sources. Sources with lower values than were eliminated from the catalogue, following similar criteria from other extragalactic studies with Gemini/GMOS (e.g. Caso et al. 2015; Escudero et al. 2015; Bassino & Caso 2017).
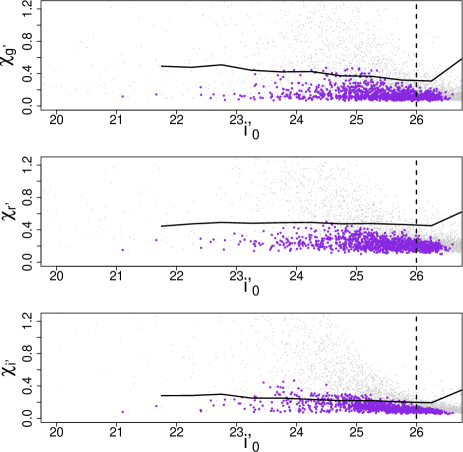
The photometry was carried out with the DAOPHOT package (Stetson 1987) within iraf. For each filter a second-order variable PSF was built-up from a sample of bright and relatively isolated stars, evenly distributed over the field. The final point-source catalogue was made considering the and sharpness parameters, from the task ALLSTAR. Figure 3 shows the parameter from the PSF photometry as a function of magnitudes for N6411F sources in the three filters. Objects fulfilling point sources criteria are highlighted. The solid line represents in each case the limit containing of the observed artificial stars. This analysis with both and sharpness parameters was carried out for both fields, in order to corroborate the accuracy of the selection criteria in discriminating point sources. The dashed vertical line indicates the completeness limit mag chosen in Section 2.4.
2.3 Photometric calibration
For both programmes standard star fields from the Standard Star Network (Smith & et al. 2002) have been observed during the same nights as the science observations. These fields contained between 6 and 12 bright stars measured in the three filters selected for our programme. Once we have determined from the curve-of-growth the proper aperture containing the total light, we fit the transformation equation:
with and the standard and instrumental magnitudes, respectively, and are the photometric zero points. is the mean atmospheric extinction at Mauna Kea, obtained from the Gemini Observatory Web Page222http://www.gemini.edu/sciops/instruments/gmos/calibration, and the effective airmass. Then, the resulting zero points for the , and filters were , and in the case of the N6411F, and , and for the CompF.
Aperture corrections were calculated from the stars selected for each PSF, and extinction corrections were obtained from Schlafly & Finkbeiner (2011, available in NED) values.
2.4 Photometric completeness
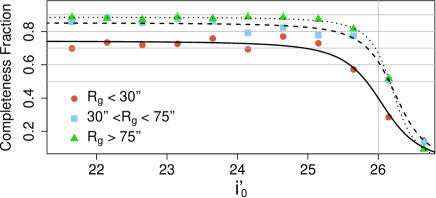
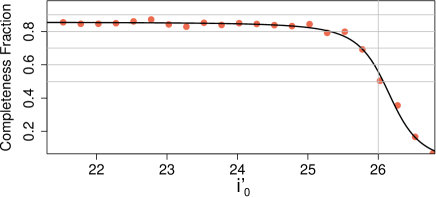
In order to estimate the photometric completeness for both fields, we added 250 artificial stars in the three filters, evenly distributed over the entire field, and with colours in the expected ranges for GCs. Their photometry was carried out in the same way as for the original fields, and the process was repeated 80 times, achieving a sample of 20 000 artificial stars. The upper panel of Figure 4 shows the completeness for the N6411F, split in three galactocentric regimes to take into account the decline of the completeness towards the galaxy centre. We chose as the magnitude limit mag, where the completeness falls below for point sources at and for the outer radii. At the magnitude limit, the completeness for the CompF falls below . In order to apply completeness corrections in our analysis, we fitted to each curve an analytic function of the form:
| (1) |
similar to that used by Harris et al. (2009), with , and free parameters.
The comparison between the initial brightness of artificial stars and their subsequent photometry (shown in Figure 2 for a single filter) proved that the application of the median filter does not modify the point source photometry.
3 Results
3.1 NGC 6411 surface photometry
We obtained the NGC 6411 surface brightness profiles in and , and the colour profile in applying the task ELLIPSE, within iraf.
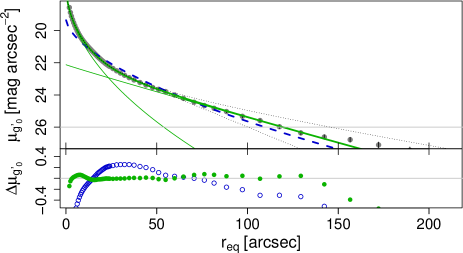
The upper panel of Figure 5 shows the surface brightness profile of the galaxy in the filter. The blue dashed line represents a single Sérsic model (Sersic 1968) fitted to the galaxy. The result presents large residuals, plotted in the lower panel with blue open symbols. The green and thin solid lines correspond to two Sérsic models, while the thick one indicates their sum. The composite residuals are plotted in the lower panel with green filled symbols, resulting in a more accurate fit. The dotted curves represent the change in the surface brightness profile of the galaxy when the sky level varies an amount equal to its Poisson noise.
The adopted form for the Sérsic profile was:
| (2) |
where is the central surface brightness, is a scale parameter and is the Sérsic shape index. The parameters are listed in Table 2, together with the effective radii, derived from the relation
| (3) |
where is a function of index, which might be estimated with the expression given by Ciotti (1991). From the surface brightness profiles in both filters we obtained kpc. This value is twice the half-light radius derived by González Delgado et al. (2015) in the CALIFA survey.
| Component | ||||
|---|---|---|---|---|
| Single | ||||
| Inner | ||||
| Outer |
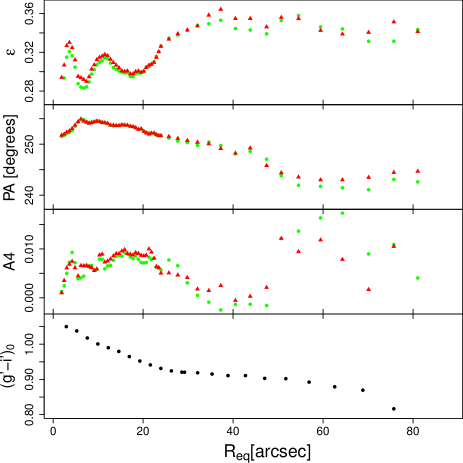
Figure 6 shows the radial dependence of ellipticity (), position angle and the higher harmonic A4, derived for (green circles) and (red triangles) filters, and the colour profile. The four panels are plotted in terms of the equivalent radius, with , where is the isophote semimajor axis. No striking difference is seen among them in any of these morphological parameters. The parameter A4 is mainly positive, which is expected in disky isophotes, but deviation from zero hardly exceed in the inner 50 arcsec. The colour profile was obtained from the galaxy colour map. It presents a gradient, becoming bluer towards the outskirts. The integrated colour resulted in . The CALIFA survey González Delgado et al. (2015) used two different single stellar populations (SSPs) datasets to analyse their data. In both cases they found NGC 6411 to fit a SSP with an intermediate-age population of Gyr and suprasolar metallicity, . From the webtool CMD 3.0333 http://stev.oapd.inaf.it/cmd, assuming Bressan et al. (2012) isochrones and Chabrier IMF we obtained . This is redder than our colour profile, but the CALIFA field is smaller than the effective radius.
There is a change in the behaviour of , A4 and the colour profile around arcsec. This corresponds to the galactocentric distance where the disky outer component starts to dominate over the inner spheroidal one in Figure 5, lending additional support to our choice of the two-component fit.
3.2 GC candidates selection from colours
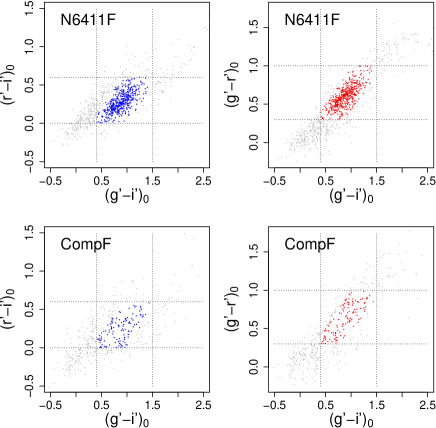
Figure 7 shows vs. and vs. colour-colour diagrams (CCD) for point sources in both fields. Because old GCs present narrow colour ranges, CCD can be helpful to distinguish them from contamination (e.g. Faifer et al. 2011). Hence, the GC candidates where selected from the point sources ranging , and . These values are similar to those used in previous GCS studies (e.g. Caso et al. 2015; Escudero et al. 2015; Bassino & Caso 2017). There are 550 GC candidates brighter than our completeness limit in N6411F and 170 point sources in CompF complying with the same colour constraints. We used the Besançon models (Robin et al. 2003) to simulate the contribution of foreground stars with colours in the ranges previously indicated and magnitudes between and mag in both fields. For an area of 1 centred on the Galactic coordinates of CompF we obtained 2238 stars, implying an expected number of stars for the GMOS FOV. It was also simulated an area centred on the N6411F coordinates, resulting in 3623 stars and considering the GMOS FOV. Then, the contamination is dominated by background galaxies instead of foreground stars.
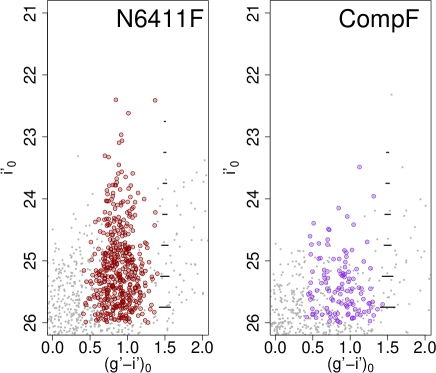
The colour magnitude diagrams (CMD) for point sources are shown in Figure 8, with those sources fulfilling the colour criteria highlighted. Horizontal bars indicate the mean uncertainties for GC candidates. Comparing both fields, the objects distribution outside the GCs colour range is similar, which give confidence to the point sources selection described in Section 2.2.
| Entire Sample | | ||||||
|---|---|---|---|---|---|---|
| Unimodal | ||||||
| Bimodal | ||||||
| | | ||||||
| Unimodal | ||||||
| Bimodal | ||||||
| | | ||||||
| Unimodal | ||||||
| Bimodal | ||||||
| | | ||||||
| Unimodal | ||||||
| Bimodal | ||||||
3.3 Colour distributions
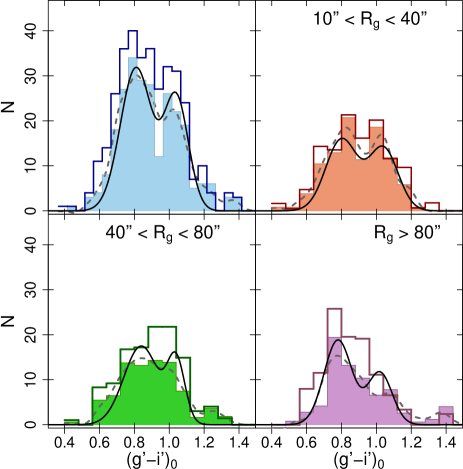
The filled histograms in Figure 9 show the background corrected colour distribution for all GC candidates brighter than mag (upper left panel), and split in three radial regimes (other panels). The bin width is for the full sample histogram and for each of the three subsample histograms. The dashed curves indicate smoothed distributions obtained with a Gaussian kernel for all GCs in each radial regime.
From visual inspection, bimodality is not so evident in the split samples. In order to determine whether the GCS colour distribution is better represented by two Gaussians instead of one, we used the Gaussian Mixture Method algorithm (gmm, Muratov & Gnedin 2010). For each sample we eliminated the GC candidates with colours close to those of point-sources in the CompF, up to the expected number of contaminants. We repeated this procedure 25 times, in order to obtain a set of samples free of contamination and we applied gmm to each one of them. When we considered all GC candidates brighter than mag, the gmm results differed significantly, presenting a large dispersion in the colour peaks. In a second iteration we chose mag as the magnitude limit, implying colour uncertainties below 0.05 mag. This latter selection shortened the samples size, but gmm results remained stable in the different runs.
In order to investigate whether the colour uncertainties triggered the gmm results, we simulated samples with 120 colours drawn from two Gaussians distributions, centred at mag and mag, with mag. We added to these error-free colours a noise component represented by a third Gaussian with mean 0.075 mag and dispersion mag. This latter function was obtained from the uncertainties analysis for GC candidates with . The results from applying gmm to 100 artificial samples presented a large scatter in the parameters. The peaks of the two Gaussians span mag and mag, respectively. The Gaussians dispersions span mag. and the fraction of red GCs varies from to . This justifies the exclusion of GC candidates fainter than mag from the gmm analysis.
This is also evident when we compare the colour distribution obtained when the faintest limit is chosen at mag, corresponding to the open histograms in Figure 9. In all cases the bimodality seems to be blurred by colour uncertainties.
The mean values obtained from gmm for the selection of GC candidates brighter than mag are listed in Table 3.
In all cases the kurtosis () is negative, pointing to a flattened (platykurtic) distribution. This is a necessary but not sufficient condition of bimodality. The parameter (related to the distances between the means of the Gaussians in terms of their dispersions) is above 2, the minimum value expected when the distribution is better described by the sum of two Gaussians. This is fulfilled even considering the uncertainties in the calculus. The fraction of red GCs () is , similar to other giant ellipticals in denser environments (Caso et al. 2017; Harris et al. 2015, and references therein). When is obtained from the integration of the Hubble profiles for both subpopulations, the result is , in agreement with the fraction derived from the colour distribution. Assuming its absolute magnitude is (see Section 3.5), the colour peaks are in agreement with those expected from literature compilations of early-type galaxies in the same photometric system (e.g. Faifer et al. 2011).
From the evolution of along the radial regime, red GCs seem to be slightly more concentrated towards the galaxy centre, with lower values of in the outer bins. The colour peaks and dispersions do not vary significantly with galactocentric distance.
3.4 Spatial and radial distributions
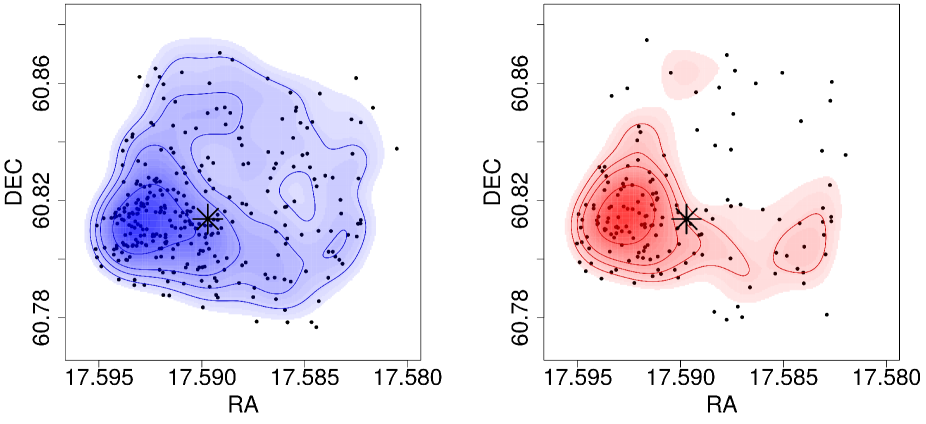
The projected spatial distribution for GC candidates is shown in Figure 10. The left panel corresponds to blue GCs and the right panel to red ones, assuming as the colour limit between them. Blue GC candidates seem to dominate. The asterisk indicates the projected position of the SNI 1999da.
The spatial distribution might deviate from azimuthal symmetry, but it is not possible to perform an analysis of the GCS azimuthal distribution due the presence of a saturated star arcmin to the West of NGC 6411. In order to go further with the implications of this uncertainty we fitted the projected radial distribution of the entire population of GCs using concentric circular rings and elliptical rings. These latter ones were defined assuming the PA and derived for the galaxy in Section 3.1.
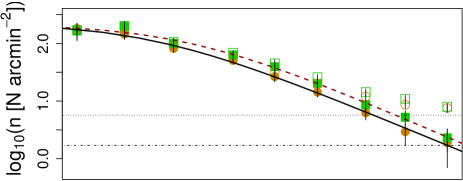
The upper panel of Figure 11 shows the radial distribution for GC candidates brighter than . Orange open (filled) circles correspond to the radial profile with circular rings once it was corrected by completeness (completeness and contamination), and green squares are analogues when elliptical rings are used. The horizontal dotted and dashed-dotted lines represent the background level and the of its value, respectively. This latter value has been used in past studies to define the GCS extension (e.g. Caso et al. 2015; Bassino & Caso 2017). In order to better describe the distribution flattening towards the centre of the galaxy, we fitted a modified Hubble profile (e.g. Binney & Tremaine 1987; Dirsch et al. 2003) of the form:
| (4) |
which behaves as a power-law with index when . The parameters obtained for circular and elliptical rings are indicated in Table 4 and correspond to solid and dashed curves, respectively.
| Case | |||
|---|---|---|---|
| Elliptical symmetry | |||
| Entire pop. | |||
| Circular symmetry | |||
| Entire pop. | |||
| Blue subpop. | |||
| Red subpop. | |||
The extension of the GCS is arcmin, i.e. kpc at the distance of NGC 6411 (see Section 3.5) for the circular case, and marginally larger, kpc, in the elliptical one. There were no significant differences in the fitted parameters, nor in the extension of the system for both geometrical schemes. Hence, for simplicity in the following we refer to the circular case for the radial profile.
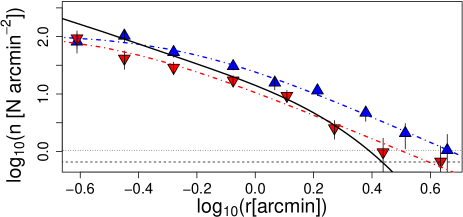
We also fitted the radial projected distributions split in subpopulations (lower panel in Figure 11). We assumed as the limiting colour, which is in agreement with colour distributions from Section 3.3. The distribution for blue GCs is represented with upwards triangles and downwards triangles were used for the red ones. Solid lines represent the fits of the modified Hubble profile, which are also listed in Table 4. The parameter is slightly larger for red GCs, but differences are within the uncertainties. Dotted and dashed lines represent the of the background for blue and red GCs, respectively, used to determine the extension for each subpopulation. In both cases it reaches similar galactocentric distances, but blue GCs present larger densities at all radii, which explains their more disperse distribution in Figure 10. Hence, the radial distribution for red GCs deviates from the usual finding in bright ellipticals, where they seem to be more concentrated towards the galaxy centre. The black solid curve represents the galaxy luminosity profile in filter, arbitrarily scaled for comparison purposes. Both GC subpopulations are more extended than the galaxy profile.
3.5 Luminosity function and GCs population
Figure 12 shows the GC luminosity function (GCLF) background and completeness corrected, over the entire field. We assumed Poisson uncertainties for the errorbars in both, science and background measurements. The binwidth is 0.2 mag. The short and long dashed histograms indicate the GCLFs for blue and red GCs, respectively, assuming as the colour limit. The grey vertical lines indicate the range excluded because of the declining completeness. The solid curve represents the Gaussian profile fitted to the GCLF, which resulted in a turn-over magnitude (TOM) and width of and , where the second uncertainty comes from the binwidth.
Old GC populations usually present a Gaussian GCLF, with a nearly universal TOM in the -band of (e.g. Richtler 2003; Jordán et al. 2007). From the unimodal distributions in Table 3, GC candidates brighter than present a mean colour . If we assume Equations 1 and 2 from Bassino & Caso (2017) in order to transform our magnitude, the TOM in the filter is . Hence, the distance modulus results , in agreement with measurements from SBF and the fundamental plane from Blakeslee et al. (2001), and , respectively, but slightly smaller than SNIa measurements (Tully et al. 2013), . Despite the larger noise when we subdivide the GCLF into subpopulations, the one corresponding to red GCs (dotted histogram in Fig. 12) might present a brighter TOM and a lower dispersion.
For magnitudes brighter than mag, there seems to be an excess of GC candidates in comparison with fainter ones. This issue will be addressed in the following Section.
From the set of parameters fitted to the GCLF we found that the fraction of GCs brighter than mag is . Due to the lack of areal coverage, we decided to integrate the radial profile instead of the GCLF to obtain the total population of GCs. Then, from the numerical integration of the modified Hubble profiles derived in Section 3.4 we obtained a population of GCs brighter than up to a galactocentric distance of 5 arcmin for circular symmetry, and GCs up to arcmin in the elliptical case. Then, the total population of GCs results and , respectively. Adopting the total magnitude from de Vaucouleurs et al. (1991), , the foreground extinction from Schlafly & Finkbeiner (2011) and the distance modulus previously derived, , the absolute magnitude of the galaxy results . Then, the specific frequency444The specific frequency or number of clusters per unit galaxy luminosity is defined as (Harris & van den Bergh 1981) , where the uncertainty is dominated by the propagation of the distance error.
3.6 An excess of bright GCs?
With a strict photometric -selection, we may miss slightly extended objects, whose effective radii are between bright GCs and ultra compact dwarfs (e.g. Norris et al. 2014; Bassino & Caso 2017). Hence, we decided to relax the limits in the three filters in order to analyse the presence of bright GCs. This significantly enlarges the sample of GC candidates brighter than mag, but results in a marginal variation for fainter GC candidates (). Despite of this, in the following a comparison between faint and bright GC candidates will be performed for this sample obtained with relaxed limits. Some objects with larger than typical values for artificial stars (see Figure 3) deviate from point sources although the visual inspection of their radial profiles does not show evidence of saturation and their counts are not in the CCD non-linearity range.
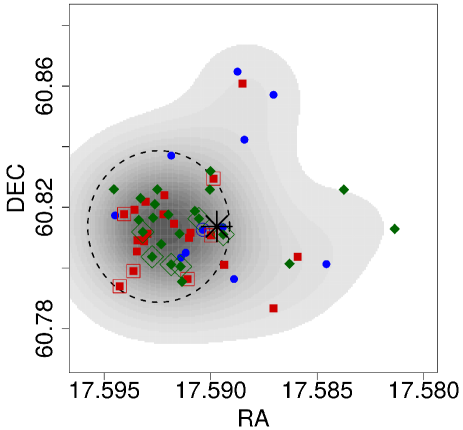
In Figure 13 is shown the projected spatial distribution for candidates brighter than mag and with typical colours of GCs (see Section 3.2). The plot presents the usual orientation, North is up, East to the left. The grey scale indicates the smooth projected density, and the symbols correspond to objects bluer than (blue circles), redder than (red squares), and presenting intermediate colours (green diamonds). The selection of these limits is based on the colour distribution shown in Figure 14.
The spatial distribution is densely concentrated towards the galaxy centre, with few objects at projected distances larger than 90 arcsec from the galaxy centre (dashed circle). The area contained by the dashed circle represents per cent of the FOV. As a comparison, the objects brighter than mag enclosed in this area correspond to per cent of the total, while the blue GC candidates fainter than mag achieve the per cent and the red CG candidates in the same magnitude range represent the per cent. From these results, a proportion test points to statistically different results with probabilities of and per cent, respectively. A Kolmogorov-Smirnov test (Kolmogorov 1933) indicates that the distributions differ with probabilities of per cent and per cent, respectively. Taking into account that we are dealing with small sample statistic, we might subdivide the objects brighter than mag into the three colour ranges previously indicated. The bluer group is poorly populated and its members are not so strongly concentrated towards the galaxy centre () in comparison with those presenting intermediate and red colours ().
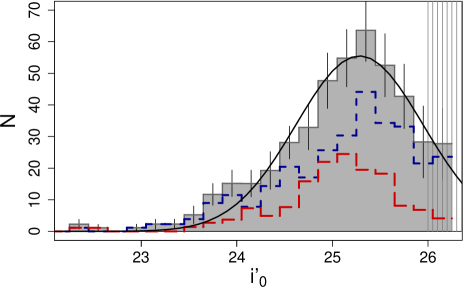
The bottom left panel in Figure 14 shows the CMD for those objects brighter than mag with galactocentric distances up to 90 arcsec. It presents a clear gap around mag, also evident in the luminosity function at the right panel. The objects above and below the gap fulfill similar colour ranges, with slightly different mean colours. Objects fainter than mag present a mean colour of mag, while the mean colour for the brighter ones is mag, with comparable dispersion in both cases ( and , respectively). Objects brighter than mag have a mean galactocentric distance of arcsec and all of them except one are located at distances from the galaxy centre larger than 30 arcsec (highlighted with framed symbols in Figure 13). On the other hand, the mean galactocentric distance for the fainter ones is arcsec and around one third are located at less than 30 arcsec from the galaxy centre.
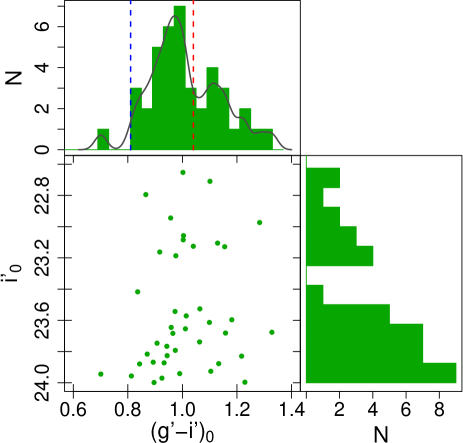
The upper panel shows the colour distribution for objects in the CMD with a bin size of 0.04 mag, and the smoothed distribution with solid lines. The dashed vertical lines indicate the mean colour for the GCs in the bimodal case from Table 3. A significant fraction of the sample presents intermediate colours, with a narrow distribution in mag. The comparison of this colour range with the expected colours from Bressan et al. (2012) SSP models, with a Chabrier (2001) lognormal IMF, points to younger SSPs or presenting a lower metal content than the results from González Delgado et al. (2015). For a SSP of Gyr the colour range corresponds to , while a metallicity of corresponds to SSPs from Gyr to Gyr.
Answering the question whether there is an excess of bright objects, we calculate the expected number of GCs for the corresponding magnitude range. From the set of parameters fitted to the GCLF in Section 3.5, the fraction of GCs brighter than mag is . From the numerical integration of the radial profile for circular symmetry derived in Section 3.4, the GC candidates at lower galactocentric distances than 90 arcsec represent the of the total population. Hence, the expected number of GCs brighter than mag up to that radial limit should be GCs. In order to consider possible changes in the GCLF due the relaxed limits in , we calculated again the completeness curves and the GCLF for candidates fainter than mag. The fitted TOM and width, and , did not vary from those calculated in Section 3.5 when uncertainties are considered. In this case, the expected number of GCs brighter than mag up to galactocentric distances of 90 arcsec was GCs. In both cases the expected number were significantly lower than the 41 objects found in the photometry. In a different approach, we generated 1000 random samples of GC candidates from a Gaussian profile with the parameters previously fitted to the GCLF. In only of the cases were obtained more than 20 objects brighter than mag, without samples with 40 objects brighter than mag. If we consider the variation of the Gaussian parameters according to their uncertainties, in just of the cases the probability of obtaining 40 objects brighter than mag was larger than .
Hence, this analysis supports the existence of an excess of bright GC candidates, in comparison with the expected numbers obtained from the GCLF of the fainter ones.
4 Discussion
Unlike other findings for many iEs (e.g. Tal et al. 2009), NGC 6411 lacks photometric evidence for a recent merger event like tidal features or striking changes in the surface profile parameters. Its surface brightness distribution is well represented by undisturbed ellipses (), unlike the usual scenario in recent merger remnants (e.g. Bassino & Caso 2017). From integration to infinity of the and galaxy luminosity profiles, we obtained and, if we just consider the inner 30 arcsec, . These colours are in agreement with those expected from the population derived by (González Delgado et al. 2015), whose age and metallicity correspond to according to the SSP models from CMD 3.0 (Bressan et al. 2012) and the MILES555http://miles.iac.es/pages/ssp-models.php stellar population models (Vazdekis et al. 2010).
Considering the population parameters derived by González Delgado et al. (2015), Vazdekis et al. (2010) population models lead to , which implies for NGC 6411 a stellar mass of . According to the colour profile, the stellar component is expected to be dominated by a population somewhat older, and the stellar mass should range from this value to few times .
This galaxy also presents a supernova, SN199da, classified by Filippenko (1999) as subluminous SNIa. This SNe subtype might be associated with early-type hosts and old stellar populations (Howell 2001). Moreover, Gallagher et al. (2008) indicate a correlation with the host galaxy age and metallicity, where galaxies with higher iron abundance host less luminous SNe, while SN in galaxies with a characteristic age greater than Gyr are mag fainter at their maximum, a lower limit that matches with the age derived by Sánchez-Blázquez et al. (2006) for NGC 6411.
Its GCS is poorly populated in comparison with Es of similar luminosity in groups/clusters (e.g Harris et al. 2013; Caso et al. 2017), in agreement with other ellipticals in low density environments (e.g. Caso et al. 2013a; Salinas et al. 2015; Bassino & Caso 2017). The for iEs with similar luminosity than NGC 6411 typically ranges from 1 to 1.5 (Foster et al. 2011; Salinas et al. 2015), while cluster and group Es span up to larger values of (Forbes et al. 1998; Peng et al. 2008; Harris et al. 2013, and references there in). The fraction of metal-rich GCs in NGC 6411 represents of the population, typical of bright Es (Harris et al. 2015), even in low density environments (Salinas et al. 2015).
The extreme environmental conditions needed in the build-up of GCs point to the relevance of galaxy mergers in their formation and survival in the early stages (Kruijssen 2014, 2015). This implies a direct connection between a GCS and the evolutionary history of its host galaxy. The current paradigm for GC formation states that the metal-poor GCs in early-type galaxies formed in major star-formation episodes during the merger of the first proto-galaxies, or were accreted from satellite galaxies. On the other hand, the origin of the metal-rich GCs occurred in later stages of the galaxy evolution, during a few massive mergers, involving more evolved galaxies (Muratov & Gnedin 2010; Tonini 2013; Li & Gnedin 2014). In this sense, Peng et al. (2006) found that the colour range spanned by a GCS correlates with the galaxy stellar mass.
The mean colours corresponding to GC subpopulations also seem to correlate with galaxy stellar mass, particularly the red ones (e.g. Strader et al. 2004; Faifer et al. 2011). According with the correlation of the mean colours of GC populations with their host galaxy luminosity from Faifer et al. (2011), the expected values for the blue and red GC populations in NGC 6411 are and , respectively. These only differ few hundredths from the colour peaks obtained in Section 3.3, pointing that the majority of the GCs candidates fainter than mag fit to typical colours for old GCs. Despite of this, the distance between the peak colours for blue and red GCs in NGC 6411 is slightly smaller, corresponding to fainter galaxies.
The TOM of the GCLF is in agreement with SBF measurements (Blakeslee et al. 2001), which also points to an old GCS. The width of the GCLF also corresponds to a galaxy with lower stellar mass, according to the relations derived by Harris et al. (2014). This is in agreement with the assumption that NGC 6411 has suffered an intermediate age merger, with a corresponding stellar population contributing to its luminosity. The small dispersion in the GCLF might also provide clues about the evolutionary history of NGC 6411, pointing to minor mergers as main contributors to the GCS, particularly to the metal-poor subpopulation. In addition, wet mergers, would have supplied gas to form the metal-rich GCs. If we assume a power-law as the initial mass function of GCs (e.g. Brockamp et al. 2014), the amount of gas available as a consequence of minor mergers might result in marginal probabilities of forming massive GCs. Moreover, the low-density environment spread the occurrence of subsequent mergers, hence reduces the efficacy of mergers to redistribute young GCs and facilitate their survival (Kruijssen 2015). The disruption affects more severely low-mass GCs, turning the power-law IMF into a bell shaped distribution (Rossi et al. 2016). Hence, the absence of successive mergers might lead to a larger fraction of disruption for the low-mass GCs, which translates in a lower dispersion of the GCLF. At the high-mass end, GCs might result from the merger of star clusters complex like those observed in some merger remnants (e.g. Whitmore et al. 1999; Fellhauer & Kroupa 2005), but it is not well established how efficient is this process to form bright GCs.
We can also compare the GCS extension with the properties of the host galaxy applying the relations from Kartha et al. (2014) for early-type galaxies. A GCS with a projected extension of kpc, corresponds to a galaxy with a kpc (equation 11) and a stellar mass of (equation 10). From the surface brightness profiles in the three filters we obtained kpc, which is in agreement with the expected value. Regarding its stellar mass, as we previously indicated in Section 3.5 the uncertain ages and metallicities for the galaxy population result in a wide range of stellar masses. However, the assumption that the stellar mass is dominated by an older and less metal-rich population than that proposed by González Delgado et al. (2015) for the inner region seems plausible according with the galaxy overall characteristics. Other issue to comment is the marginal difference in the slopes of radial distributions in blue and red GCs. Observational studies of rich GCSs in bright ellipticals show a metal-rich subpopulation more concentrated towards the galaxy, while the metal-poor one presents a flattened distribution (e.g. Dirsch et al. 2005; Bassino et al. 2006; Foster et al. 2011). This behaviour is also reproduced in numerical models (e.g. Amorisco 2018). Results might differ for non-standard ellipticals and lenticulars with evidence of multiple populations (e.g. Caso et al. 2013b; Caso et al. 2015; Sesto et al. 2016). These galaxies presented evidence of intermediate age populations due to late mergers, wich might have reconfigured the distribution of typical GC subpopulations. However, we notice that this characteristic is not common in all the merger remnants (e.g. Bassino & Caso 2017), and further analysis should be carried on.
The bright GC candidates present in NGC 6411 point to a late merger, in agreement with results from González Delgado et al. (2015) and Sánchez-Blázquez et al. (2006). As previously indicated, the intermediate colours are fulfilled by a wide range of SSPs, but do not simultaneously match with the ages and metallicities proposed by González Delgado et al. (2015). The metal content would imply a young population, Gyr. The age of Gyr corresponds to greater metallicities than the usual values for old metal-rich GCs, denoting an enrichment of the gas, but lower than expected for bright ellipticals. This is in agreement with the bluer colour of NGC 6411 in comparison with ellipticals with similar stellar mass (Lacerna et al. 2016). Regarding the absolute magnitudes of these bright GCs, assuming the distance modulus derived in Section 3.5, they span from to mag. Despite these objects are fainter than UCDs in other elliptical galaxies, they fulfil the luminosity range of UCDs in Brodie et al. (2011), which were selected from their effective radii instead of luminosity criteria. If we use equations 1 and 2 from Bassino & Caso (2017) to estimate magnitudes, the resulting absolute magnitudes range from to mag, fainter than Cen (Harris 1996, 2010 Edition). This difference could be larger when intermediate ages are assumed for bright GCs in NGC 6411, as can be realized from the CMD 3.0 SSP models. For instance, a population of 3.5 Gyr and presents mag and mag, getting mag fainter when aged to 10 Gyr. For a lower metallicity, , an age around Gyr results in mag, fading mag when aged to 10 Gyr. Hence, they would be brighter than the TOM magnitude for old GCs, but their luminosities would not achieve those of typical UCDs. A wet merger at intermediate-age might be responsible for the existence of the bright GCs candidates. However, this event should have occured in earlier stages than the age derived by González Delgado et al. (2015) for the stellar population in the inner region of NGC 6411, driving the starburst that formed the brightest objects.
5 Summary
On the basis of , and photometry obtained with GEMINI GMOS-N, we carried out a study of NGC 6411 and its GCS down to the turn-over magnitude. We summarize our conclusions in the following.
-
•
The galaxy does not present striking evidence of merger events, no tidal structures were found after subtracting a smoothed surface brightness component, neither in the galaxy colour map. There is no sign of boxy isophotes according to the parameter.
-
•
Despite not examining the full spatial extent of the GCS, our observations do allow us to determine the projected density radial profile, and the GCS size. Results are in agreement with literature compilations for galaxies with similar luminosity. The total population is estimated to be GCs. The points to a poor GCS, as usually found in low density environments.
-
•
The fraction of red GCs does not differ from those found in brighter ellipticals with larger GCS, but the difference between the colour peaks and the dispersion of the GCLF are slightly lower. We interpret this as evidence of the relevance of minor mergers in the build up of the galaxy.
-
•
The TOM of the GCLF is in agreement with SBF studies. The colour distribution resembles those found in typical bright Es. These findings characterise an old GCS, which is in agreement with the absence of recent merger evidence.
-
•
We detect an excess of bright GCs, strongly concentrated towards the galaxy. Their colours are mainly intermediate between the peaks for the blue and red population. Their colours are slightly bluer than the galaxy in the inner region, we interpret that their origin might be related to a past merger. Their colours do not agree with ages derived by the spectroscopic studies of the diffuse light of the galaxy, pointing to an older event.
Acknowledgments
This research was funded with grants from Consejo Nacional de Investigaciones Científicas y Técnicas de la República Argentina (PIP 112-201101-00393), Agencia Nacional de Promoción Científica y Tecnológica (PICT-2013-0317), and Universidad Nacional de La Plata (UNLP 11-G150), Argentina. TR acknowledges support from CONICYT project Basal AFB-170002.
References
- Amorisco (2018) Amorisco N. C., 2018, preprint, (arXiv:1802.00812)
- Bamford et al. (2009) Bamford S. P., et al., 2009, MNRAS, 393, 1324
- Bassino & Caso (2017) Bassino L. P., Caso J. P., 2017, MNRAS, 466, 4259
- Bassino et al. (2006) Bassino L. P., Faifer F. R., Forte J. C., Dirsch B., Richtler T., Geisler D., Schuberth Y., 2006, A&A, 451, 789
- Bertin & Arnouts (1996) Bertin E., Arnouts S., 1996, A&AS, 117, 393
- Binney & Tremaine (1987) Binney J., Tremaine S., 1987, Galactic dynamics
- Blakeslee et al. (2001) Blakeslee J. P., Lucey J. R., Barris B. J., Hudson M. J., Tonry J. L., 2001, MNRAS, 327, 1004
- Bressan et al. (2012) Bressan A., Marigo P., Girardi L., Salasnich B., Dal Cero C., Rubele S., Nanni A., 2012, MNRAS, 427, 127
- Brockamp et al. (2014) Brockamp M., Küpper A. H. W., Thies I., Baumgardt H., Kroupa P., 2014, MNRAS, 441, 150
- Brodie et al. (2011) Brodie J. P., Romanowsky A. J., Strader J., Forbes D. A., 2011, AJ, 142, 199
- Brüns & Kroupa (2012) Brüns R. C., Kroupa P., 2012, A&A, 547, A65
- Caso et al. (2013a) Caso J. P., Bassino L. P., Richtler T., Smith Castelli A. V., Faifer F. R., 2013a, MNRAS, 430, 1088
- Caso et al. (2013b) Caso J. P., Richtler T., Bassino L. P., Salinas R., Lane R. R., Romanowsky A., 2013b, A&A, 555, A56
- Caso et al. (2015) Caso J. P., Bassino L. P., Gómez M., 2015, MNRAS, 453, 4421
- Caso et al. (2017) Caso J. P., Bassino L. P., Gómez M., 2017, MNRAS, 470, 3227
- Chabrier (2001) Chabrier G., 2001, ApJ, 554, 1274
- Ciotti (1991) Ciotti L., 1991, A&A, 249, 99
- Dirsch et al. (2003) Dirsch B., Richtler T., Bassino L. P., 2003, A&A, 408, 929
- Dirsch et al. (2005) Dirsch B., Schuberth Y., Richtler T., 2005, A&A, 433, 43
- Dressler (1980) Dressler A., 1980, ApJ, 236, 351
- Escudero et al. (2015) Escudero C. G., Faifer F. R., Bassino L. P., Calderón J. P., Caso J. P., 2015, MNRAS, 0, 0
- Faifer et al. (2011) Faifer F. R., et al., 2011, MNRAS, 416, 155
- Fellhauer & Kroupa (2005) Fellhauer M., Kroupa P., 2005, MNRAS, 359, 223
- Filippenko (1999) Filippenko A. V., 1999, IAU Circ, 7219
- Forbes et al. (1998) Forbes D. A., Grillmair C. J., Williger G. M., Elson R. A. W., Brodie J. P., 1998, MNRAS, 293, 325
- Foster et al. (2011) Foster C., et al., 2011, MNRAS, 415, 3393
- Gallagher et al. (2008) Gallagher J. S., Garnavich P. M., Caldwell N., Kirshner R. P., Jha S. W., Li W., Ganeshalingam M., Filippenko A. V., 2008, ApJ, 685, 752
- González Delgado et al. (2015) González Delgado R. M., et al., 2015, A&A, 581, A103
- Harris (1996) Harris W. E., 1996, AJ, 112, 1487
- Harris & van den Bergh (1981) Harris W. E., van den Bergh S., 1981, AJ, 86, 1627
- Harris et al. (2009) Harris W. E., Kavelaars J. J., Hanes D. A., Pritchet C. J., Baum W. A., 2009, AJ, 137, 3314
- Harris et al. (2013) Harris W. E., Harris G. L. H., Alessi M., 2013, ApJ, 772, 82
- Harris et al. (2014) Harris W. E., et al., 2014, ApJ, 797, 128
- Harris et al. (2015) Harris W. E., Harris G. L., Hudson M. J., 2015, The Astrophysical Journal, 806, 36
- Hernández-Toledo et al. (2008) Hernández-Toledo H. M., Vázquez-Mata J. A., Martínez-Vázquez L. A., Avila Reese V., Méndez-Hernández H., Ortega-Esbrí S., Núñez J. P. M., 2008, AJ, 136, 2115
- Hirschmann et al. (2013) Hirschmann M., De Lucia G., Iovino A., Cucciati O., 2013, MNRAS, 433, 1479
- Howell (2001) Howell D. A., 2001, ApJL, 554, L193
- Jiménez et al. (2011) Jiménez N., Cora S. A., Bassino L. P., Tecce T. E., Smith Castelli A. V., 2011, MNRAS, 417, 785
- Jordán et al. (2007) Jordán A., et al., 2007, ApJs, 171, 101
- Kartha et al. (2014) Kartha S. S., Forbes D. A., Spitler L. R., Romanowsky A. J., Arnold J. A., Brodie J. P., 2014, MNRAS, 437, 273
- Kolmogorov (1933) Kolmogorov A., 1933, Giornale dell’Istituto Italiano degli Attuari, 4, 83
- Kruijssen (2014) Kruijssen J. M. D., 2014, Classical and Quantum Gravity, 31, 244006
- Kruijssen (2015) Kruijssen J. M. D., 2015, MNRAS, 454, 1658
- Lacerna et al. (2016) Lacerna I., Hernández-Toledo H. M., Avila-Reese V., Abonza-Sane J., del Olmo A., 2016, A&A, 588, A79
- Lane et al. (2013) Lane R. R., Salinas R., Richtler T., 2013, A&A, 549, A148
- Li & Gnedin (2014) Li H., Gnedin O. Y., 2014, ApJ, 796, 10
- Marcum et al. (2004) Marcum P. M., Aars C. E., Fanelli M. N., 2004, AJ, 127, 3213
- Méndez et al. (2009) Méndez R. H., Teodorescu A. M., Kudritzki R.-P., Burkert A., 2009, ApJ, 691, 228
- Muratov & Gnedin (2010) Muratov A. L., Gnedin O. Y., 2010, ApJ, 718, 1266
- Niemi et al. (2010) Niemi S.-M., Heinämäki P., Nurmi P., Saar E., 2010, MNRAS, 405, 477
- Norris et al. (2014) Norris M. A., et al., 2014, MNRAS, 443, 1151
- Peng et al. (2006) Peng E. W., et al., 2006, ApJ, 639, 95
- Peng et al. (2008) Peng E. W., et al., 2008, ApJ, 681, 197
- Richtler (2003) Richtler T., 2003, in Alloin D., Gieren W., eds, Lecture Notes in Physics, Berlin Springer Verlag Vol. 635, Stellar Candles for the Extragalactic Distance Scale. pp 281–305 (arXiv:astro-ph/0304318), doi:10.1007/978-3-540-39882-0_15
- Richtler (2013) Richtler T., 2013, in Pugliese G., de Koter A., Wijburg M., eds, Astronomical Society of the Pacific Conference Series Vol. 470, 370 Years of Astronomy in Utrecht. p. 327 (arXiv:1210.0045)
- Richtler et al. (2012) Richtler T., Bassino L. P., Dirsch B., Kumar B., 2012, A&A, 543, A131
- Richtler et al. (2014) Richtler T., Hilker M., Kumar B., Bassino L. P., Gómez M., Dirsch B., 2014, A&A, 569, A41
- Richtler et al. (2015) Richtler T., Salinas R., Lane R. R., Hilker M., Schirmer M., 2015, A&A, 574, A21
- Robin et al. (2003) Robin A. C., Reylé C., Derrière S., Picaud S., 2003, A&A, 409, 523
- Rossi et al. (2016) Rossi L. J., Bekki K., Hurley J. R., 2016, MNRAS, 462, 2861
- Salinas et al. (2012) Salinas R., Richtler T., Bassino L. P., Romanowsky A. J., Schuberth Y., 2012, A&A, 538, A87
- Salinas et al. (2015) Salinas R., Alabi A., Richtler T., Lane R. R., 2015, A&A, 577, A59
- Sánchez-Blázquez et al. (2006) Sánchez-Blázquez P., et al., 2006, MNRAS, 371, 703
- Schawinski et al. (2014) Schawinski K., et al., 2014, MNRAS, 440, 889
- Schlafly & Finkbeiner (2011) Schlafly E. F., Finkbeiner D. P., 2011, ApJ, 737, 103
- Sersic (1968) Sersic J. L., 1968, Atlas de galaxias australes
- Sesto et al. (2016) Sesto L. A., Faifer F. R., Forte J. C., 2016, MNRAS, 461, 4260
- Smith & et al. (2002) Smith J. A., et al. 2002, AJ, 123, 2121
- Spitler et al. (2008) Spitler L. R., Forbes D. A., Strader J., Brodie J. P., Gallagher J. S., 2008, MNRAS, 385, 361
- Stetson (1987) Stetson P. B., 1987, PASP, 99, 191
- Strader et al. (2004) Strader J., Brodie J. P., Forbes D. A., 2004, AJ, 127, 3431
- Tal et al. (2009) Tal T., van Dokkum P. G., Nelan J., Bezanson R., 2009, AJ, 138, 1417
- Tonini (2013) Tonini C., 2013, ApJ, 762, 39
- Tully et al. (2013) Tully R. B., et al., 2013, AJ, 146, 86
- Vazdekis et al. (2010) Vazdekis A., Sánchez-Blázquez P., Falcón-Barroso J., Cenarro A. J., Beasley M. A., Cardiel N., Gorgas J., Peletier R. F., 2010, MNRAS, 404, 1639
- Whitmore et al. (1999) Whitmore B. C., Zhang Q., Leitherer C., Fall S. M., Schweizer F., Miller B. W., 1999, AJ, 118, 1551
- de Vaucouleurs et al. (1991) de Vaucouleurs G., de Vaucouleurs A., Corwin Jr. H. G., Buta R. J., Paturel G., Fouqué P., 1991, Third Reference Catalogue of Bright Galaxies. Volume I: Explanations and references. Volume II: Data for galaxies between 0h and 12h. Volume III: Data for galaxies between 12h and 24h.
- van Dokkum et al. (2010) van Dokkum P. G., et al., 2010, ApJ, 709, 1018