Laser-induced ablation of metal in liquid
Abstract
Laser ablation in liquid (LAL) is important perspective way to compose nanoparticles (NP) necessary for modern technologies. LAL is not fully understood. Deep understanding is necessary to optimize processes and decrease high price of the LAL NPs. Today there are two groups of studies: in one of them scientists go from analyzing of bubble dynamics (thus they proceed from the late stages), while in another one scientists investigate early stages of ablation. In the present paper we consider the process as whole: from ablation and up to formation of a bubble and its inflation. Thus we cover extremely wide range of spatiotemporal scales. We consider role of absorbed energy and duration of pulse (femtosecond, multi-picosecond, nanosecond). Importance of supercritical states is emphasized. Diffusive atomic and hydrodynamic mixing due to Rayleigh-Taylor instability and their mutual interdependence are described.
Liquid near contact with metal is heated by dissipation in strong shock and due to small but finite heat conduction in liquid; metal absorbing laser energy is hot and thus it serves as a heater for liquid. Spatial expansion and cooling of atomically mixed liquid and metal causes condensation of metal into NPs when pressure drops below critical pressure for metal. Development of bubble takes place during the next stages of decrease of pressure below critical parameters for liquid and below ambient pressure in liquid. Thin hot layer of liquid near contact expands in volume to many orders of magnitude filling the inflating bubble.
Keywords: laser ablation in liquid, overcritical states, water adiabatic curves
1 Introduction
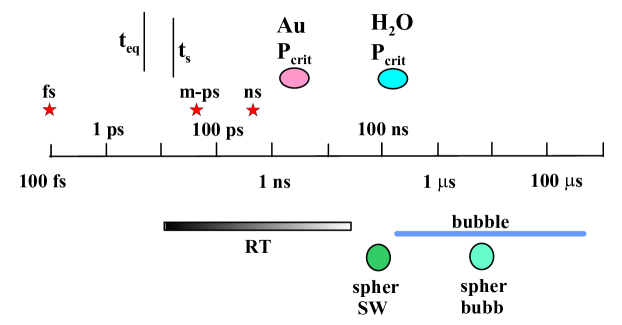
There are two competing approaches to production of nanoparticles (NP, NPs). They are chemical and laser approaches [2, 3]. NPs are used in many important scientific and industrial applications [2, 3]. Chemical production is cheap but laser fabrication is more simple, clean, and more green in an ecological sense [2, 3]. Therefore studies directed to understand and on this base to optimize and to do cheaper production of NPs by laser ablation in liquid (LAL) are valuable. But today in spite of significant efforts many aspects of LAL remains unclear. This is because it is difficult to describe theoretically different and closely related physical processes proceeding at a wide logarithmical temporal range, see Fig. 1. Also early stages, before formation of a bubble, remains experimentally unexplored; but see paper [4] where attempt has been made to follow state of an irradiated surface during laser action. In [4] (in their inset in Fig. 9(a)) authors see decrease of reflection from the gold surface in water during a nanosecond laser pulse.
Short lasting laser action strongly changes thermal and mechanical state of a system consisting from an absorbing target and transparent liquid or solid media surrounding a target; below we consider gold target contacting with water or glass. Absorption of light and heating of gold through transparent media is concentrated in an extremely thin surface disk; therefore a small amount of NPs is produced by a single shot. Radius of the disk is defined by radius of a laser beam (usually mm), while its thickness equals to thickness of a heat affected zone and is a fraction of micron. Further, after finishing absorption, a long multi-step process of relaxation follows. Positive and negative momentum is carried away from the surface layer by non-linear acoustic waves (shocks in water and in gold). While the heat affected zone evolves separately (from the shocks) with velocities which are small relative to speed of sound.
Today detailed data concerning late stages beginning from s are collected [2, 3, 5]. These data includes experimental measurements of a trajectory and theoretical calculations based on Rayleigh-Plesset equation (RPe) [5] used in the paper [5] to define current internal pressure inside a bubble from supposing that ambient pressure in RPe equals to the pressure inside a container with liquid before laser action; here is a bubble radius. We see from Fig. 1 that these data refer to the late stages of relaxation of a system after laser impact. This is the main direction of the LAL research for today.
At the opposite direction of studies of LAL the authors starts namely from ablation in liquid [4, 6, 7, 8, 9, 10, 1], that is from the beginning of the chain of processes shown in Fig. 1. This is rather new direction of the LAL oriented researches. The listed papers describe initial ablation theoretically and by computer simulations. The paper [4] is exception. In this paper the theory is supported with valuable experiments related to the early stage. Authors of [4] measure reflectivity during a nanosecond laser pulse. A temporal range covering a few nanoseconds have been studied in these works. In paper [1] simulations have been extended up to submicrosecond stage (up to 0.2 s). At the subs stage the contact pressure decreases down to critical pressure for water bars, see Fig. 1.
We consider systems made from the pairs gold-water (Au-wt) and gold-silica (Au-gl, glass). Critical parameters are: K, g/cm bar for gold [11, 12, 13, 14, 15] (see also Fig. 4 in [1] where saturation pressure of gold is plotted) and K, g/cm bar for water. The signs (marking achievement of critical parameters) at the logarithmic axis of time in Fig. 1 corresponds to simulations presented in [1] where duration of a laser pulse was ps. In the present paper we use data from [1] together with new information obtained in described below simulations corresponding to durations 50 ps and 0.5 ns. These durations are marked by the red stars in Fig. 1.
In the paper [1] the authors at subs stage drop down in their calculations to critical pressure of water in the near contact boundary (CB) layer. This means that the system is close to the stage of formation of a bubble. In the present paper we construct one-phase (gaseous) and two-phase (liquid-vapor) adiabatic curves of water. These adiabatic curves start from a Hugoniot adiabatic curve in water or from a heated states of water. We use this approach to consider not only formation of a bubble but to analyze late stages of bubble expansion. At late stages the volume of gaseous water filling a bubble increases many orders of magnitude relative to initial volume of a heated contact water layer. Thus we make a bridge between the early (ablation) stages and the late (oscillations of a bubble) stages. This is the bridge connecting two directions of studies of LAL.
2 History of heating of an absorber during a laser pulse
There is an expressed ridge dividing ablation regimes to short/fast ones and to long/slow (subsonic) ones according to duration of a pulse. This ridge is defined by competition between acoustic phenomena and heating (rate and duration of heating). The ridge position at the time axis shown in Fig. 1 is Here is speed of sound in an absorber. Of course, the speed changes during heating. For estimates people usually takes a value corresponding to a solid condensed state at room temperature before a laser action; e.g., for gold km/s. For thickness it is reasonable to take thickness of a heat affected zone (HAZ) achieved to the instant
There is a subregime in the short/fast regimes. It is connected to an ultrashort laser pulses (UsLP) when duration becomes shorter than equilibration time mentioned in Fig. 1. Often the corresponding pulses are called femtosecond (fs pulses). This name in reality means that the pulse is shorter than picosecond, e.g., 40, 100, or 300 fs. Fs pulses are related to the separate class of regimes because their durations are shorter than duration of the two-temperature (2T) stage; at this stage electrons absorbing laser energy are much hotter than ions Special physics is related to the 2T stage. Main features of this physics were revealed in the pioneer paper [16]. Importance of electron-ion coupling characterized by the value in condensed media becomes clear with this paper. Another significant thing is: strong enhancement of electron heat conduction during a 2T stage [17, 18] because semi-degenerate electrons with rather small heat capacity are partially decoupled from a classical ion subsystem with large heat capacity [19], thus electron thermal diffusion coefficient is enlarged 10-100 times [17, 18, 20] above its usual value cms corresponding to the one-temperature (1T) conditions; degree and duration of decoupling between ion and electron subsystems are defined by the value - larger than shorter is equilibration time defining when the electron-ion temperature relaxation will finishes.
Electron thermal conduction wave is unusual at the 2T stage. This wave carries out from a skin-layer the thermal energy accumulated in electrons [21]; the wave is expanding with supersonic speed [22]. Supersonic expansion of the thermal wave continues during a 2T stage [17, 18, 20]; therefore in the case of UsLP (that is when the equilibration time serves as effective duration of a pulse. The thermal wave is fast thanks to high values of the electron thermal diffusion coefficient Supersonic expansion of heat means that during its existence the spatial expansion of matter is delayed (relative to propagation of heat), that is density remains approximately equal to its values before the laser action (isochoric regime); except the thin layer near the contact boundary (CB). Thus in the case of a UsLP a HAZ is mainly created during a 2T stage:
These estimates emphasize difference between 1T and enhanced diffusions and emphasize the role of the prolonged 2T relaxation (large values of For gold the last values (in the above line for of (enhanced electron diffusion) and (extremely delayed relaxation thanks to a heavy ion) are typical [17, 18, 21, 23]. Position of the mark in Fig. 1 corresponds to the case of gold. We say -extremely delayed- in the meaning of comparison of gold (Au) with poorly conducting metals like Ni, Pt, or Ta were diffusion is weaker while an electron-ion coupling is stronger [24]. We say that the supersonic thermal wave is unusual because we have got into the habit that conductive propagation of heat is very subsonic.
Above we have underlined the peculiarities of UsLPs linked to the 2T states. But the main designation of the Section is to separate on a physical ground the short/fast laser actions against the long/slow (subsonic) actions The actions is called also the stress confinement actions while the case is called the heat confinement regimes [25]. There are simple meanings of these terms. If then during the fast energy absorption the matter remains approximately motionless (isochoric absorption) then the largest pressure to absorbed energy ratios at the end of a pulse are achieved. Then the stress confinement during the time interval shorter than takes place; the pressure bump created by UsLP in a HAZ cannot unload faster.
After that time interval the acoustic decay of the stress confinement proceeds. The HAZ irradiates acoustic perturbations in the directions outside from the HAZ during this decay while the heated layer (the HAZ) remains attached to the material particles where absorption (skin) and conductive expansion of heat occurred. In the next Section we will consider separation of acoustic and entropy modes and their existence long after the separation that is at the stages While here the acoustic near-field region is discussed. There are acoustic and entropy-vortical modes in hydrodynamics. In one-dimensional (1D) case vortex is impossible therefore acoustic and entropy modes are present in adiabatic (without thermal conductivity) hydrodynamics. Acoustic modes propagates with sound speed relative to material particles while the entropy is motionless (it is attached to) relative to these particles. If we include thermal conduction then the entropy mode will spread (entropy will spread) relative to the material particles.
In the long/slow regime the pressures are relatively low; the ratio is significantly less than Separation in time to the near-field temporal region and to the far-field temporal region loses its sense in the case In the case we have a short laser pump and after that the acoustic decay of the HAZ created by the pump. While if then the heated region (skin and conduction layer) continuously irradiates outside the weak acoustic signals during duration of a long pulse. The irradiation finishes together with a laser pulse. After that the irradiated two trains of acoustic waves propagate to the gold side and to the water side.
In both and cases effectively motion is a result of thermal expansion of matter. The shift of a contact boundary (CB) is proportional to a coefficient of thermal expansion increase of temperature and length of a HAZ: where is a value of the thermal expansion coefficient at room temperature, and are initial density and density after thermal expansion. Density is twice and more times less than in the considered here conditions. Thus typically the shift is a fraction of one micron because is one or few hundreds of nanometers.
Resuming the last two paragraphs we can say that the shocks sent by the short/fast actions have the shorter shock affected layer behind the shock (thickness and have larger amplitude relative to the long/slow actions While the evolutions of the near CB hot layers after finishing of a pulse differ less; these layers are called also the layers connected to the entropy or advection mode. Of course, it is known about breaking of compression waves and the late time fate of the shocks with decrease of their amplitude and widening of compressed layer behind due to non-linear acoustic effects [26, 27, 28]; in the case dispersion of speed of sound (speed depends on pressure at the characteristics) slowly increases thickness of the shocked layer behind a shock above the initial thickness Also elastic-plastic transition [26, 27, 28, 29, 30, 31, 32, 33, 34], solid-solid phase transitions [35, 36], and effects of melting [37] are significant for the profile of the shock running inside a solid target.
Below we will compare the full hydrodynamic simulation (including conductivities of gold and water) and simulation that exclude motion, thus this is the simulation without hydrodynamics. In the simulations without hydrodynamics only the thermal problem of absorption of a laser pulse and conductive spreading of heat is solved. Sometimes authors limit themselves with this motionless approach saying that motion is very slow and therefore insignificant in the case of a long pulse. Hence they neglect variations of density. But as was said before, the thermal expansion leads to strong decrease of density in the both cases (fast and slow) if absorbed energy is large enough. In the slow case these changes develop slowly but at the end of a pulse they are of the same order as in the case of a fast action.

To better understand and emphasize importance of pulse duration we perform simulations relating to the edges of the fast-slow range of durations and to the middle of this range. For gold the is nm for fast and slow regimes. Then the acoustic scale shown in Fig. 1 is ps. The ratios are 0.002, 1, and 10 for the fast, intermediate, and slow regimes of laser action presented in Fig. 1 by the three red stars; is 0.1, 50, and 500 ps for these stars. The set of simulations covering the fast/slow range is described in Table 1. They are done by 2T-HD, 1T-HD, 1T-without HD, and MD codes; here HD and MD stand for hydrodynamics and molecular dynamics; ”without HD” means that only thermal equation is solved in the conditions of the isochoric heat absorption and transfer.
Table 1. Eight runs with different durations of a heating pulse. Here pairs Au-water or Au-glass are presented. Length of simulation in time is given in the column
| # | ps | mJ/cm | medium | ns | code |
| 0 [1] | 0.1 | 400 | water | 200 | 2T-HD |
| I | 50 | 338 | glass | 0.5 | 1T-HD |
| II | 50 | 559 | glass | 0.5 | 1T-HD |
| III | 50 | 897 | glass | 0.5 | 1T-HD |
| IV | 50 | 400 | water | 1 | 1T-HD |
| V | 500 | 900 | water | 1 | 1T-HD |
| VI | 500 | 900 | water | 10 | 1T-without HD |
| VII [1] | 1 | 700 | water | 1 | MD |
| VIII, wide | 1 | 2500 | water | 2 | MD |
| IX, narrow | 1 | 2500 | water | 10 | MD |
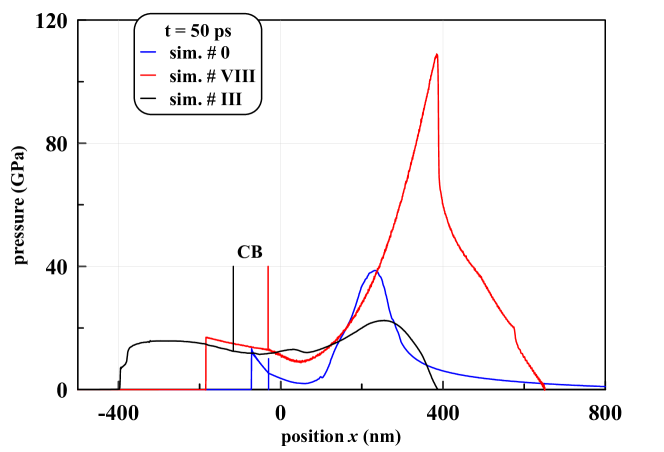
Figures 2 and 3 present situation when mixed inside the HAZ the acoustic and entropy modes begin to decouple as Simulations #0 and VIII correspond to UsLP. But absorbed energy in case #VIII is approximately five times larger than in the case #0. Thicknesses of the gold films are 1700 nm (#0), 550 nm (#VIII), and 370 nm (#III).
In the case of the UsLP and a thick (bulk) gold target there is a rather strong difference between pressures in gold and in transparent dielectric, see Fig. 2; here we compare pressure inside the bulk gold and at a shock front in dielectric; pressures in gold and dielectric are equal at the CB. Large difference in pressures is explained by the model with decay of a pressure jump created by an ultrafast heating; the jump in this model is linked to the CB [1]. Pressures in the contacting materials after decay of a jump (outside the vicinity of the CB) depend on their acoustic impedances, see explanations in [1]. In the intermediate case and in the case with a long pulse the pressures profiles cannot be explained using the simple model with decay of a pressure jump.
The shock in transparent dielectric appears almost immediately with the UsLP. This is so because the UsLP is sharp, and the pressures (which are created in our two dielectrics, water and glass) are larger than a bulk modulus in these dielectrics; what is said relates to rather significant energies corresponding to regimes of NPs production. This means that the shocks in our cases in the considered dielectrics are strong. At the same time the compression wave in gold is weakly or moderately non-linear because pressures in gold are less than a bulk modulus 180 GPa of gold. Therefore some time proceeds before the compression wave in gold will overturn with formation of a shock [27, 28]. While in the case with a long pulse the pressures are smaller and increase slowly during a pulse. Hence longer time is necessary to wait for their overturning.
Increasing we increase temperature and decrease density of gold near the CB. Also intensity of incident light increases; here is an absorption coefficient. There is a transition to plasma corona like expansion into vacuum at high intensities In a plasma corona the density drops to values much lower than solid state density (orders of magnitude lower). In corona the absorption takes place at plasma critical density where frequency of laser light equals to local plasma frequency of a rarefied ionized metal. In the case with transparent dielectrics two limitations appear at the way to corona like expansion.
First, we cannot irradiate metal with very large intensities because an optical breakdown will shadow metal surface; may be the decrease of reflectivity observed in [4] during a laser pulse corresponds to the pre breakdown phenomena? Second, density of expanding metal cannot be so easily decreased below plasma critical density during the nanosecond pulse due to confinement by dense dielectric; situation is very different from expansion to vacuum; for gold g/cm for optical lasers and ionization degree (one ionized electron per atom). We see examples with high temperatures (and hence low densities) in Fig. 3. But still they are far from plasma critical density for corona. Corresponding absorbed fluences in our simulations (see Table 1) relate to the edge of the largest of fluences used in typical experiments [2, 3].
3 Separation of acoustic zones and hot advection layer
Let’s consider the era that comes after decoupling of acoustic and entropy modes in a HAZ. This era is definitely seen in the case of short/fast regimes While in the case of a long pulse this era begins later Fig. 4 demonstrates the typical situation relating to the era; here the ratio ns, ps, ps. Later in the era the situation doesn’t change in the sense that the triangular SWs and the advection layer are far away and become almost independent from each other. At the late stages of the era, it is difficult to plot the SWs and advection layer together because their thicknesses become very small relative to the spaces which separate them.
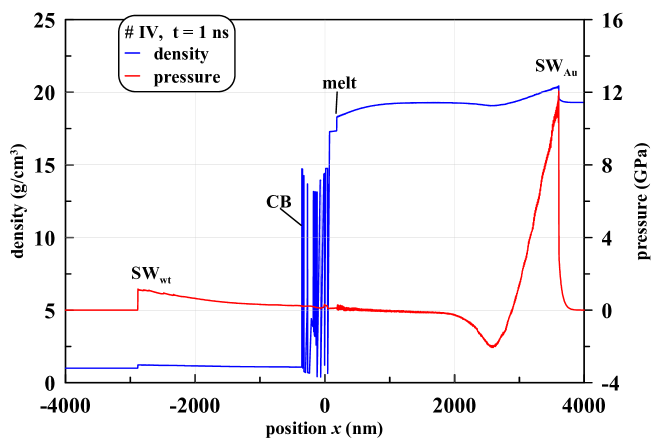
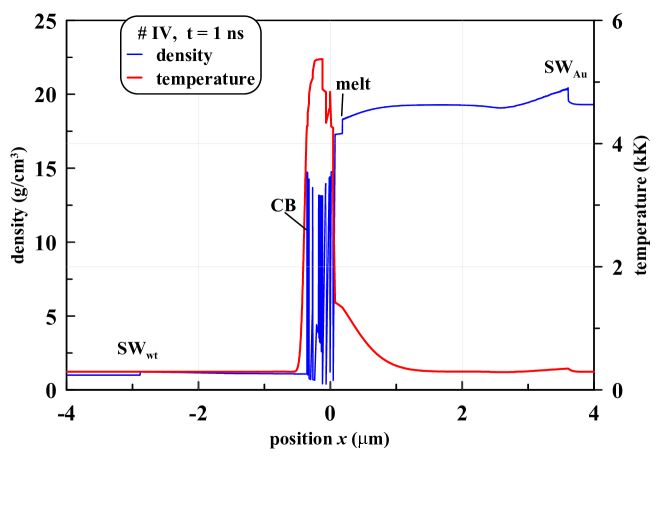
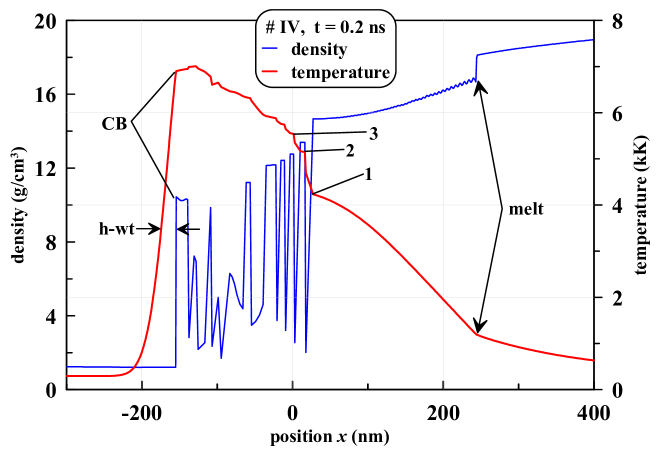
Fig. 5 proves that heat is kept inside the entropy mode located where the primary absorption of laser energy takes place - around the skin-layer. In the case of optical lasers the skin is a thin (10-20 nm thick) layer at the CB. Heat conductivity smears thermal energy distribution spreading heat from a skin. Spreading is very subsonic thus a thin clearly seen front of subsonic melting appears in Fig. 5; this is a density jump marked as ”melt” in Fig. 5; let’s mention here that melting at the 2T stage in case of the UsLP is smeared covering a significant part of a supersonic thermal wave [38] (such type of melting is called homogeneous nucleation of liquid phase; 2T state means UsLP, then are high, then thus at the 2T stage the Stefan problem approximation of melting/freezing isn’t applicable, while it is applicable in the situations shown in Figures 5 and 6. In these Figures the melting/freezing front, first, marks itself by a density jump (see note ”melt”). The jump corresponds to the edges of the triple point at the or phase planes. The jump appears due to spatial expansion of liquid phase of gold relative to the solid phase at the temperature of melting. Second, temperature at the jump equals to temperature in the triple point; 1337 K for gold.
It isn’t necessary to solve separately the Stefan problem in our approach where hydrodynamic equations (including energy balance with heat conduction) are coupled with equation of state (EoS) of real matter. The problem with melting/crystallization is solved inside these equations because the EoS describes phase transitions (melting, evaporation) and takes into account heat of fusion and heat of vaporization. Usually the Stefan problem is solved using only energy balance, heat of fusion, and melting temperature. In our approach the hydrodynamics relating to melting is present. Thus movement of matter due to expansion of a substance as a result of melting is described; see the caption to Fig. 6 where it is written about the difference in hydrodynamic velocities in the solid and liquid sides of the melting front.
We follow carefully thermal evolution of the entropy mode at the stage (beginning from ps) preceding to the instant 1 ns shown in Fig. 5; we start the 1T-HD simulations (with and without HD) at the instant equal to One example with ps is presented in Fig. 6. This Figure describe the situation with heating and formation of foam in more details relative to Fig. 5 showing a global structure. What keeps temperature high inside the foam?
In simulation #IV (see Table 1 where the simulations are listed) temperatures inside the entropy mode were 9.4 kK at the end ps) of absorption of the ps pulse. The full width at half maximum of the temperature profile is 180 nm. After that temperature gradually decreases mainly due to heat conduction into bulk gold and adiabatic cooling; heat conduction in water is included but it is small and weakly affects temperature distribution in a metal at the rather early stages.
Nucleation of future foam begins at ps in simulation #IV. During few tens of picoseconds the nucleation process covers the layer nm of gold; this layer is marked as ”foam” in Fig. 7. Mass thickness of the foamy layer is g/cm where g/cm is initial density of gold. After that the column mass doesn’t change in time. While geometrical thickness of the foamy layer increases with time. The is 430 nm at the instant ns shown in Fig. 5.
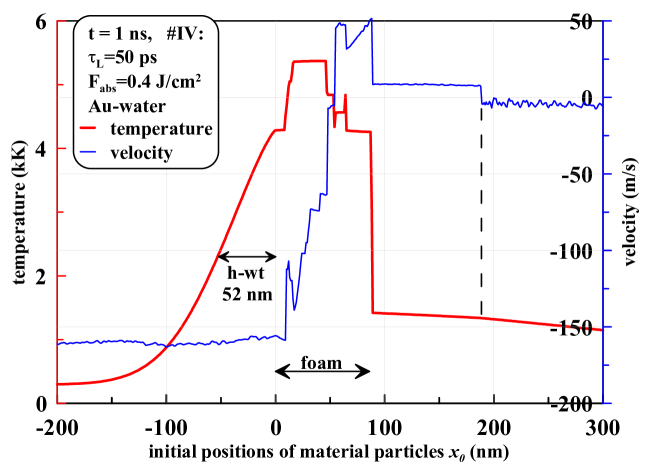
Foaming strongly decreases thermal conductivity of gold. This is the answer to the question: what keeps entropy mode hot in Fig. 5. In 1D geometry used in our hydrodynamic codes the foamy zone consists from alternating liquid (the digits 2 and 3 in Fig. 6 mark two of these liquid layers) and vapor layers (the digits 1-2 in Fig. 6 mark the first vapor gap from the side of gold). Namely the vapor layers weakly conduct heat while thermal conductivity in the liquid layers remains high. Therefore the temperature profile in Fig. 6 in the foamy zone is composed from the ladder of steps: the digits 1, 2, 3,… in Fig. 6. The steps are approximately homogeneous temperature distributions inside the liquid layers, while the intervals between the steps are the rather steep rises of temperature in a vapor layer between two neighboring liquid layers. In real 3D geometry the foamy zone contains a mixture of membranes, droplets, and vapor [1, 39, 40, 41]. Vapor surrounding the droplets is weakly conductive. Thus droplets lose their thermal contact with bulk gold and hence remain hot. Some contact exists along membranes when they are attached to the bottom of a crater.
As was said, Fig. 6 explains that temperature of a foam decreases slowly with time therefore the bump of temperature is high in Fig. 5: vapor serves as a thermal insulator. Continuous gold adjoining on the foam follows its own thermal history in large extent independent from cooling of foam. The point of contact between the foam and the continuous gold is denoted by digit 1 in Fig. 6. There is a large temperature jump in this point accumulated in time (comp. Fig. 6 from one side and Figs. 5, 7 from the other side). This accumulation takes place due to low conductance of the isolating vapor layer and cooling by heat transfer into bulk of continuous gold.
The melting/recrystallization front moves along matter to the right when there is enough internal energy at the left side - then the first order phase transition front is the melting front; its velocity to the right at ns is given in a caption to Fig. 6. While later in time the thermal reservoir at the left side is exhausted and the melting changes to the recrystallization [38, 42]. Then the front moves to the left side along material particles. In Fig. 5 corresponding to ns there is a recrystallization front moving to the left side with velocity m/s relative to matter. Then soon ns whole continuous gold adjoining on the foam will be solid.
Typical maximum velocity of recrystallization of a metal is m/s. Rate of diffusion of atoms in a liquid phase limits velocity of recrystallization [43, 39, 40]. Our hydrodynamic simulations gives larger values for this quantity corresponding to formal application of a Fourier’s law for thermal conductivity connecting and [38, 42]. Of course, a real situation with the subnanosecond pulse isn’t so close to equilibrium as it supposed by a Fourier’s law, thus it differs from an equilibrium picture (but not strongly: velocities are comparable). From kinetic description it follows that: (i) a liquid phase is overcooled below the triple point temperature; (ii) there is smearing of recrystallization front due to nucleation of nanocrystals in bulk of a liquid ahead of the front; and (iii) solidified gold transits into polycrystalline state with extremely small sizes (few nanometers) of the crystalline grains [8, 25, 43, 44, 39, 40, 45, 46, 47, 48].
Foamy part of the entropy/advection mode covers the column mass nm in Fig. 7. Here and in Fig. 7 the coordinate is Lagrangian coordinate. It is equal to initial (before laser action) position of a material particle at the axis perpendicular to the surface. Velocities inside the layers oscillates due to slowly decaying acoustic modes coupled to the liquid layers of the foamy zone. The acoustic modes are triggered by the events of rupture of continuous molten gold. Where the foam nucleation wave stops when it propagates into bulk of gold depends on strength of gold and tensile stress created due to expansion into medium with lower acoustic impedance. Strength of gold depends on phase state (solid is stronger) and temperature of liquid. Strength decreases as temperature increases. Therefore at some depth the nucleation wave stops. This depth define thickness of the foamy zone along material axis shown in Fig. 7, this thickness is underlined by the arrow ”foam” in Fig. 7.
Solidification is accompanied by contraction of gold. This causes appearance of mass flux of liquid to the solidification front. Velocity of this flux is m/s. This value defines the jump of velocity in Fig. 7. Position of the jump is marked by dashed vertical straight line in Fig. 7. Solidification/recrystallization front is shown by intersection of this dashed line with a temperature profile in Fig. 7. Solidification returns back heat of fusion. This process slows down the rate of decrease of temperature in the entropy/advection mode outside the foamy zone.
All simulations ##IV-VIII listed in Table 1 include heat conductivity of water; in ##IV-VI we take W/K/m and heat capacity 4.2 J/K/g, then thermal diffusivity is cms for normal density water. In molecular dynamics (MD) simulations ##VII,VIII heat conductivity is defined by the used interatomic potential for water, description of this item needs separate discussion. Water is heated through the CB from hot gold. Using MD simulations we estimate the Kapitza resistance for water-gold interface. This type of resistance is linked to difference of mass of atoms and atomic character of heat conduction in water; in MD simulations water is described as a point atoms. MD simulations show that temperature jump due to Kapitza resistance is of the order of 100 K; presentation of the corresponding calculations is out of the frame of this paper. This value is small relative to multi kilo Kelvin temperatures of gold in our conditions. Another problem is connected with appearance of foam and decrease of heat conductivity on the side of a gold target.
Temperature of water near the CB is high, see Figures 6 and 7. Hot thin layer of water appears thanks to thermal conduction. It is marked as ”h-wt” in Figures 6 and 7. The line ”h-wt” is plotted at the half maximum of a temperature profile (initial temperature 300 K is subtracted). The estimate gives 25 nm for cms and ns. This is approximately a half of thickness ”h-wt” shown in Fig. 7.
In the Section 3 we describe (A) gradual spatial separation of acoustic and entropy modes (Figures 4 and 5). (B) We see that interplay of momentums directed to the right and to the left sides from the heat affected zone causes fragmentation and foam formation inside the entropy mode in case of short pulses (fs and multi-ps); Figures 4-7. (C) Thermal conduction in gold and in water spreads heat accumulated in the entropy mode; Figures 6 and 7. Low heat conductivity of foam and gaseous gold decreases rate and scale of this spreading; see next Section about overcritical and hence gaseous like gold. Thus foam and gaseous gold for long time remain hot.
4 Overcritical states
4.1 Early stage
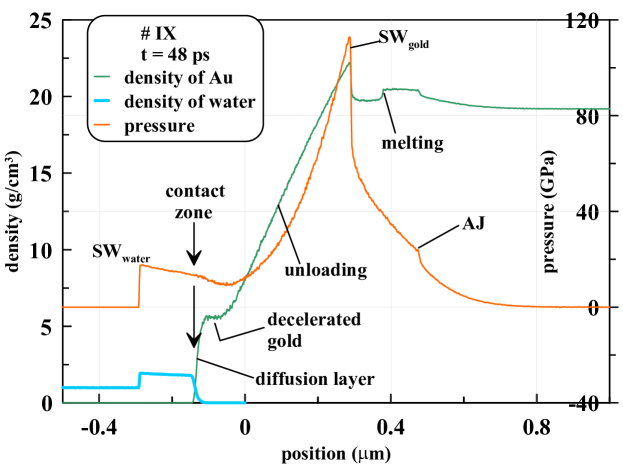
Absorption of energy of the order of one - few J/cm transfers gold in its heat affected zone (HAZ) into hot dense states above a critical point of gold. Let’s follow evolution of a gold-water system at later times. Fig. 8 presents early structure formed shortly after powerful ultrashort laser impact (MD simulation # IX, see Table 1). Structures gradually transform during their dynamic evolution, see below what and how is changed.
Absorption and thermal spreading of absorbed energy from a skin layer during a two-temperature stage creates a hot layer called HAZ. If we forget about light propagation through water and corresponding optical effects connected with refractive index of transparent water, because we operate with absorbed energy then we can say that the HAZs in case of water and in case of vacuum are the same as long as the values of are equal.
Further in time at the acoustic time scale the HAZ formed during the time interval corresponding to the two-temperature stage acoustically decays into the entropy mode and into two acoustic compression waves running one to the contact with water and the other one to the side of bulk gold; let’s call the last wave CW-bulk - compression wave propagating to the bulk side; is thickness of a HAZ. The entropy mode is the rest of the HAZ after irradiation of acoustic waves from the HAZ. The acoustic compression wave running to the contact reflects from the contact as a rarefaction wave (RfW) running behind the CW-bulk. Reflection and the reflected wave RfW of course depends on mechanical properties of water - in linear acoustics on acoustic impedance of water.
The instant ps shown in Fig. 8 approximately corresponds to the scale ps; in gold nm, km/s. Laser action is strong, thus the CW-bulk quickly overturns forming a shock SWgold (SW - shock wave). The RfW sits at the front of the SW The RfW is denoted as ”unloading” (into water) in Fig. 8. The sitting or ”attaching” to the front means that in Fig. 8 the SWgold separates the flow to two regions: the one at the right side relative to the SW doesn’t know about expansion into water, while the other, at the left side, depends on mechanical properties of medium surrounding a gold target, i.e. it knows about water. The right region is the same as in the case with expansion into vacuum at equal
Let’s stop our discussion about casuality and present other features of the structure shown in Fig. 8. AJ is an acoustic jump. It forms when the CW-bulk transits through the melting front. At the two-temperature state and large overheating above melting temperature the melting zone propagates supersonically; this regime is also called quasi-homogeneous melting. A pressure profile created during the time interval at the two-temperature stage thanks to approximately isochoric heating has more steep spatial piece of the profile in the place where the melting zone locates at the transition stage from two-temperature to one-temperature regime. Derivative is steeper at this piece because the isochoric pressure rise with temperature as function of temperature is fixed) is larger at the isochoric melting interval between solidus and liquidus. At the acoustic stage this steep piece propagates along sonic characteristics with speed of sound. I.e. the two-temperature supersonic melting is imprinted into profile of the CW-bulk. Speed of sound depends on pressure. Thus gradually the steep piece becomes even more steep. At the instant present in Fig. 8 this piece is the AJ.
In Fig. 8 the melting front is marked. At the stage shown the front propagates to the right side increasing mass thickness of molten gold. The SWgold and RfW in Fig. 8 were discussed above.
Gold at the plateau at the left side of the RfW near the contact with water moves approximately with the same velocity as the contact. This is typical for solutions with acoustic decay of a jump separating two homogeneous semi-spaces. A high pressure semi-space produces a shock in a low pressure semi-space. While a rarefaction wave propagates into the high pressure semi-space. There is a region of homogeneous flow (a plateau) covering a shock compressed layer and a piece of matter belonging to the initially high pressure semi-space. Stretching of matter is low at the plateau while it is finite in the RfW.
In our case the jump between semi-spaces separates the initially homogeneous semi-space (water) and a high pressure region of finite thickness Therefore situation changes relative to classical decay of two homogeneous semi-spaces as RfW runs out from the region Contact begins to decelerate, density outside the plateau decreases down to density at the plateau. Deceleration of the contact causes deceleration of the SWwater in Fig. 8. And triangular shape of a water shock and the profile behind it gradually forms.
Densities of gold and water are shown separately in Fig. 8. We see that in the diffusion zone the concentrations of mixed gold and water gradually changes from 100% to 0. Diffusion smears contact into a mixing zone (arrow ”contact” in Fig. 8).
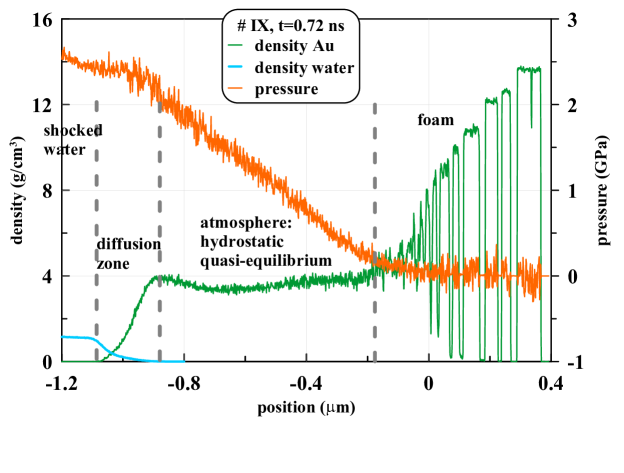
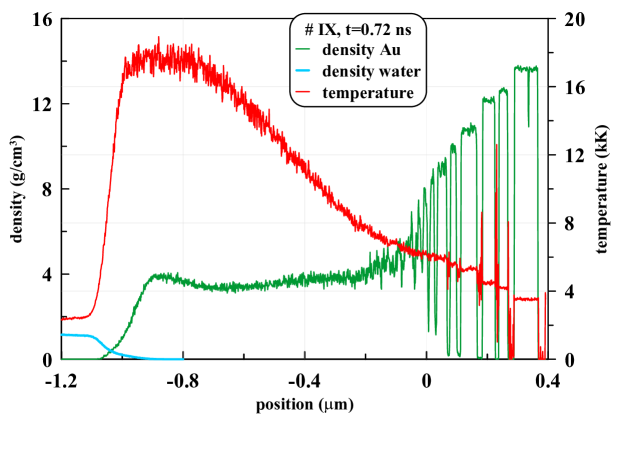
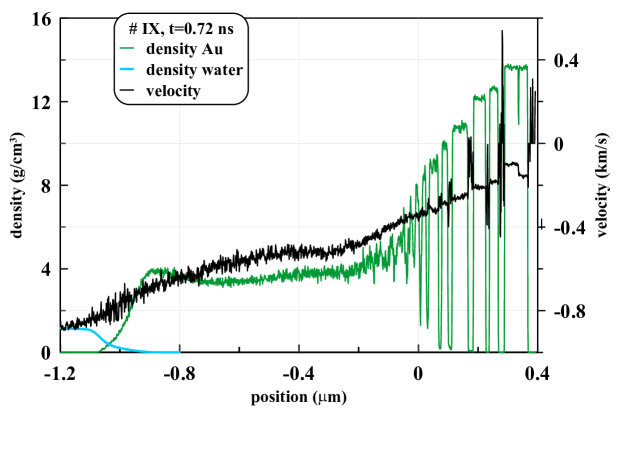
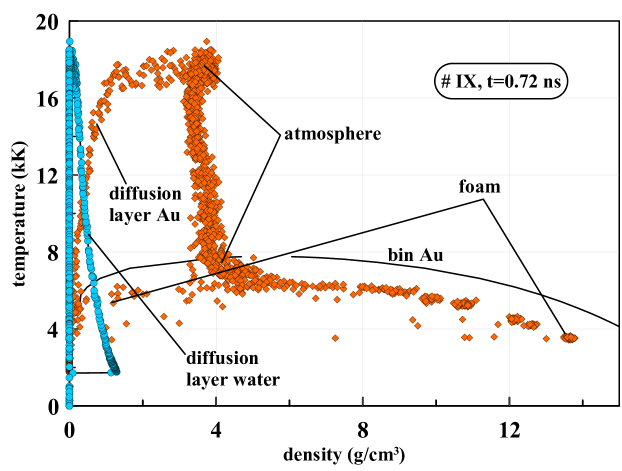
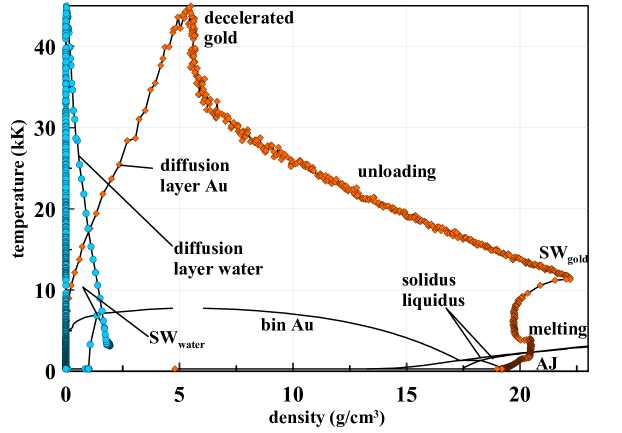
Fig. 9 shows how the instant spatial structure presented in Fig. 8 looks at the phase diagram of gold. Binodal (equilibrium curve), solidus, and liquidus of gold are taken according to the works [11, 12, 13, 14, 15]. The binodal consists from the left and right branches relative to the critical point. The right branch is called a boiling curve, while the left branch is a condensation curve.
All typical points from the structure in Fig. 8 are given in Fig. 9. The AJ is in a solid state below the melting region. Melting is slightly higher than the melting region because the dependence from our EAM potential is slightly different from the curve according to equation of state from [11, 12, 13, 14, 15]; EAM - embedded atom method. SW in gold and RfW follow above the mark ”melting” in Fig. 9. Pay attention to the image of the plateau ”decelerated gold” from Fig. 8 in Fig. 9. This is the most hot region.
The diffusion zone follows after the plateau (we move in direction from deep gold to water). In this zone temperature of gold falls down to temperature of water outside the mixed zone. While concentration of gold atoms (the orange rhombuses in Fig. 9) decreases to zero. The blue circles in Fig. 9 present water. The chain of them along the vertical axis with density equal to zero corresponds to the zero concentration of water deep into gold - see the blue curve in Fig. 8 prolonged to the right side from the mixing layer. The chain of the blue circles starting in the left up corner in Fig. 9 and going down increasing density and decreasing temperature relates to water in the mixing zone. At the left down corner the blue circles correspond to bulk water, shock in water, and shock compressed layer of water.
4.2 Times around nanosecond
The middle stage is shown in Figures 10-13. It relates to times near one nanosecond. Structure of flow is described in Fig. 10. Let’s begin from deep layers of gold. A shock is going far away from the contact zone. It doesn’t influence current dynamics near contact and thus isn’t shown in our Figures. A thick layer of foam in Fig. 10 separates the contact from gradually solidifying continuous bulk gold. The melting/solidification process in continuous gold located at the bottom edge of foam was illustrated in Fig. 4-7 above.
States of matter in foam are clear from Figures 11 and 13. This is the two-phase liquid-vapor mixture occupying the both branches of the binodal curve: one component of the mixture is located on the boiling curve corresponding to liquid phase while the another one is on the condensation curve presenting saturated vapor. Temperature of mixture slowly gradually decreases to the right side in Fig. 11. The bottom edge of mixture is adjoint to continuous gold while the up edge transfers gradually to the atmosphere, see Fig. 10.
At the left side the foam is bound by atmosphere, see Figures 10-13. Gold in atmosphere is in overcritical states as it is shown in Fig. 13. This is the states where thermal effects overcome still powerful cohesive properties following from interatomic interactions. Thus surface tension between overcritical gold and overcritical water disappears while their inter-diffusion is strongly enhanced.
We call ”atmosphere” the layer between the contact and foam because this layer is in quasi-hydrostatic equilibrium with the contact. This means that the layer decelerates approximately as the contact. Spatial gradient of velocity is decreased in the atmosphere relative to water and foam as it is shown in Fig. 12. Deceleration of the contact at the instant ns shown is cm/s When we say ”atmosphere” we mean that the ”free fall” deceleration changes in time more slow than the current acoustic time scale

Maximum pressure and temperature in atmosphere are 2 GPa and 18 kK, see Figures 10 and 11. Thickness of atmosphere is 0.5 micron according to Figures 10-12. In hydrostatic equilibrium we have where is Boltzmann constant and is mass of atom of gold. Taking kK as average temperature in the atmosphere and cm/s we obtain micron. As deceleration decreases with time the height of the atmosphere increases and quasi-hydrostatic approximation loses its validity.
Estimate of speed of sound in atmosphere based on gaseous approximation is km/s for kK. Then the current acoustic time scale is ns.
Atmosphere is convectively unstable because its hotter layers in an effective gravity field are located below the colder layers in the non-inertial frame connected with a contact. But it seems that there is not enough time to develop convection because the temporal interval of deceleration is limited to few nanoseconds and there are diffusion and viscosity dumping this development. In presence of diffusion even stronger Rayleigh-Taylor instability at the contact is suppressed. The Rayleigh-Taylor instability is stronger than convective instability because its increment is larger. The increment is larger since the density contrast at a contact is larger than the entropy contrast inside an atmosphere.
We don’t see indications of development of convection in our molecular dynamics simulation # VIII listed in Table 1. Lateral size is large in this simulation. The simulation # VIII is specially intended to follow development of the multi-dimensional instability. Even the Rayleigh-Taylor instability very weakly develops in the situation corresponding to simulations ## VIII and IX.
Velocity of the contact zone is m/s at the instant ns presented in Figures 10-13, see Fig. 12. The contact is smeared thanks to diffusion. Densities of gold and water are shown separately in Figures 10-12. Expansion velocity of the diffusion zone (from one edge to another one, concentrations change from 0% to 100%) thanks to difference of hydrodynamic velocities at the edges is 100 m/s at this instant. Expansion velocity of a gold/water mixture relative to matter due to diffusion is m/s for ns and diffusion coefficient cms.
4.3 Times around 10 nanoseconds
Qualitative changes in structure of flow take place during the time interval between ns and ns. Structure described above in Figures 10-13 corresponding to the stage ns was supported thanks to momentum and kinetic energy of atmosphere and foam. This momentum was directed to the water side, see Fig. 12. Water resists to expansion of gold, thus gradually through this resistance the momentum accumulated in the gold atmosphere and foam is transferred to the shock compressed layer of water. Amount of momentum is finite. Therefore it is not surprising that there is a stage when all momentum of gold directed to water is exhausted.
After that pressure at the contact zone is supported by gas and saturation pressure of hot enough gold. Momentum transfer and resistance of water maintain the ”free fall” or quasi-gravity like (thanks to the Einstein principle of equivalence of gravitational and inertial mass) deceleration of a gold/water contact. In turn the deceleration leads to creation of the atmospheric like quasi-hydrostatic layer of gold decelerated by the contact.
Deceleration leads to stopping of the contact. Velocity of the contact decreases to zero value and after that changes sign - slow back motion of gold begins. At the same stage the deceleration drops down to small values. Thus thickness of the corresponding ”atmosphere” and acoustic time scale for sound to pass atmosphere become large, larger than spatial and temporal scales related to current motion. Then the atmosphere as a significant element of the structure disappears.
Returning to the initial stages we have to mention that the opposite directed momentums in gold appear after laser heating and creation of the heat affected zone (HAZ) in gold. The positive momentum (positive velocity is directed along the -axis, is growing into bulk gold) is taken away by the shock running into bulk gold. The negative momentum is initially accumulated in the near contact layer of gold expanding to water. As was said, due to resistance of water the negative momentum transits to the shock in water and to the shock compressed layer of water.
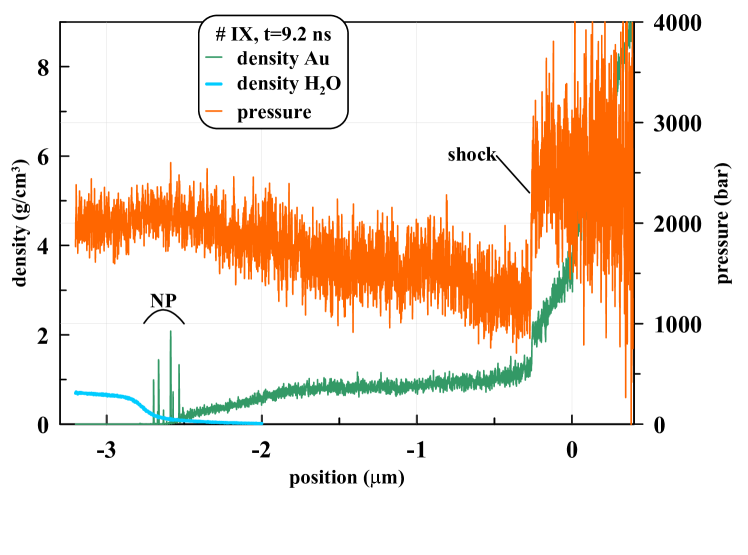
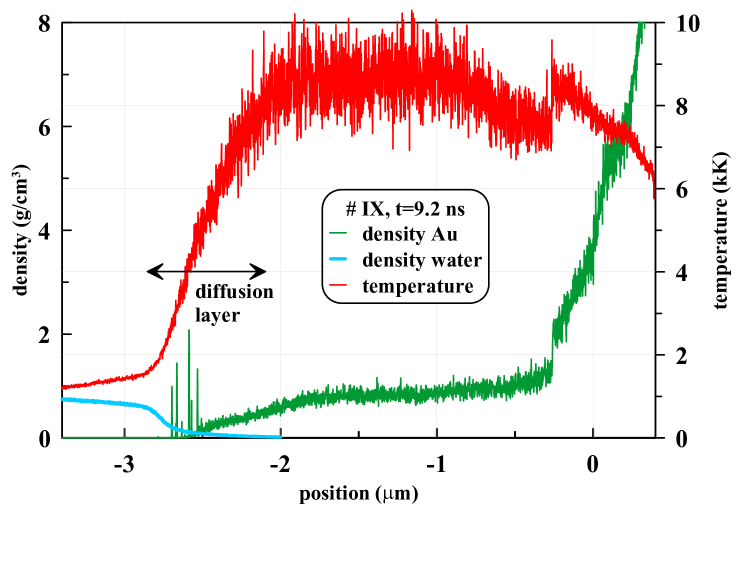
Figures 14-18 present the situation corresponding to the transient stage. This is the transient from the momentum transfer stage to the stage when pressure at the contact zone is supported by gas and vapor pressure of slowly cooling gold. Gold slowly cools because thermal conductivity in gaseous and two-phase (liquid-vapor) gold is much less than in condensed phase.
Pressure of gold near contact drops down approximately ten times during the time interval from 0.72 ns to 9.2 ns, compare Figures 10 and 14. Gradient of pressure in gold layer near contact decreases times from 2 GPa per 0.7 m to 800 bar per 2.5 m.
Density decreases from 4 g/cm to approximately 1 g/cm compare Figures 10-13 and 14-18. Geometrical thickness of the near contact gold layer increases approximately 3.5 times.
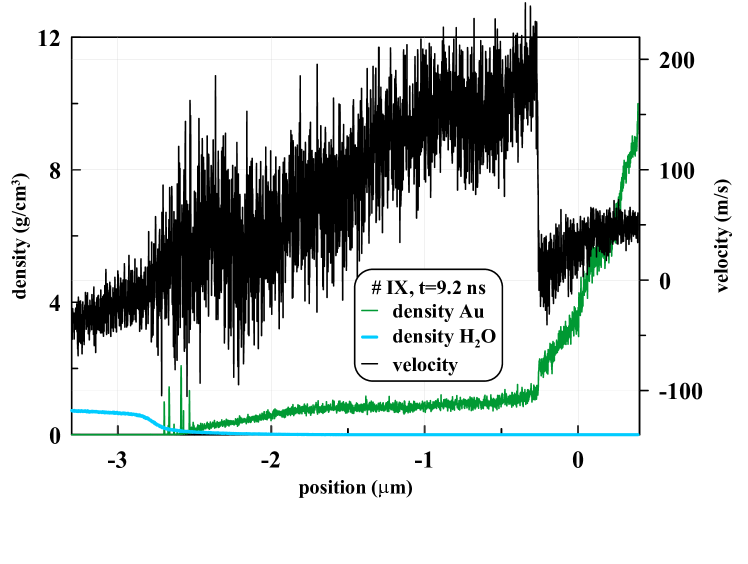
Decrease of deceleration (while temperatures decreases much more slowly and remains high at the stage ns) causes increase of height of atmosphere . This process looks like a back flow or outflow of gaseous gold from a contact. Velocity of gold turns back from the direction oriented to water side. To quantify the scale of this reorientation let’s compare Figures 12 and 16.

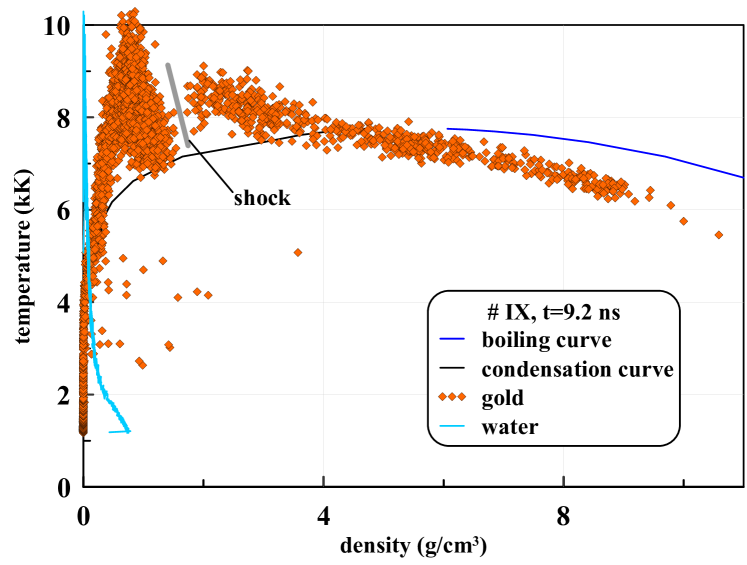
The outflow of gold achieves significant velocities exceeding local speed of sound. Thus a weak shock forms in the place where the outflow impacts dense molten motionless gold belonging to the right branch (boiling curve) of a binodal (coexistence or phase equilibriun curve), see Fig. 17; position of the shock is marked in Fig. 14. According to Fig. 16 the velocity jump at the weak shock seen in Figures 14-16 is near 200 m/s. Gas like estimate of speed of sound gives 730 m/s for kK; this is temperature in gaseous gold near the left side of the jump, see Fig. 15. The estimate based on the slope of the condensation curve gives 390 m/s; here the differences and are taken along the condensation curve. Speed of sound from EAM (embedded atom method) interatomic potential of gold used in molecular dynamics simulations ## VIII, IX should be less than 200 m/s in the conditions corresponding to the state near the jump.
Expansion of gold, decrease of its density and temperature mainly due to diffusive mixing with much colder water lead to condensation of atomic gold in clusters and nanoparticles. Thanks to cooling the gaseous gold intersects the condensation curve shown in Figures 17 and 18. Nanoparticles are seen at the density profile of gold in Figures 14-16. They are marked by ”NP” in Fig. 14. The nanoparticles begin to appear after ns. Their amount and size grow with time.
Open question remains about total number of nanoparticles produced by a laser pulse. Indeed, there are significant quantity of gaseous gold above the condensation curve in Figures 17 and 18. They correspond to the cloud located between the contact and the jump in Figures 14-16. But it is unclear, how much of them will have time to condense before they collide with continuous gold corresponding to the rest of a gold target. Even longer simulations are planned to address this problem. Nevertheless, it is obvious that the nanoparticles mixed with water (they are seen in Figures 14-16) have not a chance to return to the gold target.
5 Heating of water and bubble formation
5.1 Equation of state for water and shock adiabat
We have tried three equation of states (EoS) for water. They are: van der Waals EoS, Tait EoS, and semi-analytical EoS developed by Nigmatulin and Bolotnova [49]. It is necessary to describe (a) Hugoniot adiabatic curve, (b) binodal of water, (c) one-phase adiabatic curves passing from the Hugoniot adiabat to binodal, and (d) two-phase adiabats presenting prolongations of the one-phase adiabats through intersection with binodal into two-phase vapor-liquid mixture. Thus rather wide range of a phase diagram should be covered; excluding solid states. The standard van der Waals EoS is relevant around a two-phase region. But it has rather large excluded volume and cannot be applied for approach to the Hugoniot curve with significant compressions of liquid water from normal conditions. The Tait EoS is better near Hugoniot but it difficult to connect Hugoniot and binodal using it. The EoS [49] is valid in the region of a phase diagram from Hugoniot to binodal.
Shock adiabat of water starting from normal state according to measurements [14, 15] is shown in Fig. 19 together with shock adiabats used in our calculations. We see that EoS [49] may be used for compressions below 17 GPa and has right speed of sound in an acoustic limit. The EAM (embedded atom method) interatomic potential of water developed by Zhakhovsky gives right approximation of the Hugoniot curve in a wide range of pressures up to the Megabar region; this potential is presented in https://www.researchgate.net/project/Development-of-interatomic-EAM-potentials.
The range of pressures up to 17-18 GPa, where EoS [49] is valid, is enough for our application with gold ablation into water. Indeed, acoustic impedance of water is low relative to the impedance of gold. Therefore even the most powerful laser impact with ultrashort duration corresponding to simulations ## VIII and IX from Table 1 produces moderate compressions in water, see Fig. 8. Pressures in gold are above Megabar while in water they are below 20 GPa. For laser actions with smaller absorbed energy or longer durations the pressures in water are smaller.
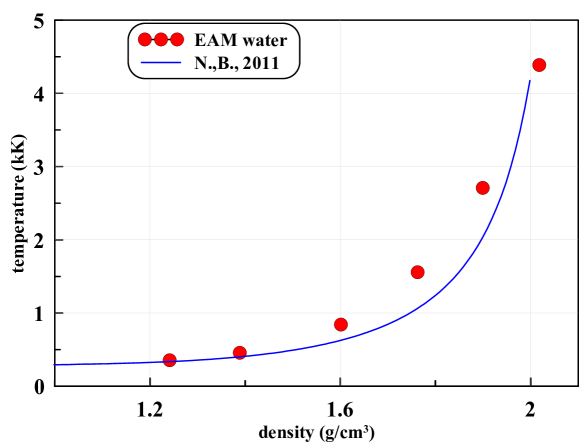
To address the important problem of formation of a bubble filled with water vapor we have to know the thermal history of the water layers adjoining to the contact with gold. There are two sources of heating of water. First it is heated by dissipation of kinetic energy thanks to friction behind a front of a shock wave. The second source is linked to conductive heating of water from hot gold. In Fig. 20 the Hugoniot curves are shown at the density-temperature plane. We see that the shock heating is satisfactory described. Comparison with experimental temperature measurements is also given in paper [49]. It shows that up to a few kK the EoS [49] correctly presents shock heating.
5.2 Transition from strongly overcritical states to huge rarefactions of water
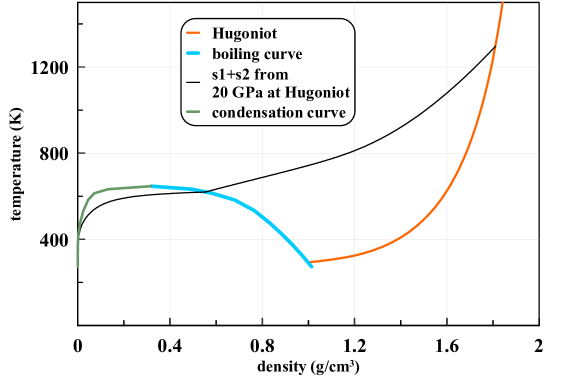
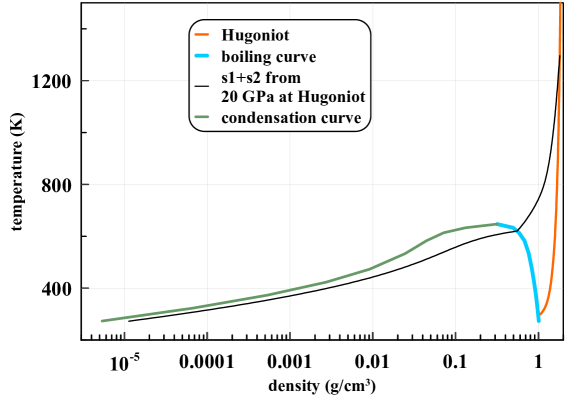
Let’s consider first the dissipation in shock ignoring thermal conduction. Then during expansion water cools down along an adiabatic curve; no thermal exchange with surrounding medium. Example of this curve is shown in Fig. 21. The adiabatic curve is separated to two parts: one (s1) along condensed phase, while another (s2) in vapor-liquid mixture.
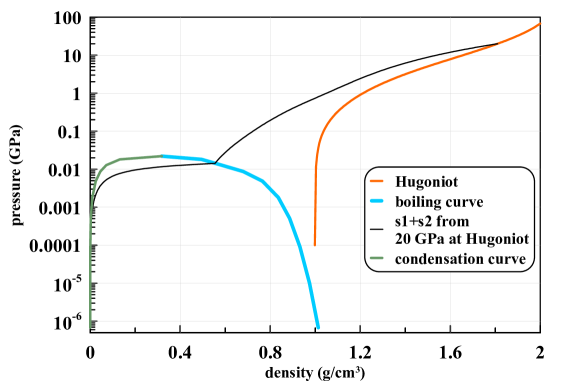
The adiabatic curve shown in Fig. 21 starts from the Hugoniot curve for water. Pressure behind shock front in this point is 20 GPa. This is the highest possible pressure in water in the case of gold ablation in water. Nevertheless the adiabatic curve in Fig. 21 crosses the binodal at its right branch corresponding to boiling curve, thus below the critical point; entropy is less than entropy at the adiabat passing the binodal at the critical point.
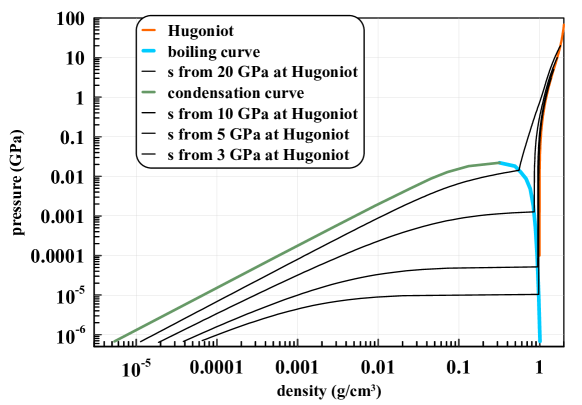
This limits expansion of water when pressure drops down to 0.1-1 bar level, see Fig. 22. The adiabatic curves starting from Hugoniot adiabatic curve at 20, 10, 5, and 3 GPa are shown in Fig. 23. Expansion of water along the strongest adiabatic curve beginning from 20 GPa and finishing at 0.1 bar gives increase in volume 6000 times relative to volume of water in normal conditions before the laser action. While for adiabatic curve starting from the Hugoniot curve at 3 GPa the expansion degree at bar is only see Fig. 23. This means that the water bubble is filled with water vapor corresponding to different entropy values. The coldest layers form the outer shells of a bubble.
Cooling history and temperature decrease is shown in Fig. 24. Temperature decreases approximately twice during three times expansion along the one-phase interval s1 of the adiabatic curve. After that at the two-phase interval s2 the temperature again decreases twice but now expansion is large: times.
6 Conclusion
Ablation of gold in water is considered in different regimes of laser action. We vary absorbed energy and duration of a pulse. Structure of ablation flow and its structural reconstruction during evolution are analyzed. It is shown that strong pulse transfers gold into overcritical states. Water with its low critical parameters for long time exists in its overcritical states. Hot compressed water and gold actively interpenetrate each other through diffusion process. Rather thick mixed contact layer is formed.
Temperature decreases in this layer from large temperature in gold to relatively small values in water. Gold is rather cold near the water edge of the mixed zone. Thus gold crosses condensation curve and formation of clusters and nanoparticles begins. These nanoparticles are mixed with water, thus they cannot stick back to remnants of a bulk target and remain in water during any extent of water expansion.
Expansion, pressure and temperature drops during water expansion are considered.
Acknowledgement. This work was supported by the Russian Science Foundation grant 14-19-01599.
References
- [1] N. A. Inogamov, V. V. Zhakhovskii, V. A. Khokhlov, Dynamics of gold ablation into water, JETP 127(1) (1) (2018) 79–106. doi:10.1134/S1063776118070075.
- [2] D. Zhang, B. Gökce, S. Barcikowski, Laser synthesis and processing of colloids: Fundamentals and applications, Chem. Rev. 117(5) (2017) 3990–4103. doi:10.1021/acs.chemrev.6b00468.
- [3] J. Xiao, P. Liu, C. Wang, G. Yang, External field-assisted laser ablation in liquid: An efficient strategy for nanocrystal synthesis and nanostructure assembly, Progress in Materials Science 87 (2017) 140 – 220. doi:https://doi.org/10.1016/j.pmatsci.2017.02.004.
- [4] S. V. Starinskiy, Y. G. Shukhov, A. V. Bulgakov, Laser-induced damage thresholds of gold, silver and their alloys in air and water, Applied Surface Science 396 (2017) 1765 – 1774. doi:https://doi.org/10.1016/j.apsusc.2016.11.221.
- [5] J. Lam, J. Lombard, C. Dujardin, G. Ledoux, S. Merabia, D. Amans, Dynamical study of bubble expansion following laser ablation in liquids, Appl. Phys. Lett. 108 (7) (2016) 074104. doi:10.1063/1.4942389.
- [6] M. E. Povarnitsyn, T. E. Itina, P. R. Levashov, K. V. Khishchenko, Mechanisms of nanoparticle formation by ultra-short laser ablation of metals in liquid environment, Phys. Chem. Chem. Phys. 15 (2013) 3108–3114. doi:10.1039/C2CP42650A.
- [7] M. E. Povarnitsyn, T. Itina, Hydrodynamic modeling of femtosecond laser ablation of metallic targets in vacuum and in liquid, Appl. Phys. A 117 (1) (2014) 175–178. doi:10.1007/s00339-014-8319-1.
- [8] C.-Y. Shih, M. V. Shugaev, C. Wu, L. V. Zhigilei, Generation of subsurface voids, incubation effect, and formation of nanoparticles in short pulse laser interactions with bulk metal targets in liquid: Molecular dynamics study, J. Phys. Chem. C 121 (2017) 16549–16567.
- [9] C.-Y. Shih, R. Streubel, J. Heberle, A. Letzel, M. V. Shugaev, C. Wu, M. Schmidt, B. Gokce, S. Barcikowski, L. V. Zhigilei, Two mechanisms of nanoparticle generation in picosecond laser ablation in liquids: the origin of the bimodal size distribution, Nanoscale 10 (2018) 6900–6910. doi:10.1039/C7NR08614H.
- [10] N. Inogamov, V. Zhakhovsky, V. Khokhlov, Laser ablation of gold intowater: near critical point phenomena and hydrodynamic instability, arXiv:1803.07343v1 [physics.comp-ph] 20 Mar 2018.
- [11] A. V. Bushman, V. E. Fortov, G. I. Kanel, A. L. Ni, Intense Dynamic Loading of Condensed Matter, Taylor & Francis Translation, London, 1993.
- [12] K. V. Khishchenko, S. I. Tkachenko, P. R. Levashov, I. V. Lomonosov, V. S. Vorob’ev, Metastable states of liquid tungsten under subsecond wire explosion, Intern. J. Thermophys. 23 (5) (2002) 1359–1367. doi:10.1023/A:1019821126883.
- [13] I. Lomonosov, Multi-phase equation of state for aluminum, Laser and Particle Beams 25 (4) (2007) 567–584. doi:10.1017/S0263034607000687.
-
[14]
http://teos.ficp.ac.ru/rusbank/.
URL http://teos.ficp.ac.ru/rusbank/ -
[15]
http://www.ihed.ras.ru/rusbank/.
URL http://www.ihed.ras.ru/rusbank/ -
[16]
S. I. Anisimov, B. L. Kapeliovich, T. L. Perel’man,
Electron
emission from metal surfaces exposed to ultrashort laser pulses, Sov. Phys.
JETP 39 (2) (1974) 375–377.
URL http://www.jetp.ac.ru/cgi-bin/r/index/e/39/2/p375?a=list - [17] Y. V. Petrov, N. A. Inogamov, K. P. Migdal, Thermal conductivity and the electron–ion heat transfer coefficient in condensed media with a strongly excited electron subsystem, JETP Lett. 97 (1) (2013) 20–27. doi:10.1134/S0021364013010098.
- [18] K. P. Migdal, Y. V. Petrov, N. A. Inogamov, Kinetic coefficients for d-band metals in two-temperature states created by femtosecond laser irradiation, Proc.SPIE 9065 (2013) 9065 – 9065 – 20. doi:10.1117/12.2053172.
- [19] N. A. Inogamov, V. V. Zhakhovsky, S. I. Ashitkov, V. A. Khokhlov, V. V. Shepelev, P. S. Komarov, A. V. Ovchinnikov, D. S. Sitnikov, Y. V. Petrov, M. B. Agranat, S. I. Anisimov, V. E. Fortov, Laser acoustic probing of two–temperature zone created by femtosecond pulse, Contributions to Plasma Physics 51 (4) (2011) 367–374. doi:10.1002/ctpp.201010111.
- [20] N. A. Inogamov, V. V. Zhakhovsky, Y. V. Petrov, V. A. Khokhlov, S. I. Ashitkov, K. P. Migdal, D. K. Ilnitsky, Y. N. Emirov, K. V. Khishchenko, P. S. Komarov, V. V. Shepelev, M. B. Agranat, S. I. Anisimov, I. I. Oleynik, V. E. Fortov, Ultrashort laser-matter interaction at moderate intensities: two-temperature relaxation, foaming of stretched melt, and freezing of evolving nanostructures, Proc.SPIE 9065 (2013) 9065 – 9065 – 14. doi:10.1117/12.2053166.
-
[21]
S. I. Ashitkov, P. S. Komarov, V. V. Zhakhovsky, Y. V. Petrov, V. A. Khokhlov,
A. A. Yurkevich, D. K. Ilnitsky, N. A. Inogamov, M. B. Agranat,
Ablation of gold
irradiated by femtosecond laser pulse: Experiment and modeling, J. Phys.:
Conf. Ser. 774 (1) (2016) 012097.
URL http://stacks.iop.org/1742-6596/774/i=1/a=012097 - [22] K. Eidmann, J. M. ter Vehn, T. Schlegel, S. Hueller, Hydrodynamic simulation of subpicosecond laser interaction with solid-density matter, Phys. Rev. E 62 (2000) 1202–1214.
- [23] Z. Chen, M. Mo, L. Soulard, V. Recoules, P. Hering, Y. Y. Tsui, S. H. Glenzer, A. Ng, Interatomic potential in the nonequilibrium warm dense matter regime, Physical Review Letters 121 (7). doi:10.1103/PhysRevLett.121.075002.
- [24] Y. V. Petrov, N. A. Inogamov, Elimination of the mott interband s-d enhancement of the electrical resistance of nickel and platinum owing to the excitation of electrons by femtosecond laser pulses, JETP Letters 98 (5) (2013) 278–284. doi:10.1134/S0021364013180094.
- [25] L. V. Zhigilei, Z. Lin, D. S. Ivanov, Atomistic modeling of short pulse laser ablation of metals: Connections between melting, spallation, and phase explosion, The Journal of Physical Chemistry C 113 (27) (2009) 11892–11906. doi:10.1021/jp902294m.
- [26] V. V. Zhakhovsky, M. M. Budzevich, N. A. Inogamov, I. I. Oleynik, C. T. White, Single two-zone elastic-plastic shock waves in solids, Phys. Rev. Lett. 107 (13) (2011) 135502. doi:10.1103/PhysRevLett.107.135502.
- [27] N. A. Inogamov, V. V. Zhakhovskii, V. A. Khokhlov, V. V. Shepelev, Superelasticity and the propagation of shock waves in crystals, JETP Lett. 93 (4) (2011) 226 232. doi:10.1134/S0021364011040096.
- [28] B. J. Demaske, V. V. Zhakhovsky, N. A. Inogamov, I. I. Oleynik, Ultrashort shock waves in nickel induced by femtosecond laser pulses, Phys. Rev. B 87 (2013) 054109. doi:10.1103/PhysRevB.87.054109.
- [29] M. B. Agranat, S. I. Anisimov, S. I. Ashitkov, V. V. Zhakhovskii, N. A. Inogamov, P. S. Komarov, A. V. Ovchinnikov, V. E. Fortov, V. A. Khokhlov, V. V. Shepelev, Strength properties of an aluminum melt at extremely high tension rates under the action of femtosecond laser pulses, JETP Letters 91 (9) (2010) 471–477. doi:10.1134/S0021364010090080.
- [30] V. V. Zhakhovskii, N. A. Inogamov, Elastic-plastic phenomena in ultrashort stress waves, JETP Lett. 92 (8) (2010) 521–526. doi:10.1134/S0021364010200063.
-
[31]
S. I. Ashitkov, M. B. Agranat, G. I. Kanel’, P. S. Komarov, V. E. Fortov,
Behavior of aluminum near an
ultimate theoretical strength in experiments with femtosecond laser pulses,
JETP Lett. 92 (8) (2010) 516–520.
URL http://mi.mathnet.ru/eng/jetpl1443 - [32] J. C. Crowhurst, M. R. Armstrong, K. B. Knight, J. M. Zaug, E. M. Behymer, Invariance of the dissipative action at ultrahigh strain rates above the strong shock threshold, Phys. Rev. Lett. 107 (2011) 144302. doi:10.1103/PhysRevLett.107.144302.
- [33] V. V. Zhakhovsky, N. A. Inogamov, B. J. Demaske, I. I. Oleynik, C. T. White, Elastic-plastic collapse of super-elastic shock waves in face-centered-cubic solids, J. Phys.: Conf. Ser. 500 (17) (2014) 172007. doi:10.1088/1742-6596/500/17/172007.
- [34] R. Perriot, V. V. Zhakhovsky, N. A. Inogamov, I. I. Oleynik, Evolution of elastic precursor and plastic shock wave in copper via molecular dynamics simulations, J. Phys. Conf. Ser. 500 (2014) 172008.
- [35] S. I. Ashitkov, V. V. Zhakhovsky, N. A. Inogamov, P. S. Komarov, M. B. Agranat, G. I. Kanel, The behavior of iron under ultrafast shock loading driven by a femtosecond laser, AIP Conference Proceedings 1793 (1) (2017) 100035. doi:10.1063/1.4971660.
- [36] V. V. Zhakhovsky, K. P. Migdal, N. A. Inogamov, S. I. Anisimov, Md simulation of steady shock-wave fronts with phase transition in single-crystal iron, AIP Conference Proceedings 1793 (1) (2017) 070003. doi:10.1063/1.4971591.
- [37] M. M. Budzevich, V. V. Zhakhovsky, C. T. White, I. I. Oleynik, Evolution of shock-induced orientation-dependent metastable states in crystalline aluminum, Phys. Rev. Lett. 109 (2012) 125505. doi:10.1103/PhysRevLett.109.125505.
- [38] N. Inogamov, V. Zhakhovskii, S. Ashitkov, V. Khokhlov, Y. Petrov, P. Komarov, M. Agranat, S. Anisimov, K. Nishihara, Two-temperature relaxation and melting after absorption of femtosecond laser pulse, Applied Surface Science 255 (24) (2009) 9712 – 9716, proceedings of the Sixth International Conference onPhoto-Excited Processes and Applications(6-ICPEPA). doi:10.1016/j.apsusc.2009.04.139.
- [39] N. A. Inogamov, V. V. Zhakhovsky, S. I. Ashitkov, Y. N. Emirov, A. Y. Faenov, T. A. Pikuz, M. Ishino, M. Kando, N. Hasegawa, M. Nishikino, T. Kawachi, M. B. Agranat, A. V. Andriash, S. E. Kuratov, I. I. Oleynik, Surface nano-structuring produced by spallation of metal irradiated by an ultrashort laser pulse, J. Phys.: Conf. Ser. 500 (11) (2014) 112070. doi:10.1088/1742-6596/500/11/112070.
- [40] N. Inogamov, V. Zhakhovsky, V. Khokhlov, S. Ashitkov, Y. Emirov, K. Khichshenko, A. Faenov, T. Pikuz, M. Ishino, M. Kando, N. Hasegawa, M. Nishikino, P. Komarov, B. Demaske, M. Agranat, S. Anisimov, T. Kawachi, I. Oleynik, Ultrafast lasers and solids in highly excited states: results of hydrodynamics and molecular dynamics simulations, J. Phys.: Conf. Ser. 510 (2014) 012041. doi:10.1088/1742-6596/510/1/012041.
- [41] S. I. Ashitkov, P. S. Komarov, A. V. Ovchinnikov, E. V. Struleva, V. V. Zhakhovskii, N. A. Inogamov, M. B. Agranat, Ablation and nanostructuring of metals by femtosecond laser pulses, Quant. Electron. 44 (6) (2014) 535–539. doi:10.1070/QE2014v044n06ABEH015448.
- [42] A. N. Volkov, L. V. Zhigilei, Hydrodynamic multi-phase model for simulation of laser-induced non-equilibrium phase transformations, Journal of Physics: Conference Series 59 (1) (2007) 640.
- [43] W.-L. Chan, R. S. Averback, D. G. Cahill, A. Lagoutchev, Dynamics of femtosecond laser-induced melting of silver, Phys. Rev. B 78 (2008) 214107.
- [44] D. S. Ivanov, Z. Lin, B. Rethfeld, G. M. O’Connor, T. J. Glynn, L. V. Zhigilei, Nanocrystalline structure of nanobump generated by localized photoexcitation of metal film, Journal of Applied Physics 107 (1) (2010) 013519. doi:10.1063/1.3276161.
- [45] D. S. Ivanov, A. I. Kuznetsov, V. P. Lipp, B. Rethfeld, B. N. Chichkov, M. E. Garcia, W. Schulz, Short laser pulse nanostructuring of metals: direct comparison of molecular dynamics modeling and experiment, Appl. Phys. A 111 (3) (2013) 675–687. doi:10.1007/s00339-013-7656-9.
- [46] N. A. Inogamov, V. V. Zhakhovsky, K. P. Migdal, Laser-induced spalling of thin metal film from silica substrate followed by inflation of microbump, Appl. Phys. A 122 (4) (2016) 432. doi:10.1007/s00339-016-9942-9.
- [47] N. A. Inogamov, V. V. Zhakhovsky, V. A. Khokhlov, Y. V. Petrov, K. P. Migdal, Solitary nanostructures produced by ultrashort laser pulse, Nanoscale Research Letters 11 (1) (2016) 177. doi:10.1186/s11671-016-1381-1.
- [48] S. I. Anisimov, V. V. Zhakhovsky, N. A. Inogamov, S. A. Murzov, V. A. Khokhlov, Formation and crystallisation of a liquid jet in a film exposed to a tightly focused laser beam, Quant. Electron. 47 (6) (2017) 509–521. doi:10.1070/QEL16381.
- [49] R. I. Nigmatulin, R. K. Bolotnova, Wide-range equation of state for water and steam: Simplified version, High Temperature 49 (2) (2011) 303–306. doi:10.1134/S0018151X11020106.