Response of a Li-glass/multi-anode photomultiplier detector to -particles from 241Am
Abstract
The response of a position-sensitive Li-glass scintillator detector to -particles from a collimated 241Am source scanned across the face of the detector has been measured. Scintillation light was read out by an 8 8 pixel multi-anode photomultiplier and the signal amplitude for each pixel has been recorded for every position on a scan. The pixel signal is strongly dependent on position and in general several pixels will register a signal (a hit) above a given threshold. The effect of this threshold on hit multiplicity is studied, with a view to optimize the single-hit efficiency of the detector.
keywords:
SoNDe thermal neutron detector, GS20 scintillating glass, multi-anode photomultiplier, position-dependent -particle response, H127001 Introduction
The European Spallation Source (ESS) [1] will soon commence operations as the most powerful neutron source in the world. Highly efficient, position sensing neutron detectors are crucial to the scientific mission of ESS. The worldwide shortage of 3He [4, 3, 2] has resulted in considerable effort being undertaken to develop new neutron-detector technologies. One such effort is the development of Solid-state Neutron Detectors SoNDe [5, 6, 7] for high-flux applications, motivated by the desire for two-dimensional position-sensitive systems for small-angle neutron-scattering experiments [8, 9, 10, 11, 13, 12, 14, 15, 16, 17]. The SoNDe concept features individual neutron-detector modules which may be easily configured to instrument essentially any experimental phase space. The specification for the neutron interaction position reconstruction accuracy for the SoNDe technology is 6 mm.
The core components of a SoNDe module are the neutron-sensitive Li-glass scintillator and the pixelated multi-anode photomultiplier tube (MAPMT) used to collect the scintillation light. The response of MAPMTs to scintillation-emulating laser light has been extensively studied [18, 19, 20, 21, 22, 23, 24, 25, 26]. Similar Li-glass/MAPMT detectors have been tested with thermal neutrons [27] and a SoNDe detector prototype has been evaluated in a reactor-based thermal-neutron beam [7]. In this paper, we present results obtained for the response of a SoNDe detector prototype to -particles from a collimated 241Am source, scanned across the face of the scintillator. Our goal was to examine methods to optimize the localization of the scintillation signal with a view to optimizing the position resolution of the detector, under constraints imposed by envisioned readout schemes for the detector. We were particularly interested in the behavior of the SoNDe detector prototype at the vertical and horizontal boundaries between the pixels and the corners where four pixels meet.
2 Apparatus
2.1 Collimated -particle source
Fig. 1 shows a sketch of the assembly used to produce a beam of -particles. It consisted of a 241Am -particle source mounted in a 3D-printed holder/collimator assembly.
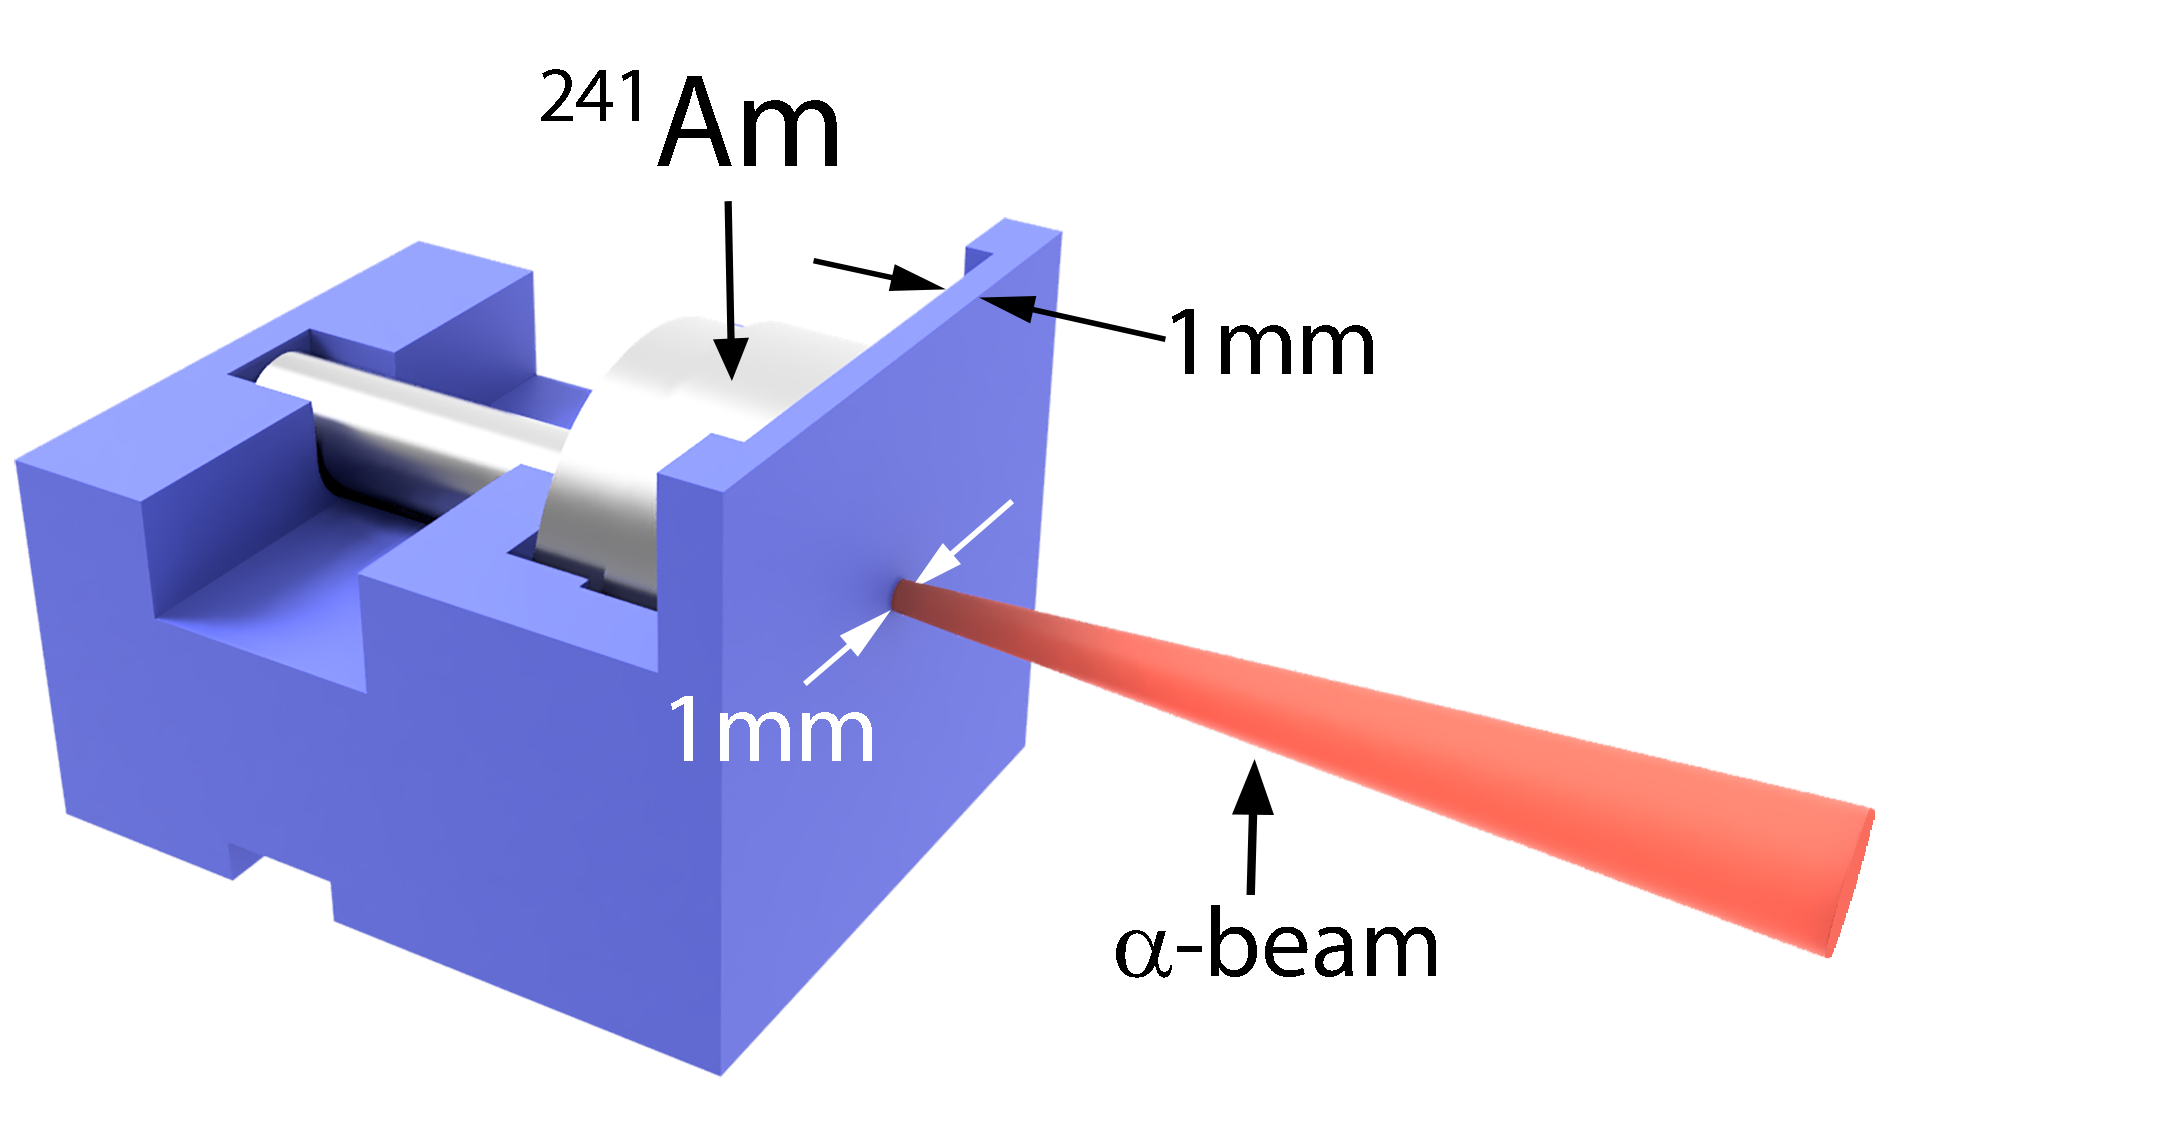
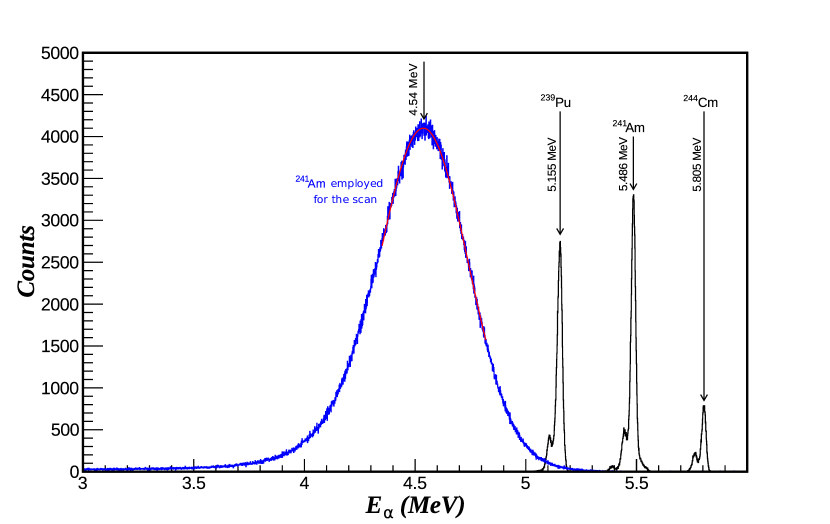
The -particle emission energies of 241Am are 5.5 MeV (85%) and 5.4 MeV (15%). The gamma-ray background from the subsequent decay of excited states of 237Np has an energy of 60 keV and has a neglible effect on the -particle response of the SoNDe detector prototype. The -particle spectrum from the present source was measured (Fig. 2) using a high-resolution passive-implanted planar silicon (PIPS) detector system in vacuum, where the PIPS detector was calibrated using a three-actinide calibration source. The average energy of the -particles emitted by the presently employed source was 4.5 MeV, corresponding to an energy loss of 1 MeV in the source window.
Holder/collimator assemblies for the 241Am source were 3D-printed from polyactic acid using the fused deposition modeling technique. For our measurements, we used 1 mm thick collimators with either 3 mm (for gain mapping) or 1 mm (for border scanning) diameter apertures, resulting in uniform 3 mm or 1 mm irradiation spots at the upstream face of the scintillator. The distance from the 241Am source to this upstream face was 6 mm, so that the mean -particle energy at the surface of the GS20 wafer was 4.0 MeV [28].
2.2 SoNDe detector prototype
The SoNDe detector prototype investigated in this paper is being developed for large-area arrays to detect thermal to cold neutrons with energies of 25 meV. It consists of a 1 mm thick lithium-silicate scintillating glass wafer coupled to an MAPMT.
2.2.1 Li-glass scintillator
Cerium-activated lithium-silicate glass scintillator GS20 [29, 30, 31, 32] purchased from Scintacor [33] was chosen for this application. GS20 has been demonstrated to be an excellent scintillator for the detection of thermal and cold neutrons and arrays of scintillator tiles can be arranged into large area detector systems [10, 11, 8, 9, 12]. The lithium content is 6.6% by weight, with a 95% 6Li isotopic enhancement, giving a 6Li concentration of 1.58 atoms/cm3. 6Li has a thermal-neutron capture cross section of 940 b at 25 meV, so that a 1 mm thick wafer of GS20 detects 75% of incident thermal neutrons. The process produces a 2.05 MeV -particle and a 2.73 MeV triton which have mean ranges of 5.3 m and 34.7 m respectively [34] in GS20. Using the present -particle source, scintillation light was generated overwhelmingly within 15 m of the upstream face of the scintillating wafer. We note that the scintillation light-yield outputs for 1 MeV protons is 5 times higher than that of 1 MeV -particles [35]. Thus, after thermal-neutron capture, the triton will produce a factor of 5 more scintillation light than the -particle. Tests by van Eijk [36] indicate 6600 scintillation photons per neutron event with a peak at a wavelength of 390 nm, which corresponds to 25% of the anthracene benchmark. The sensitivity of GS20 to gamma-rays is energy dependent. A threshold cut will eliminate the low-energy gamma-rays, but higher-energy gamma-rays can produce large pulses if the subsequent electrons (from Compton scattering or pair production) traverse sufficient thickness of GS20.
Our glass wafer was 1 mm thick and 50 mm 50 mm in area. The glass faces, apart from the edges, were polished and the wafer was fitted to the MAPMT window without any optical coupling medium. The index of refraction of GS20 is 1.55 at 395 nm. We have assumed that the 6Li distribution in our scintillating wafer was uniform.
2.2.2 Multi-anode photomultiplier tube
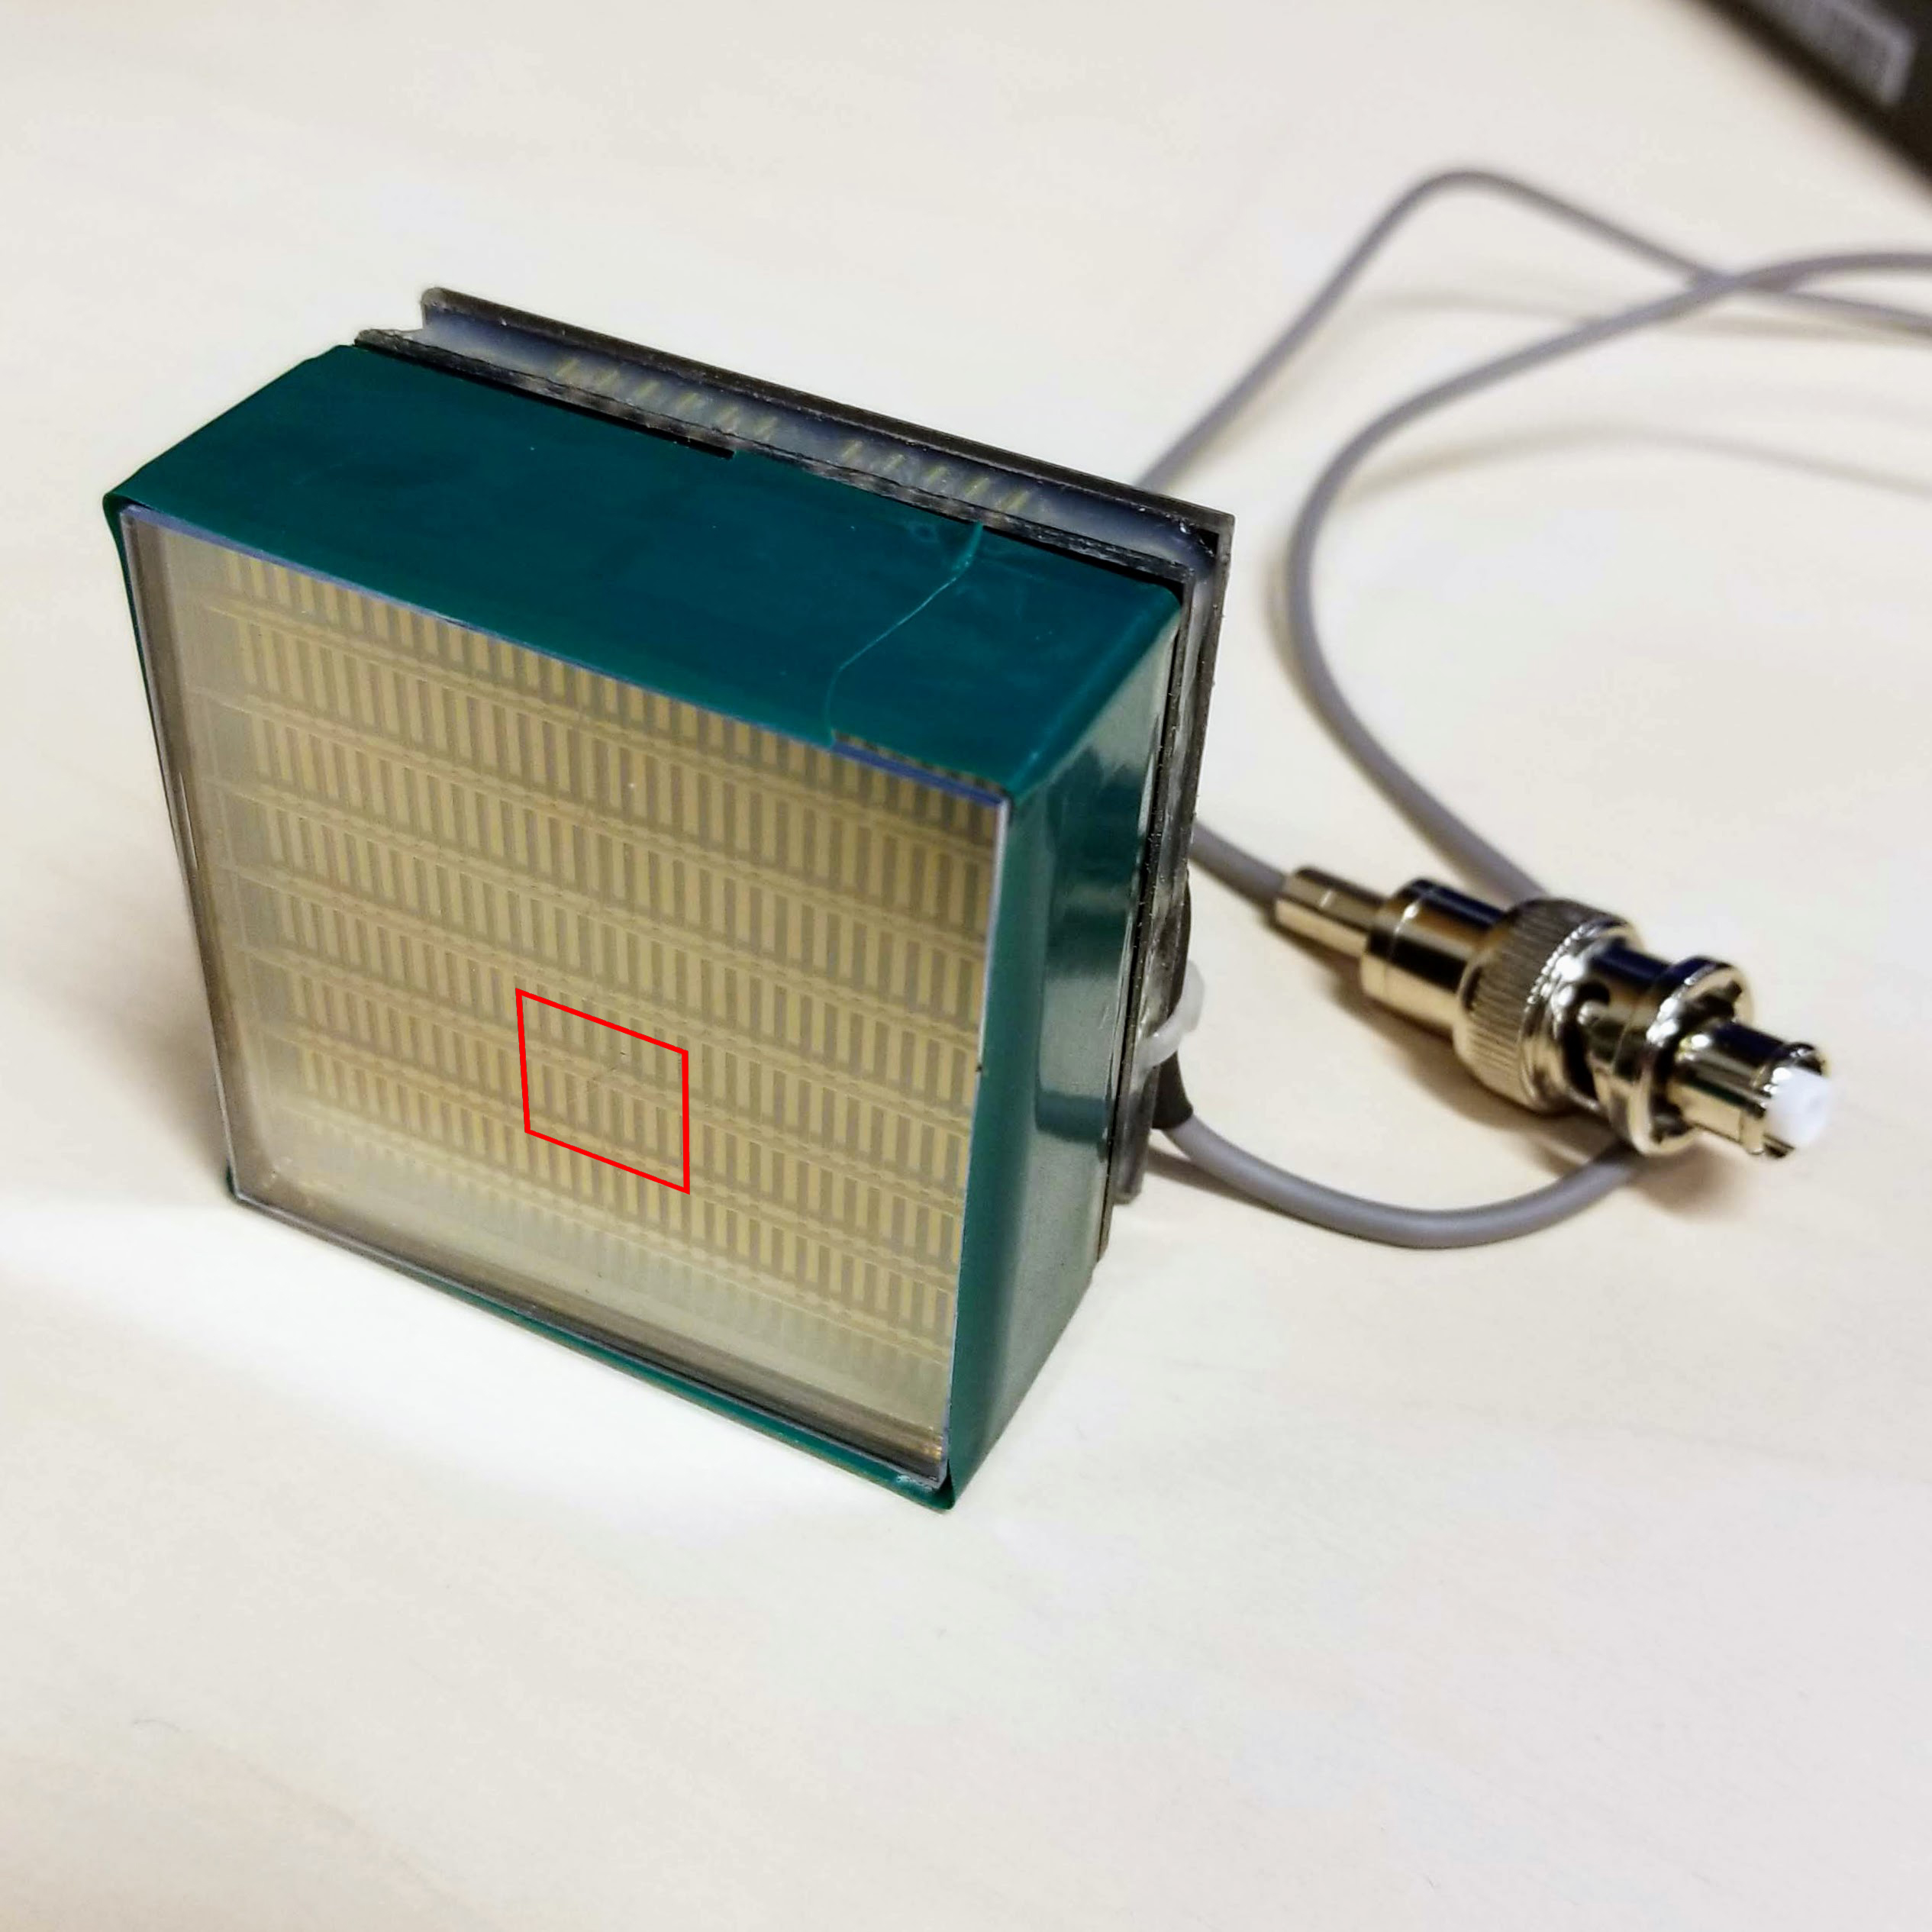
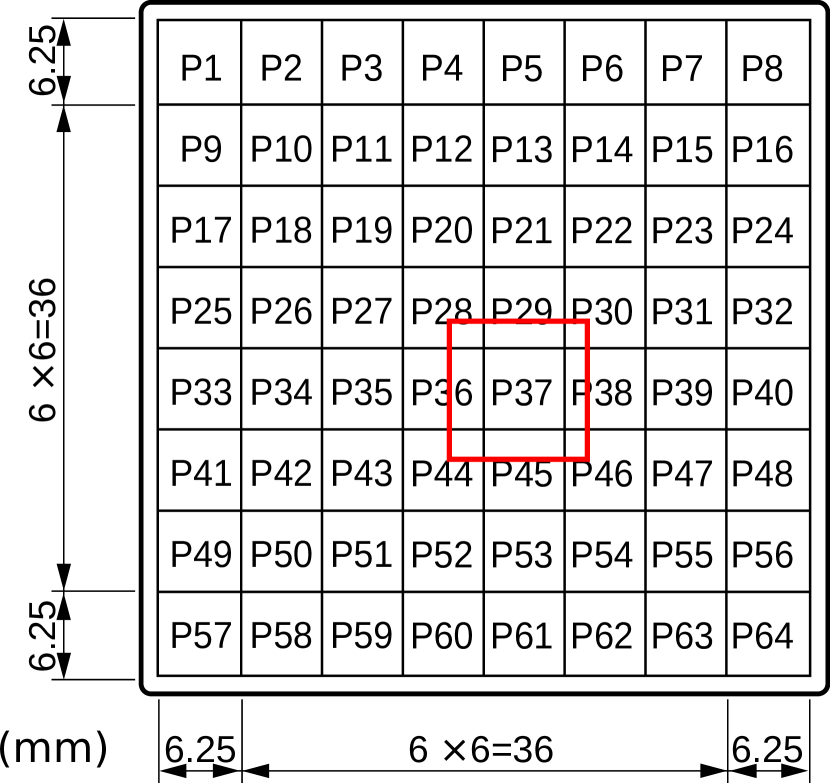
The Hamamatsu type H12700 MAPMT employed in the SoNDe detector prototype is an 8 8 pixel device with outer dimensions 52 mm 52 mm and an active cathode area of 48.5 mm 48.5 mm, resulting in a packing density of 87%. The bialkali photocathode produces a peak quantum efficiency of 33% at 380 nm wavelength, which is well matched to the GS20 scintillation. Compared to its predecessor type H8500 MAPMT, the H12700 MAPMT achieves similar overall gain, but with 10 as opposed to 12 dynode stages. The H12700 MAPMT employed for the present tests had a gain of 2.09 106 and a dark current of 2.67 nA at an anode-cathode potential of 1000 V. Each of the 64 6 6 mm2 pixels in the Hamamatsu 12700 MAPMT has a slightly different gain, which is measured and documented by the supplier. A typical H12700 MAPMT has a factor 2 variation in pixel gain (factor 3 worst case) [38]. The datasheet provided by Hamamatsu for the H12700 MAPMT used in this study had a worst case anode-to-anode gain difference of a factor 1.7. Figure 3 shows a photograph of the device together with a pixel map.
3 Measurement
The SoNDe detector prototype was irradiated using the collimated beams of -particles (Sec. 2.1) where the center of the beam was directed perpendicular to the face of the GS20 wafer. The downstream face of the source holder/collimator assembly was translated parallel to the surface of the scintillator wafer on an XY-coordinate scanner, powered by a pair of Thorlabs NRT150 stepping motors [39]. This was programmed to scan a lattice of irradiation points uniformly distributed across the face of the device. The entire assembly was located within a light-tight box and the temperature (25°), pressure (101.3 kPa), and humidity (30%) within the box were logged at the beginning and end of each measurement position. The anode signals from each of the pixels in the MAPMT were recorded using standard NIM and VME electronics. The positive polarity dynode-10 signal was shaped and inverted using an ORTEC 454 NIM timing filter amplifier producing a negative polarity signal with risetime 5 ns, falltime 20 ns, and amplitude some tens of mV, which was fed to an ORTEC CF8000 constant-fraction discriminator set to a threshold of 8 mV. The resulting NIM logic pulses with a duration of 150 ns provided a trigger for the data-acquisition system and a gate for the CAEN V792 VME charge-to-digital converters (QDCs) used to record the 64 anode pixel charges. A CAEN V2718 VME-to-PCI optical link bridge was used to sense the presence of a trigger signal and to connect the VMEbus to a Linux PC-based data-acquisition system. The digitized signals were recorded on disk and subsequently processed using ROOT-based software [40]. Data were recorded for 120 s at each point on a scan, so that in total a scan could take several hours.
4 Results
The gain-calibration datasheet provided by Hamamatsu may be used to correct for non-uniform response. However, previous work [18, 19, 20, 21, 22, 23, 25] has clearly suggested that mapping of pixel gains is highly dependent upon the irradiation conditions. Since our -particle beam results in very short (10s of ns) pulses of highly localized scintillation light, which are in sharp contrast to the steady-state irradiation measurement employed by Hamamatsu, we re-measured the gain-map of our MAPMT in situ using the equipment described previously. For each pixel, the 3 mm diameter -particle collimator was centered on the XY position of the pixel center of the MAPMT photocathode and 2200 -particle events were recorded. The resulting anode-charge distributions were well fitted with Gaussian functions (average per degree of freedom 1.50 with a variance of 0.14) and the means, , and standard deviations, , were recorded. The largest measured -value (corresponding to the pixel with the highest gain) was normalized to 100. The relative difference between the Hamamatsu gain-map values, , and the -scanned gain-map values, , was calculated as on a pixel-by-pixel basis. Figure 4 shows the results of our gain-map measurement, where the present results show significant differences to the Hamamatsu measurement. General trends in regions of high and low gain agree. Measurements of a sample of 30 H12700 MAPMTs revealed that the window face is not flat and was systematically 80 m lower at the center compared to the edges. The non-uniformity of the air gap between the GS20 and MAPMT window may be a partial cause of the gain discrepancy displayed in Fig. 4, as may reflections at the edges of the GS20 wafer. In the following, we use the present -scintillation generated gain-map, which in principle will embody non-uniform light-collection effects. Nonetheless, scintillation-light propagation through the SoNDe detector protoype is being studied in a GEANT4-based simulation [41, 42] in order to better understand these effects.
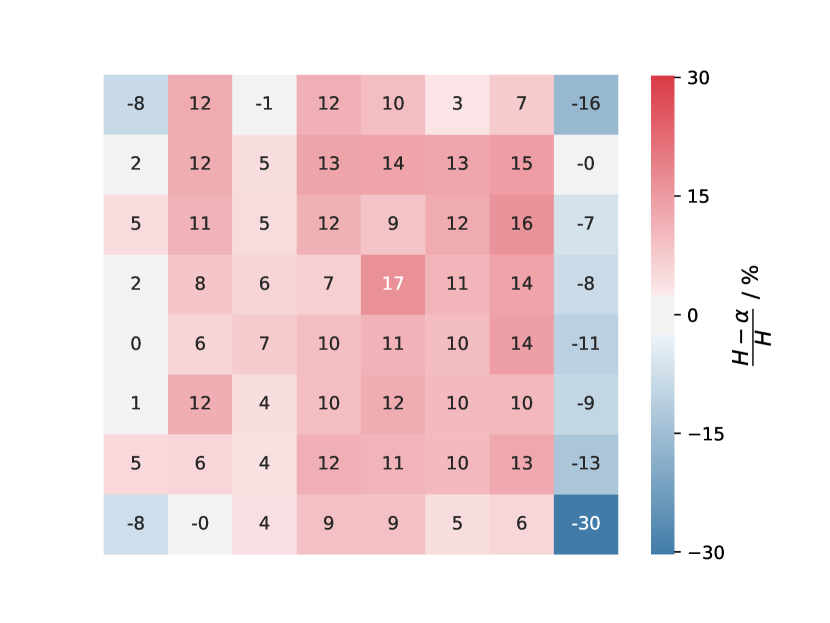
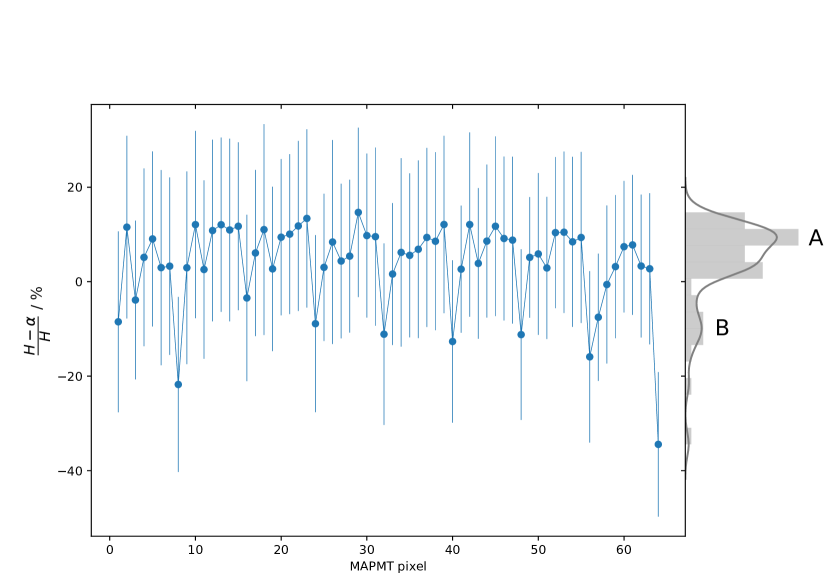
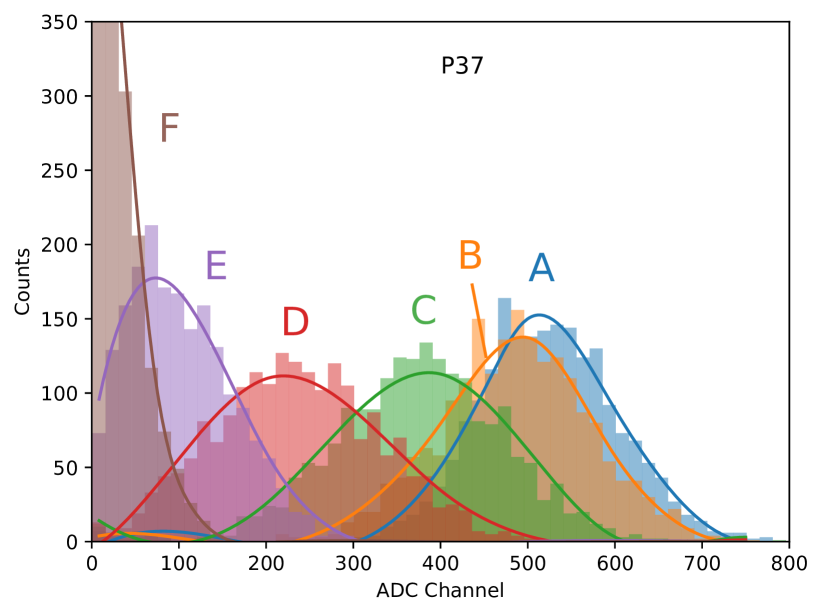
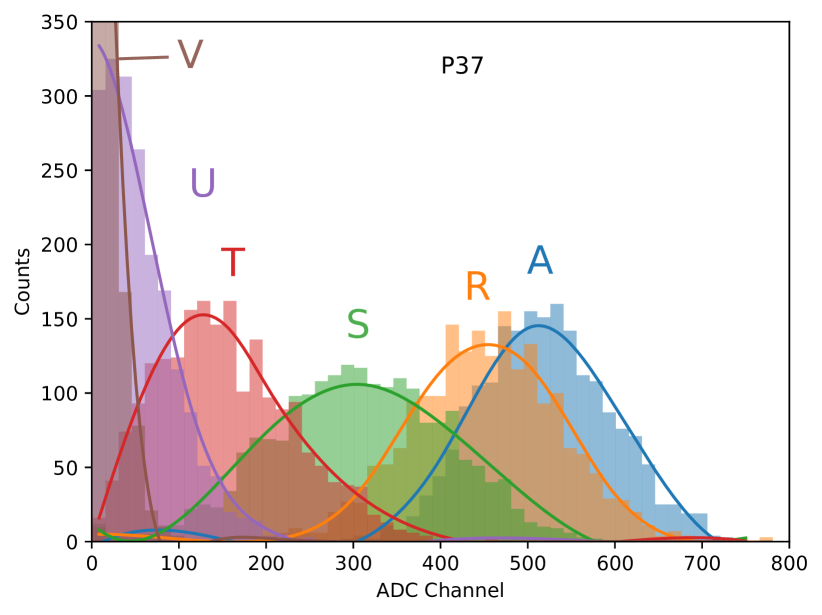
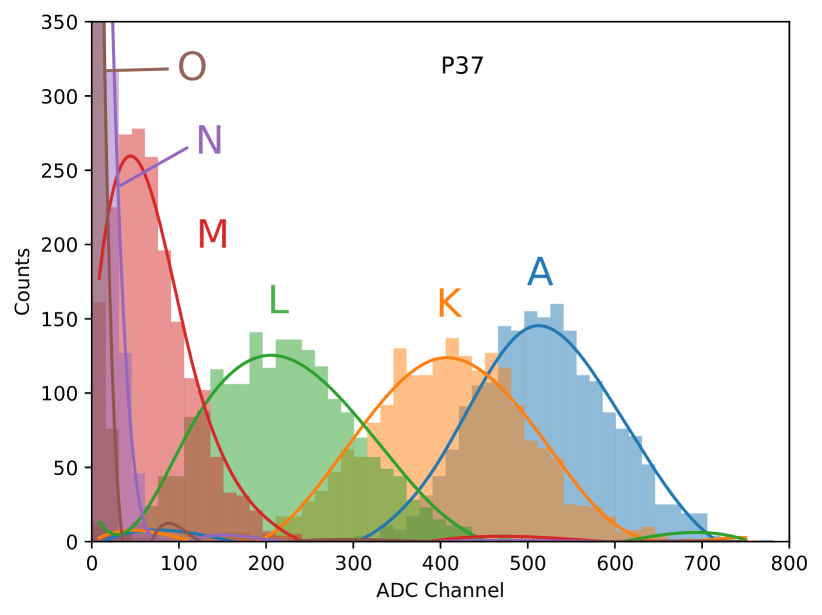
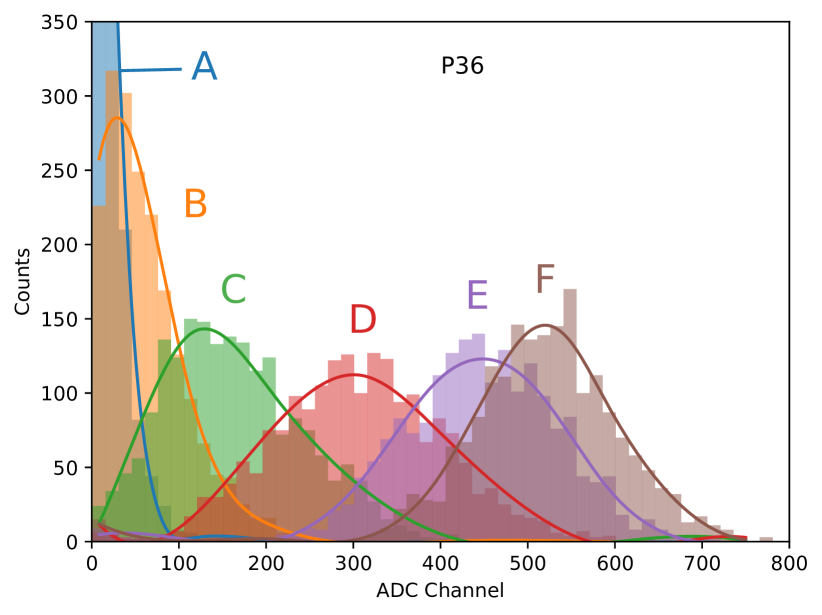
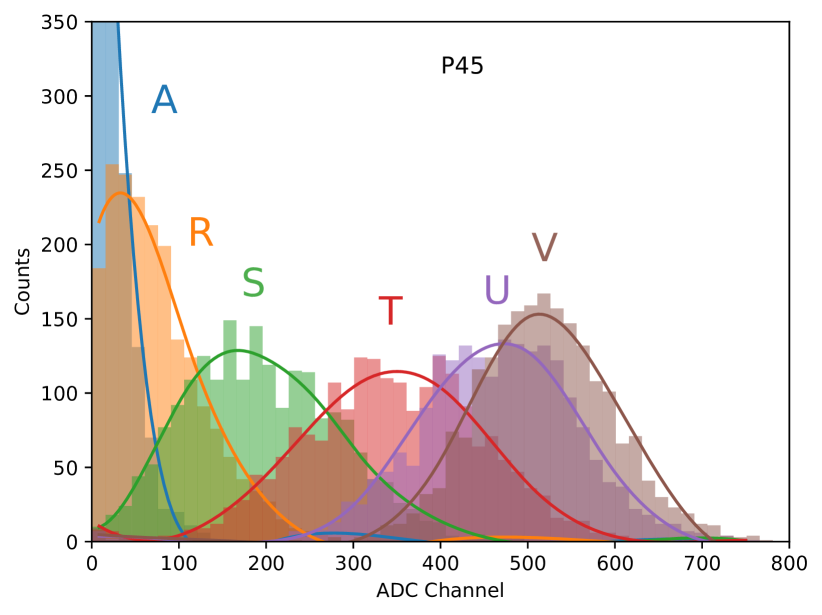
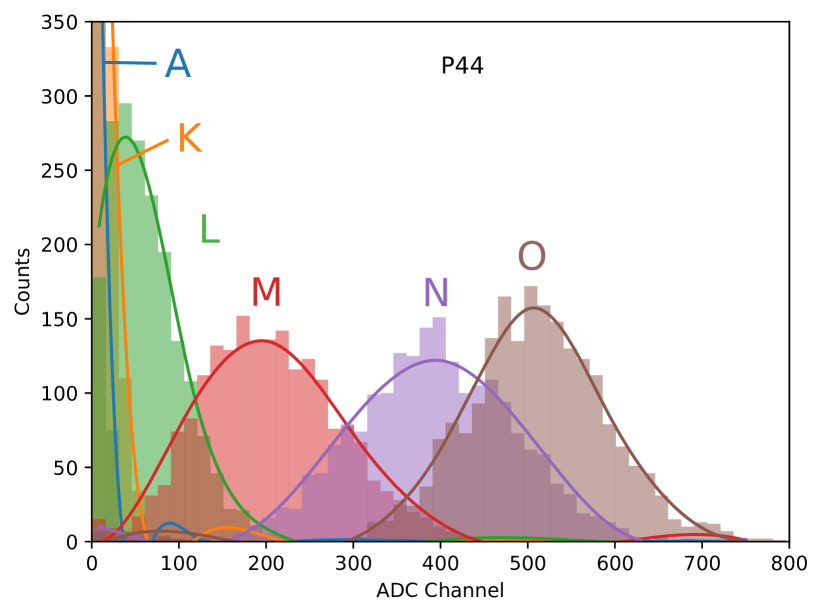
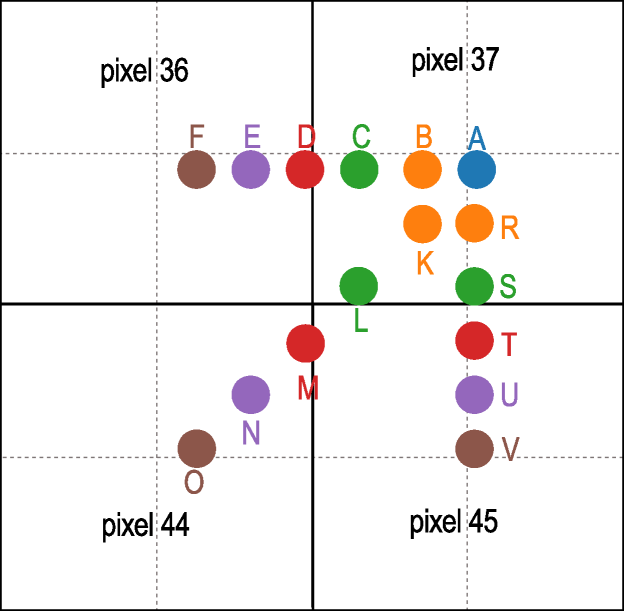
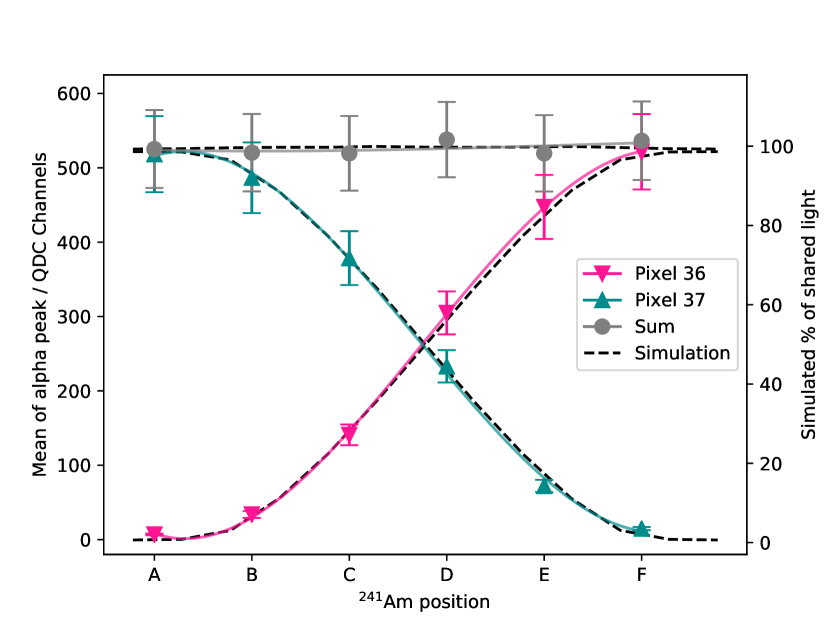
Figure 5 shows the positions of the 1 mm collimated -particle source employed for the horizontal, vertical, and diagonal XY scans. The positions are labeled A–V and color coded (5(d)). The -particle pulse-height spectra recorded at each of the scan positions are displayed in 5(a)–5(c) for pixels P36, P37, P44, and P45 which encompass the scan coordinates. The QDC pulse-height distributions have been pedestal subtracted and corrected for non-uniform pixel gain (Fig. 4). It is obvious that the efficiency of scintillation light collection in a single pixel is strongly dependent on the position of the -particle interaction. The signal amplitude is maximized when light is produced at the center of the pixel. This variation in amplitude with position may be seen more clearly in 5(e), which shows the mean of the pulse-height distributions as a function of interaction position for the horizontal scan (5(a)). The full curves are splines to guide the eye, while the dashed curves display the predictions of a ray-tracing simulation of light propagation [43]. The simulation is in good agreement with the measured data. After gain correction, these distributions should be symmetric about the pixel boundary locations. The system was aligned such that position D should have corresponded to the boundary between P36 and P37. However, the fits to the data suggest that the scan positions were offset by 0.2 mm to the left (Fig. 5(e)). Corresponding fits to the vertical-scan data show a 0.4 mm vertical offset. The sum of the means of the two adjacent pixels scanned is also displayed. This shows that the amount of light collected by the two pixels over which the scan is performed is independent of position.
In general, several pixels adjacent to the target pixel will collect some scintillation light and in principle, this could be used to better localize the position of the scintillation as in an Anger camera [44, 45]. While possible, this will not be the standard mode of operation for SoNDe modules running at ESS due to data-volume limitations. For production running at ESS, MAPMT pixels will be read and time-stamped on an event-by-event basis as lying either above or below per-pixel discriminator thresholds.
The multiplicity of pixels with a signal above discriminator threshold (the hit multiplicity denoted 1, 2, etc.) has been investigated as a function of the scintillation position and also the discrimination level. Figure 6 displays regions in the vicinity of P37 where 1, 2, and 3 predominate. Hits have been determined according to the pulse heights (Fig. 5) exceeding discrimination levels of 100 (6(b)), 235 (6(c)), and 500 (6(d)) QDC channels. At the 100-channel threshold, 1 events are confined to the center of a pixel. At the edges, events are predominantly 2, while in the corners, 3. To see any considerable 4 contributions around the pixel corners, lower thresholds are required as seen in Fig. 7. Raising the threshold to 235 channels extinguishes 2 and 3 almost completely. Raising even further to 500 channels serves merely to reduce the number of 1 events. The threshold level obviously affects the relative efficiency with which the SoNDe detector prototype registers 1, 2, etc. events, and Fig. 6 clearly shows that there is an optimum threshold value to maximize the number of 1 events detected and also to maximze the area of the detector where the 1 efficiency is high.

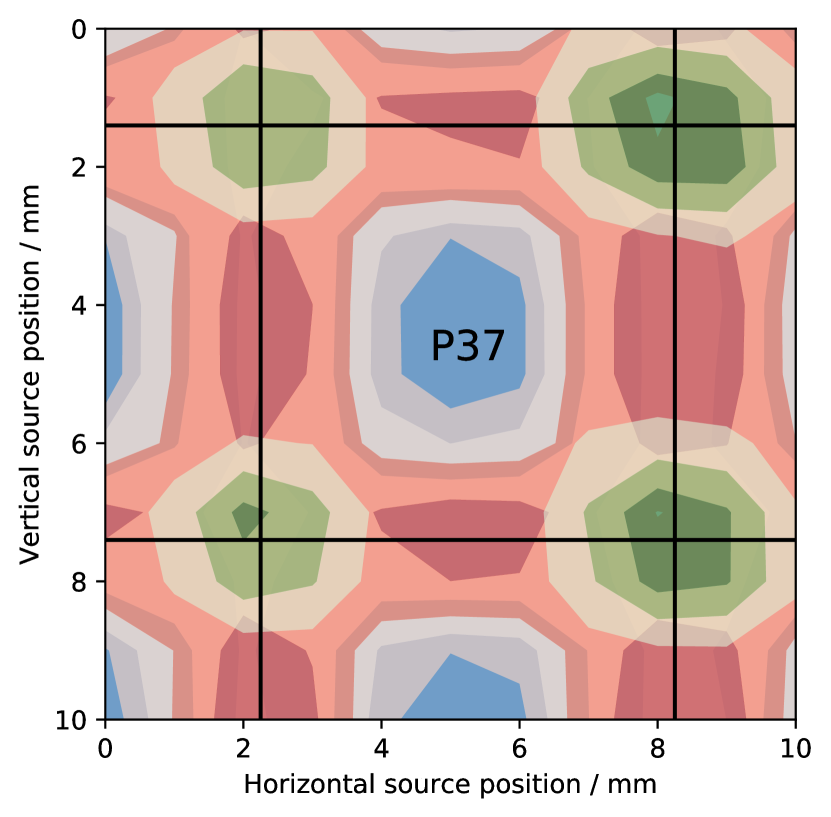
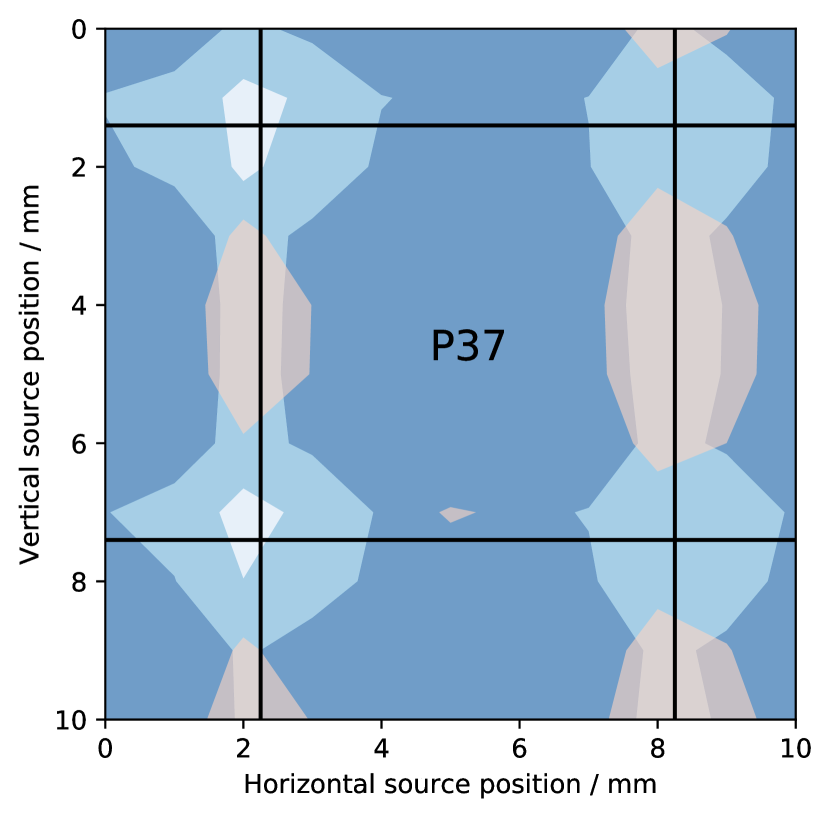
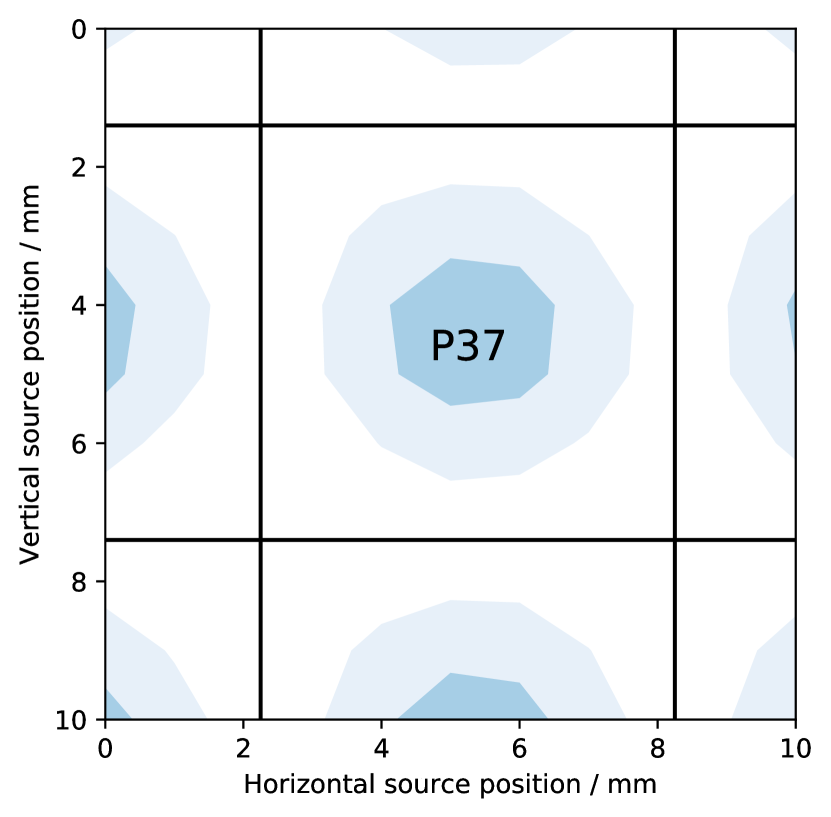
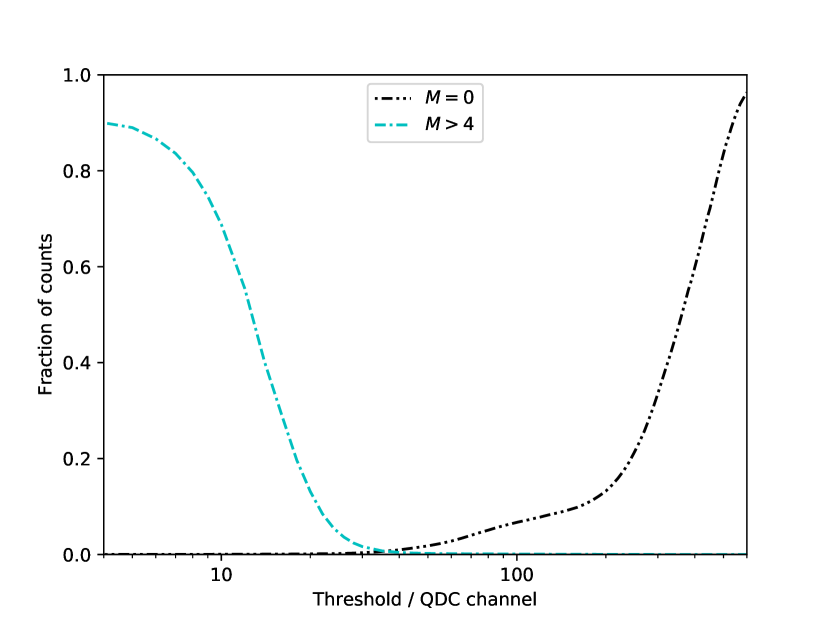
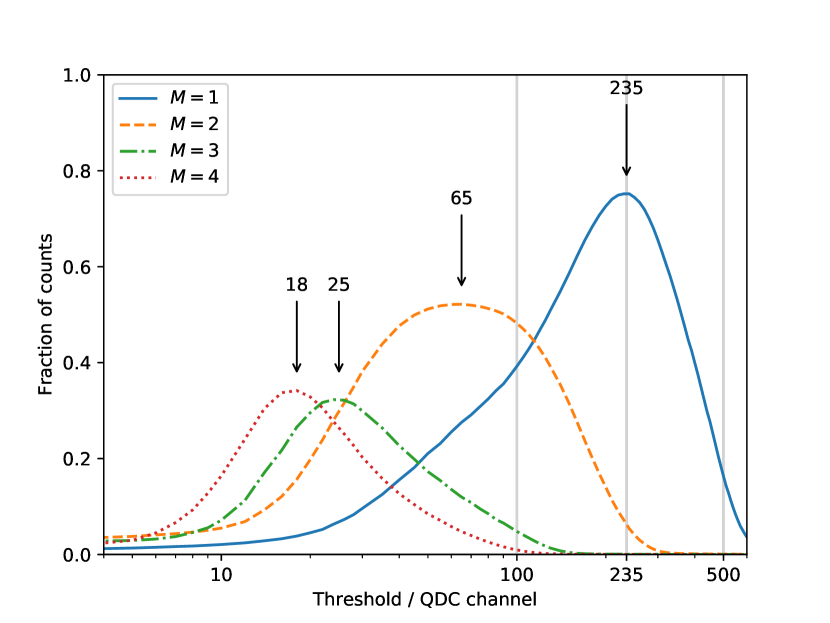
Figure 7 illustrates the trend in as a function of QDC threshold cut when a series of 36 -particle beam measurements were performed in a 6 6 grid covering the face of P37. Variable thresholds have been applied to the data, but in each case, the same cut has been applied to all pixels. Two “extreme” curves are shown in 7(a): the 0 curve and the 4 curve. The 0 curve corresponds to events which do not exceed the applied threshold in any pixel. 0 events start to register at a threshold of 30 channels and rise steeply after channel 200 to 95% at channel 600. The 4 curve corresponds to events which exceed the applied threshold in four or more pixels. At a threshold of 4 channels, 90% of events are 4, falling essentially to zero at channel 50. Four other curves are shown in 7(b): 1, 2, 3, and 4, corresponding to events which exceed the applied threshold in one, two, three, and four pixels, respectively. Each of these curves demonstrate clear maxima so that the analysis procedure may be “tuned” to select an event multiplicity by applying the appropriate threshold. The detection efficiency for 1 events peaks at 75% at a threshold of 235 channels, where 2, 3, and 4 have negligible efficiency as they peak at channels 65, 25, and 18, respectively.
5 Summary and Discussion
The position-dependent response of a SoNDe detector prototype, which consists of a 1 mm thick wafer of GS20 scintillating glass read out by an 8 8 pixel type H12700 MAPMT has been measured using a collimated 241Am source. The spreading of the scintillation light and the resulting distributions of charge on the MAPMT anodes were studied as a function of -particle interaction position by scanning the collimated -particle beam across the face of the MAPMT using a high precision XY coordinate translator.
Initially, pixel gain non-uniformity across the 64 MAPMT anodes was measured using the 3 mm collimated source positioned at each pixel center, which produced uniform illumination of the pixel centers. The results, which differ from relative gain data provided by the MAPMT manufacturer on the 10% level (Fig. 4), were used to correct all subsequent 1 mm scan data.
Anode charge distributions collected from each MAPMT pixel at each scanned coordinate show a strong position dependence of the signal amplitude. The single pixel signal is strongest when the source is located at the pixel center, and falls away as the pixel boundaries are approached (Fig. 5). At the pixel center, the signal tends to be concentrated in that pixel, while at pixel boundaries, the signal is shared between the adjacent pixels.
Rate and data-volume considerations for operation of SoNDe modules at ESS will require a relatively simple mode of operation for the SoNDe data-acquisition system. It will not be possible to read out multiple pixels to construct a weighted-mean interaction position as in an Anger Camera. Instead, it will be necessary to identify the pixel where the maximum charge occurs and record only the identity (P1 – P64) of that pixel. To this end, we studied the effect of signal amplitude thresholds on the multiplicity of pixel hits (that is, the number of signals above threshold) as a function of the -particle interaction position (Fig. 6). This study showed that there is an optimum discrimination level which maximizes the number of single-pixel or 1 hits. Below this level, multi-pixel hits start to dominate, while above this level, the single-pixel efficiency drops (Fig. 7). At the optimum discrimination level, which under the present operating conditions was channel 235, 75% of the -particle interactions were registered as single pixel.
Further work pertaining to the characterization of the SoNDe detector prototype is progressing in parallel to the project reported here. This includes the development of a simulation within the GEANT4 framework to complement and extend the ray-tracing simulation mentioned in this work. This GEANT4 model fully simulates the interactions of ionizing radiation in the GS20 and tracks the produced scintillation photons to the MAPMT cathode. It is being used to study the effects of optical coupling, surface finish, and partial pixelation (by machining grooves) of the GS20 wafer on the response of the detector. The relative response of a SoNDe detector prototype to different incident particle species is also being studied. Irradiation of a SoNDe detector prototype with a collimated beam of thermal neutrons has been performed and data analysis is nearing completion. An extension of these studies, where an optical diffuser is inserted between the GS20 and the MAPMT, is planned to examine a possible Anger camera mode of operation. And further position-dependence studies will be made using fine needle-like beams of a few MeV protons and deuterons produced by an accelerator. This will allow determination of the scintillation signal as a function of interacting particle species and will be complemented by work with fast-neutron and gamma-ray sources.
Acknowledgements
We thank Prof. David Sanderson from the Scottish Universities Environmental Research Centre for providing -spectroscopy facilities for the calibration of our 241Am source. We acknowledge the support of the European Union via the Horizon 2020 Solid-State Neutron Detector Project, Proposal ID 654124, and the BrightnESS Project, Proposal ID 676548. We also acknowledge the support of the UK Science and Technology Facilities Council (Grant nos. STFC 57071/1 and STFC 50727/1) and UK Engineering and Physical Sciences Research Council Centre for Doctoral Training in Intelligent Sensing and Measurement (Grant No. EP/L016753/1).
References
- [1] The European Spallation Source, https://europeanspallationsource.se/
- [2] K. Zeitelhack, Neutron News, vol. 23, no. 4, pp. 10–13, (2012).
- [3] D.A. Shea, D. Morgan, Technical Report R41419, Congressional Research Service, (2010).
- [4] R.T. Kouzes, PNNL-18388 Pacific Northwest National Laboratory, Richland, WA, (2009).
- [5] Solid-State Neutron Detector, https://cordis.europa.eu/project/rcn/194934_en.html
- [6] Jaksch, S. et al., arXiv:1701.08679.
- [7] S. Jaksch et al., Proc. Int. Conf. Neutron Optics (NOP2017), JPS Conf. Proc. 22 (2018) 011019. doi:10.7566/JPSCP.22.011019.
- [8] M. Heiderich et al., Nucl. Instr. and Meth. in Phys. Res. A 305 (1991) 423. doi:10.1016/0168-9002(91)90562-5.
- [9] G. Kemmerling et al., IEEE Trans. Nucl. Sci. 48 (2001) 1114. doi:10.1109/23.958733.
- [10] G. Kemmerling et al., IEEE Trans. Nucl. Sci. 51 (2004) 1098. doi:10.1109/TNS.2004.829576.
- [11] G. Kemmerling et al., IEEE Nucl. Sci. Symp. Conf. Rec 03CH37515 (2003) 722. doi:10.1109/NSSMIC.2003.1351801.
- [12] A.V. Feoktystov et al., J. Appl. Crystallogr. 48 (2015) 61. doi:10.1107/S1600576714025977.
- [13] S. Jaksch et al., Nucl. Instr. and Meth. in Phys. Res. A 762 (2014) 22. doi:10.1016/j.nima.2014.04.024.
- [14] R. Engels et al., IEEE Transactions on Nuclear Science, vol. 44, no. 3, June (1997) doi: 10.1109/23.603701
- [15] R. Engels et al., IEEE Transactions on Nuclear Science, vol. 45, no. 3, June (1998) doi: 10.1109/NSSMIC.1997.672706
- [16] R. Engels et al., IEEE Transactions on Nuclear Science, vol. 46, no. 4, Aug (1999) doi: 10.1109/23.790694
- [17] R. Engels et al., IEEE Transactions on Nuclear Science, vol. 49, no. 3, June (2002) doi: 10.1109/23.790694
- [18] S. Korpar et al., Nucl. Instr. and Meth. in Phys. Res. A 442 (2000) 316. doi:10.1016/S0168-9002(99)01242-5.
- [19] K. Rielage et al., Nucl. Instr. and Meth. in Phys. Res. A 463 (2001) 149. doi:10.1016/S0168-9002(01)00448-X.
- [20] T. Matsumoto et al., Nucl. Instr. and Meth. in Phys. Res. A 521 (2004) 367. doi:10.1016/j.nima.2003.11.384.
- [21] K. Lang et al., Nucl. Instr. and Meth. in Phys. Res. A 545 (2005) 852. doi:10.1016/j.nima.2005.02.041.
- [22] P. Abbon et al., Nucl. Instr. and Meth. in Phys. Res. A 595 (2008) 177. doi:10.1016/j.nima.2008.07.074.
- [23] R.A. Montgomery et al., Nucl. Instr. and Meth. in Phys. Res. A 695 (2012) 326, doi:10.1016/j.nima.2011.11.026.
- [24] Rachel Ann Montgomery, Nucl. Instr. and Meth. in Phys. Res. A 732 (2013) 732, doi:10.1016/j.nima.2013.08.012”.
- [25] R.A. Montgomery et al., Nucl. Instr. and Meth. in Phys. Res. A 790 (2015) 28. doi:10.1016/j.nima.2015.03.068.
- [26] X. Wang et al., Chinese Phys. C 40 (2016) 086003. doi:10.1088/1674-1137/40/8/086003.
- [27] F. Zai-Wei et al., Chinese Phys. C 36 (2012) 1095. doi:10.1088/1674-1137/36/11/010.
- [28] K.N Yu et al., Applied Radiation and Isotopes 59, (2003), doi: 10.1016/S0969-8043(03)00201-X.
- [29] F.W.K. Firk et al., Nucl. Instr. and Meth. 13 (1961) 313, doi:10.1016/0029-554X(61)90221-X.
- [30] A.R. Spowart Nucl. Instr. and Meth. 135 (1976) 441, doi:10.1016/0029-554X(76)90057-4.
- [31] A.R. Spowart Nucl. Instr. and Meth. 140 (1977) 19, doi:10.1016/0029-554X(77)90059-3.
- [32] E.J. Fairley et al., Nucl. Instr. and Meth. 150 (1978) 159, doi:10.1016/0029-554X(78)90360-9.
- [33] Scintacor, https://scintacor.com/products/6-lithium-glass/
- [34] B. Jamieson et al., Nucl. Instr. and Meth. in Phys. Res. A 790 (2015) 6, doi:10.1016/j.nima.2015.04.022.
- [35] A.W. Dalton, Nucl. Instr. and Meth. in Phys. Res. A 254 (1987) 361. doi:10.1016/0168-9002(87)90685-1.
- [36] C.W.E. van Eijk et al., Nucl. Instr. and Meth. in Phys. Res. A 529 (2004) 260. doi:10.1016/j.nima.2004.04.163.
- [37] G. Kemmerling, S. Jaksch, Forschungszentrum Jülich, Solid-State Neutron Detector INFRADEV-1-2014/H2020, Grant Agreement Number: 654124.
- [38] Hamamatsu Photonics, https://www.hamamatsu.com/resources/pdf/etd/H12700_TPMH1348E.pdf
- [39] Thorlabs, Inc., http://www.thorlabs.com.
- [40] R. Brun et al., Nucl. Instr. and Meth. in Phys. Res. A 389 (1997) 81. See also http://root.cern.ch/.
- [41] S. Agostinelli et al., Nucl. Instr. and Meth. in Phys. Res. A. 506, (2003) 250, doi: 10.1016/S0168-9002(03)01368-8.
- [42] J. Allison et al., IEEE Trans. Nucl. Sci. 53, (2006) 270, doi: 10.1109/TNS.2006.869826.
- [43] Ray Optics Simulation, an open-source web application to simulate reflection and refraction of light. https://ricktu288.github.io/ray-optics/.
- [44] H.O. Anger, Rev. Sci. Inst. 29, (1958) 27. doi: 10.1063/1.1715998
- [45] R.A. Riedel et al., Nucl. Instr. and Meth. in Phys. Res. A. 794, (2015) 224, doi: 10.1016/j.nima.2015.05.026.