Simulating X-ray Absorption Spectra With Linear-Response Density Cumulant Theory
Abstract
We present a new approach for simulating X-ray absorption spectra based on linear-response density cumulant theory (LR-DCT) [Copan, A. V.; Sokolov, A. Yu. J. Chem. Theory Comput., 2018, 14, 4097–4108]. Our new method combines the LR-ODC-12 formulation of LR-DCT with core-valence separation approximation (CVS) that allows to efficiently access high-energy core-excited states. We describe our computer implementation of the CVS-approximated LR-ODC-12 method (CVS-ODC-12) and benchmark its performance by comparing simulated X-ray absorption spectra to those obtained from experiment for several small molecules. Our results demonstrate that the CVS-ODC-12 method shows a good agreement with experiment for relative spacings between transitions and their intensities, but the excitation energies are systematically overestimated. When comparing to results from excited-state coupled cluster methods with single and double excitations, the CVS-ODC-12 method shows a similar performance for intensities and peak separations, while coupled cluster spectra are less shifted, relative to experiment. An important advantage of CVS-ODC-12 is that its excitation energies are computed by diagonalizing a Hermitian matrix, which enables efficient computation of transition intensities.
![[Uncaptioned image]](/html/1812.08827/assets/x1.png)
1 Introduction
Near-edge X-ray absorption spectroscopy (NEXAS) is a powerful and versatile experimental technique for determining the geometric and electronic structure of a wide range of chemical systems. The NEXAS spectra probe excitations of core electrons into the low-lying unoccupied molecular orbitals. Due to the localized nature of core orbitals, these excitations are very sensitive to the local chemical environment, providing important information about molecular structure. Recent advances in experimental techniques for generating and detecting X-ray radiation have spurred the development of NEXAS and its applications in chemistry and biology.1, 2, 3, 4, 5, 6, 7
Theoretical simulations of X-ray absorption play a critical role in interpretation of the NEXAS spectra.8 However, computations of the core-level excitations are very challenging as they require simulating excited states selectively in the high-energy spectral region and a balanced treatment of electron correlation, orbital relaxation, and relativistic effects, often combined with large uncontracted basis sets. Many of the popular excited-state methods have been adopted for simulations of X-ray absorption spectra, including linear-response,9, 10, 11, 12, 13, 14 real-time,15, 16, 17 and orthogonality-constrained18, 19 density functional theory, configuration interaction,20, 21, 22, 23, 24, 25 algebraic diagrammatic construction (ADC),26, 27, 28, 5, 29, 30 as well as linear-response (LR-) and equation-of-motion (EOM-) coupled cluster (CC) theories.31, 32, 33, 34, 35, 36, 37, 38, 39, 40, 41, 42, 43, 44 Among these approaches, CC methods have been shown to yield particularly accurate results for core excitation energies and intensities of small molecules.
Several techniques to compute the NEXAS spectra within the framework of CC theory have been developed. These approaches usually incorporate up to single and double excitations in the description of electron correlation (CCSD), but employ different strategies to access high energies required to excite core electrons. For example, in the complex polarization propagator-based CC theory (CPP-CC),34, 35, 36, 37, 38 core-level excitations are probed directly by computing the CC linear-response function over a grid of input frequencies in the X-ray region. In the energy-specific EOM-CC approach (ES-EOM-CC),40 the high-energy excitations are computed by using a frequency-dependent non-Hermitian eigensolver. In practice, both CPP-CC and ES-EOM-CC can only be applied to narrow spectral regions that need to be selected a priori. This problem is circumvented in the time-dependent,43 multilevel,42 and core-valence-separated41, 44 EOM-CC methods that can be used to compute NEXAS spectra for broad spectral regions and a large number of electronic transitions.
In this work, we present an implementation of the recently developed linear-response density cumulant theory (LR-DCT)45 for simulating the NEXAS spectra of molecules. Although the origin of LR-DCT is in reduced density matrix theory,46, 47, 48, 49, 50, 51 it has a close connection with LR-CC methods, such as linear-response formulations of linearized, unitary, and variational CC theory.52, 53, 54, 55, 56, 57, 58 In our previous work, we have demonstrated that one of the LR-DCT methods (LR-ODC-12) provides very accurate description of electronic excitations in the UV/Vis spectral region.45 In particular, for a set of small molecules, LR-ODC-12 showed mean absolute errors in excitation energies of less than 0.1 eV, with a significant improvement over EOM-CC with single and double excitations (EOM-CCSD). We have also demonstrated that LR-ODC-12 provides accurate description of challenging doubly excited states in polyenes.
Here, we test the accuracy of LR-ODC-12 for simulations of core-level excitations. To efficiently access the X-ray spectral region, our new LR-ODC-12 implementation employs the core-valence separation (CVS) technique,59, 60 originally developed in the framework of ADC theory26, 27, 28, 5, 29, 30 and later extended to other methods.9, 41, 44 We test our new method (denoted as CVS-ODC-12) against LR-ODC-12 to assess the accuracy of the CVS approximation and benchmark its results for a set of small molecules.
2 Theory
2.1 Density Cumulant Theory (DCT)
We start with a short overview of density cumulant theory (DCT).61, 62, 63, 64, 65, 66, 67 The exact electronic energy of a stationary state can be expressed in the form
| (1) |
where the one- and antisymmetrized two-electron integrals ( and ) are traced with the reduced one- and two-body density matrices ( and ) over all spin-orbitals in a finite one-electron basis set. Starting with Eq. 1, DCT expresses and in terms of the fully connected contribution to called the two-body density cumulant ().68, 69, 70, 71, 48, 72, 73, 74, 75, 76 For , this is achieved using a cumulant expansion
| (2) |
where the first two terms represent a disconnected antisymmetrized product of the one-body density matrices. To determine from , the following non-linear relationship is used64
| (3) |
where the r.h.s. of Eq. 3 contains a partial trace of density cumulant. Eqs. 2 and 3 are exact, so that substituting in the exact yields the exact electronic densities and energy.
In practice, DCT computes the electronic energy by parametrizing and determining density cumulant directly, circumventing computation of the many-electron wavefunction. This is achieved by choosing a specific Ansatz for the wavefunction and expressing density cumulant as66
| (4) |
where is a two-body second-quantized operator and the subscript indicates that only fully connected terms are retained. The most commonly used parametrization of , denoted as ODC-12,64, 65 consists of approximating Eq. 4 using a two-body unitary transformation of truncated at the second order in perturbation theory
| (5) |
where is the double excitation operator with respect to the reference determinant , whose parameters are determined to make the electronic energy in Eq. 1 stationary. The ODC-12 energy is also made stationary with respect to the variation of molecular orbitals parametrized using the unitary singles operator .65 The parameters of the and operators determined from the stationarity conditions are used to compute the ODC-12 energy.
2.2 Linear-Response DCT (LR-DCT)
In conventional DCT, electronic energy and molecular properties are determined for a single electronic state (usually, the ground state). To obtain access to excited states, we have recently combined DCT with linear-response theory that allows to compute excitation energies and transition properties for a large number of states simultaneously.45 In linear-response DCT (LR-DCT), we consider the behavior of an electronic system under a time-dependent perturbation , which can be described using the time-dependent quasi-energy function77, 78
| (6) |
Here, is the so-called “phase-isolated” wavefunction, which reduces to the usual time-independent wavefunction in the stationary state limit. Importantly, for a periodic time-dependent perturbation, the quasi-energy averaged over a period of oscillation () is variational with respect to the exact time-dependent state.78 Such periodicity implies that the amplitude can be written in a Fourier series
| (7) |
where the sum includes positive and negative values for all frequencies such that is real-valued.
To obtain information about excited states, is made stationary with respect to all of the parameters that define the time-dependent wavefunction .79 We refer interested readers to our previous publication45 for derivation of the LR-DCT equations and summarize only the main results here. The LR-DCT excitations energies are computed by solving the generalized eigenvalue problem
| (8) |
In Eq. 8, are the excitation energies, is the LR-DCT Hessian matrix that contains second derivatives of the electronic energy with respect to parameters of the and operators, and is the metric matrix that originates from second derivatives of the time-derivative overlap . Importantly, the LR-DCT Hessian matrix is Hermitian, which ensures that the excitation energies have real values, provided that the Hessian is positive semidefinite. The generalized eigenvectors can be used to determine the oscillator strength for each transition
| (9) |
where is the transition dipole moment matrix element and is the so-called property gradient vector.80, 81
In the linear-response formulation of the ODC-12 method (LR-ODC-12),45 the and matrices in Eq. 8 have the following form:
| (10) |
| (11) |
where the and ( and ) matrices contain second derivatives of the DCT energy with respect to parameters of the () operators, whereas and represent mixed second derivatives. Each block of and describe coupling between electronic excitations or deexcitations of different ranks. Specifically, the , , and blocks correspond to interaction of single excitations with single excitations, single excitations with double excitations, and double excitations with each other, respectively. Similarly, the block couples single excitations with single deexcitations, whereas and couple single-double and double-double excitation/deexcitation pairs. Finally, , , and describe interaction of single and double deexcitations. The solution of the LR-ODC-12 eigenvalue problem (8) has computational scaling, where and are the numbers of occupied and virtual orbitals, respectively.
2.3 Core-Valence-Separated LR-ODC-12 (CVS-ODC-12)
The LR-ODC-12 generalized eigenvalue problem (8) can be solved iteratively using one of the multi-root variations of the Davidson algorithm.82, 83 This iterative method proceeds by forming an expansion space for the generalized eigenvectors starting with an initial (guess) set of unit trial vectors and progressively growing this space until the lowest eigenvectors are converged. While such algorithm is very efficient for computing excitations of electrons in the valence orbitals, it is not suitable for simulations of the X-ray absorption spectra as it would require converging thousands of roots simultaneously to reach the energies necessary to promote core electrons.
A computationally efficient solution to this problem called core-valence separation (CVS) approximation has been proposed by Schirmer and co-workers within the framework of the ADC methods.26, 27, 28, 5, 29, 30 In this approach, the occupied orbitals are divided into two sets: core, corresponding to the orbitals probed by core-level excitations, and valence, which contain the remaining occupied orbitals. The CVS approximation relies on the energetic and spatial separation of core and valence occupied orbitals59, 60 and consists in retaining excitations that involve at least one core orbital while neglecting all excitations from valence orbitals. The CVS approach can be combined with existing implementations of excited-state methods based on the Davidson or Lanczos eigensolvers, providing efficient access to core-level excitation energies.
We have implemented the CVS approximation within our LR-ODC-12 program. The resulting CVS-ODC-12 algorithm solves the reduced eigenvalue problem of the form
| (12) |
where and are the reduced Hessian and metric matrices. These matrices are constructed from the and matrices in Eqs. 10 and 11 by selecting the matrix elements corresponding to excitations and deexcitations involving at least one core orbital and setting all of the other elements to zero. For example, out of all matrix elements of the single excitation block in Eq. 10, the CVS-ODC-12 Hessian includes only the matrix elements, where we use the and labels to denote core and virtual orbitals, respectively, and reserve labels for the valence occupied orbitals. Similarly, for the single deexcitation block , only the elements are included in the CVS-ODC-12 approximation.
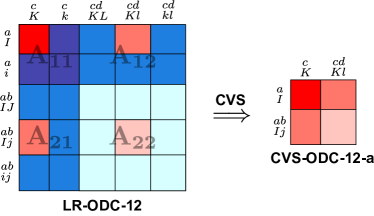
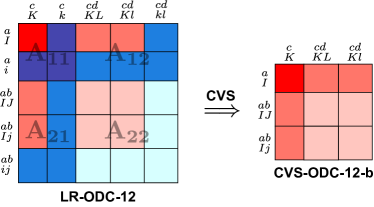
For the matrix blocks involving double excitations or deexcitations (e.g., or ), we consider two different CVS schemes. In the first scheme, termed CVS-ODC-12-a, matrix elements corresponding to double excitations or deexcitations with only one core label are included (e.g., or ), while they are set to zero if a double excitation/deexcitation contains two core indices (e.g., or ). This CVS approximation is similar to the one used in the ADC methods.26, 27, 28, 5, 29, 30 In the second CVS scheme, denoted as CVS-ODC-12-b, all elements corresponding to double excitations or deexcitations with either one or two core labels are included (e.g., , , etc.). This CVS approximation has been previously used in combination with the EOM-CCSD method.41, 44 Figure 1 illustrates the two CVS approximations for the excitation blocks , , , and of the LR-ODC-12 Hessian matrix in Eq. 10. Other blocks of the reduced and matrices can be constructed in a similar way. In Section 4.1, we will analyze the accuracy of the CVS-ODC-12-a and CVS-ODC-12-b approximations by comparing their results with those obtained from the LR-ODC-12 method.
3 Computational Details
The CVS-ODC-12-a and CVS-ODC-12-b methods were implemented in a standalone Python program. To obtain the one- and two-electron integrals, our program was interfaced with Psi484 and Pyscf.85 Our implementation of the CVS eigenvalue problem (12) is based on the multi-root Davidson algorithm,82, 83 where all vectors and matrix-vector products are constructed as outlined in Section 2.3. We validated our CVS-ODC-12 implementations against a modified version of the LR-ODC-12 program,45 where the CVS approximation was introduced using the projection technique described by Coriani and Koch.41
In all of our computations, all electrons were correlated. For all systems, except ethylene and formic acid, we used the doubly-augmented core-valence d-aug-cc-pCVTZ basis set,86 where the second set of diffuse functions (d-) was included only for s- and p-orbitals. We refer to this modified basis set as d(s,p)-aug-cc-pCVTZ. In a study of ethylene (\ceC2H4), the d(s,p)-aug-cc-pCVTZ basis was used for carbon atoms, while the aug-cc-pVTZ basis was used for the hydrogen atoms. For formic acid (\ceHCO2H), we used the d(s,p)-aug-cc-pCVTZ basis for the carbon and oxygen atoms and the aug-cc-pVDZ basis for the hydrogens.
The CVS-ODC-12 X-ray absorption spectra were visualized by plotting the spectral function
| (13) |
computed for a range of frequencies , where are the CVS-ODC-12 excitation energies from Eq. 12, is a small imaginary broadening, and the matrix elements are obtained according to Eq. 9. The simulated spectra were compared to experimental spectra that were digitized using the WebPlotDigitizer program.87 Electronic transitions were assigned based on the spin and spatial symmetry of excitations, as well as the contributions to the generalized eigenvectors in Eq. 12.
4 Results
4.1 Accuracy of the CVS Approximations
| LR-ODC-12 | CVS-ODC-12-a | CVS-ODC-12-b | ||||
| Excitation | Energy | Energy | Energy | |||
| CO (C-edge, STO-3G) | ||||||
| S1 (C) | 289.13 | 8.716 | 289.16 | 6.565 | 289.11 | 8.206 |
| S2 | 295.55 | 0.004 | 295.54 | 0.012 | 295.54 | 0.014 |
| S3 | 295.84 | 295.84 | 295.84 | |||
| T1 (C) | 288.14 | 288.16 | 288.14 | |||
| T2 | 294.17 | 294.15 | 294.15 | |||
| T3 | 294.77 | 294.76 | 294.75 | |||
| CO (O-edge, STO-3G) | ||||||
| S1 (O) | 543.43 | 4.402 | 543.47 | 4.275 | 543.43 | 4.275 |
| S2 | 550.03 | 550.04 | 550.03 | |||
| S3 | 553.30 | 553.31 | 553.30 | |||
| T1 (O) | 542.96 | 542.99 | 542.96 | |||
| T2 | 546.94 | 546.94 | 546.94 | |||
| T3 | 549.93 | 549.93 | 549.93 | |||
| \ceH2O (6-31G) | ||||||
| S1 (O) | 541.50 | 2.452 | 541.64 | 2.383 | 541.49 | 2.396 |
| S2 (O) | 543.34 | 4.945 | 543.46 | 4.841 | 543.33 | 4.862 |
| S3 | 561.08 | 10.781 | 561.21 | 10.754 | 561.07 | 10.770 |
| T1 (O) | 540.46 | 540.54 | 540.45 | |||
| T2 (O) | 542.27 | 542.37 | 542.26 | |||
| T3 | 558.89 | 558.98 | 558.88 | |||
| 0.04 | 0.078 | 0.01 | 0.031 | |||
| 0.13 | 2.151 | 0.02 | 0.510 | |||
| 0.05 | 0.358 | 0.01 | 0.090 | |||
We begin by comparing the accuracy of the CVS-ODC-12-a and CVS-ODC-12-b approximations described in Section 2.3. Table 1 shows core excitation energies and oscillator strengths of CO and \ceH2O computed using the full LR-ODC-12 method and the two CVS methods with small basis sets (STO-3G and 6-31G, respectively), for which it was possible to compute the LR-ODC-12 core-excited states using a conventional Davidson algorithm. Out of the two CVS approximations, the best agreement with LR-ODC-12 is shown by CVS-ODC-12-b that neglects excitations from valence orbitals while retaining all excitations with at least one core label. The superior performance of CVS-ODC-12-b is reflected by its mean absolute error () and standard deviation of errors () that do not exceed 0.01 eV, relative to LR-ODC-12, for a combined set of 36 electronic transitions (see Supporting Information for a complete set of data). The CVS-ODC-12-a approximation, which additionally neglects double excitations from core to virtual orbitals (Figure 1), exhibits much larger and values of 0.04 and 0.05 eV, respectively. Although for CO with the STO-3G basis set the CVS-ODC-12-a errors are in the range of 0.01-0.04 eV, they increase up to 0.13 eV for \ceH2O, where a larger 6-31G basis set was used. These errors continue to grow with the size of the one-electron basis set. For example, for transition from the carbon orbital to the molecular orbital of CO (C), the CVS-ODC-12-a and CVS-ODC-12-b excitation energies computed using the aug-cc-pVTZ basis set are 289.1 and 288.1 eV, respectively, indicating a large ( 1.0 eV) error of the CVS-ODC-12-a approximation, relative to CVS-ODC-12-b. Similar results are observed when analyzing performance of the CVS approximations for oscillator strengths, where CVS-ODC-12-b shows much smaller errors compared to CVS-ODC-12-a.
Overall, our results demonstrate that using the CVS-ODC-12-b approximation has a very small effect on the core-level excitation excitation energies and oscillator strengths, while the errors of the CVS-ODC-12-a approximation are substantial, especially when large basis sets are used. The small errors introduced by the CVS approximation in CVS-ODC-12-b are consistent with the CVS errors in the CVS-EOM-CCSD method developed by Coriani and Koch,41 which employs the same single and double excitation space when constructing the reduced eigenvalue problem. Since the CVS-ODC-12-a and CVS-ODC-12-b approximations only differ in the treatment of double excitations from core to valence orbitals and the number of those excitations is usually small, the computational cost of the CVS-ODC-12-b approximation is similar to CVS-ODC-12-a. For this reason, we will use the CVS-ODC-12-b approximation for our study of core-level excitation energies in Section 4.2 and will refer to it as CVS-ODC-12 henceforth.
4.2 X-Ray Absorption of Small Molecules
4.2.1 Excitations Energies
| CVS-ODC-12 | Theory (reference) | Experiment | ||||
|---|---|---|---|---|---|---|
| Molecule | Excitation | Energy | Energy | Energy | ||
| \ceCH4 | C | 290.6 | 2.19 | 288.2a | 287.1 | |
| C | 291.4 | 0.51 | 289.6a | 288.0 | ||
| \ceC2H4 | C | 287.2 | 10.50 | 285.1b | 9.86b | 284.7 |
| C | 290.1 | 1.27 | 287.7b | 0.91b | 287.2 | |
| C | 290.7 | 4.08 | 288.4b | 2.75b | 287.9 | |
| \ceC2H2 | C | 288.2 | 9.89 | 287.1a | 285.8 | |
| C | 290.6 | 1.44 | 289.5a | 287.9 | ||
| C | 291.8 | 0.70 | 289.8a | 288.8 | ||
| HCN | C | 288.5 | 3.80 | 287.0c | 286.4 | |
| C | 291.3 | 1.41 | 289.9c | 289.1 | ||
| C | 293.3 | 1.07 | 290.6 | |||
| \ceH2CO | C | 287.7 | 6.63 | 286.8a | 285.6 | |
| C | 292.6 | 1.04 | 291.9a | 290.2 | ||
| C | 293.6 | 3.04 | 292.3a | 291.3 | ||
| CO | C | 288.6 | 7.14 | 288.0d | 16.56d | 287.3 |
| C | 294.7 | 0.45 | 293.0b | 0.38b | 292.5 | |
| C | 295.7 | 0.43 | 294.0b | 0.95b | 293.4 | |
| \ceH2O | O | 538.4 | 1.61 | 534.5d | 1.28d | 534.0 |
| O | 540.1 | 3.55 | 536.4d | 2.62d | 535.9 | |
| \ceH2CO | O | 535.2 | 5.28 | 532.3a | 530.8 | |
| O | 541.2 | 0.04 | 536.7a | 535.4 | ||
| O | 542.0 | 0.18 | 537.9a | 536.3 | ||
| CO | O | 538.5 | 4.41 | 534.5d | 8.13d | 534.1 |
| O | 543.6 | 0.14 | 539.7b | 0.10b | 538.8 | |
| O | 544.9 | 0.08 | 540.8b | 0.10b | 539.8 | |
| \ceNH3 | N | 404.2 | 0.76 | 401.2b | 0.63b | 400.8 |
| N | 405.9 | 2.96 | 402.9b | 4.00b | 402.5 | |
| N | 406.7 | 0.94 | 403.5b | 0.63b | 403.0 | |
| HCN | N | 403.1 | 4.26 | 400.6c | 399.7 | |
| N | 407.2 | 0.05 | 402.5 | |||
| \ceN2 | N | 403.7 | 12.49 | 402.0e | 22.84e | 401.0 |
| N | 409.4 | 0.56 | 407.6e | 0.45e | 406.1 | |
| N | 410.5 | 0.48 | 407.0 | |||
| HF | F | 692.2 | 2.45 | 689.1e | 2.26e | 687.4 |
| F | 696.0 | 0.74 | 692.8e | 0.59e | 690.8 | |
| F | 696.2 | 0.64 | 693.0e | 1.09e | 691.4 | |
| Excitation energies | Peak separations | |||||
| Excitations | ||||||
| C-edge | 2.5 | 3.5 | 0.5 | 0.3 | 1.0 | 0.3 |
| N-edge | 3.5 | 4.7 | 0.5 | 0.5 | 1.3 | 0.5 |
| O-edge | 4.8 | 5.8 | 0.6 | 0.5 | 1.4 | 0.6 |
| All | 3.5 | 5.8 | 1.1 | 0.4 | 1.4 | 0.4 |
In this section, we use the CVS-ODC-12 method to compute X-ray absorption spectra of small molecules. Table 2 shows the CVS-ODC-12 results for 36 core-level transitions of 10 molecules. For comparison, we also show best available theoretical results obtained from various formulations of coupled cluster theory,39, 44, 43, 34, 41 as well as excitation energies measured in the experiment.88, 89, 90, 91, 92, 93, 94, 95, 96, 97, 98, 99, 100, 101, 102 For all electronic transitions, the CVS-ODC-12 method correctly reproduces the order of peaks observed in the experimental spectra with transitions shifted to higher energies. These systematic shifts are exhibited by many electronic structure methods9, 10, 11, 12, 13, 14, 43, 34 and are usually attributed to basis set incompleteness error and incomplete description of dynamic correlation. As shown in Table 3, the magnitude of the computed shifts, given by the mean absolute errors () in the CVS-ODC-12 excitation energies relative to experiment, increases with increasing energy of the K-edge transition. In particular, for C-, N-, and O-edge excitations, increase in the following order: 2.5, 3.5, and 4.8 eV, respectively. Although depend on the type of K-edge excitation, the computed standard deviations of errors () do not change significantly with increasing excitation energy and are relatively small ( 0.5 eV), indicating the systematic nature of the observed shifts. This is also supported by the percentage of relative to average excitation energy of each edge, which remains relatively constant for C-, N-, and O-edge transitions (0.87 %, 0.87 %, and 0.88 %, respectively).
The CVS-ODC-12 excitation energies are also shifted relative to reference theoretical results from various coupled cluster methods (Table 2). The values for the computed shifts are 1.6, 2.5, and 3.9 eV for C-, N-, and O-edge transitions, indicating that the shifts in the reference coupled cluster excitation energies are less sensitive to the type of the K-edge transition than those of CVS-ODC-12. These differences may originate from the different treatment of dynamic correlation and orbital relaxation effects between CVS-ODC-12 and the reference methods, as well as differences in the one-electron basis sets.
4.2.2 Peak Separations
| Molecule | Excitation | CVS-ODC-12 | Theory (reference) | Experiment |
|---|---|---|---|---|
| \ceCH4 | C | 0.8 | 1.5a | 1.0 |
| \ceC2H4 | C | 2.8 | 2.6b | 2.6 |
| C | 0.7 | 0.7b | 0.6 | |
| \ceC2H2 | C | 2.4 | 2.5a | 2.1 |
| C | 1.2 | 0.3a | 0.9 | |
| HCN | C | 2.8 | 2.9c | 2.7 |
| C | 2.0 | 1.5 | ||
| \ceH2CO | C | 4.9 | 5.1a | 4.6 |
| C | 1.0 | 0.4a | 1.1 | |
| CO | C | 6.1 | 5.7b | 5.1 |
| C | 1.0 | 1.0b | 1.0 | |
| \ceH2O | O | 1.7 | 1.8d | 1.9 |
| \ceH2CO | O | 6.0 | 4.5b | 4.6 |
| O | 0.8 | 1.1b | 0.9 | |
| CO | O | 5.2 | 4.7b | 4.7 |
| O | 1.3 | 1.1b | 1.0 | |
| \ceNH3 | N | 1.6 | 1.7b | 1.7 |
| N | 0.8 | 0.7b | 0.5 | |
| HCN | N | 4.1 | 2.8 | |
| \ceN2 | N | 5.7 | 5.6e | 5.2 |
| N | 1.1 | 0.9 | ||
| HF | F | 3.8 | 3.7e | 3.4 |
| F | 0.2 | 0.1e | 0.6 |
We now discuss the accuracy of CVS-ODC-12 for simulating energy separation between peaks in X-ray absorption spectra. Table 4 shows peak separations computed using CVS-ODC-12 and coupled cluster methods along with experimental results. For most of the electronic transitions, the CVS-ODC-12 method shows a good agreement with experiment predicting peak separations within 0.5 eV from experimental values. This is reflected by its of 0.4 eV, relative to experiment (Table 3). Contrary to excitation energies, the errors in the CVS-ODC-12 peak spacings exhibit little dependence on the type of the K-edge transition, showing a somewhat smaller for C-edge excitations (0.3 eV) compared to that of the N- and O-edge transitions (0.5 eV). The accuracy of the CVS-ODC-12 peak separations is on par with that of the reference coupled cluster methods, which show of 0.3 eV with respect to experiment. The coupled cluster methods show a similar (0.3 eV) and a smaller (0.7 eV), in comparison to 0.4 eV and 1.4 eV of CVS-ODC-12, respectively.
4.2.3 Simulated Spectra
In this section, we compare X-ray absorption spectra computed using CVS-ODC-12 with those obtained from experiment for three polyatomic molecules: ethylene (\ceC2H4), formaldehyde (\ceH2CO), and formic acid (\ceHCO2H). Since basis sets employed in our study do not incorporate Rydberg functions, we only consider regions of spectra dominated by core-level transitions into the low-lying , , and orbitals. In addition to reporting the computed spectra, we provide the spectral data for all three molecules in the Supporting Information.
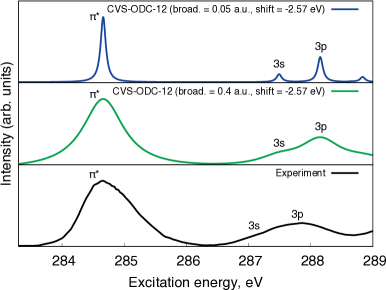
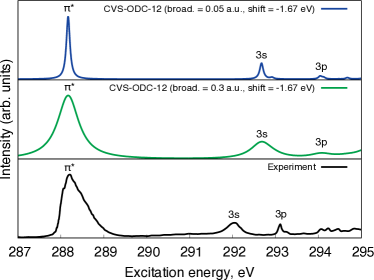
Figure 2 shows the C-edge spectra of ethylene computed using CVS-ODC-12 for two broadening parameters along with an experimental spectrum from Ref. 102. The simulated spectra were shifted by 2.57 eV to align the position of the first peak with the one in the experimental spectrum. The shifted CVS-ODC-12 spectra show a good agreement with experiment, reproducing the separation and relative intensity of the C, , and transitions. The CVS-ODC-12 method overestimates the relative positions of the and peaks by 0.2 eV, which is consistent with its of 0.3 eV from Table 3.
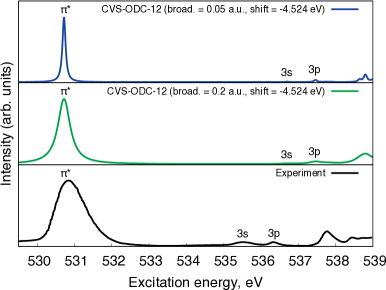
Figure 3 reports the computed C-edge and O-edge spectra of formaldehyde. Aligning positions of the C and O peaks with those in the experimental spectrum93 requires shifting the CVS-ODC-12 spectra by 2.00 and 4.524 eV, respectively, consistent with of 2.5 and 4.8 eV for excitation energies reported in Table 3. After the shift, the simulated C-edge spectrum reproduces position of the and peaks within 0.3-0.4 eV from experiment. The relative intensities of these transitions also agree well with those observed in the experimental spectrum. For oxygen edge, the agreement between CVS-ODC-12 and experiment is worse: the relative energies of the and transitions are overestimated by 1.3 eV. In addition, in the simulated spectrum the relative intensity of the peak is significantly lower than the one obtained in the experiment. The energy spacing between the and transitions (0.8 eV) is in a good agreement with that from the experimental spectrum (0.9 eV).
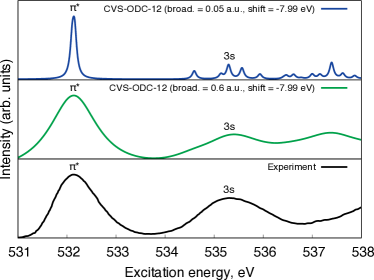
Finally, we consider formic acid as an example of a molecule with a more complicated X-ray absorption spectra. The computed CVS-ODC-12 spectra for carbon and oxygen edge are shown in Figure 4. Aligning simulated and experimental C-edge spectra requires a shift of 1.67 eV, while a large shift of 7.99 eV is needed for the oxygen edge. For carbon edge, the CVS-ODC-12 method shows a reasonable agreement with experiment for the transition with an error of 0.5 eV, while a larger error of 0.8 eV is observed for the third peak (). When considering the oxygen edge, the experimental spectrum103 shows two broad signals at 532.1 and 535.3 eV attributed to the O and O transitions, respectively. The CVS-ODC-12 O-edge spectrum reveals that the second signal originates from several closely spaced peaks corresponding to excitations into orbitals of all carbon and oxygen atoms, with significant contributions of excitations to orbitals. When using a large broadening parameter, these transitions form a broad signal with a maximum at 535.4 eV, in a very good agreement with experimental spectrum.
5 Conclusions
In this work, we have presented a new approach for simulations of X-ray absorption spectra based on linear-response density cumulant theory (LR-DCT). Our new method combines the LR-ODC-12 formulation of LR-DCT with core-valence separation approximation (CVS) that allows to efficiently access high-energy core-excited states. We considered two CVS approximations of LR-ODC-12 (CVS-ODC-12) that incorporate different types of excitations from core to virtual orbitals and compared their results with core-level excitation energies obtained from the full LR-ODC-12 method. Our results demonstrated that including double core-virtual excitations is crucial to maintain high accuracy of the CVS approximation for K-edge excitation energies, especially when using large one-electron basis sets.
We have used the CVS-ODC-12 method to compute X-ray absorption spectra of several small molecules and compared them to spectra obtained from experiment. The CVS-ODC-12 method shows a good agreement with experiment for spacings between transitions and their relative intensities, but the computed spectra are systematically shifted to higher energies. The magnitude of these shifts increases with increasing energy of the K-edge transition: for C-, N-, and O-edge transitions the CVS-ODC-12 excitation energies are shifted by 2.5, 3.5, and 4.8 eV, on average. However, the relative distances between transitions depend much less on the K-edge excitation energy, reproducing experimental peak spacings within 0.3-0.5 eV for most of the computed transitions. We have compared the CVS-ODC-12 results with X-ray absorption spectra computed using different formulations of excited-state coupled cluster theory with single and double excitations (CCSD). For peak spacings and intensities, the CVS-ODC-12 and CCSD methods show similar performance, but the CCSD spectra exhibit smaller shifts, particularly for N- and O-edge transitions. An important advantage of CVS-ODC-12 over the CCSD methods is that the former is based on the diagonalization of a Hermitian matrix, which enables efficient computation of transition intensities and guarantees that the resulting excitation energies have real values, provided that the matrix is positive semidefinite. Moreover, the CVS-ODC-12 and CCSD methods have the same computational scaling with the size of the one-electron basis set .
Overall, our results suggest that CVS-ODC-12 is a useful method for qualitative and semi-quantitative predictions of X-ray absorption spectra of molecules. To improve the quality of the CVS-ODC-12 excitation energies further, we plan to combine this method with frozen-core approximation, as suggested in the recent work by Lopez et al.44 within the framework of CVS-approximated EOM-CCSD. We also plan to develop an efficient implementation of CVS-ODC-12 that incorporates treatment of relativistic effects and benchmark its performance for open-shell molecules and transition metal compounds.
This work was supported by start-up funds provided by the Ohio State University.
Table comparing the CVS-ODC-12 approximations with the full LR-ODC-12 method and tables with spectral data for ethylene, formaldehyde, and formic acid.
References
- Contini et al. 2001 Contini, G.; Carravetta, V.; Di Castro, V.; Stranges, S.; Richter, R.; Alagia, M. Gas-Phase Experimental and Theoretical Near Edge X-ray Absorption Fine Structure Study of 2-Mercaptobenzothiazole. J. Phys. Chem. A 2001, 105, 7308–7314
- Wernet et al. 2004 Wernet, P.; Nordlund, D.; Bergmann, U.; Cavalleri, M.; Odelius, M.; Ogasawara, H.; Näslund, L. Å.; Hirsch, T. K.; Ojamäe, L.; Glatzel, P.; Pettersson, L. G. M.; Nilsson, A. The Structure of the First Coordination Shell in Liquid Water. Science 2004, 304, 995–999
- Freiwald et al. 2004 Freiwald, M.; Cramm, S.; Eberhardt, W.; Eisebitt, S. Soft X-ray absorption spectroscopy in liquid environments. J. Electron. Spectrosc. Relat. Phenom. 2004, 137-140, 413–416
- Hähner 2006 Hähner, G. Near edge X-ray absorption fine structure spectroscopy as a tool to probe electronic and structural properties of thin organic films and liquids. Chem. Soc. Rev. 2006, 35, 1244–1255
- Plekan et al. 2008 Plekan, O.; Feyer, V.; Richter, R.; Coreno, M.; de Simone, M.; Prince, K. C.; Trofimov, A. B.; Gromov, E. V.; Zaytseva, I. L.; Schirmer, J. A theoretical and experimental study of the near edge X-ray absorption fine structure (NEXAFS) and X-ray photoelectron spectra (XPS) of nucleobases: Thymine and adenine. Chem. Phys. 2008, 347, 360–375
- Hua et al. 2010 Hua, W.; Gao, B.; Li, S.; Ågren, H.; Luo, Y. Refinement of DNA Structures through Near-Edge X-ray Absorption Fine Structure Analysis: Applications on Guanine and Cytosine Nucleobases, Nucleosides, and Nucleotides. J. Phys. Chem. B 2010, 114, 13214–13222
- Guo et al. 2011 Guo, Q. X.; Senda, H.; Saito, K.; Tanaka, T.; Nishio, M.; Ding, J.; Fan, T. X.; Zhang, D.; Wang, X. Q.; Liu, S. T.; Shen, B.; Ohtani, R. Electronic structure of GaInN semiconductors investigated by x-ray absorption spectroscopy. Appl. Phys. Lett. 2011, 98, 181901
- Norman and Dreuw 2018 Norman, P.; Dreuw, A. Simulating X-ray Spectroscopies and Calculating Core-Excited States of Molecules. Chem. Rev. 2018, 118, 7208–7248
- Stener et al. 2003 Stener, M.; Fronzoni, G.; de Simone, M. Time dependent density functional theory of core electrons excitations. Chem. Phys. Lett. 2003, 373, 115–123
- Besley and Asmuruf 2010 Besley, N. A.; Asmuruf, F. A. Time-dependent density functional theory calculations of the spectroscopy of core electrons. Phys. Chem. Chem. Phys. 2010, 12, 12024–12039
- Liang et al. 2011 Liang, W.; Fischer, S. A.; Frisch, M. J.; Li, X. Energy-Specific Linear Response TDHF/TDDFT for Calculating High-Energy Excited States. J. Chem. Theory Comput. 2011, 7, 3540–3547
- Zhang et al. 2012 Zhang, Y.; Biggs, J. D.; Healion, D.; Govind, N.; Mukamel, S. Core and valence excitations in resonant X-ray spectroscopy using restricted excitation window time-dependent density functional theory. J. Chem. Phys. 2012, 137, 194306
- Lestrange et al. 2015 Lestrange, P. J.; Nguyen, P. D.; Li, X. Calibration of Energy-Specific TDDFT for Modeling K-edge XAS Spectra of Light Elements. J. Chem. Theory Comput. 2015, 11, 2994–2999
- Besley 2016 Besley, N. A. Fast Time-Dependent Density Functional Theory Calculations of the X-ray Absorption Spectroscopy of Large Systems. J. Chem. Theory Comput. 2016, 12, 5018–5025
- Lopata et al. 2012 Lopata, K.; Van Kuiken, B. E.; Khalil, M.; Govind, N. Linear-Response and Real-Time Time-Dependent Density Functional Theory Studies of Core-Level Near-Edge X-Ray Absorption. J. Chem. Theory Comput. 2012, 8, 3284–3292
- Fernando et al. 2015 Fernando, R. G.; Balhoff, M. C.; Lopata, K. X-ray Absorption in Insulators with Non-Hermitian Real-Time Time-Dependent Density Functional Theory. J. Chem. Theory Comput. 2015, 11, 646–654
- Bruner et al. 2016 Bruner, A.; LaMaster, D.; Lopata, K. Accelerated Broadband Spectra Using Transition Dipole Decomposition and Padé Approximants. J. Chem. Theory Comput. 2016, 12, 3741–3750
- Derricotte and Evangelista 2015 Derricotte, W. D.; Evangelista, F. A. Simulation of X-ray absorption spectra with orthogonality constrained density functional theory. Phys. Chem. Chem. Phys. 2015, 17, 14360–14374
- Verma et al. 2016 Verma, P.; Derricotte, W. D.; Evangelista, F. A. Predicting Near Edge X-ray Absorption Spectra with the Spin-Free Exact-Two-Component Hamiltonian and Orthogonality Constrained Density Functional Theory. J. Chem. Theory Comput. 2016, 12, 144–156
- Barth et al. 1980 Barth, A.; Buenker, R. J.; Peyerimhoff, S. D.; Butscher, W. Theoretical study of the core-ionized and various core-excited and shake-up states of acetylene and ethylene by ab initio MRD-CI methods. Chem. Phys. 1980, 46, 149–164
- Butscher et al. 1977 Butscher, W.; Buenker, R. J.; Peyerimhoff, S. D. All-electron CI calculations for core-ionized, core-valence excited and shake-up states of N2. Chem. Phys. Lett. 1977, 52, 449–456
- Butscher et al. 1977 Butscher, W.; Shih, S.-K.; Buenker, R. J.; Peyerimhoff, S. D. Configuration interaction calculations for the N2 molecule and its three lowest dissociation limits. Chem. Phys. Lett. 1977, 52, 457–462
- Asmuruf and Besley 2008 Asmuruf, F. A.; Besley, N. A. Calculation of near-edge X-ray absorption fine structure with the CIS(D) method. Chem. Phys. Lett. 2008, 463, 267–271
- Roemelt and Neese 2013 Roemelt, M.; Neese, F. Excited States of Large Open-Shell Molecules: An Efficient, General, and Spin-Adapted Approach Based on a Restricted Open-Shell Ground State Wave function. J. Phys. Chem. A 2013, 117, 3069–3083
- Roemelt et al. 2013 Roemelt, M.; Maganas, D.; DeBeer, S.; Neese, F. A combined DFT and restricted open-shell configuration interaction method including spin-orbit coupling: Application to transition metal L-edge X-ray absorption spectroscopy. J. Chem. Phys. 2013, 138, 204101
- Barth and Schirmer 1985 Barth, A.; Schirmer, J. Theoretical core-level excitation spectra of N2 and CO by a new polarisation propagator method. J. Phys. B: At. Mol. Phys. 1985, 18, 867–885
- Köppel et al. 1997 Köppel, H.; Gadea, F. X.; Klatt, G.; Schirmer, J.; Cederbaum, L. S. Multistate vibronic coupling effects in the K-shell excitation spectrum of ethylene: Symmetry breaking and core-hole localization. J. Chem. Phys. 1997, 106, 4415–4429
- Trofimov et al. 2000 Trofimov, A. B.; Moskovskaya, T. É.; Gromov, E. V.; Vitkovskaya, N. M.; Schirmer, J. Core-level electronic spectra in ADC(2) approximation for polarization propagator: Carbon monoxide and nitrogen molecules. J. Struct. Chem. 2000, 41, 483–494
- Wenzel et al. 2014 Wenzel, J.; Wormit, M.; Dreuw, A. Calculating core-level excitations and X-ray absorption spectra of medium-sized closed-shell molecules with the algebraic-diagrammatic construction scheme for the polarization propagator. J. Comput. Chem. 2014, 35, 1900–1915
- Wenzel et al. 2015 Wenzel, J.; Holzer, A.; Wormit, M.; Dreuw, A. Analysis and comparison of CVS-ADC approaches up to third order for the calculation of core-excited states. J. Chem. Phys. 2015, 142, 214104
- Nooijen and Bartlett 1995 Nooijen, M.; Bartlett, R. J. Description of core-excitation spectra by the open-shell electron-attachment equation-of-motion coupled cluster method. J. Chem. Phys. 1995, 102, 6735–6756
- Brabec et al. 2012 Brabec, J.; Bhaskaran-Nair, K.; Govind, N.; Pittner, J.; Kowalski, K. Communication: Application of state-specific multireference coupled cluster methods to core-level excitations. J. Chem. Phys. 2012, 137, 171101
- Sen et al. 2013 Sen, S.; Shee, A.; Mukherjee, D. A study of the ionisation and excitation energies of core electrons using a unitary group adapted state universal approach. Mol. Phys. 2013, 111, 2625–2639
- Coriani et al. 2012 Coriani, S.; Christiansen, O.; Fransson, T.; Norman, P. Coupled-cluster response theory for near-edge x-ray-absorption fine structure of atoms and molecules. Phys. Rev. A 2012, 85, 022507
- Coriani et al. 2012 Coriani, S.; Fransson, T.; Christiansen, O.; Norman, P. Asymmetric-Lanczos-Chain-Driven Implementation of Electronic Resonance Convergent Coupled-Cluster Linear Response Theory. J. Chem. Theory Comput. 2012, 8, 1616–1628
- Kauczor et al. 2013 Kauczor, J.; Norman, P.; Christiansen, O.; Coriani, S. Communication: A reduced-space algorithm for the solution of the complex linear response equations used in coupled cluster damped response theory. J. Chem. Phys. 2013, 139, 211102
- Fransson et al. 2013 Fransson, T.; Coriani, S.; Christiansen, O.; Norman, P. Carbon X-ray absorption spectra of fluoroethenes and acetone: A study at the coupled cluster, density functional, and static-exchange levels of theory. J. Chem. Phys. 2013, 138, 124311
- List et al. 2014 List, N. H.; Coriani, S.; Kongsted, J.; Christiansen, O. Lanczos-driven coupled–cluster damped linear response theory for molecules in polarizable environments. J. Chem. Phys. 2014, 141, 244107
- Dutta et al. 2014 Dutta, A. K.; Gupta, J.; Vaval, N.; Pal, S. Intermediate Hamiltonian Fock Space Multireference Coupled Cluster Approach to Core Excitation Spectra. J. Chem. Theory Comput. 2014, 10, 3656–3668
- Peng et al. 2015 Peng, B.; Lestrange, P. J.; Goings, J. J.; Caricato, M.; Li, X. Energy-Specific Equation-of-Motion Coupled-Cluster Methods for High-Energy Excited States: Application to K-edge X-ray Absorption Spectroscopy. J. Chem. Theory Comput. 2015, 11, 4146–4153
- Coriani and Koch 2015 Coriani, S.; Koch, H. Communication: X-ray absorption spectra and core-ionization potentials within a core-valence separated coupled cluster framework. J. Chem. Phys. 2015, 143, 181103
- Myhre et al. 2016 Myhre, R. H.; Coriani, S.; Koch, H. Near-Edge X-ray Absorption Fine Structure within Multilevel Coupled Cluster Theory. J. Chem. Theory Comput. 2016, 12, 2633–2643
- Nascimento and DePrince 2017 Nascimento, D. R.; DePrince, A. E. Simulation of Near-Edge X-ray Absorption Fine Structure with Time-Dependent Equation-of-Motion Coupled-Cluster Theory. J. Phys. Chem. Lett. 2017, 2951–2957
- Lopez Vidal et al. 2018 Lopez Vidal, M.; Feng, X.; Epifanovsky, E.; Krylov, A.; Coriani, S. A New and Efficient Equation-of-Motion Coupled-Cluster Framework for Core-Excited and Core-Ionized States. 2018; \urlhttps://chemrxiv.org/articles/A_New_and_Efficient_Equation-of-Motion_Coupled-Cluster_Framework_for_Core-Excited_and_Core-Ionized_States/7211942/1
- Copan and Sokolov 2018 Copan, A. V.; Sokolov, A. Y. Linear-Response Density Cumulant Theory for Excited Electronic States. J. Chem. Theory Comput. 2018, 14, 4097–4108
- Colmenero and Valdemoro 1993 Colmenero, F.; Valdemoro, C. Approximating q-order reduced density matrices in terms of the lower-order ones. II. Applications. Phys. Rev. A 1993, 47, 979–985
- Nakatsuji and Yasuda 1996 Nakatsuji, H.; Yasuda, K. Direct Determination of the Quantum-Mechanical Density Matrix Using the Density Equation. Phys. Rev. Lett. 1996, 76, 1039–1042
- Mazziotti 1998 Mazziotti, D. A. Contracted Schrödinger equation: Determining quantum energies and two-particle density matrices without wave functions. Phys. Rev. A 1998, 57, 4219–4234
- Kollmar 2006 Kollmar, C. A size extensive energy functional derived from a double configuration interaction approach: The role of N representability conditions. J. Chem. Phys. 2006, 125, 084108
- DePrince and Mazziotti 2007 DePrince, A. E.; Mazziotti, D. A. Parametric approach to variational two-electron reduced-density-matrix theory. Phys. Rev. A 2007, 76, 042501
- DePrince 2016 DePrince, A. E. Variational optimization of the two-electron reduced-density matrix under pure-state N-representability conditions. J. Chem. Phys. 2016, 145, 164109
- Kutzelnigg 1991 Kutzelnigg, W. Error analysis and improvements of coupled-cluster theory. Theor. Chem. Acc. 1991, 80, 349–386
- Kutzelnigg 1998 Kutzelnigg, W. Almost variational coupled cluster theory. Mol. Phys. 1998, 94, 65–71
- Van Voorhis and Head-Gordon 2000 Van Voorhis, T.; Head-Gordon, M. Benchmark variational coupled cluster doubles results. J. Chem. Phys. 2000, 113, 8873
- Kutzelnigg 1982 Kutzelnigg, W. Quantum chemistry in Fock space. I. The universal wave and energy operators. J. Chem. Phys. 1982, 77, 3081–3097
- Bartlett et al. 1989 Bartlett, R. J.; Kucharski, S. A.; Noga, J. Alternative coupled-cluster ansätze II. The unitary coupled-cluster method. Chem. Phys. Lett. 1989, 155, 133–140
- Watts et al. 1989 Watts, J. D.; Trucks, G. W.; Bartlett, R. J. The unitary coupled-cluster approach and molecular properties. Applications of the UCC(4) method. Chem. Phys. Lett. 1989, 157, 359–366
- Szalay et al. 1995 Szalay, P. G.; Nooijen, M.; Bartlett, R. J. Alternative ansätze in single reference coupled-cluster theory. III. A critical analysis of different methods. J. Chem. Phys. 1995, 103, 281–298
- Cederbaum et al. 1980 Cederbaum, L. S.; Domcke, W.; Schirmer, J.; Von Niessen, W. Many-Body Effects in Valence and Core Photoionization of Molecules. Phys. Scr. 1980, 21, 481–491
- Cederbaum et al. 1980 Cederbaum, L. S.; Domcke, W.; Schirmer, J. Many-body theory of core holes. Phys. Rev. A 1980, 22, 206–222
- Kutzelnigg 2006 Kutzelnigg, W. Density-cumulant functional theory. J. Chem. Phys. 2006, 125, 171101
- Simmonett et al. 2010 Simmonett, A. C.; Wilke, J. J.; Schaefer, H. F.; Kutzelnigg, W. Density cumulant functional theory: First implementation and benchmark results for the DCFT-06 model. J. Chem. Phys. 2010, 133, 174122
- Sokolov et al. 2012 Sokolov, A. Y.; Wilke, J. J.; Simmonett, A. C.; Schaefer, H. F. Analytic gradients for density cumulant functional theory: The DCFT-06 model. J. Chem. Phys. 2012, 137, 054105
- Sokolov et al. 2013 Sokolov, A. Y.; Simmonett, A. C.; Schaefer, H. F. Density cumulant functional theory: The DC-12 method, an improved description of the one-particle density matrix. J. Chem. Phys. 2013, 138, 024107
- Sokolov and Schaefer 2013 Sokolov, A. Y.; Schaefer, H. F. Orbital-optimized density cumulant functional theory. J. Chem. Phys. 2013, 139, 204110
- Sokolov et al. 2014 Sokolov, A. Y.; Schaefer, H. F.; Kutzelnigg, W. Density cumulant functional theory from a unitary transformation: N-representability, three-particle correlation effects, and application to O. J. Chem. Phys. 2014, 141, 074111
- Wang et al. 2016 Wang, X.; Sokolov, A. Y.; Turney, J. M.; Schaefer, H. F. Spin-Adapted Formulation and Implementation of Density Cumulant Functional Theory with Density-Fitting Approximation: Application to Transition Metal Compounds. J. Chem. Theory Comput. 2016, 12, 4833–4842
- Fulde 1991 Fulde, P. Electron Correlations in Molecules and Solids; Springer: Berlin, 1991
- Ziesche 1992 Ziesche, P. Definition of exchange based on cumulant expansion: Correlation induced narrowing of the exchange hole. Solid State Commun 1992, 82, 597–602
- Kutzelnigg and Mukherjee 1997 Kutzelnigg, W.; Mukherjee, D. Normal order and extended Wick theorem for a multiconfiguration reference wave function. J. Chem. Phys. 1997, 107, 432
- Mazziotti 1998 Mazziotti, D. A. Approximate solution for electron correlation through the use of Schwinger probes. Chem. Phys. Lett. 1998, 289, 419–427
- Kutzelnigg and Mukherjee 1999 Kutzelnigg, W.; Mukherjee, D. Cumulant expansion of the reduced density matrices. J. Chem. Phys. 1999, 110, 2800–2809
- Ziesche 2000 Ziesche, P. In Many-Electron Densities and Reduced Density Matrices; Cioslowski, J., Ed.; Springer US: Boston, MA, 2000; pp 33–56
- Herbert and Harriman 2007 Herbert, J. M.; Harriman, J. E. Cumulants, Extensivity, and the Connected Formulation of the Contracted Schrödinger Equation. Adv. Chem. Phys. 2007, 134, 261
- Kong and Valeev 2011 Kong, L.; Valeev, E. F. A novel interpretation of reduced density matrix and cumulant for electronic structure theories. J. Chem. Phys. 2011, 134, 214109–214109–9
- Hanauer and Köhn 2012 Hanauer, M.; Köhn, A. Meaning and magnitude of the reduced density matrix cumulants. Chem. Phys. 2012, 401, 50–61
- Norman 2011 Norman, P. A perspective on nonresonant and resonant electronic response theory for time-dependent molecular properties. Phys. Chem. Chem. Phys. 2011, 13, 20519–20535
- Helgaker et al. 2012 Helgaker, T.; Coriani, S.; Jørgensen, P.; Kristensen, K.; Olsen, J.; Ruud, K. Recent Advances in Wave Function-Based Methods of Molecular-Property Calculations. Chem. Rev. 2012, 112, 543–631
- Kristensen et al. 2009 Kristensen, K.; Kauczor, J.; Kjærgaard, T.; Jørgensen, P. Quasienergy formulation of damped response theory. J. Chem. Phys. 2009, 131, 044112
- Olsen and Jørgensen 1985 Olsen, J.; Jørgensen, P. Linear and nonlinear response functions for an exact state and for an MCSCF state. J. Chem. Phys. 1985, 82, 3235–3264
- Sauer 2011 Sauer, S. P. A. Molecular Electromagnetism: A Computational Chemistry Approach; Oxford University Press: Oxford, 2011
- Davidson 1975 Davidson, E. R. The iterative calculation of a few of the lowest eigenvalues and corresponding eigenvectors of large real-symmetric matrices. J. Comput. Phys. 1975, 17, 87
- Liu 1978 Liu, B. The Simultaneous Expansion Method for the Iterative Solution of Several of the Lowest-Lying Eigenvalues and Corresponding Eigenvectors of Large Real-Symmetric Matrices; 1978; pp 49–53
- Parrish et al. 2017 Parrish, R. M.; Burns, L. A.; Smith, D. G. A.; Simmonett, A. C.; DePrince, A. E.; Hohenstein, E. G.; Bozkaya, U.; Sokolov, A. Y.; Di Remigio, R.; Richard, R. M.; Gonthier, J. F.; James, A. M.; McAlexander, H. R.; Kumar, A.; Saitow, M.; Wang, X.; Pritchard, B. P.; Verma, P.; Schaefer, H. F.; Patkowski, K.; King, R. A.; Valeev, E. F.; Evangelista, F. A.; Turney, J. M.; Crawford, T. D.; Sherrill, C. D. Psi4 1.1: An Open-Source Electronic Structure Program Emphasizing Automation, Advanced Libraries, and Interoperability. J. Chem. Theory Comput. 2017, 13, 3185–3197
- Sun et al. 2018 Sun, Q.; Berkelbach, T. C.; Blunt, N. S.; Booth, G. H.; Guo, S.; Li, Z.; Liu, J.; McClain, J. D.; Sayfutyarova, E. R.; Sharma, S.; Wouters, S.; Chan, G. K.-L. PySCF: the Python-based simulations of chemistry framework. WIREs Comput. Mol. Sci. 2018, 8, e1340
- Kendall et al. 1992 Kendall, R. A.; Dunning Jr, T. H.; Harrison, R. J. Electron affinities of the first-row atoms revisited. Systematic basis sets and wave functions. 1992, 96, 6796–6806
- Rohatgi 2018 Rohatgi, A. 2018; WebPlotDigitizer, version 4.1. Website: https://automeris.io/WebPlotDigitizer
- King et al. 1977 King, G. C.; Read, F. H.; Tronc, M. Investigation of the energy and vibrational structure of the inner shell (1s)-1(2p)1 state of the nitrogen molecule by electron impact with high resolution. Chem. Phys. Lett. 1977, 52, 50–54
- Tronc et al. 1980 Tronc, M.; King, G. C.; Read, F. H. Nitrogen K-shell excitation in N2, NO and N2O by high-resolution electron energy-loss spectroscopy. J. Phys. B: At. Mol. Phys. 1980, 13, 999–1008
- Tronc et al. 1979 Tronc, M.; King, G. C.; Read, F. H. Carbon K-shell excitation in small molecules by high-resolution electron impact. J. Phys. B: At. Mol. Phys. 1979, 12, 137–157
- Hitchcock and Brion 1980 Hitchcock, A. P.; Brion, C. E. K-shell excitation spectra of CO, N2 and O2. J. Electron. Spectrosc. Relat. Phenom. 1980, 18, 1–21
- Püttner et al. 1999 Püttner, R.; Dominguez, I.; Morgan, T. J.; Cisneros, C.; Fink, R. F.; Rotenberg, E.; Warwick, T.; Domke, M.; Kaindl, G.; Schlachter, A. S. Vibrationally resolved O 1s core-excitation spectra of CO and NO. Phys. Rev. A 1999, 59, 3415–3423
- Remmers et al. 1992 Remmers, G.; Domke, M.; Puschmann, A.; Mandel, T.; Xue, C.; Kaindl, G.; Hudson, E.; Shirley, D. A. High-resolution K-shell photoabsorption in formaldehyde. Phys. Rev. A 1992, 46, 3935–3944
- Chen et al. 1989 Chen, C. T.; Ma, Y.; Sette, F. K-shell photoabsorption of the N2 molecule. Phys. Rev. A 1989, 40, 6737–6740
- Francis et al. 1994 Francis, J. T.; Enkvist, C.; Lunell, S.; Hitchcock, A. P. Studies of C 1s → * triplet states of carbon monoxide, benzene, ethylene, and acetylene. Can. J. Phys. 1994, 72, 879–884
- Adachi et al. 1999 Adachi, J.-i.; Kosugi, N.; Shigemasa, E.; Yagishita, A. Vibronic coupling and valence mixing in the 1s→Rydberg excited states of C2H2 in comparison with N2 and CO. Chem. Phys. Lett. 1999, 309, 427–433
- Domke et al. 1990 Domke, M.; Xue, C.; Puschmann, A.; Mandel, T.; Hudson, E.; Shirley, D. A.; Kaindl, G. Carbon and oxygen K-edge photoionization of the CO molecule. Chem. Phys. Lett. 1990, 173, 122–128
- Schirmer et al. 1993 Schirmer, J.; Trofimov, A. B.; Randall, K. J.; Feldhaus, J.; Bradshaw, A. M.; Ma, Y.; Chen, C. T.; Sette, F. K-shell excitation of the water, ammonia, and methane molecules using high-resolution photoabsorption spectroscopy. Phys. Rev. A 1993, 47, 1136–1147
- Hitchcock and Brion 1981 Hitchcock, A. P.; Brion, C. E. K-shell excitation of HF and F2 studied by electron energy-loss spectroscopy. J. Phys. B: At. Mol. Phys. 1981, 14, 4399–4413
- Ma et al. 1991 Ma, Y.; Chen, C. T.; Meigs, G.; Randall, K.; Sette, F. High-resolution K-shell photoabsorption measurements of simple molecules. Phys. Rev. A 1991, 44, 1848–1858
- Hitchcock and Brion 1979 Hitchcock, A. P.; Brion, C. E. K-shell excitation of HCN by electron energy loss spectroscopy. J. Electron. Spectrosc. Relat. Phenom. 1979, 15, 201–206
- McLaren et al. 1987 McLaren, R.; Clark, S. A. C.; Ishii, I.; Hitchcock, A. P. Absolute oscillator strengths from K-shell electron-energy-loss spectra of the fluoroethenes and 1,3-perfluorobutadiene. Phys. Rev. A 1987, 36, 1683–1701
- Prince et al. 2002 Prince, K. C.; Richter, R.; de Simone, M.; Coreno, M. X-ray absorption spectra of some small polyatomic molecules. Surf. Rev. Lett. 2002, 09, 159–164