\PHnumberCERN-EP-2018-341 \PHdate
\EXPnumberTOTEM-2018-002 \EXPdate
\ShortTitleProton-proton differential cross-section at
\CollaborationThe TOTEM Collaboration \ShortAuthorThe TOTEM Collaboration (G. Antchev et al.)
{Authlist} G. Antchev\Arefa, P. Aspell\Iref9, I. Atanassov\Arefa, V. Avati\Iref7, J. Baechler\Iref9, C. Baldenegro Barrera\Iref11, V. Berardi\IIref4a4b, M. Berretti\Iref2a, E. Bossini\Iref6b, U. Bottigli\Iref6b, M. Bozzo\IIref5a5b, H. Burkhardt\Iref9, F. S. Cafagna\Iref4a, M. G. Catanesi\Iref4a, M. Csanád\IAref3ab, T. Csörgő\IIref3a3b, M. Deile\Iref9, F. De Leonardis\IIref4c4a, M. Doubek\Iref1c, D. Druzhkin\Iref9, K. Eggert\Iref10, V. Eremin\Arefc, F. Ferro\Iref5a, A. Fiergolski\Iref9, F. Garcia\Iref2a, V. Georgiev\Iref1a, S. Giani\Iref9, L. Grzanka\Iref7, J. Hammerbauer\Iref1a, V. Ivanchenko\Iref8, J. Kašpar\IIref6a1b, J. Kopal\Iref9, V. Kundrát\Iref1b, S. Lami\Iref6a, G. Latino\Iref6b, R. Lauhakangas\Iref2a, C. Lindsey\Iref11, M. V. Lokajíček\Iref1b, L. Losurdo\Iref6b, M. Lo Vetere\IIAref5b5a+, F. Lucas Rodríguez\Iref9, M. Macrí\Iref5a, M. Malawski\Iref7, N. Minafra\Iref11, S. Minutoli\Iref5a, T. Naaranoja\IIref2a2b, F. Nemes\IIref93a, H. Niewiadomski\Iref10, T. Novák\Iref3b, E. Oliveri\Iref9, F. Oljemark\IIref2a2b, M. Oriunno\Arefd, K. Österberg\IIref2a2b, P. Palazzi\Iref9, V. Passaro\IIref4c4a, Z. Peroutka\Iref1a, J. Procházka\Iref1c, M. Quinto\IIref4a4b, E. Radermacher\Iref9, E. Radicioni\Iref4a, F. Ravotti\Iref9, E. Robutti\Iref5a, C. Royon\Iref11, G. Ruggiero\Iref9, H. Saarikko\IIref2a2b, A. Scribano\Iref6a, J. Smajek\Iref9, W. Snoeys\Iref9, J. Sziklai\Iref3a, C. Taylor\Iref10, E. Tcherniaev\Iref8, N. Turini\Iref6b, V. Vacek\Iref1c, J. Welti\IIref2a2b, J. Williams\Iref11
1aUniversity of West Bohemia, Pilsen, Czech Republic. 1bInstitute of Physics of the Academy of Sciences of the Czech Republic, Prague, Czech Republic. 1cCzech Technical University, Prague, Czech Republic. 2aHelsinki Institute of Physics, University of Helsinki, Helsinki, Finland. 2bDepartment of Physics, University of Helsinki, Helsinki, Finland. 3aWigner Research Centre for Physics, RMKI, Budapest, Hungary. 3bEKU KRC, Gyöngyös, Hungary. 4aINFN Sezione di Bari, Bari, Italy. 4bDipartimento Interateneo di Fisica di Bari, Bari, Italy. 4cDipartimento di Ingegneria Elettrica e dell’Informazione - Politecnico di Bari, Bari, Italy. 5aINFN Sezione di Genova, Genova, Italy. 5bUniversità degli Studi di Genova, Italy. 6aINFN Sezione di Pisa, Pisa, Italy. 6bUniversità degli Studi di Siena and Gruppo Collegato INFN di Siena, Siena, Italy. 7AGH University of Science and Technology, Krakow, Poland. 8Tomsk State University, Tomsk, Russia. 9CERN, Geneva, Switzerland. 10Case Western Reserve University, Dept. of Physics, Cleveland, OH, USA. 11The University of Kansas, Lawrence, USA. \AnotfootaINRNE-BAS, Institute for Nuclear Research and Nuclear Energy, Bulgarian Academy of Sciences, Sofia, Bulgaria. \AnotfootbDepartment of Atomic Physics, ELTE University, Budapest, Hungary. \AnotfootcIoffe Physical - Technical Institute of Russian Academy of Sciences, St. Petersburg, Russian Federation. \AnotfootdSLAC National Accelerator Laboratory, Stanford CA, USA. \Anotfoot+Deceased.
The proton-proton elastic differential cross section has been measured by the TOTEM experiment at TeV energy with m beam optics. The Roman Pots were inserted to 13 times the transverse beam size from the beam, which allowed to measure the differential cross-section of elastic scattering in a range of the squared four-momentum transfer () from GeV2 to GeV2. The differential cross-section can be described with an exponential in the -range between GeV2 and GeV2, followed by a diffractive minimum (dip) at GeV2 and a subsequent maximum (bump). The ratio of the at the bump and at the dip is . When compared to the measurement of the D0 experiment at , a significant difference can be observed. Under the condition that the effects due to the energy difference between TOTEM and D0 can be neglected, the result provides evidence for a colourless 3-gluon bound state exchange in the -channel of the proton-proton elastic scattering.
1 Introduction
This article presents the first measurement of the proton-proton (pp) elastic differential cross section at a centre-of-mass energy TeV. The four momentum transfer squared () range of the differential cross-section includes the diffractive minimum. The TOTEM collaboration has previously measured proton-proton elastic scattering at energies 7 TeV, 8 TeV and 13 TeV [1, 2, 3, 4, 5, 6, 7]. The importance of the present article is that it constitutes the pp measurement closest to a corresponding measurement at the TeV scale, since the D0 measurement is at a comparable energy TeV. The predominant Pomeron contribution to elastic pp scattering is crossing even. Any difference between the pp and p differential cross-section at the TeV scale may be an evidence for a crossing-odd exchange, the Odderon, introduced in [8, 9] and predicted in QCD as a 3-gluon bound state exchange [10]. At the TeV energy scale, any possible other contribution by Reggeons is expected to be below the percent level [11].
Section 2 outlines the experimental apparatus used for this measurement. Section 3 summarises the data-taking conditions including details of the kinematics reconstruction, alignment and beam optics. The differential cross-section is described in Section 4 followed by a discussion of the physics results in Section 5.
2 Experimental apparatus
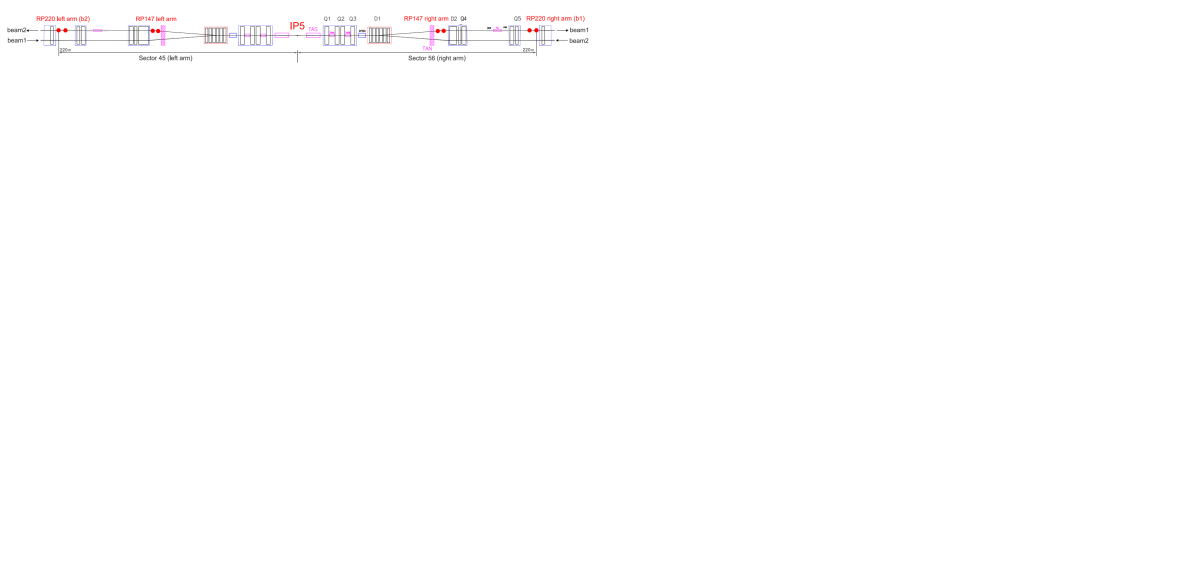
The TOTEM experimental setup consists of two inelastic telescopes T1 and T2 to detect charged particles coming from inelastic collisions and the Roman Pot detectors (RP) to detect elastically scattered protons at very small angles. The inelastic telescopes are placed symmetrically on both sides of Interaction Point 5 (IP5): the T1 telescope is based on cathode strip chambers (CSCs) placed at 9 m and covers the pseudorapidity range 3.1 4.7; the T2 telescope is based on gas electron multiplier (GEM) chambers placed at 13.5 m and covers the pseudorapidity range 5.3 6.5. The pseudorapidity coverage of the two telescopes at TeV allows the detection of about 92 % of the inelastic events. As the fraction of events with all final state particles beyond the instrumented region has to be estimated using phenomenological models, the excellent acceptance in TOTEM minimizes the dependence on such models and thus provides small uncertainty on the inelastic rate measurement.
The Roman Pot (RP) units used for the present measurement are located on both sides of the IP at distances of m (near) and m (far) from IP5. A unit consists of 3 RPs, two approaching the outgoing beam vertically and one horizontally. The horizontal RP detectors were not inserted during this particular data taking and the vertical alignment uses the RP position sensors and is further refined with precise constraints based on symmetries of elastic scattering [5]. The m long lever arm between the near and the far RP units has the important advantage that the local track angles in the and -projections perpendicular to the beam direction can be reconstructed with a precision of 2 rad. A complete description of the TOTEM detector system is given in [12, 13].
Each RP is equipped with a stack of 10 silicon strip detectors designed with the specific objective of reducing the insensitive area at the edge facing the beam to only a few tens of micrometres. The 512 strips with 66 m pitch of each detector are oriented at an angle of +45∘ (five planes) and -45∘ (five planes) with respect to the detector edge facing the beam [14].
3 Data taking and analysis
The analysis is performed on a data sample (DS1) recorded in 2013 during an LHC fill with m injection optics [15, 16, 17]. The RP detectors were inserted to 13 times the transverse beam size. Although in this work we focus on the analysis of DS1, the present analysis uses the total cross-section measurement at TeV (data set DS2) recorded with RP detectors placed at 4.3 times the transverse beam size, in order to obtain its final normalization [6]. The differential cross-section of DS2 is included in this article for the sake of completeness, see Table 3, although its detailed description is provided elsewhere [6, 7].
The vertical RP detectors were at 13 times the transverse beam size () from the outgoing beams. The collected events have been triggered by the T2 telescope in either arm (inelastic trigger), by the RP detectors in a double-arm coincidence (elastic trigger), and by random bunch crossings (zero-bias sample used for calibration).
3.1 Elastic analysis
3.1.1 Reconstruction of kinematics
The horizontal and vertical scattering angles of the proton at IP5 are reconstructed in a given arm by inverting the proton transport equations [16]
| (1) |
where denotes the distance from the interaction point, is the vertical coordinate of the proton’s trajectory, is its horizontal angle measured by the RP detectors, and is the horizontal vertex coordinate reconstructed as
| (2) |
where . The coefficients , and are optical functions of the LHC beam determined by the accelerator magnets. For their definition we refer to [16].
The scattering angles obtained for the two arms are averaged and the four-momentum transfer squared is calculated
| (3) |
where TeV is the LHC beam momentum and the scattering angle . Finally, the azimuthal angle is
| (4) |
3.1.2 RP alignment and beam optics
The alignment is based on the position measurement of the RP movement system, followed by an alignment procedure based on the symmetries of elastic scattering. The residual misalignment with respect to the LHC beam is about 10 m in the horizontal coordinate and about 100 m in the vertical [2, 18]. When propagated to the reconstructed scattering angle , this leads to an uncertainty of the order 5 rad.
The nominal optics has been updated from LHC magnet and current databases and has been calibrated using the observed elastic candidates of DS2, with larger statistics, and validated for DS1 relying on the stability of the LHC optics [15, 5]. The m optics of the LHC is designed with a vertical effective length m at the location of the RP detectors; the exact value depends on the location of the detector along the beam. The reconstruction of the horizontal scattering angle uses the derivative of the horizontal effective length at the position of the RPs. The remaining optical functions used in the reconstruction are the horizontal magnifications in the near and far RP, whose value is and their derivative m-1. The different reconstruction formula in the vertical and horizontal plane in Eq. (1) is motivated by their different sensitivity to the LHC magnet and beam perturbations.
The uncertainties of the optical functions are estimated with a Monte Carlo program applying the optics calibration procedure on a sophisticated simulation of the LHC beam and its perturbations. The obtained uncertainty is 2 for and for . The uncertainty of the horizontal magnification and its derivative is 2 and 3 , respectively [16, 17].
3.1.3 Event selection
The analysis follows the similar procedure used for the measurement of the elastic cross section at several other LHC energies: 7 TeV, 8 TeV and 13 TeV [1, 2, 3, 4, 5, 6, 7]. The measurement of the elastic rate is based on the selection of events with the following topology in the RP detector system: a reconstructed track in the near and far vertical detectors on one side and a reconstructed track in the near (or far) on the other side of the IP such that the elastic signature is satisfied in one of the two diagonals: left bottom and right top (Diagonal 1) or left top and right bottom (Diagonal 2).
There are four vertical RP detectors along a diagonal, each with slightly different acceptance limitations depending on their vertical distance from the LHC beam. The mentioned topology selection uses only three RPs in order to optimize the statistics of the analysis. In the arm with only one RP the horizontal scattering angle is reconstructed using
| (5) |
where the horizontal vertex coordinate is calculated from Eq. (2) using the track of the RPs in the other arm of the diagonal.
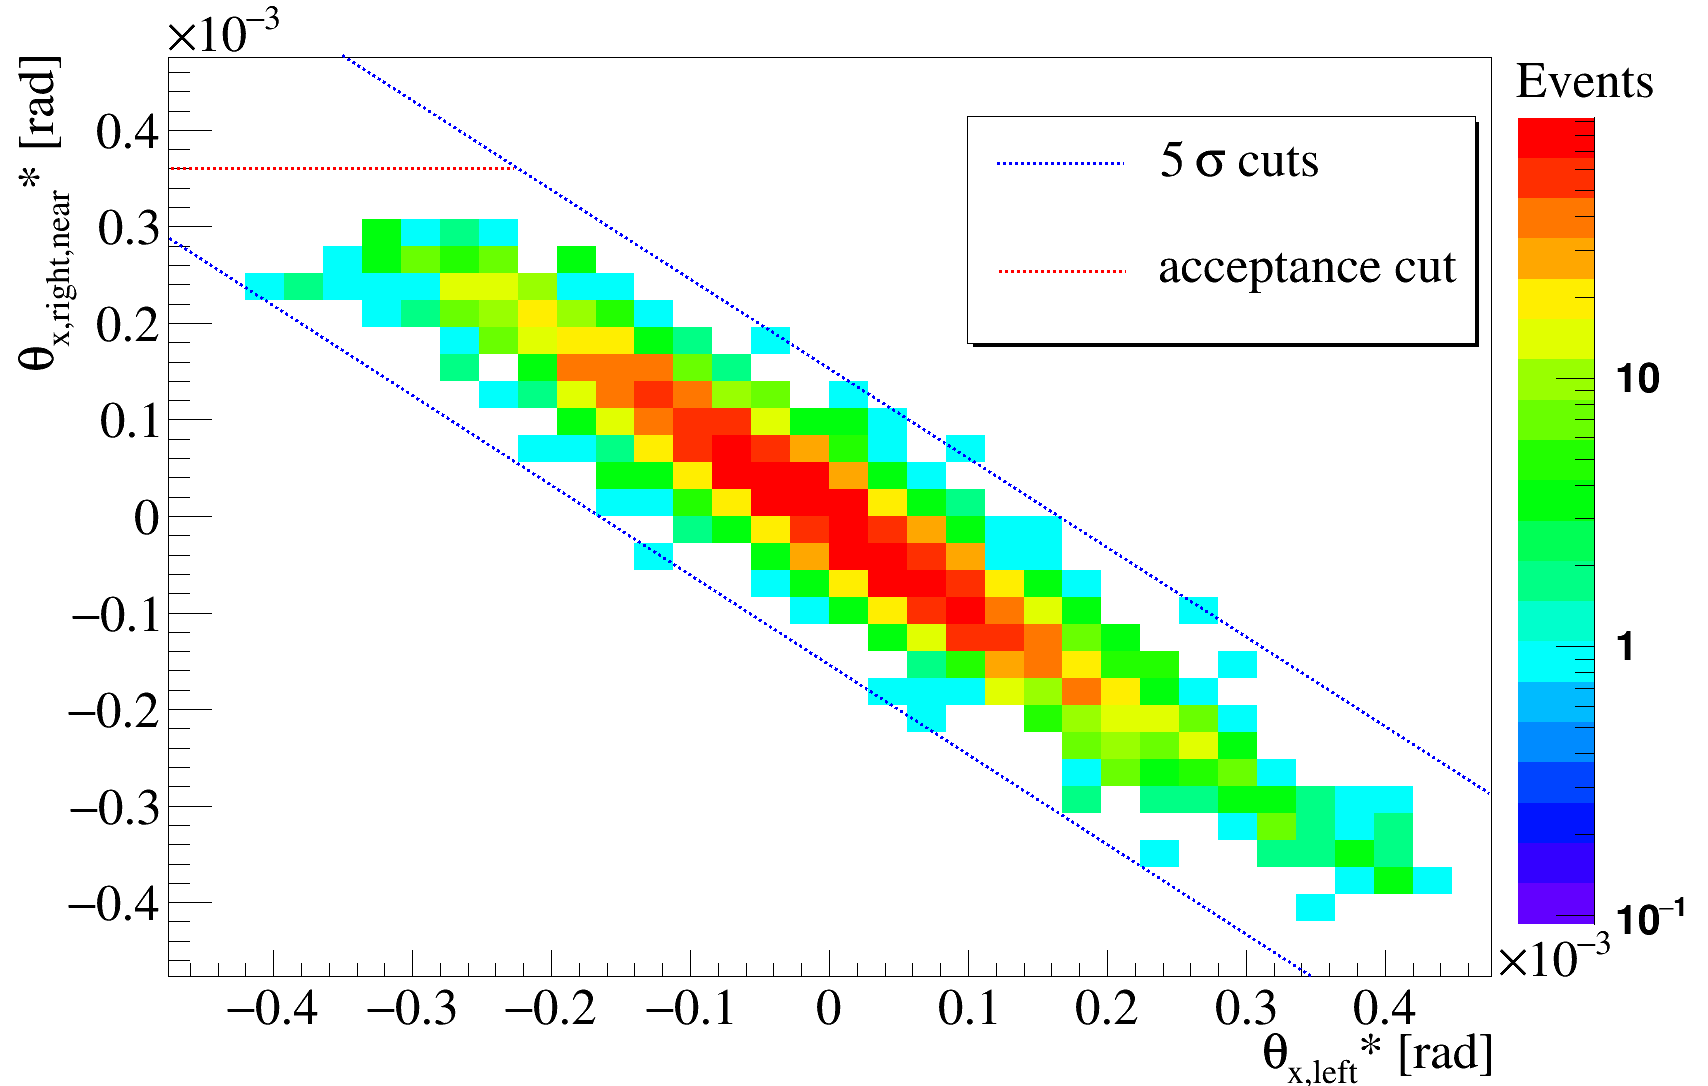
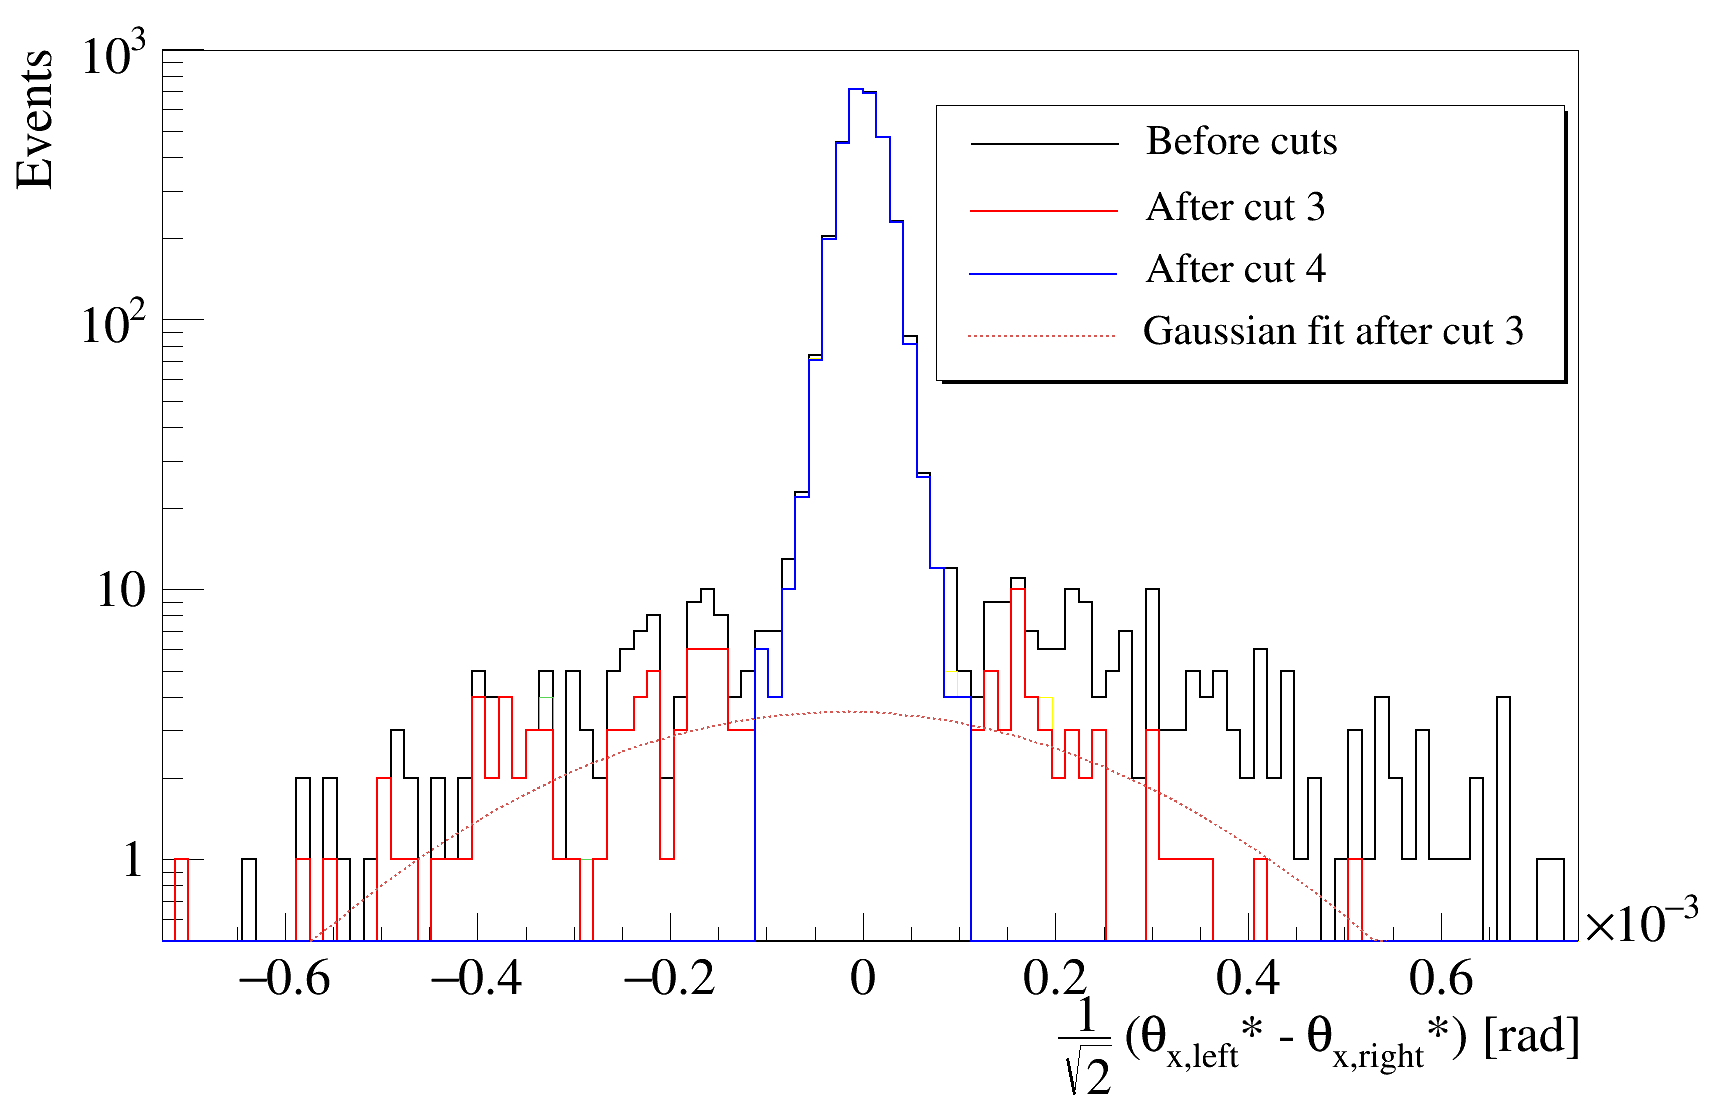
Besides the topology cut, the elastic event selection requires the collinearity of the outgoing protons in the two arms, see Fig. 2. The diffractive events are suppressed with so-called spectrometer cuts, which require the correlation between the vertical position in the near RP detector and the inclination (and similarly in the horizontal plane), see Table 1. Fig. 4 shows the efficiency of the elastic event selection.
| Cut name | ||
|---|---|---|
| 1 | Vertical collinearity cut | rad |
| 2 | y-spectrometer cut, left arm | m |
| 3 | x-spectrometer cut, left arm | m |
| 4 | Horizontal collinearity cut | rad |
Figure 2 shows the horizontal collinearity cut imposing momentum conservation in the horizontal plane. The cuts are applied at the 5 level, and they are optimized for purity (background contamination in the selected sample less than 0.5 %) and for efficiency (uncertainty of true elastic event selection 0.5 %). Figure 4 shows the progressive selection of elastic events.
3.1.4 Geometrical and beam divergence correction, unfolding
The vertical acceptance of elastically scattered protons is limited by the RP silicon detector edge and by the LHC magnet apertures. The geometrical acceptance correction is calculated in order to correct for the missing part of the acceptance
| (6) |
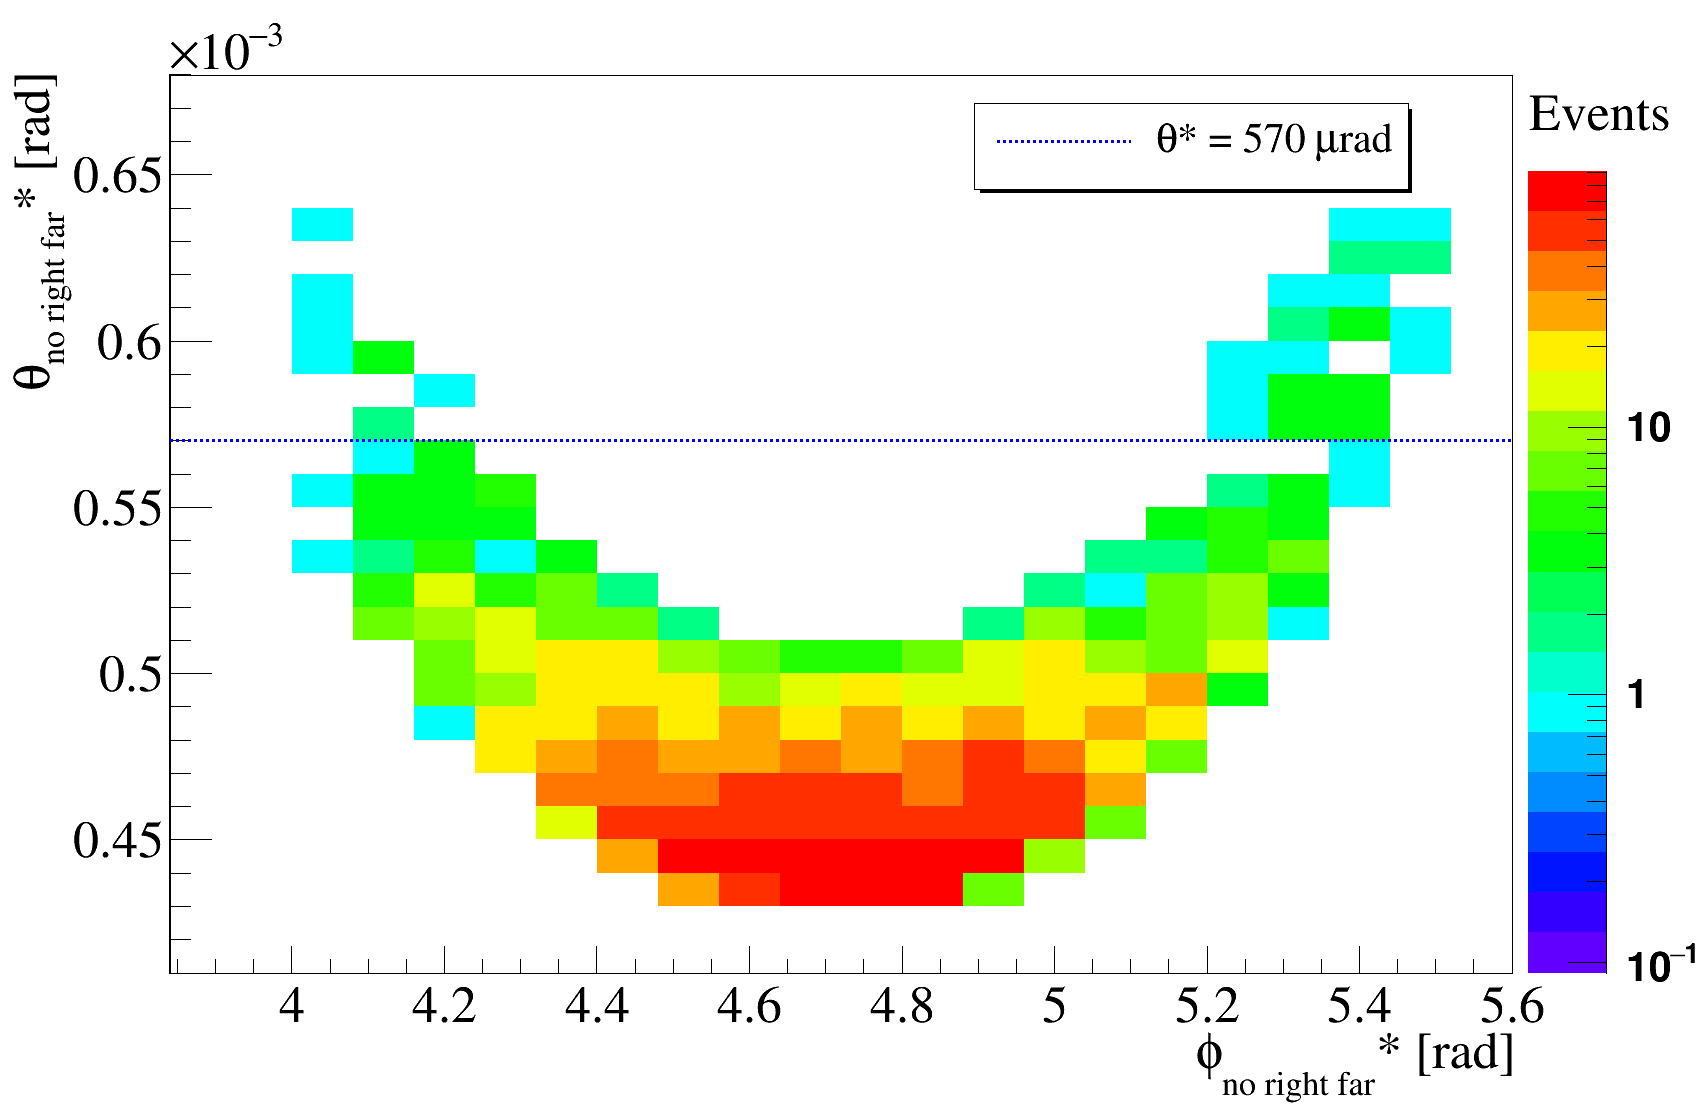
where is the visible azimuthal angle range, defined by the acceptance cuts, see Figure 2.
The geometrical acceptance correction formula Eq. (6) assumes the azimuthal symmetry of elastic scattering, which is experimentally verified on the data, see Fig. 3. The acceptance limitations constrain the vertical component of the analysis to GeV2 and GeV2. The RP distance from the LHC beam is larger than in the earlier TOTEM analyses and the geometrical acceptance correction factor exceeds 5.
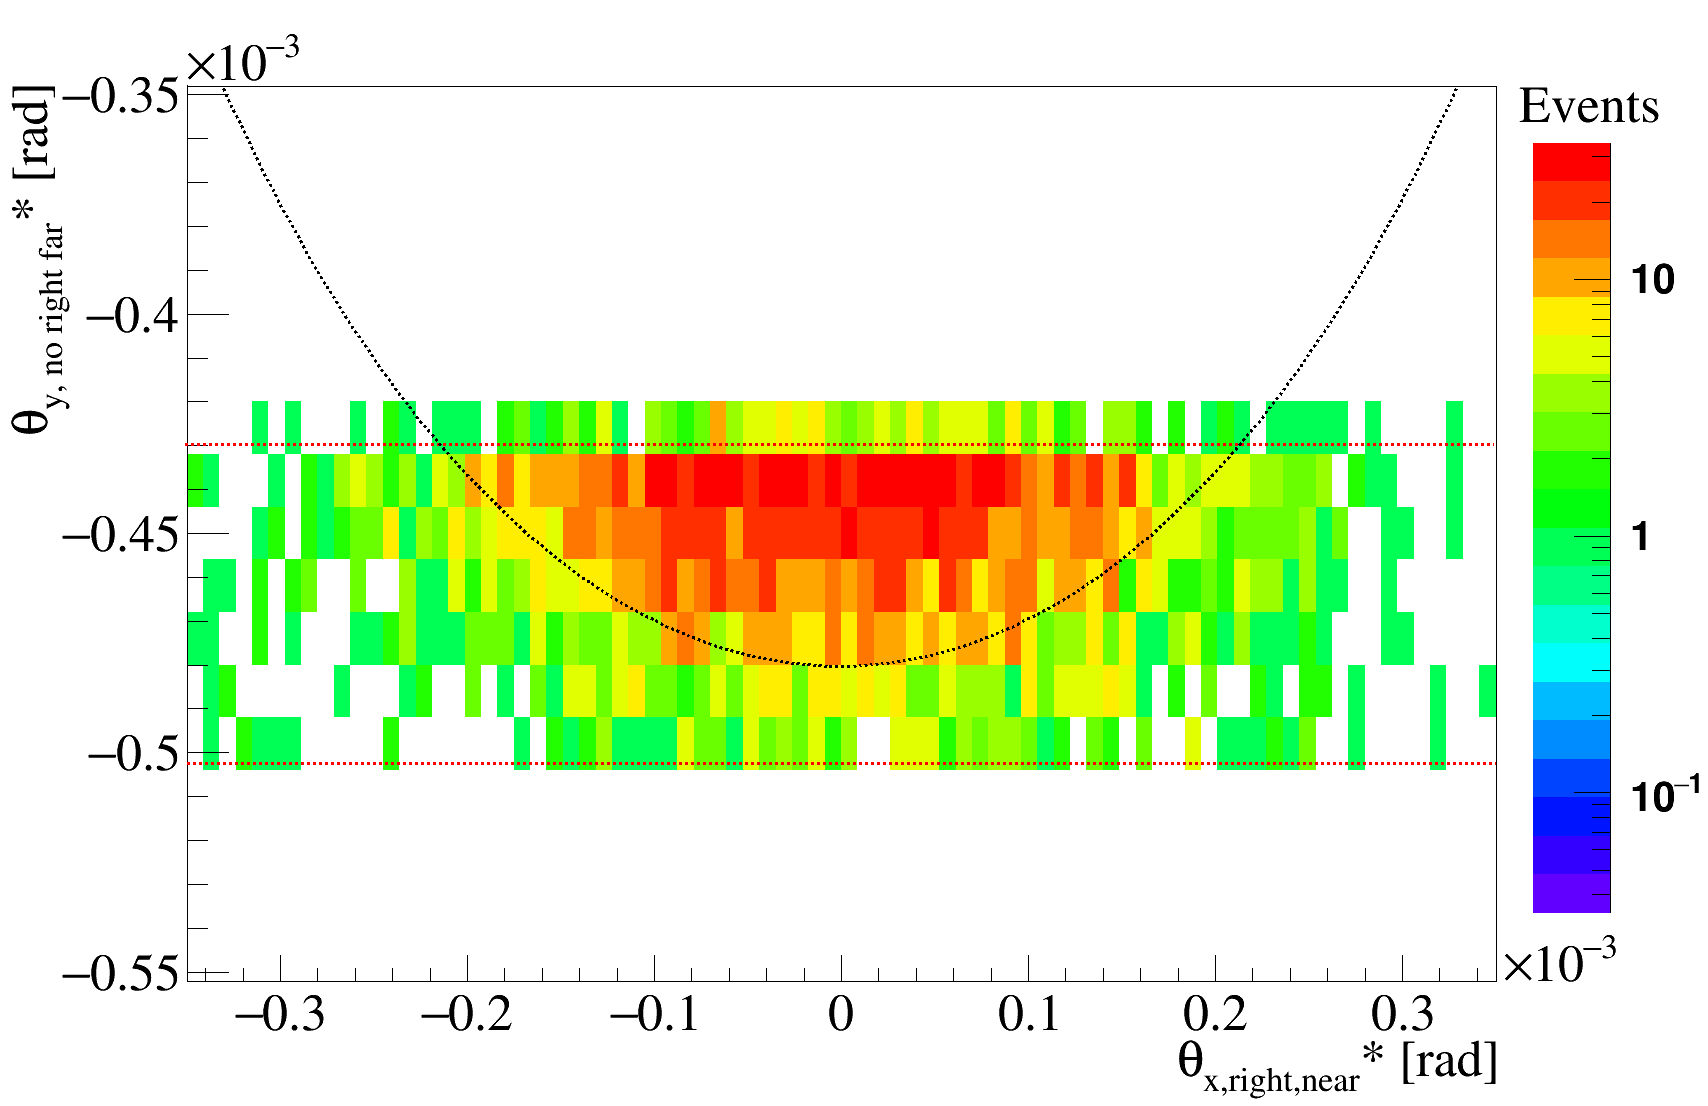
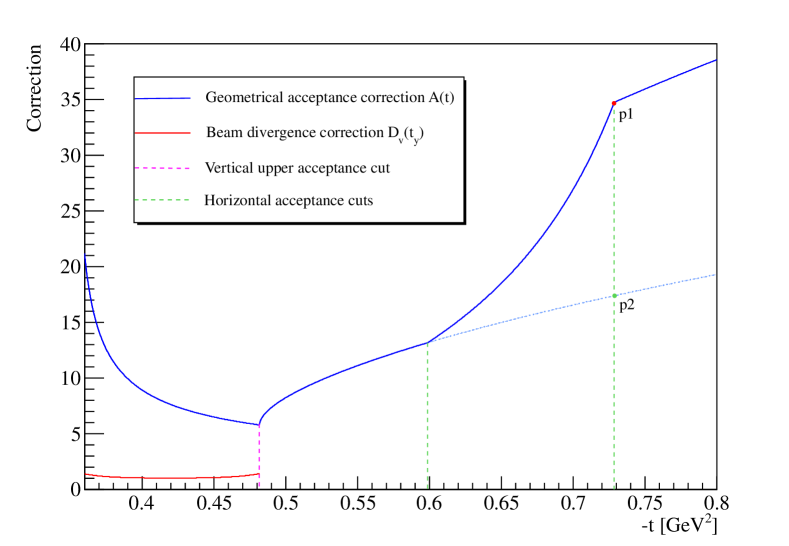
The scattering angles are large and reach LHC apertures horizontally. In both diagonals this angular cut has been measured per arm with a dedicated high statistics single arm analysis using 2 RPs. The tighter angular cut for Diagonal 1 is in the right arm rad, which is taken into account in the geometrical acceptance correction , see Figure 5. The same procedure is applied for Diagonal 2. Figure 5 also provides a reference curve for shown as a blue dashed line without the cut.
Close to the acceptance edges there is an additional acceptance loss due to the angular smearing, divergence, of the beam. This additional acceptance loss is modeled with a Gaussian distribution at the corners of the acceptance, with experimentally determined parameters. The model permits to calculate the corresponding vertical beam divergence correction , see Figure 5. In the horizontal plane the beam divergence correction is below 0.5 %.
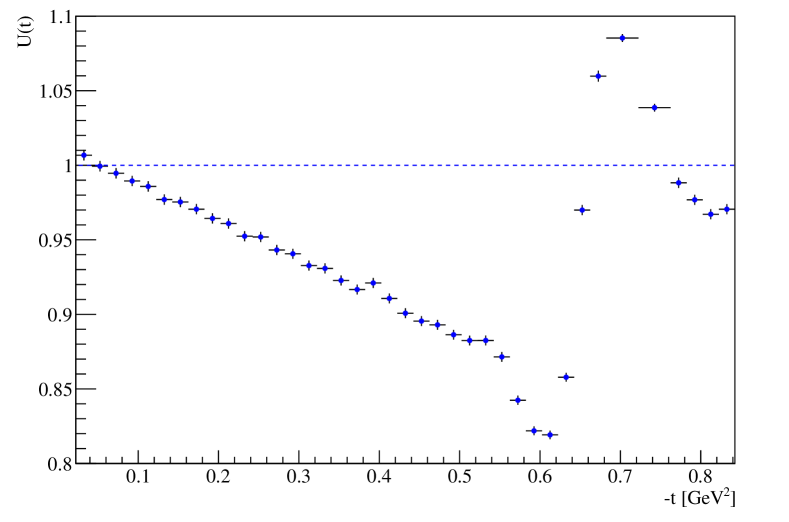
The unfolding of resolution effects is estimated with a Monte Carlo simulation. The resolution parameters are obtained from the data, see Section 3.1.2. The probability distribution of the event generator is based on the fit of the differential rate . Each generated MC event is propagated to the RP detectors with the proper model of the LHC optics, which takes into account the beam divergence and other resolution effects. The kinematics of the event is reconstructed and a histogram is built from the values. The ratio of the histograms without and with resolution effect describes the first approximation of the bin-by-bin corrections due to bin migration. The probability distribution of the simulation is multiplied with the correction histogram, to modulate the source, and the procedure is repeated until the histogram with migration effects coincide with the measured distribution, thus the correct source distribution has been found. The uncertainty of the unfolding procedure is estimated from the residual difference between the measured histogram and the simulated histogram with resolution effects.
The angular spread of the beam is determined with an uncertainty 0.5 rad by comparing the scattering angles reconstructed from the left and right arm, see Table 1. Therefore the unfolding correction factor can be calculated with a precision better than 0.1 %, see Figure 6. The event-by-event correction factor due to acceptance corrections and resolution unfolding is
| (7) |
4 The differential cross section
The inefficiency corrections due to pile-up from background and inefficiency due to an additional inefficiency of one RP out of the three used is taken into account with a relative scale factor, computed as a ratio of Diagonal 1 to Diagonal 2 in a representative -range.
After these corrections the differential rate of Diagonal 1 and Diagonal 2 agree within their statistical uncertainty over the whole -range measured. The two diagonals are almost independent measurements, thus the final measured differential rate is calculated as the bin-by-bin weighted average of the two differential elastic rates , according to their statistical uncertainty.
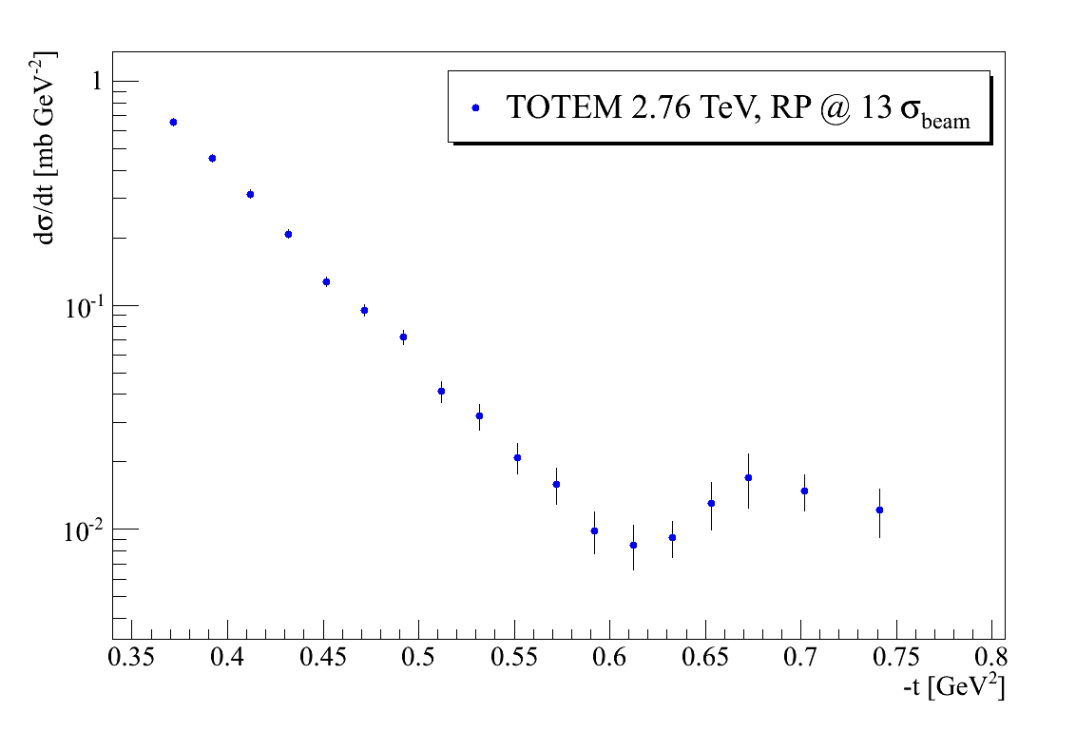
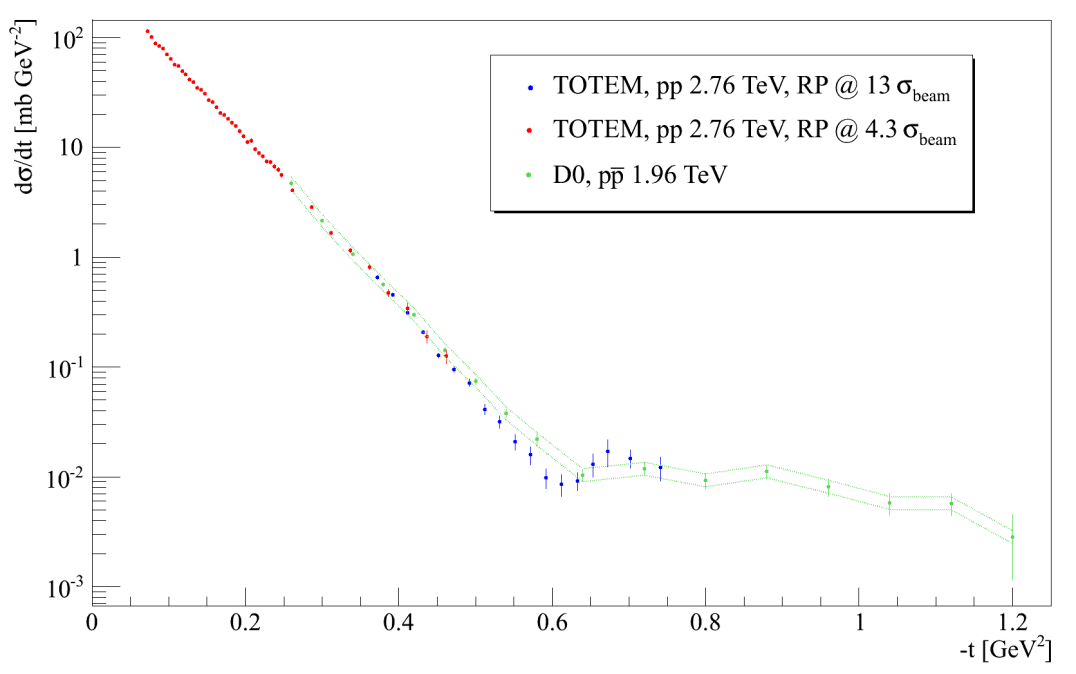
The overall normalization is determined from the total cross-section analysis at TeV, summarized in [6, 7]. The final differential cross-section is obtained by normalizing DS1 to DS2 using the integral of their exponential in the overlapping -range. The uncertainty on the normalization is about 6 %. The differential cross-section of DS1 is shown in Figure 7. Figure 8 shows the complete range of the differential cross-section covered by DS1 and DS2. The data points are summarized in Table 2, where the -dependent systematic uncertainty is also provided. Table 3 contains the data points for DS2.
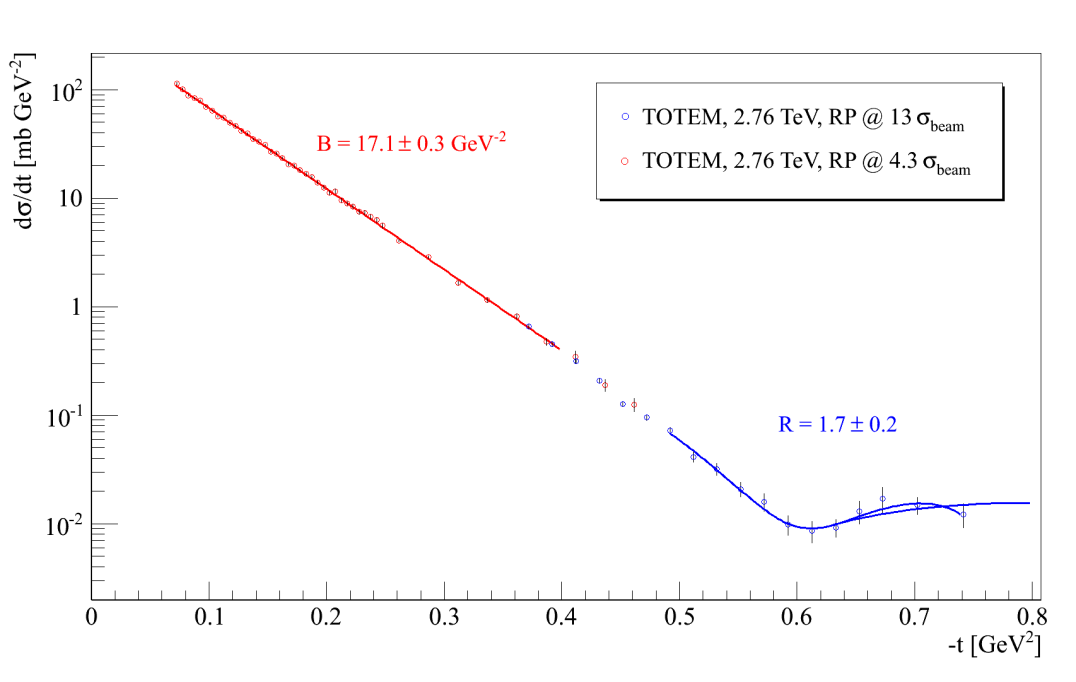
Fig. 8 shows the fit of the diffractive minimum and the possible positions of the subsequent maximum with a third order polynomial in the -range between 0.47 GeV2 and 0.74 GeV2 and beyond. In fact the data determine and characterize the -position of the dip , the cross-section at and the cross-section at the bump (the local maximum subsequent to the dip) or a lower limit of such cross-section. However, the data do not constrain the -position of the bump , which could be anywhere in the range 0.7 – 0.8 GeV2 without effecting the corresponding cross-section given the flat derivative (Fig. 8). The dip position is found to be GeV2. The overall uncertainty in (correlated bin-to-bin) is derived from the beam divergence (5 %), alignment (less than 2 %) and unfolding (less than 0.5 %).
The nuclear slope GeV-2 and the corresponding exponential fit in the -range between 0.09 GeV2 and 0.4 GeV2 of the differential cross-section are perfectly consistent with [7, 6].
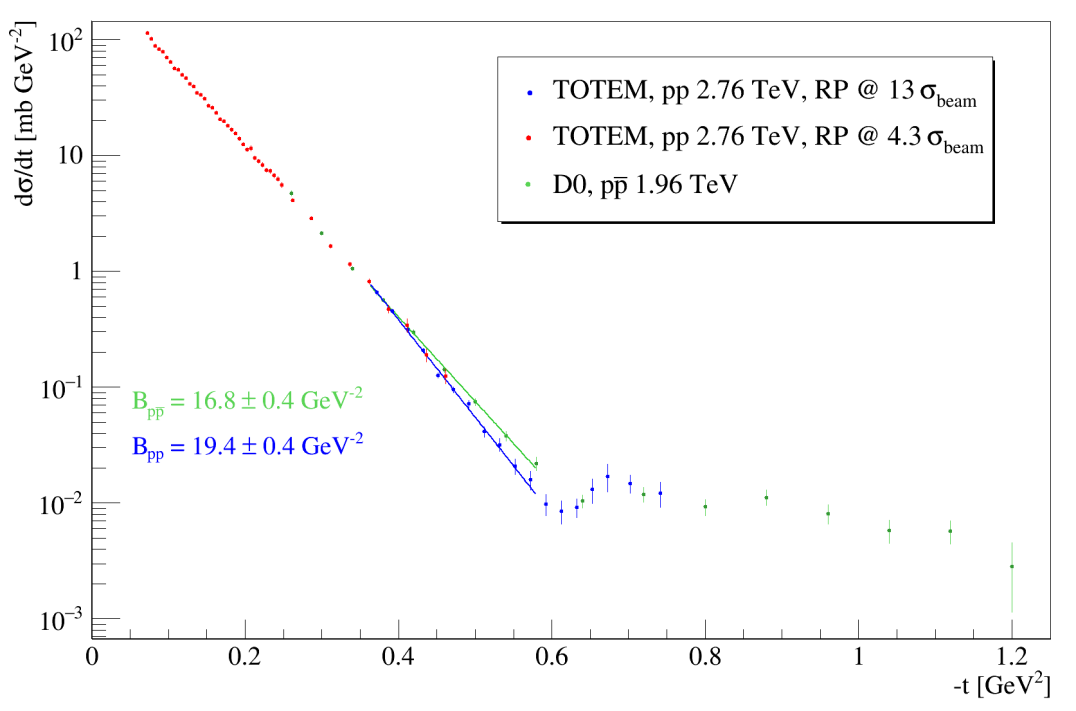
The differential cross-section is compared to the p measurement of the D0 experiment in Figure 9. The measured nuclear slopes before the dip GeV-2 and GeV-2 are key parameters to quantify the difference between pp and p, see Fig. 10. According to the nuclear slope difference, the significance of the incompatibility between the pp vs. p is greater than 4. Recently, refs. [19, 20], pointed out that the -dependent nuclear slope parameter indicates a clear Odderon effect as .
A dedicated Monte Carlo simulation has been used to simulate all analysis steps in order to model the correct propagation of the central values and their uncertainties. The simulation resulted in uncertainty corrections mainly due to the asymmetry of Poisson distributions in the bins which have lower statistics. The uncertainty on the ratio at the bump to that at the dip, , has been determined with similar MC studies.
| Statistical uncertainty | Systematic uncertainty | ||||
|---|---|---|---|---|---|
| [GeV2] | [mb GeV-2] | ||||
| 0.3625 | 0.3825 | 0.37190 | 0.6565 | 0.0277 | 0.0331 |
| 0.3825 | 0.4025 | 0.39188 | 0.4536 | 0.0183 | 0.0238 |
| 0.4025 | 0.4225 | 0.41185 | 0.3133 | 0.0140 | 0.0168 |
| 0.4225 | 0.4425 | 0.43184 | 0.2075 | 0.0091 | 0.0116 |
| 0.4425 | 0.4625 | 0.45185 | 0.1270 | 0.0062 | 0.0073 |
| 0.4625 | 0.4825 | 0.47188 | 0.0952 | 0.0056 | 0.0056 |
| 0.4825 | 0.5025 | 0.49189 | 0.0718 | 0.0054 | 0.0042 |
| 0.5025 | 0.5225 | 0.51186 | 0.0413 | 0.0044 | 0.0024 |
| 0.5225 | 0.5425 | 0.53181 | 0.0319 | 0.0041 | 0.0020 |
| 0.5425 | 0.5625 | 0.55180 | 0.0209 | 0.0033 | 0.0013 |
| 0.5625 | 0.5825 | 0.57190 | 0.0159 | 0.0029 | 0.0009 |
| 0.5825 | 0.6025 | 0.59213 | 0.0098 | 0.0021 | 0.0004 |
| 0.6025 | 0.6225 | 0.61239 | 0.0085 | 0.0019 | 0.0004 |
| 0.6225 | 0.6425 | 0.63295 | 0.0092 | 0.0017 | 0.0004 |
| 0.6425 | 0.6625 | 0.65298 | 0.0131 | 0.0031 | 0.0008 |
| 0.6625 | 0.6825 | 0.67266 | 0.0171 | 0.0047 | 0.0008 |
| 0.6825 | 0.7225 | 0.70214 | 0.0148 | 0.0027 | 0.0008 |
| 0.7225 | 0.7625 | 0.74119 | 0.0122 | 0.0030 | 0.0008 |
| Statistical uncertainty | Systematic uncertainty | ||||
|---|---|---|---|---|---|
| [GeV2] | [mb GeV-2] | ||||
| 0.0700 | 0.0750 | 0.07246 | 113.88 | 2.960 | 1.455 |
| 0.0750 | 0.0800 | 0.07746 | 101.14 | 2.181 | 1.319 |
| 0.0800 | 0.0850 | 0.08246 | 88.78 | 1.752 | 1.181 |
| 0.0850 | 0.0900 | 0.08746 | 83.25 | 1.600 | 1.130 |
| 0.0900 | 0.0950 | 0.09246 | 79.25 | 1.542 | 1.097 |
| 0.0950 | 0.1000 | 0.09746 | 69.81 | 1.326 | 0.986 |
| 0.1000 | 0.1050 | 0.10246 | 64.27 | 1.260 | 0.926 |
| 0.1050 | 0.1100 | 0.10746 | 56.75 | 1.133 | 0.833 |
| 0.1100 | 0.1150 | 0.11246 | 54.96 | 1.085 | 0.822 |
| 0.1150 | 0.1200 | 0.11746 | 49.43 | 1.002 | 0.754 |
| 0.1200 | 0.1250 | 0.12246 | 46.41 | 1.135 | 0.721 |
| 0.1250 | 0.1300 | 0.12746 | 41.59 | 0.904 | 0.658 |
| 0.1300 | 0.1350 | 0.13246 | 39.28 | 0.853 | 0.633 |
| 0.1350 | 0.1400 | 0.13746 | 34.87 | 0.782 | 0.572 |
| 0.1400 | 0.1450 | 0.14246 | 33.42 | 0.775 | 0.558 |
| 0.1450 | 0.1500 | 0.14746 | 30.92 | 0.746 | 0.526 |
| 0.1500 | 0.1550 | 0.15246 | 26.78 | 0.666 | 0.463 |
| 0.1550 | 0.1600 | 0.15746 | 25.73 | 0.645 | 0.453 |
| 0.1600 | 0.1650 | 0.16246 | 23.32 | 0.602 | 0.417 |
| 0.1650 | 0.1700 | 0.16746 | 20.63 | 0.573 | 0.376 |
| 0.1700 | 0.1750 | 0.17246 | 19.84 | 0.564 | 0.367 |
| 0.1750 | 0.1800 | 0.17746 | 18.14 | 0.520 | 0.341 |
| 0.1800 | 0.1850 | 0.18246 | 16.68 | 0.493 | 0.319 |
| 0.1850 | 0.1900 | 0.18746 | 15.61 | 0.490 | 0.303 |
| 0.1900 | 0.1950 | 0.19246 | 13.99 | 0.459 | 0.276 |
| 0.1950 | 0.2000 | 0.19746 | 12.55 | 0.426 | 0.251 |
| 0.2000 | 0.2050 | 0.20246 | 11.21 | 0.423 | 0.228 |
| 0.2050 | 0.2100 | 0.20746 | 11.56 | 0.542 | 0.239 |
| 0.2100 | 0.2150 | 0.21246 | 9.59 | 0.368 | 0.201 |
| 0.2150 | 0.2200 | 0.21746 | 8.95 | 0.358 | 0.190 |
| 0.2200 | 0.2250 | 0.22246 | 8.34 | 0.340 | 0.180 |
| 0.2250 | 0.2300 | 0.22746 | 7.47 | 0.307 | 0.164 |
| 0.2300 | 0.2350 | 0.23246 | 7.35 | 0.322 | 0.163 |
| 0.2350 | 0.2400 | 0.23746 | 6.72 | 0.307 | 0.151 |
| 0.2400 | 0.2450 | 0.24246 | 6.28 | 0.291 | 0.143 |
| 0.2450 | 0.2500 | 0.24746 | 5.58 | 0.269 | 0.129 |
| 0.2500 | 0.2750 | 0.26161 | 4.08 | 0.103 | 0.098 |
| 0.2750 | 0.3000 | 0.28661 | 2.87 | 0.089 | 0.074 |
| 0.3000 | 0.3250 | 0.31161 | 1.66 | 0.064 | 0.045 |
| 0.3250 | 0.3500 | 0.33661 | 1.15 | 0.056 | 0.033 |
| 0.3500 | 0.3750 | 0.36161 | 0.82 | 0.044 | 0.025 |
| 0.3750 | 0.4000 | 0.38661 | 0.47 | 0.036 | 0.015 |
| 0.4000 | 0.4250 | 0.41161 | 0.34 | 0.045 | 0.012 |
| 0.4250 | 0.4500 | 0.43661 | 0.19 | 0.024 | 0.007 |
| 0.4500 | 0.4750 | 0.46161 | 0.13 | 0.018 | 0.005 |
5 Discussion of the results
The TOTEM experiment at CERN LHC has observed the presence of a diffractive minimum at TeV in elastic pp scattering with high significance. The importance of this observation is that the new data measured at TeV are rather close in energy to the D0 results of p measured at TeV. Apparently, the dynamics of pp and p change on the scale of , to be studied in detail in a forthcoming TOTEM and D0 collaboration analysis.
The measured ratio of the pp differential cross-section at the bump and dip is , see Fig. 8. The pp data also shows a steepening of the differential cross-section and a change in the nuclear slope starting at GeV2 (Fig. 10). Both features are absent in the p measured at TeV of the D0 experiment, where a kink structure without a minimum and a subsequent maximum can be observed with . This value and its uncertainty can be obtained by fitting the published D0 data in the -range of the plateau (nearly constant ), including and after the kink [21]. Therefore, the incompatibility on the parameter between the p data at TeV and the pp data at 2.76 TeV is approximately 3.
At higher LHC energies of 7 TeV and 13 TeV, the dip has been observed already earlier by TOTEM. It is evidently a permanent structure in pp elastic scattering at LHC energies.
As far as we know, there are no models which are able to describe the pp TOTEM data and the D0 data (total cross-section, , dip-region) without the effects of the Odderon [22, 23, 24]. On the contrary, theoretical models including the effects of the Odderon have predicted the observed effects and are able to describe both the pp TOTEM data and the D0 data (TeV scale) [8, 25, 9].
Therefore, unless something unknown happens between 2.76 TeV and 1.96 TeV, the significant difference between the pp and differential cross-section provides evidence for a colourless 3-gluon bound state exchange in the -channel of the proton-proton elastic scattering.
The observed difference between pp and is the most classic definition of evidence for the Odderon since the last day of run at the ISR (more than 40 years ago) [26, 27, 28]. While at lower energies the diffractive dip contributions may naturally come from secondary Reggeons, their contribution is generally considered negligible, less than 1 %, at LHC energies due to their Regge trajectory intercept lower than unity [11].
A variety of odd-signature exchanges relevant at high energies have been discussed in literature, within different frameworks and under different names, see e.g. the review [29]. The “Odderon” was introduced within the axiomatic theory [9] as an amplitude contribution responsible for the difference between pp and differential cross-section in the dip region. Crossing-odd trajectories were also studied within the framework of Regge theory as a counterpart of the crossing-even Pomeron. It has also been shown that such object must exist in QCD, as a colourless bound state of three gluons with quantum numbers (see e.g. [10]). The binding strength among the 3 gluons is greater than the strength of their interaction with other particles. There is also evidence for such a state in QCD lattice calculations, known under the name “vector glueball” (see e.g. [30]). However, in lattice QCD, Odderon effects were calculated only without dynamical quarks so far. Such a state, on one hand, can be exchanged in the -channel and contribute, e.g., to the elastic scattering amplitude. On the other hand it can be created in the -channel and thus be observed in spectroscopic studies as well.
There are multiple ways how an odd-signature exchange component may manifest itself in observable data. Focussing on elastic scattering at the LHC (unpolarised beams), there are 3 regions often argued to be sensitive. In general, the effects of an odd-signature exchange (bound state of 3 or odd number of gluons) are expected to be much smaller than those of even-signature exchanges (bound state of 2 or even number of gluons). Consequently, the sensitive regions are those where the contributions from 2-bound-gluon exchanges cancel or are small. At very low- the 2-bound-gluon amplitude is expected to be almost purely imaginary, while a 3-gluon exchange would make contributions to the real part and therefore , the ratio of the real to imaginary part of the nuclear scattering amplitude, is a very sensitive parameter. The and parameter measurement of the TOTEM experiment at TeV already provided the first indication for the existence of a colourless 3-gluon bound state [6, 31].
Sometimes the high- region is also argued to be sensitive to 3-gluon exchanges since the contribution from 2-gluon exchanges is rapidly decreasing. However, preliminary high- TOTEM data at 13 TeV indicate that this region is dominated either by a perturbative-QCD amplitude, see e.g. [32], and high energy predictions [33].
The third opportunity is the comparison of the dip range, exploited in this analysis. The dip is often described as the -range where the imaginary part of the amplitude is crossing zero, thus ceding the dominance to the real part to which a 3-gluon exchange may contribute. In agreement with such predictions, the observed dips in scattering are shallower than those in pp. There are data at 53 GeV showing a significant difference between the pp and dip [28]. The interpretation of this difference is, however, complicated due to a possible non-negligible contribution from secondary Reggeons. These are not expected to give sizeable effects at the Tevatron energies, which thus gives weight to the D0 observation of a very shallow dip in elastic scattering [21] compared to the very pronounced dip measured by TOTEM at 2.76 TeV, 7 TeV and 13 TeV [3].
6 Summary
The proton-proton elastic differential cross section has been measured by the TOTEM experiment at TeV LHC energy with m beam optics. The differential cross-section can be described with an exponential in the range GeV2, followed by a significant diffractive minimum at GeV2. The ratio of the between the bump (the local maximum subsequent to the dip) and dip is . This value is significantly different from , obtained from the measurement of the D0 experiment at .
Neglecting the small energy difference in between the measurements of the TOTEM and D0 collaborations [21], the results provide evidence for a colourless 3-gluon bound state exchange in the -channel of the proton-proton elastic scattering. The presented observables and the nuclear slope before the dip () are both dependent, and this dependence has to be studied in detail in order to quantify the exact significance of the observation. This will be the subject of a forthcoming joint publication by the TOTEM and D0 experiments.
Acknowledgments
We are grateful to the beam optics development team for providing the beams and operating the instrumentation, to the machine coordinators and the LPC coordinators for scheduling the dedicated fills.
This work was supported by the institutions listed on the front page and partially also by NSF (US), the Magnus Ehrnrooth Foundation (Finland), the Waldemar von Frenckell Foundation (Finland), the Academy of Finland, the Finnish Academy of Science and Letters (The Vilho Yrjö and Kalle Väisälä Fund), the Circles of Knowledge Club (Hungary) and the OTKA NK 101438 and the EFOP-3.6.1-16-2016-00001 grants (Hungary). Individuals have received support from Nylands nation vid Helsingfors universitet (Finland), MSMT CR (the Czech Republic), the János Bolyai Research Scholarship of the Hungarian Academy of Sciences, the NKP-17-4 New National Excellence Program of the Hungarian Ministry of Human Capacities and the Polish Ministry of Science and Higher Education Grant no. MNiSW DIR/WK/2017/07-01.
References
- [1] G. Antchev et al. (TOTEM collaboration), Phys. Rev. Lett. 111 (2013) .
- [2] G. Antchev et al. (TOTEM collaboration), Eur. Phys. J. C76 (2016) .
- [3] G. Antchev et al. (TOTEM collaboration), EPL 96 (2011) 21002.
- [4] G. Antchev et al. (TOTEM collaboration), EPL 101 (2013) .
- [5] F. J. Nemes PoS DIS2017 (2018) 059.
- [6] G. Antchev et al. (TOTEM collaboration), no. CERN-EP-2017-321, (2017) . http://cds.cern.ch/record/2296409.
- [7] G. Antchev et al. (TOTEM collaboration), in preparation: Measurement of proton-proton elastic scattering and total cross-section at = 2.76 TeV (2017) .
- [8] L. Lukaszuk and B. Nicolescu Lett. Nuovo Cim. 8 (1973) 405–413.
- [9] P. Gauron, L. Lukaszuk, and B. Nicolescu Phys. Lett. B294 (1992) 298–302.
- [10] J. Bartels, L. N. Lipatov, and G. P. Vacca Phys. Lett. B477 (2000) 178–186, arXiv:hep-ph/9912423 [hep-ph].
- [11] L. Jenkovszky, I. Szanyi, and C.-I. Tan Eur. Phys. J. A54 (2018) .
- [12] G. Anelli et al. (TOTEM collaboration), JINST 3 (2008) S08007.
- [13] G. Antchev et al. (TOTEM collaboration), TOTEM Upgrade Proposal (2013) .
- [14] G. Ruggiero et al. Nucl. Instrum. Meth. A604 (2009) 242–245.
- [15] O. S. Bruning, P. Collier, P. Lebrun, S. Myers, R. Ostojic, J. Poole, and P. Proudlock.
- [16] G. Antchev et al. (TOTEM collaboration), New J. Phys. 16 (2014) 103041.
- [17] F. Nemes, Elastic scattering of protons at the TOTEM experiment at the LHC. PhD thesis, Eötvös U., 2015. Presented 15 Oct 2015.
- [18] G. Antchev et al. (TOTEM collaboration), Nucl. Phys. B899 (2015) 527–546.
- [19] E. Martynov and B. Nicolescu arXiv:1808.08580 [hep-ph].
- [20] T. Csörgő, R. Pasechnik, and A. Ster arXiv:1807.02897 [hep-ph].
- [21] V. M. Abazov et al. Phys. Rev. D86 (2012) 012009, arXiv:1206.0687 [hep-ex].
- [22] J. R. Cudell, V. V. Ezhela, P. Gauron, K. Kang, Yu. V. Kuyanov, S. B. Lugovsky, E. Martynov, B. Nicolescu, E. A. Razuvaev, and N. P. Tkachenko , Phys. Rev. Lett. 89 (2002) 201801.
- [23] V. A. Khoze, A. D. Martin, and M. G. Ryskin Phys. Rev. D97 no. 3, (2018) 034019, arXiv:1712.00325 [hep-ph].
- [24] V. A. Khoze, A. D. Martin, and M. G. Ryskin Eur. Phys. J. C74 no. 2, (2014) 2756, arXiv:1312.3851 [hep-ph].
- [25] E. Martynov and B. Nicolescu Phys. Lett. B778 (2018) 414–418, arXiv:1711.03288 [hep-ph].
- [26] A. Breakstone et al. Phys. Rev. Lett. 54 (1985) 2180.
- [27] A. Breakstone et al. Nucl. Phys. B248 (1984) 253–260.
- [28] U. Amaldi and K. R. Schubert Nucl. Phys. B166 (1980) 301–320.
- [29] C. Ewerz, “The Odderon: Theoretical status and experimental tests,” in 11th International Conference on Elastic and Diffractive Scattering: Towards High Energy Frontiers: The 20th Anniversary of the Blois Workshops, 17th Rencontre de Blois (EDS 05) Chateau de Blois, Blois, France, May 15-20, 2005. 2005. arXiv:hep-ph/0511196 [hep-ph].
- [30] C. J. Morningstar and M. J. Peardon Phys. Rev. D60 (1999) 034509, arXiv:hep-lat/9901004 [hep-lat].
- [31] G. Antchev et al. (TOTEM collaboration), no. CERN-EP-2017-335, (2017) . https://cds.cern.ch/record/2298154.
- [32] A. Donnachie and P. V. Landshoff Z. Phys. C2 (1979) 55. [Erratum: Z. Phys.C2,372(1979)].
- [33] S. J. Brodsky and G. R. Farrar Phys. Rev. Lett. 31 (1973) 1153–1156.