The structural, mechanical, electronic, optical and thermodynamic properties of t-X3As4 (X Si, Ge and Sn) by first-principles calculations
Abstract
The structural, mechanical, electronic, optical and thermodynamic properties of the t-X3As4 (X Si, Ge and Sn) with tetragonal structure have been investigated by first principles calculations. Our calculated results show that these compounds are mechanically and dynamically stable. By the study of elastic anisotropy, it is found that the anisotropic of the t-Sn3As4 is stronger than that of t-Si3As4 and t-Ge3As4. The band structures and density of states show that the t-X3As4 (Si, Ge and Sn) are semiconductors with narrow band gaps. Based on the analyses of electron density difference, in t-X3As4 As atoms get electrons, X atoms lose electrons. The calculated static dielectric constants, , are 15.5, 20.0 and 15.1 eV for t-X3As4 (X Si, Ge and Sn), respectively. The Dulong-Petit limit of t-X3As4 is about 10 J mol-1K-1. The thermodynamic stability successively decreases from t-Si3As4 to t-Ge3As4 to t-Sn3As4.
Key words: t-X3As4, mechanical properties, optoelectronic properties, thermodynamic properties, first-principles calculations
PACS: 61.82.Bg, 62.20.dc, 71.20.Be, 71.15.Mb
Abstract
Структурнi, механiчнi, електроннi, оптичнi i термодинамiчнi властивостi t-X3As4 (X Si, Ge i Sn) з тетрагональною структурою дослiджено з першопринципних розрахункiв. Результати обчислень показують, що цi сполуки є механiчно i динамiчно стiйкими. Дослiдивши пружну анiзотропiю, встановлено, що анiзотропiя t-Sn3As4 є сильнiша, нiж анiзотропiя t-Si3As4 i t-Ge3As4. Зонна структура i густина станiв показують, що t-X3As4 (Si, Ge i Sn) — це напiвпровiдники з вузькими забороненими зонами. На основi аналiзу рiзницi електронної густини встановлено, що у t-X3As4 атоми As отримують електрони, а X атоми втрачають електрони. Розрахованi статичнi дiелектричнi сталi, , є 15.5, 20.0 i 15.1 еВ вiдповiдно для t-X3As4 (X Si, Ge i Sn). Границя Дюлонга-Птi t-X3As4 є бiля 10 Джмоль-1K-1. Термодинамiчна стiйкiсть поступово понижується вiд t-Si3As4 до t-Ge3As4 i до t-Sn3As4.
Ключовi слова: t-X3As4, механiчнi властивостi, оптоелектроннi властивостi, термодинамiчнi властивостi, першопринципнi розрахунки
1 Introduction
Liu and Cohen predict the -C3N4 possesses the property of low compressibility. The structural and electronic properties of IV3V4 compounds have attracted more and more attention [1]. The hardness of the cubic silicon nitride was experimentally determined to be 35.31 GPa as the third hardest material after diamond and cubic boron nitride [2]. The thermal stability of the cubic silicon nitride was studied by X-ray powder diffraction and scanning electron microscopy which shows that the material is stable up to 1673 K in air. So, the material is suitable for engineering superhard ceramics for high temperature structural applications [2]. IV3V4 compounds have important potential applications in technical and scientific fields. The group IV nitrides have low compressibility and high hardness [3]. They have a wide application prospect in cutting [3]. Ching predicts the properties of the group IV nitrides using first principles theory [1]. Feng investigates the properties of pseudocubic-X3P4 (X C, Si, Ge and Sn) by using the first principle calculations [1]. They find that the modulus decreases with the atom change from C to Sn [1].
The structural and electronic properties of pseudocubic-X3As4 are investigated by using first principles method [1]. The pseudocubic-C3As4 is predicted to be metallic, pseudocubic-Si3As4, Ge3As4 and Sn3As4 are semiconductors [4]. Although X3As4 have a wide range of applications in physics and chemistry, little research has been conducted regarding its mechanical and optical properties. Due to the lack of relevant experimental data at present, if we want to understand the application of tetragonal X3As4, further theoretical and computational research on its properties should be done.
In this work, the structural parameters, mechanical, electronic, optical and thermodynamic properties of the tetragonal X3As4 are calculated by using the first-principles method based on plane waves and pseudo-potentials. By consulting the literature, we find that nobody has ever conducted experimental studies of the properties of the X3As4 (X Si, Ge and Sn). Therefore, we do not have the experimental data to compare with.
2 Computational methods
The structural optimization, mechanical, electronic, optical and thermodynamic properties of t-X3As4 are calculated by using the density functional theory (DFT) with the generalized gradient approximation (GGA) parameterized by Perdew, Burke and Ernzerrof (PBE) in the CASTEP code [5]. The band structures, electronic density of states (DOS) are calculated by PBE0 hybrid functional. The phonon spectra and phonon density of states (PHDOS) are calculated by using first-principles linear response method. Plane wave cut-off energy is set at 610 eV. The convergence test and energy cut-off analysis of -point mesh samples show that the convergence of the Brillouin zone sampling and the kinetic energy cut-off are reliable and satisfy the computational requirements [6, 7]. The Broyden-Fletcher-Goldfarb-Shanno (BFGS) minimization scheme is used in geometry optimization. The value of self-consistent field tolerance threshold is set as eV/atom. The maximum Hellmann-Feynman force, the maximum stress and the maximum displacement are set to be 0.01 eV/Å, 0.02 GPa and Å in geometry optimization, respectively. The Monkhorst-Pack -points in the first irreducible Brillouin zone are given as for t-X3As4, respectively. The mechanical, electronic, optical and thermodynamic properties of t-X3As4 are computed according to the optimized crystal structures and parameters.
3 Results and discussions
3.1 Structural properties
| Structure | |||||||
|---|---|---|---|---|---|---|---|
| Si3As4 | 5.36 | 5.36 | 10.69 | 90.00 | 90.00 | 90.00 | 307.24 |
| Ge3As4 | 5.48 | 5.48 | 11.00 | 90.00 | 90.00 | 90.00 | 330.56 |
| Sn3As4 | 5.83 | 5.83 | 11.73 | 90.00 | 90.00 | 90.00 | 398.66 |
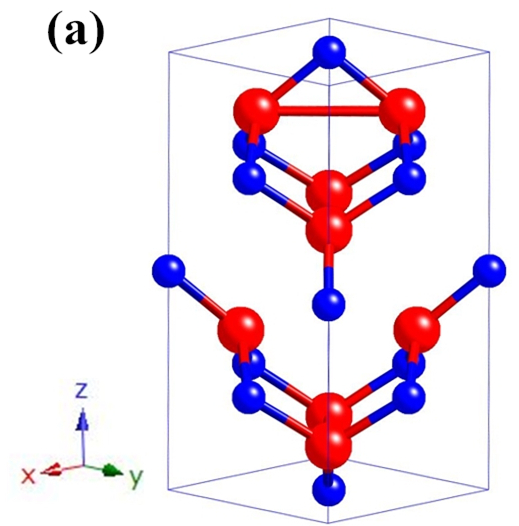
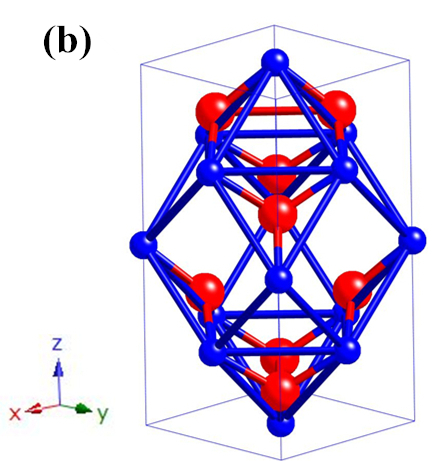
The t-X3As4 has a tetragonal structure with I-42M (No. 121). Figure 1 shows the crystal structures of t-X3As4 at 0 GPa. The t-Si3As4, t-Ge3As4 and t-Sn3As4 are all centro-symmetry structures (0, 0, 0) with 14 atoms/unit cell. The lattice parameters and volumes of t-X3As4 at 0 GPa are calculated on the basis of geometry optimization and are presented in table 1. The density values of t-X3As4 are 4.15015 g/cm3, 5.19889 g/cm3 and 5.46287 g/cm3, respectively.
3.2 Mechanical properties
The nine independent quantities of the elastic constants for t-X3As4 are calculated and presented in table 2. The mechanical stabilities of t-X3As4 can be estimated by elastic constants. In this work, the mechanical stabilities and mechanical moduli of t-X3As4 are approximated by the corresponding relationships for a tetragonal crystal class [8, 9, 10, 11]. The elastic stability criteria of tetragonal phases are given as follows [12]:
| (1) |
As indicated in table 2, the calculated elastic constants of the t-X3As4 do satisfy the criteria, indicating that they are mechanically stable. The t-Si3As4 exhibits the largest elastic constants of , , . For the t-Si3As4 and the t-Sn3As4, the calculated and are equal and they are larger than . Hence, the mechanical strength in [100] and [010] directions is stronger than that in [001] direction. Moreover, , and denote the shear moduli in (100), (010) and (001) crystal planes, respectively. For t-Ge3As4, the values of and are the same and smaller than . Hence, the mechanical strength in [100] and [010] directions are smaller than that in [001] direction. From table 2, the , of t-X3As4 are equal and they are larger than . Therefore, the shear moduli at (100) and (010) crystal planes are larger than that of (001) crystal planes.
| Species | |||||||||
|---|---|---|---|---|---|---|---|---|---|
| Si3As4 | 97.34 | 35.86 | 36.85 | 97.34 | 36.85 | 94.60 | 49.34 | 49.34 | 42.90 |
| Ge3As4 | 80.97 | 30.70 | 34.87 | 80.97 | 34.87 | 85.04 | 39.06 | 39.06 | 32.60 |
| Sn3As4 | 54.68 | 24.29 | 27.06 | 54.68 | 27.06 | 52.30 | 25.16 | 25.16 | 21.49 |
From the calculated elastic constants, other mechanical parameters such as bulk modulus (, shear modulus (, Young’s modulus ( and Poisson’s ratio ( can be derived using Voigt-Reuss-Hill (VRH) approximation [8]. For t-X3As4, based on elastic constants, the Reuss shear modulus ( and the Voigt shear modulus ( are as follows:
| (2) |
| (3) |
The Reuss bulk modulus () and the Voigt bulk modulus () are defined as
| (4) |
| (5) |
where the relationship between and is shown as
| (6) |
In the above formulae, the represents the elastic stiffness matrix and the represents the elastic flexibility matrix. The Hill’s averages are taken from the averages of the two [8]
| (7) |
| (8) |
The Young’s modulus, , and Poisson’s ratio, , can be calculated by the equations
| (9) |
| (10) |
| Species | |||||||||
|---|---|---|---|---|---|---|---|---|---|
| Si3As4 | 56.49 | 56.48 | 40.30 | 38.27 | 56.49 | 39.28 | 95.67 | 0.22 | 1.44 |
| Ge3As4 | 49.76 | 49.66 | 31.91 | 30.50 | 49.71 | 31.20 | 77.42 | 0.24 | 1.59 |
| Sn3As4 | 35.38 | 35.38 | 19.91 | 18.42 | 35.38 | 19.16 | 48.70 | 0.27 | 1.85 |
From the calculated results, t-Si3As4 has the largest value of bulk modulus among t-X3As4, which indicates that t-Si3As4 has a lower compressibility. The shear modulus of t-Si3As4 is the largest in t-X3As4, indicating that t-Si3As4 has a strong rigidity. The Young’s modulus values of t-X3As4 show that t-Si3As4 has a larger hardness.
The Poisson’s ratio represents the stability of the shear strain of the crystal. For a typical metal, the value should be 0.33. For the ionic-covalent crystal, the value ranges from 0.2 to 0.3. Poisson’s ratio of the strong covalent crystal is relatively small, usually below 0.15 [8]. For t-X3As4, the Poisson’s ratios show that they are ionic-covalent crystal.
The ratio reflects the brittleness or ductility of a material, and the critical value is close to 1.75 [13]. Below 1.75, the material shows brittleness; otherwise it shows toughness. As indicated in table 3, the / values for t-Si3As4 and t-Ge3As4 are smaller than 1.75, and the / value for t-Sn3As4 is higher than 1.75. Hence, t-Si3As4 and t-Ge3As4 show brittleness and t-Sn3As4 shows toughness.
It is well known that elastic anisotropy plays an important role in engineering science and crystal physics. The shear anisotropic factor for the (100) shear planes between [011] and [010] directions can be written by [14]:
| (11) |
For the (010) shear plane between [101] and [001] direction is:
| (12) |
For the (001) shear planes between [110] and [010] direction is:
| (13) |
For isotropic crystal, the factors and must be 1, while the deviation from 1 is a measure of the degree of the elastic anisotropy. Furthermore, since the compound is tetragonal, rather than cubic, the shear anisotropic factors are not sufficient to describe the elastic anisotropy. Therefore, the anisotropy of the linear bulk modulus should be considered. The anisotropy of the bulk modulus along and axes relative to the anisotropy along axis can be estimated using the following equations:
| (14) |
When the value is 1, it represents an elastic isotropy, but if it is not equal to 1, it is an elastic anisotropy. Where , and are the bulk moduli along different crystal axes, defined as
| (15) |
| (16) |
| (17) |
| (18) |
| (19) |
| (20) |
In addition, the percentage of elastic anisotropy for bulk modulus and shear modulus in polycrystalline materials can be used as follows:
| (21) | ||||
| (22) |
The implication of the definition is that the value of zero corresponds to elastic isotropy and the value of 100% identifies the largest elastic anisotropy.
| Si3As4 | 1.67 | 1.67 | 1.40 | 1.00 | 1.00 | 0.00 | 0.03 | 171.17 | 171.17 | 166.12 |
| Ge3As4 | 1.62 | 1.62 | 1.30 | 1.00 | 1.20 | 0.00 | 0.03 | 140.82 | 140.82 | 168.47 |
| Sn3As4 | 1.90 | 1.90 | 1.41 | 1.00 | 1.02 | 0.00 | 0.04 | 105.62 | 105.62 | 107.23 |
The calculated results are listed in table 4. It is seen that t-X3As4 are elastic anisotropic. The t-Sn3As4 shows to be more anisotropic than t-Si3As4 and t-Ge3As4. For t-X3As4, the bulk moduli along axis are equal to that along the . For t-Si3As4, the bulk modulus along axis is smaller than that along axis and axis. For t-Ge3As4 and t-Sn3As4, the bulk moduli along axis are larger than that along axis and axis. In addition, we also noticed that the percentage bulk moduli anisotropy is smaller than shear modulus anisotropy , suggesting that the structures are anisotropic in compressibility.
3.3 Phonon spectra
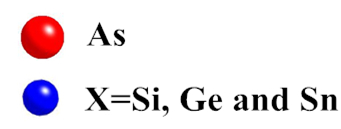
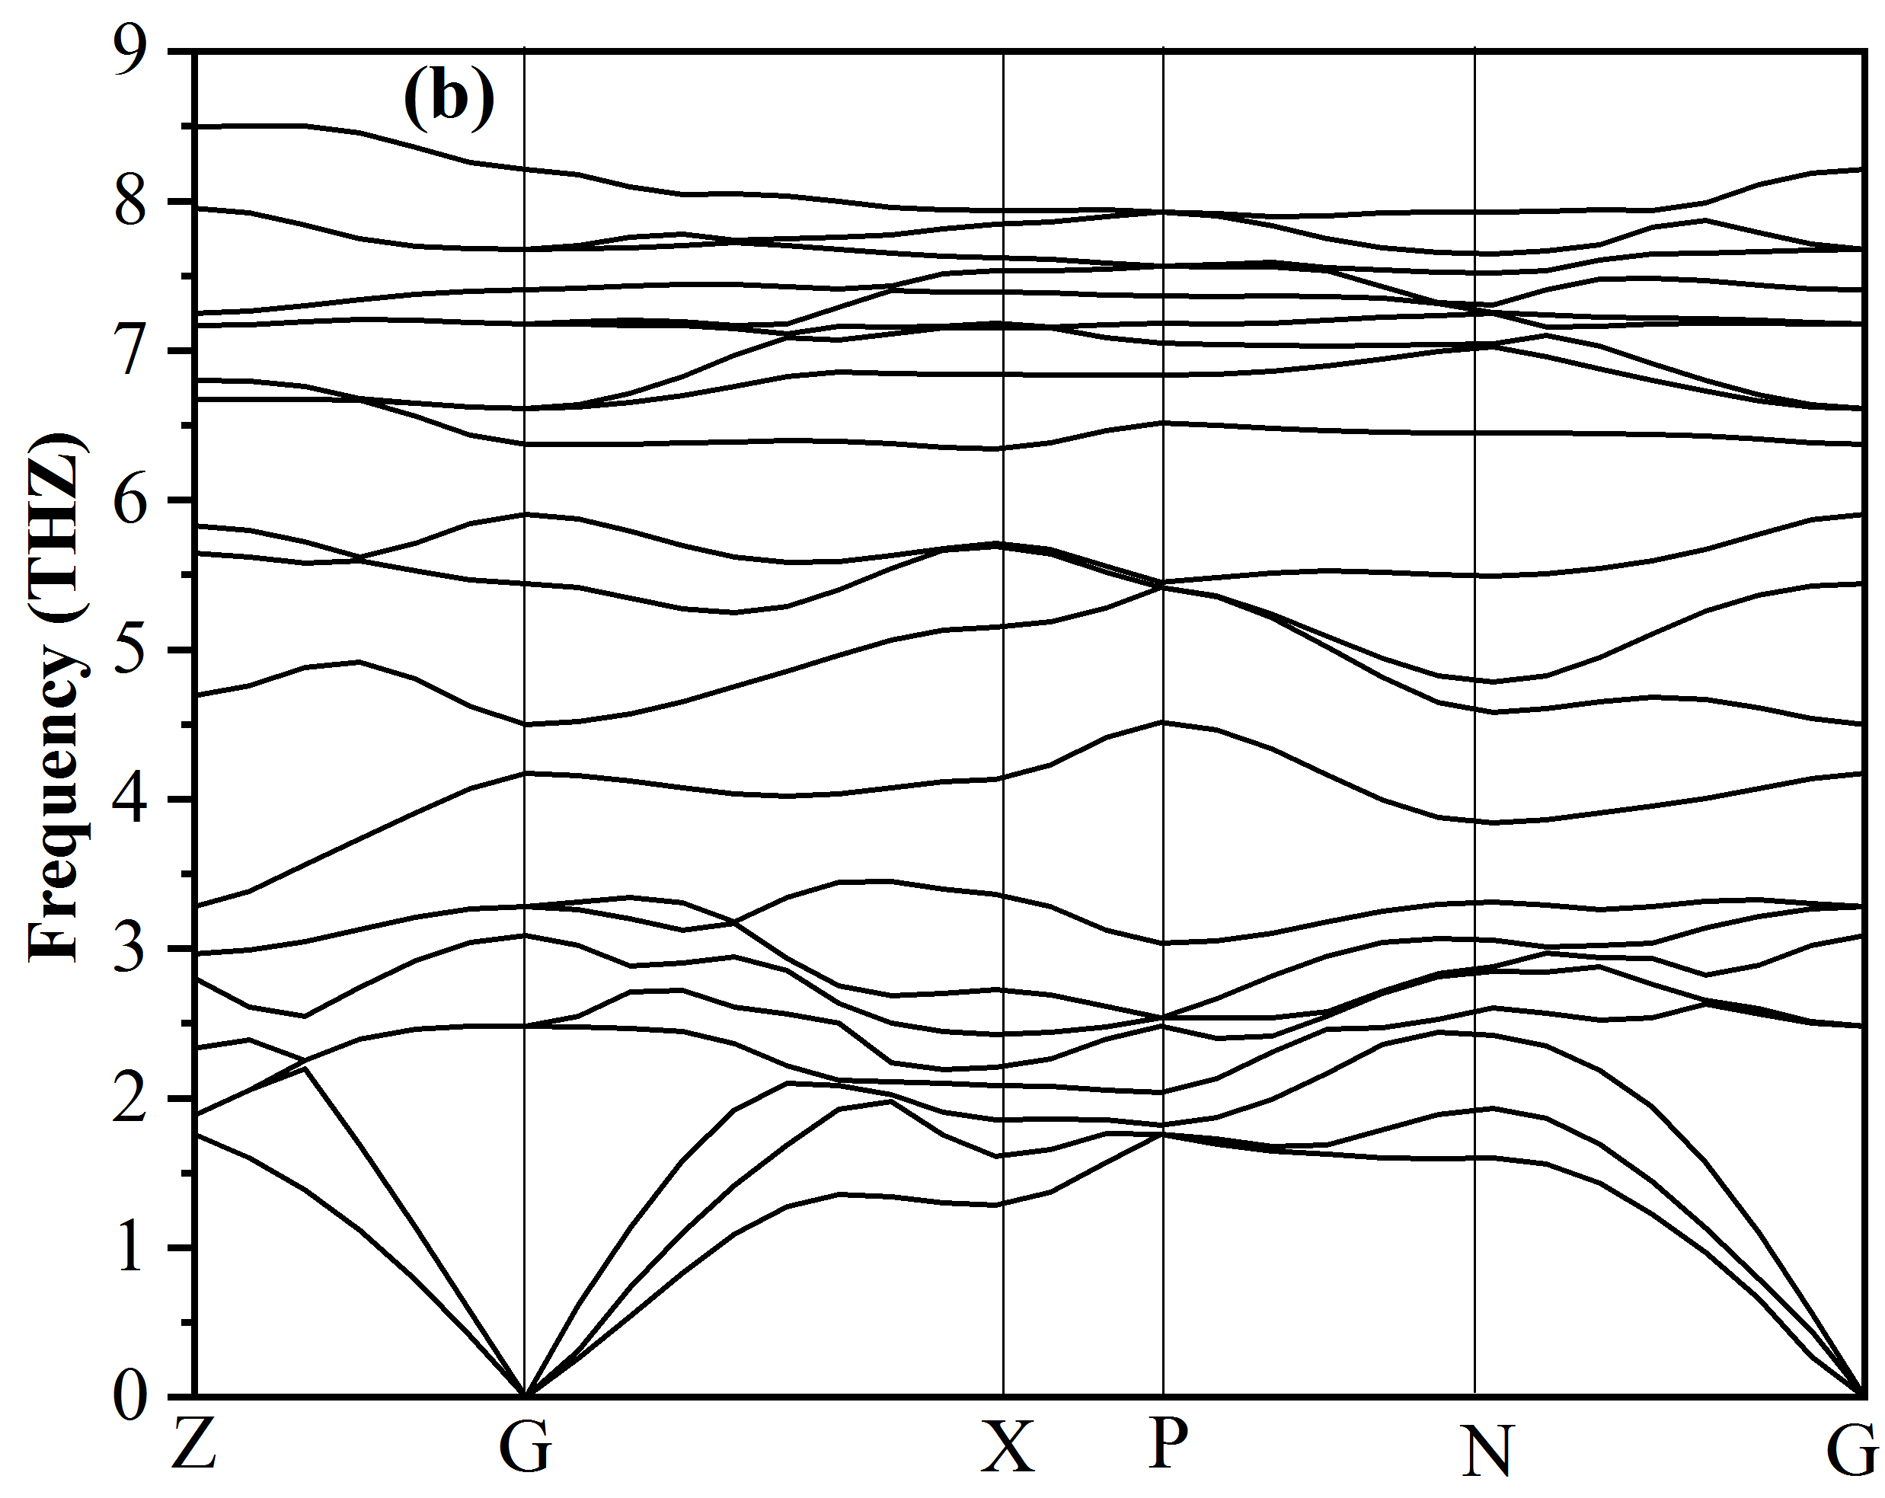
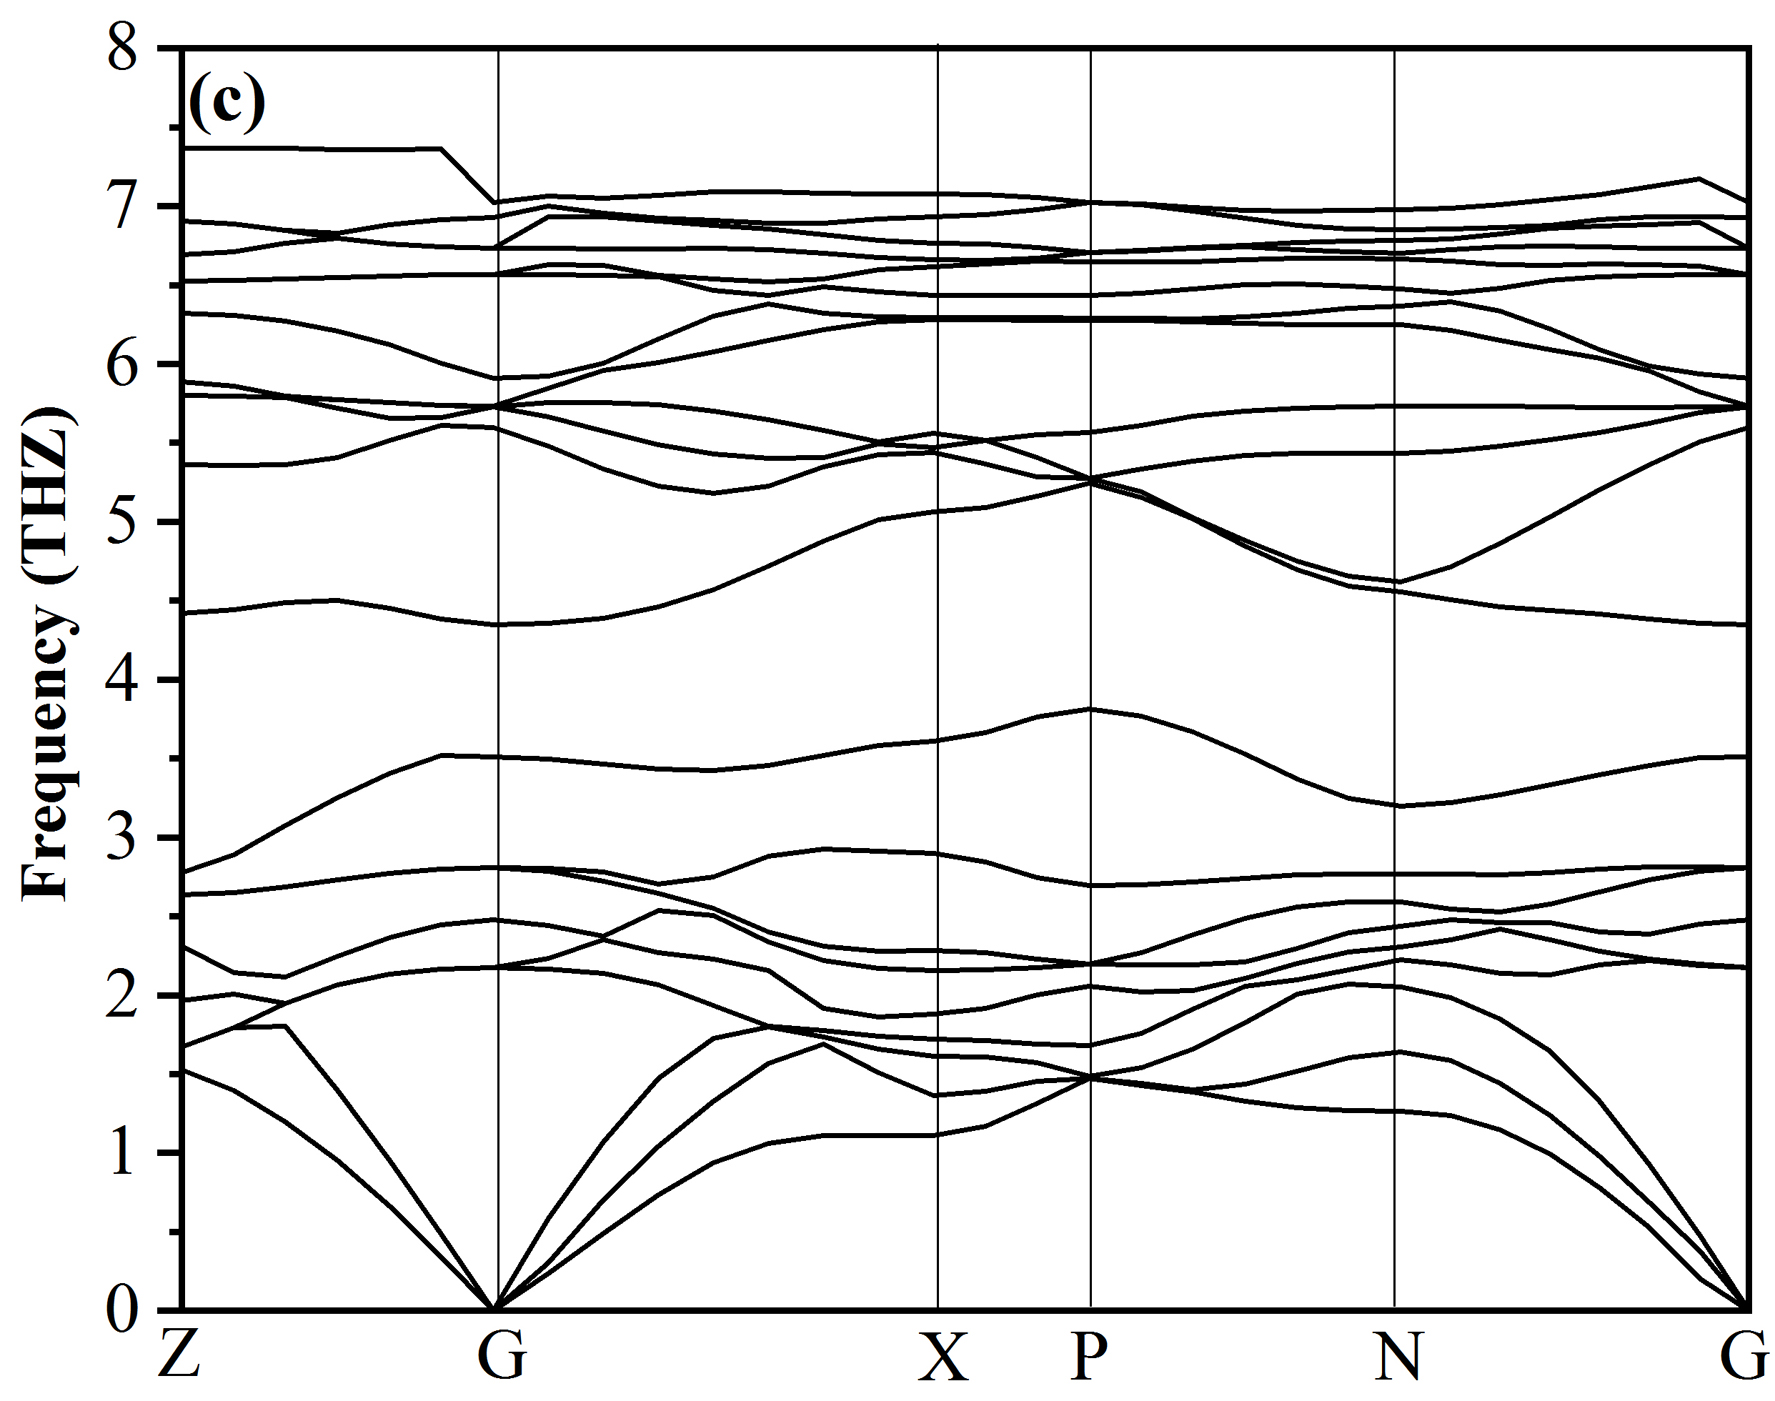
The calculated phonon dispersion spectra of t-X3As4 at 0 GPa are shown in figure 2. No any imaginary phonon frequencies in the entire Brillouin zone confirms that t-X3As4 are dynamically stable [15, 16]. Since there are seven atoms in the protocell of t-X3As4, the crystal should have twenty one dispersion relationships in theory. That is, there should be twenty one phonon spectra calculation curves, which shows that the calculated results in this paper are consistent with the theoretical conclusions. Some of the twenty one phonon spectral curves overlap in some range of wave vectors. There are three acoustic branches and eighteen optical branches. Lattice vibrational modes play a major role in Raman scattering and infrared absorption at point . From figure 2 (a) and figure 3 (a), we can see that an optical gap exists in the phonon dispersion spectrum of t-Si3As4. This is due to the large quality difference between Si atom and As atom. From figure 2 (b) and figure 3 (b), we can observe that the optical band gap of t-Ge3As4 is smaller than that of t-Si3As4, which is due to the mass difference between Ge and As being smaller. A similar situation occurs in t-Sn3As4.
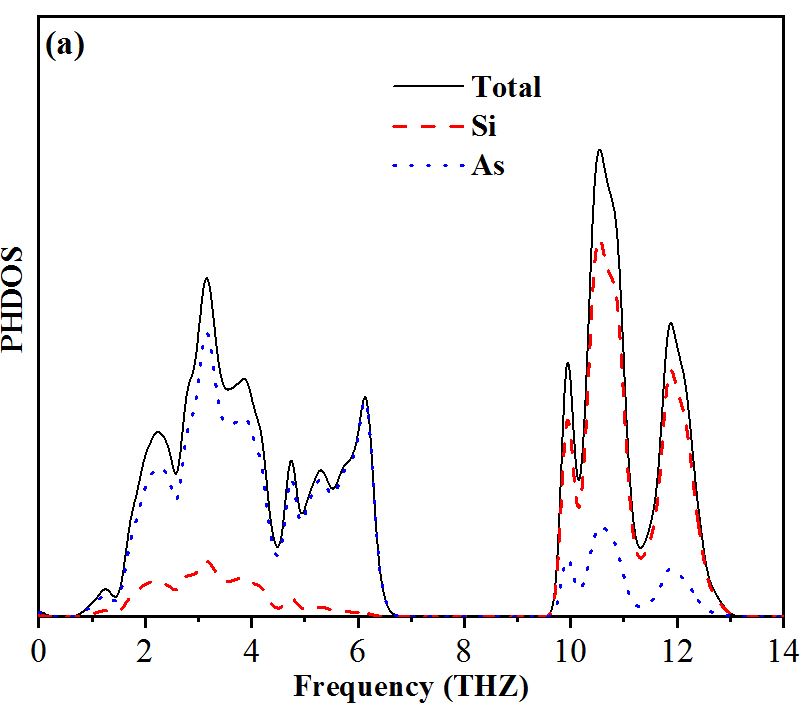
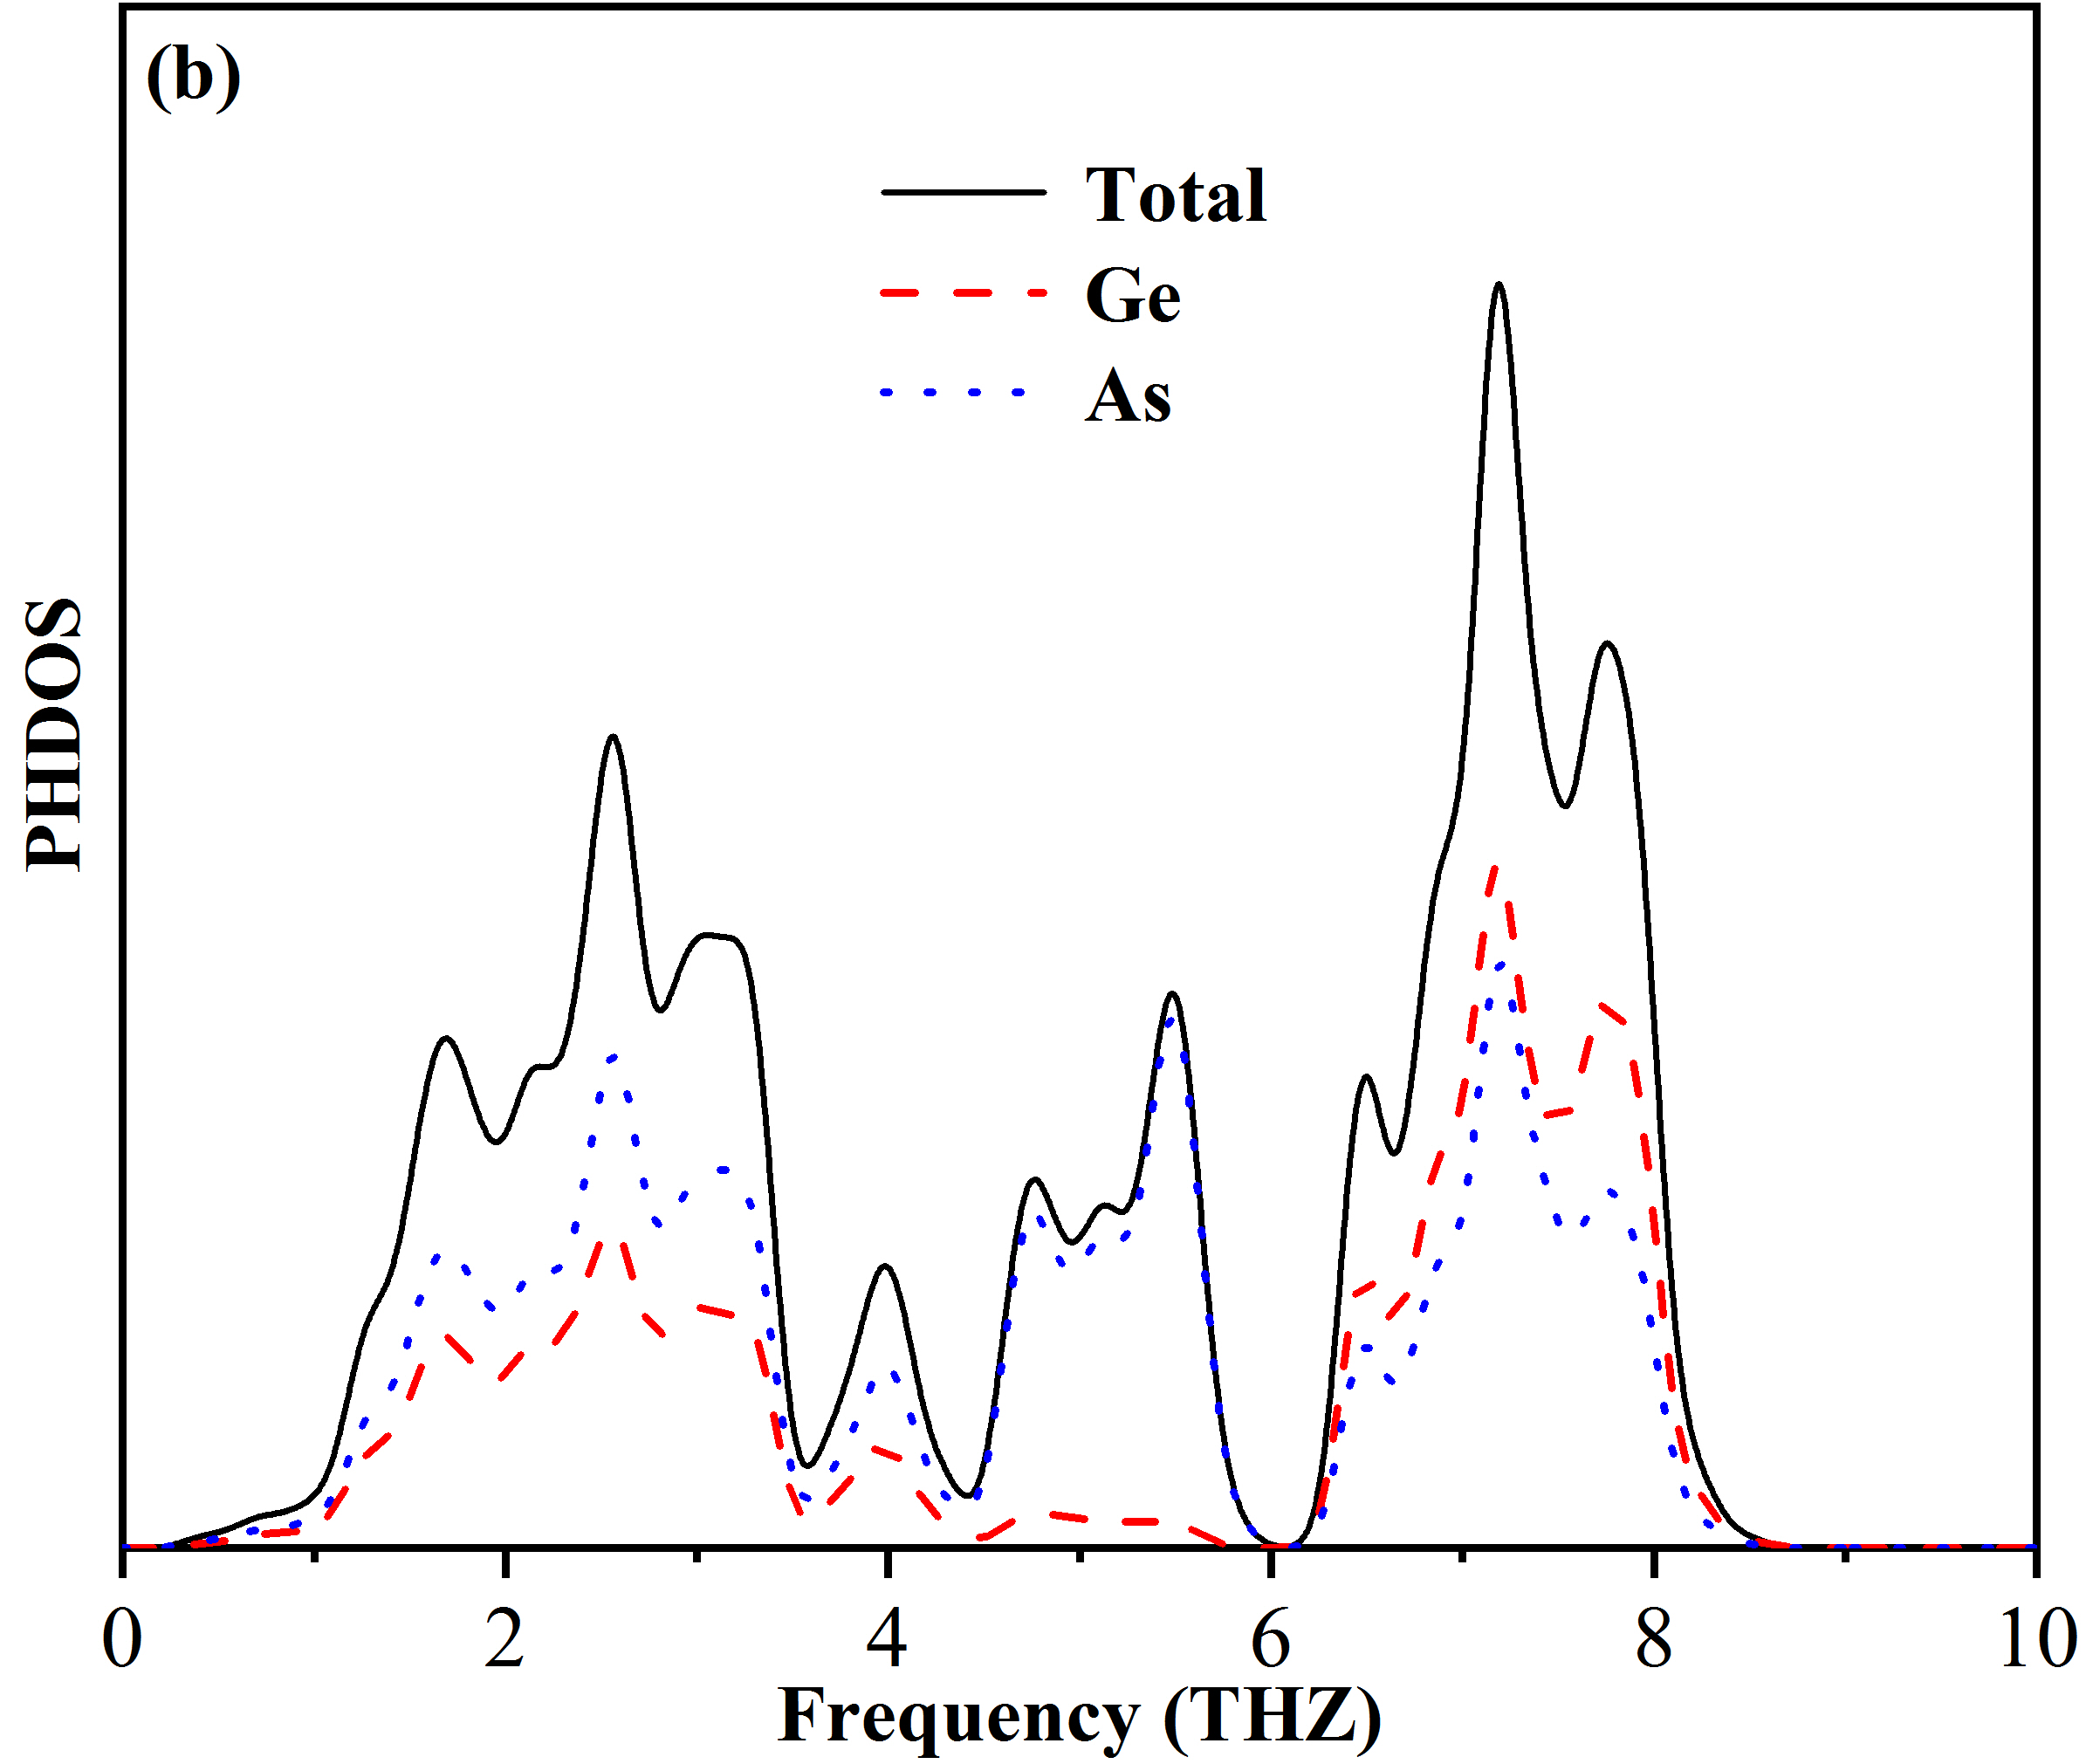
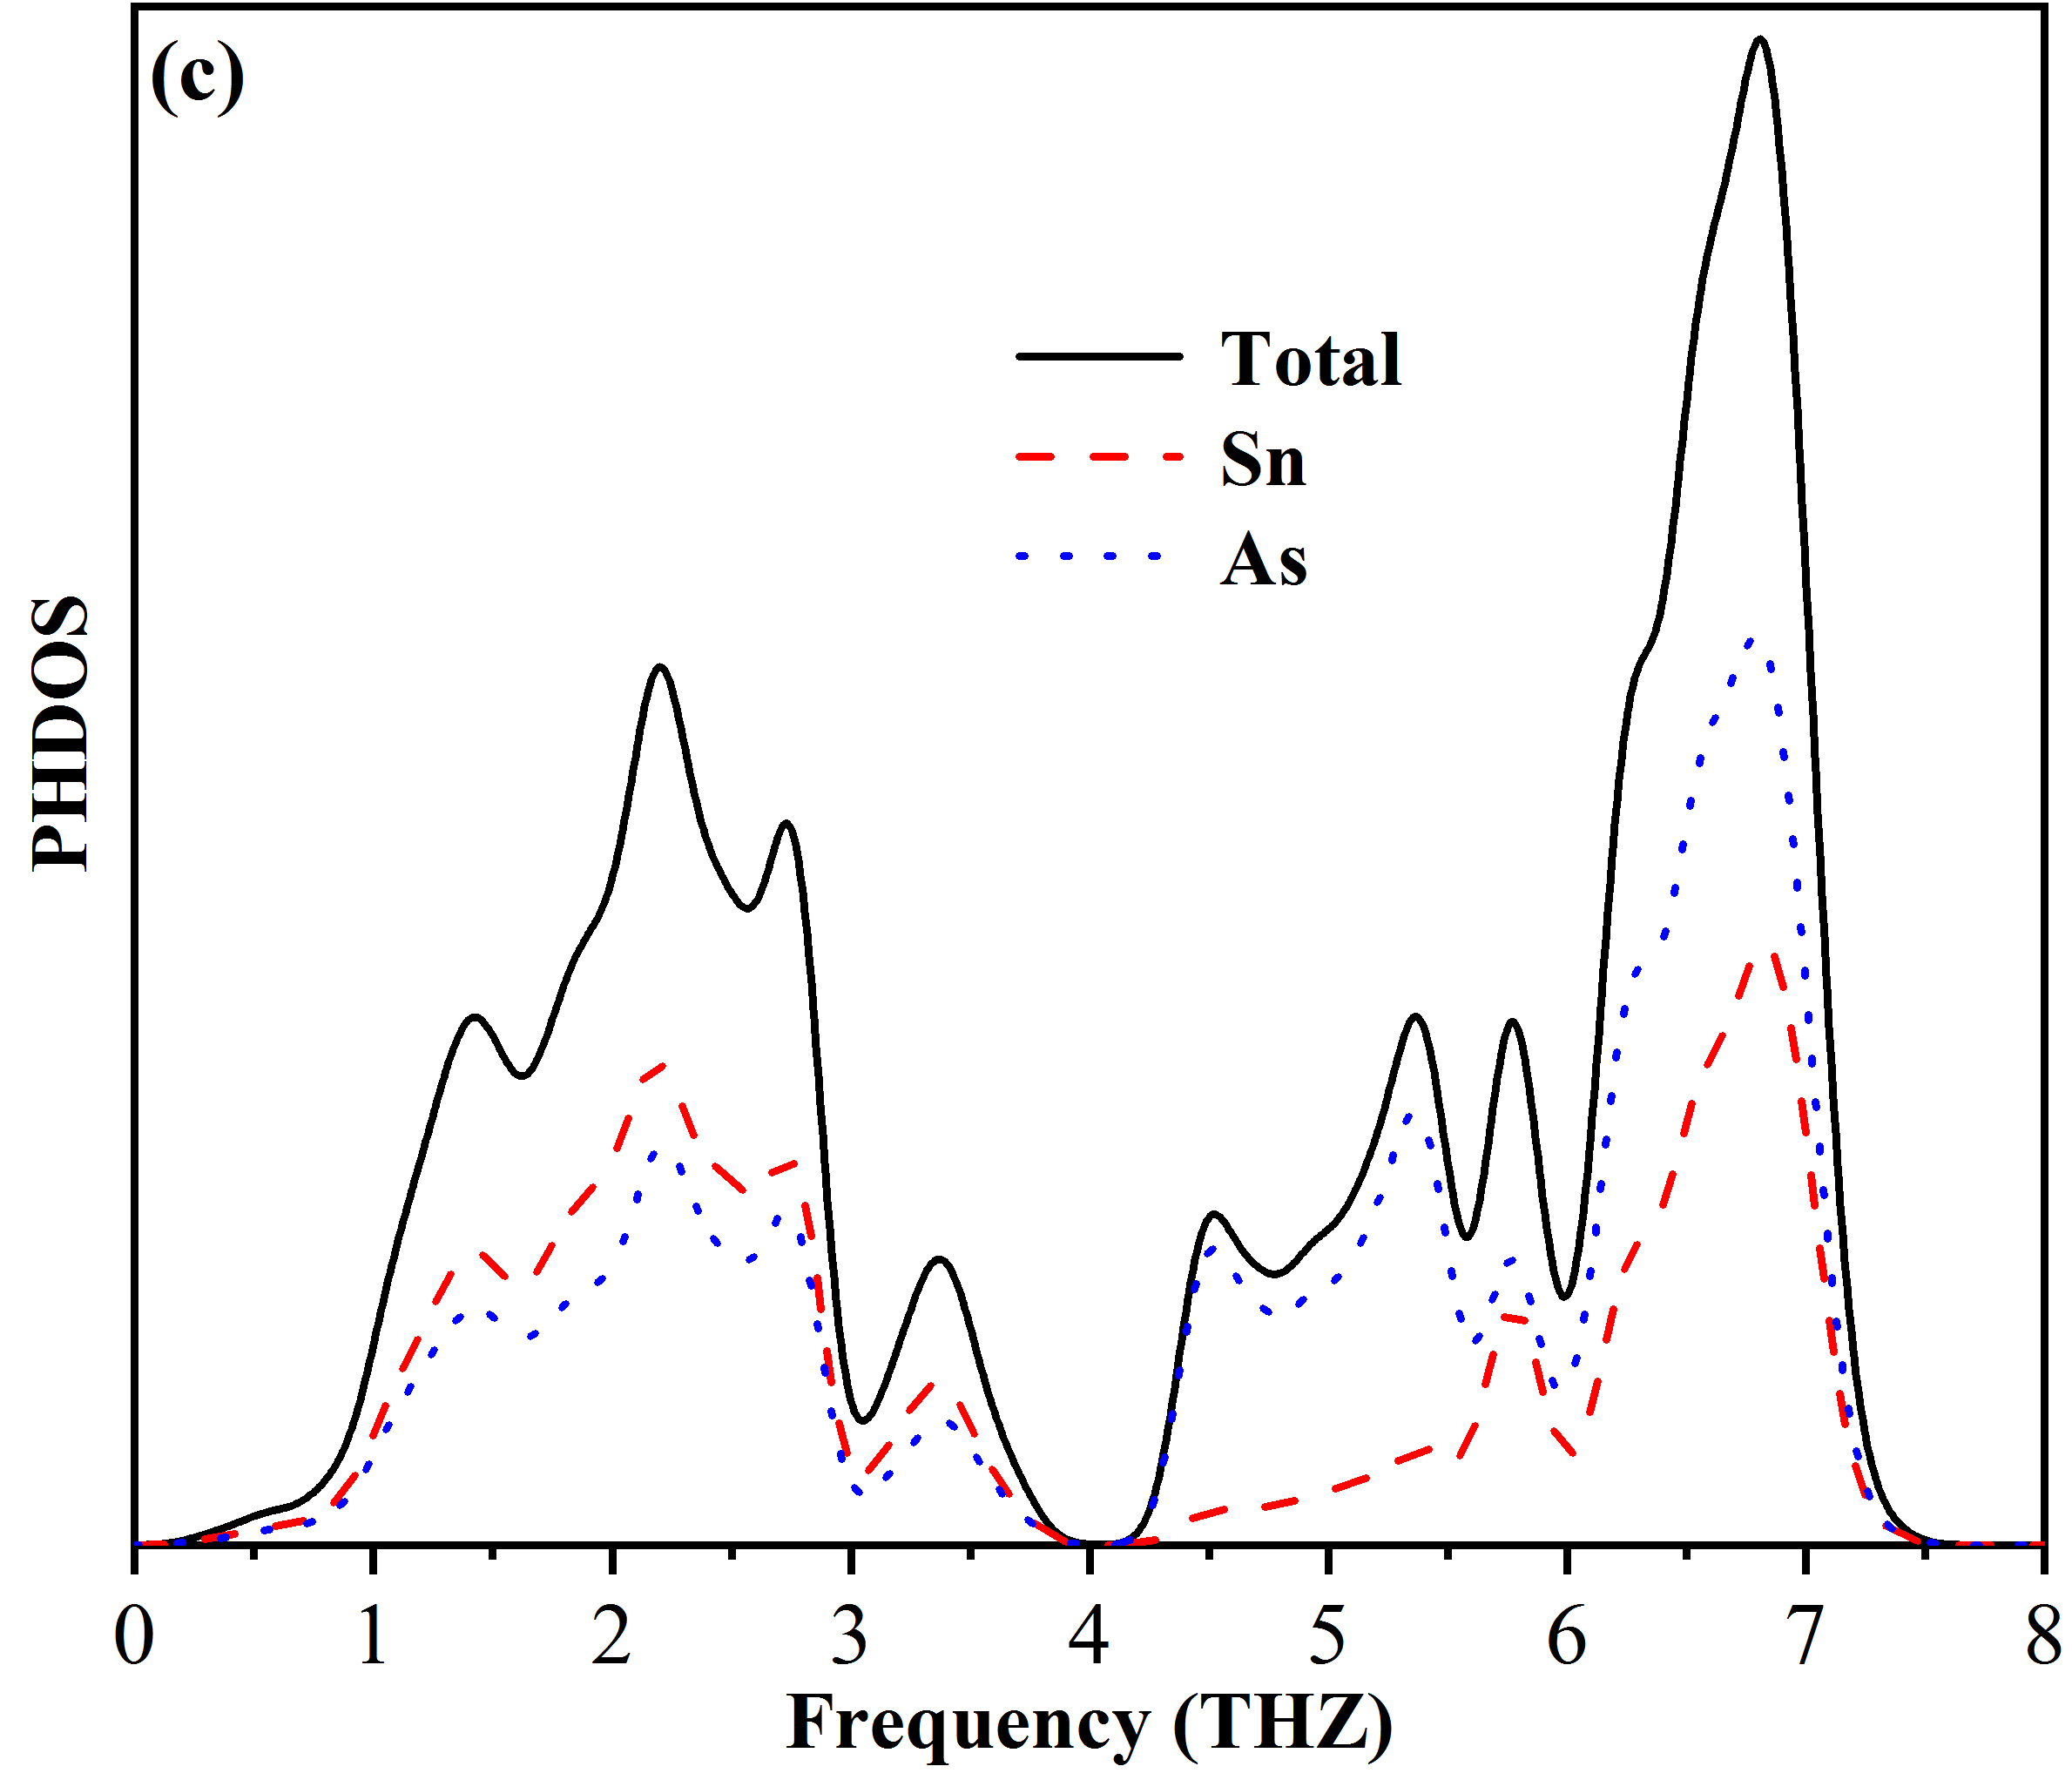
The phonon density of states (PHDOS) of t-X3As4 is calculated by CASTEP and shown in figure 3, respectively. For t-Si3As4, we can observe that in the range of eV, the total PHDOS is mainly from As, which indicates that the vibration of As atoms is dominant in this frequency band. In the range of eV, the total PHDOS is mainly from Si, which indicates that the vibration of Si atoms is dominant in this frequency band. For t-Ge3As4, in the range of eV, the total PHDOS is mainly from As, which indicates that the vibration of As is dominant in this frequency band. In the range of eV, the total PHDOS is from Ge and As, which shows that Ge and As have a similar vibrational probability. For t-Sn3As4, in the range of eV, the total PHDOS is from Sn and As, which shows that Sn and As have a similar vibrational probability. And in the range of eV, the total PHDOS is mainly from As and partial from Sn, which indicates that the vibration of As is dominant in this frequency band.
3.4 Band structures and densities of states
The electronic properties of t-X3As4 are analyzed at 0 GPa. The DOS is calculated to have a further insight into the bonding characteristics of t-X3As4.
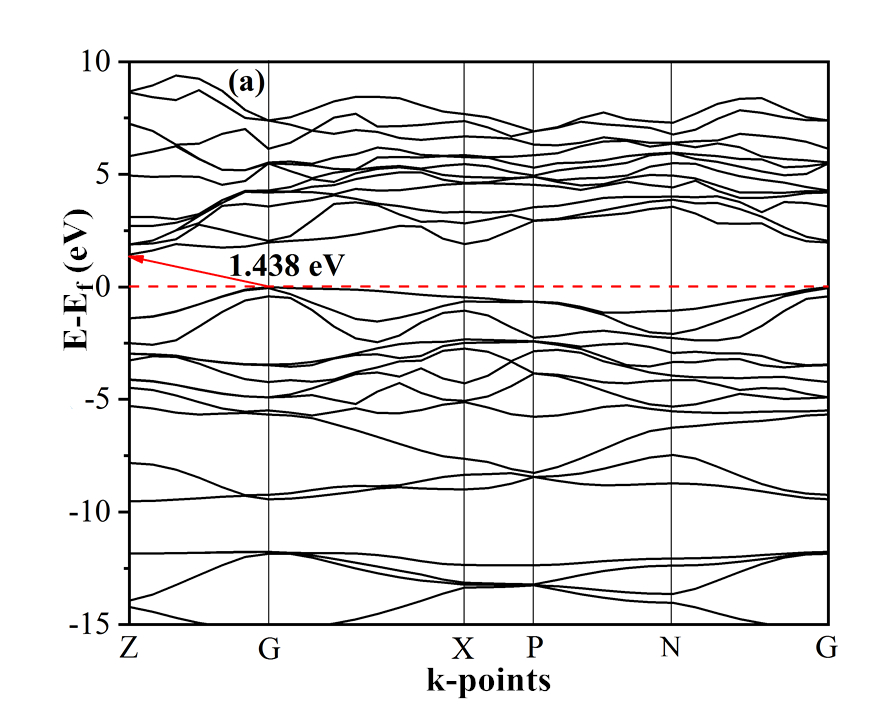
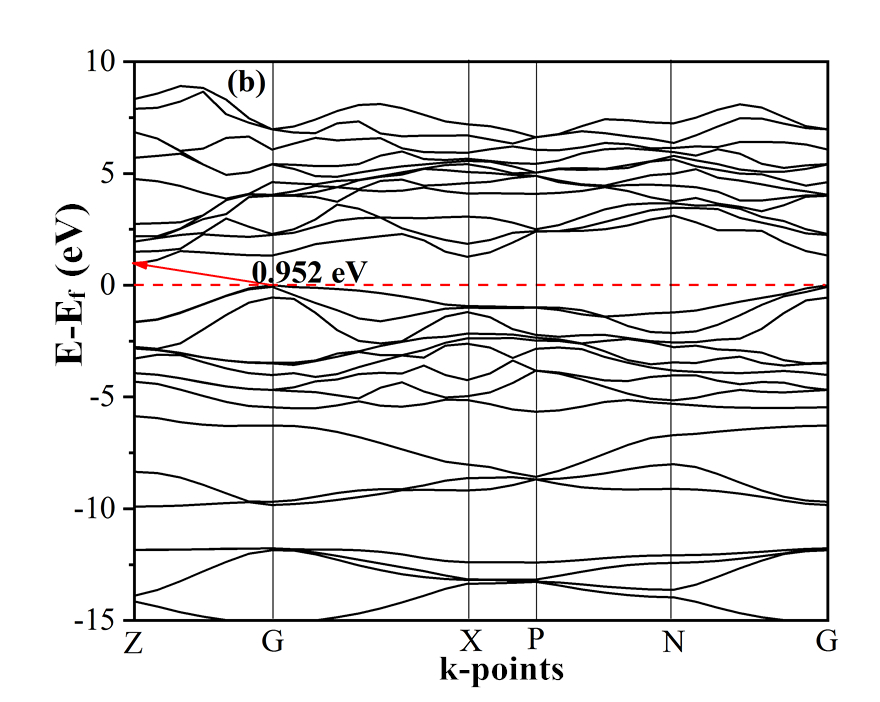
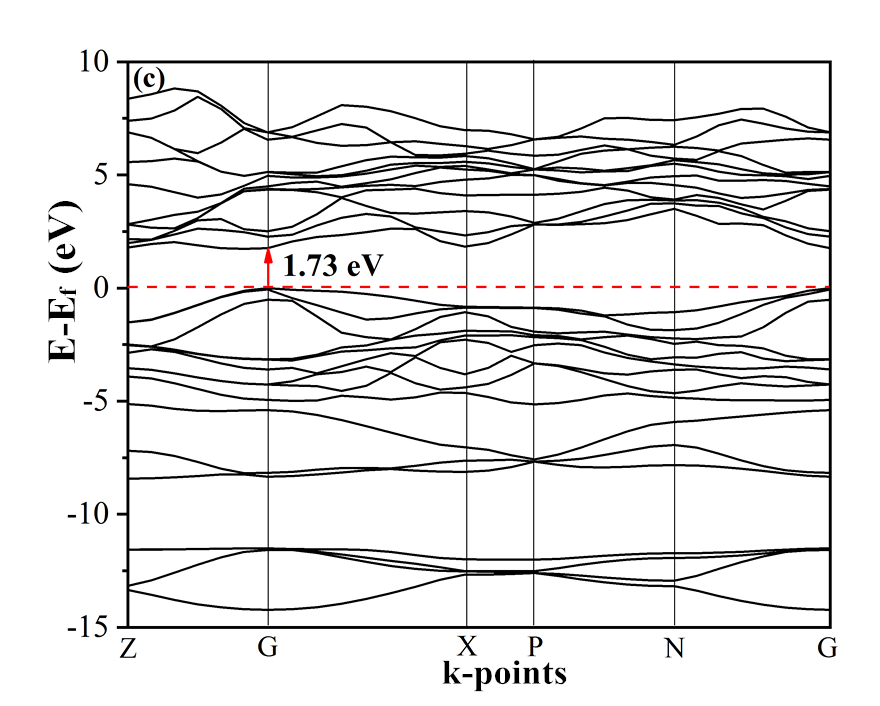
As indicated in figure 4, for t-Si3As4, the valence maximum is at high symmetric -point and the conduction band minimum is at Z-point, which indicates that t-Si3As4 is an indirect band semiconductor with a band gap of 1.438 eV. For t-Ge3As4, the valence maximum is at high symmetric -point and the conduction band minimum is at Z-point, which indicates that t-Ge3As4 is an indirect band semiconductor with a band gap of 0.952 eV. For t-Sn3As4, the highest point of the valence band and the lowest point of the conduction band are at the point. It shows that t-Sn3As4 is a direct band semiconductor with a band gap of 1.73 eV.
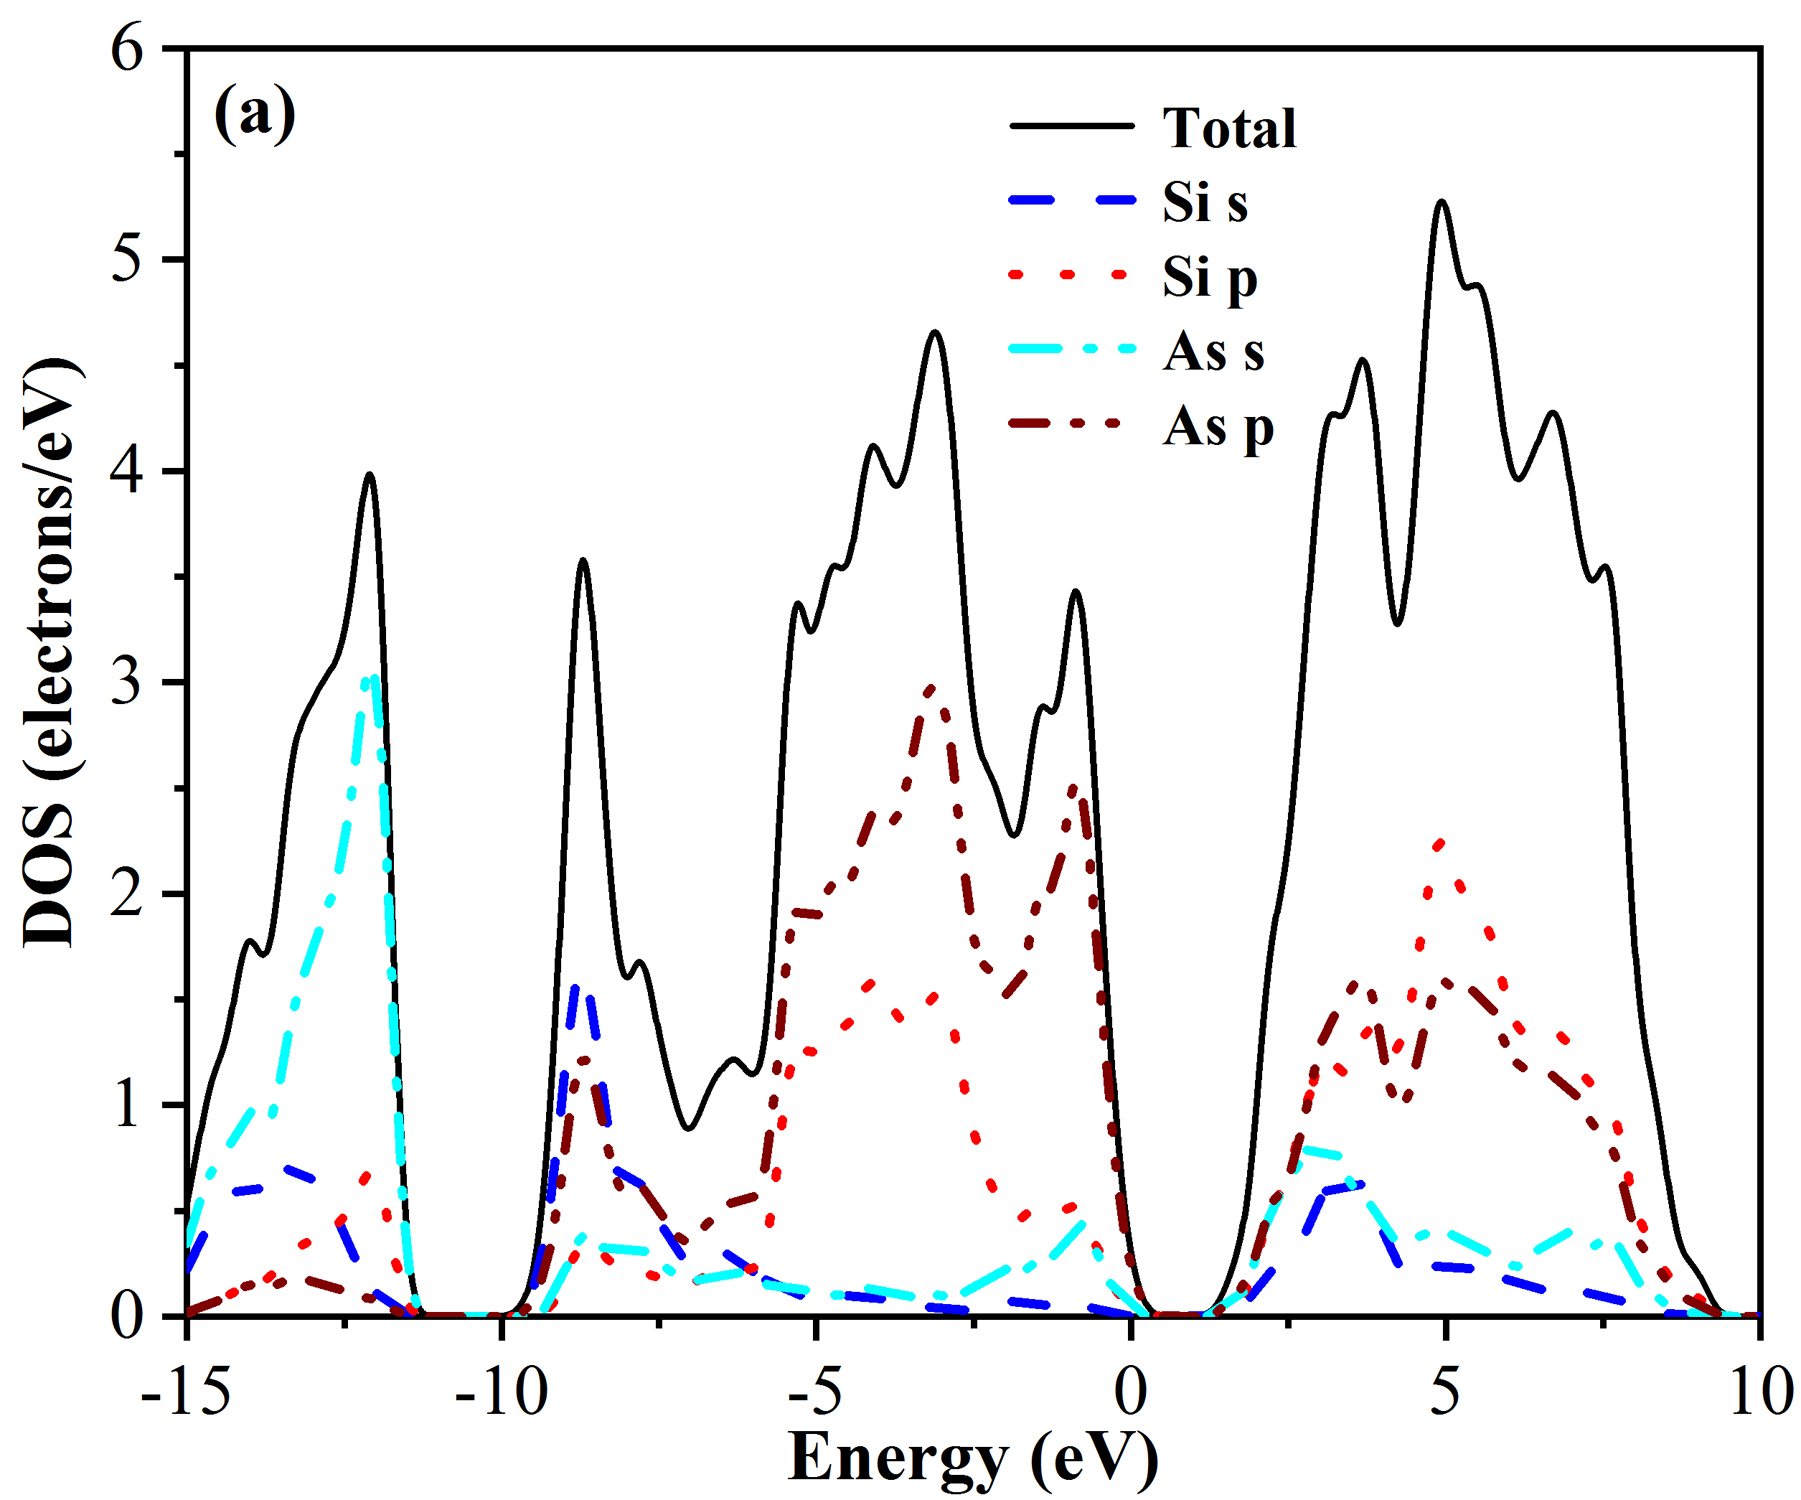
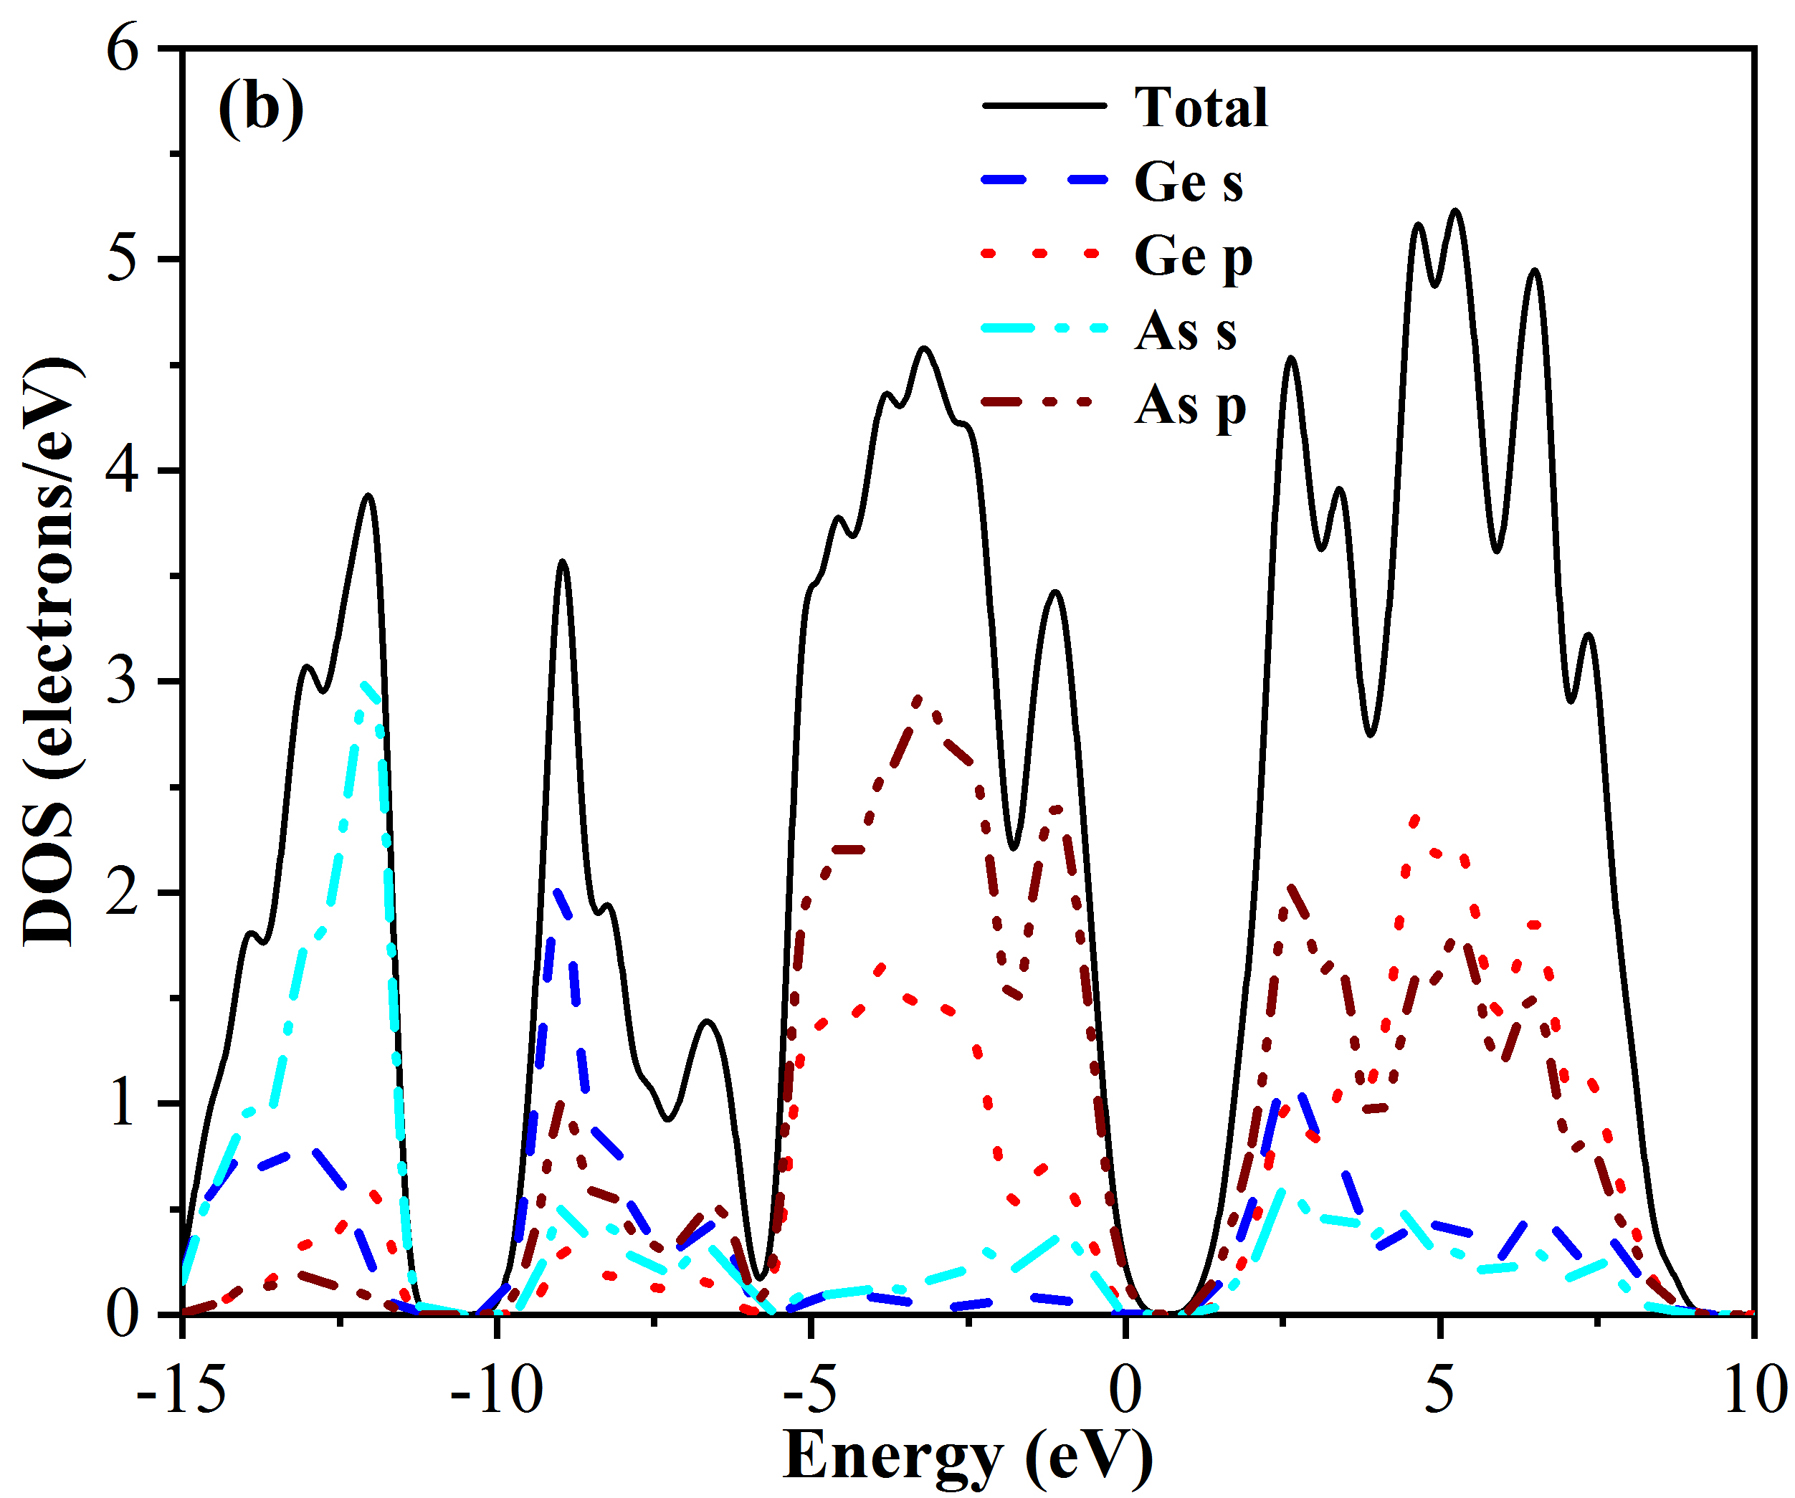
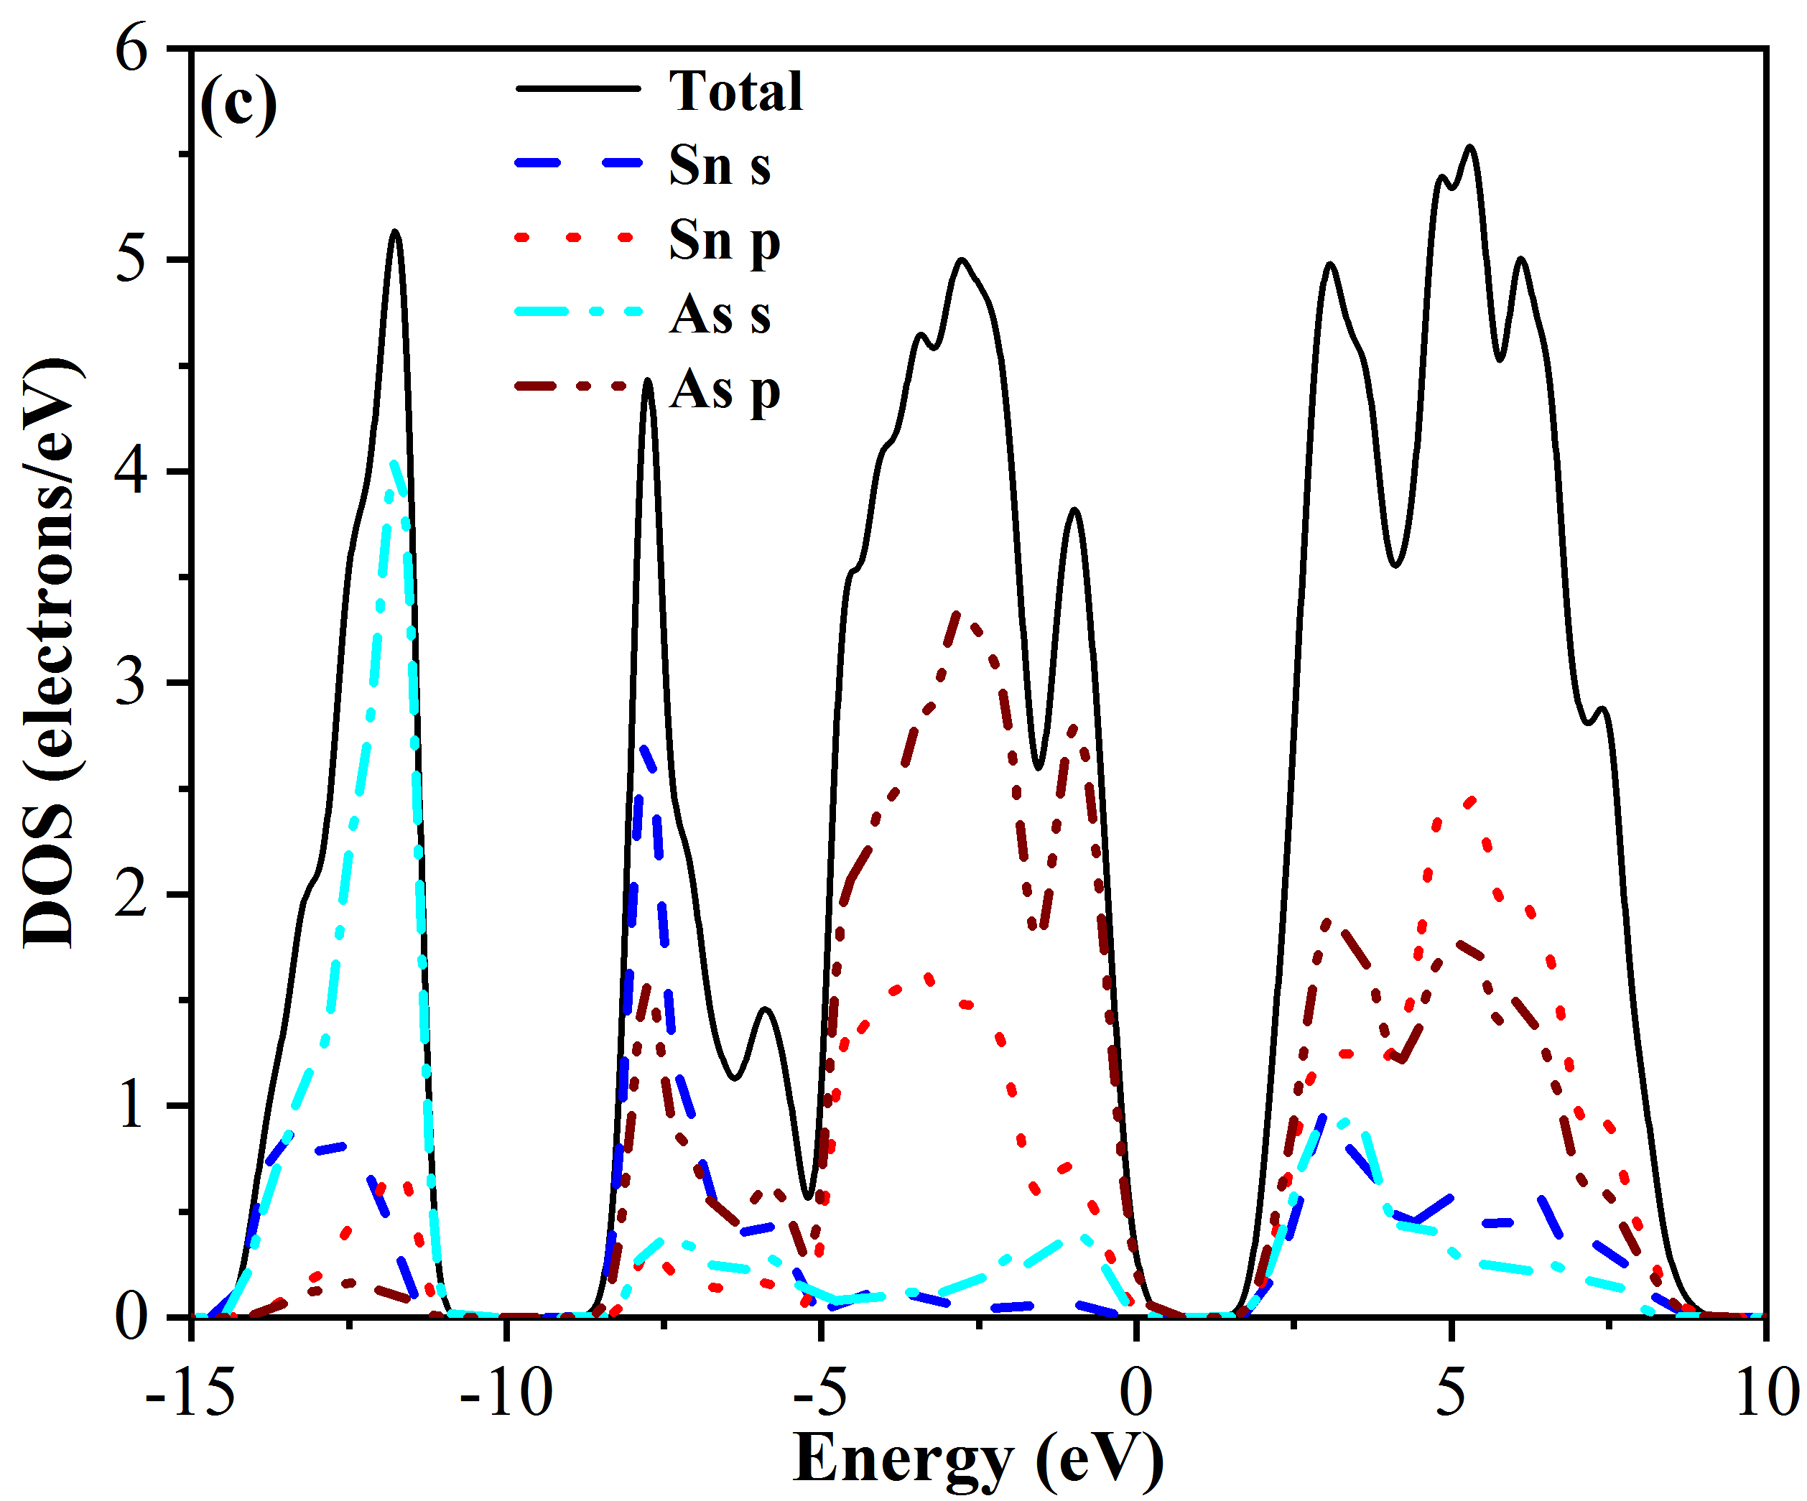
The density of states of t-X3As4 are presented in figure 5. For t-Si3As4, the main bonding peaks are in the range of eV. The total DOS in the valence band mainly comes from As and As , with partially from Si and Si . Si and As contribute most to the total DOS in the conduction band, with partially from As and Si . For t-Ge3As4, the total DOS in the valence band mainly comes from As , As and Ge , with partially from Ge . In the conduction band, the total DOS mainly come from Ge and As with partially from Ge and As . For t-Sn3As4, the total DOS in the valence band mainly comes from As , As and Sn , with partially from Sn . In the conduction band, the total DOS mainly come from Sn and As with partially from Sn and As .
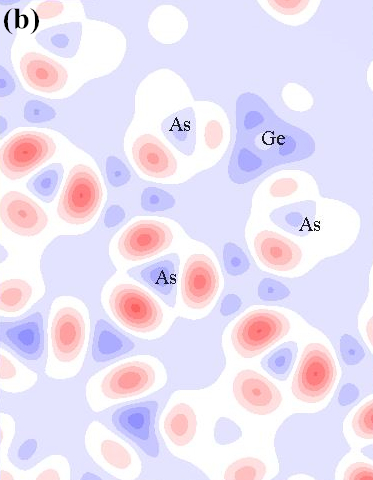
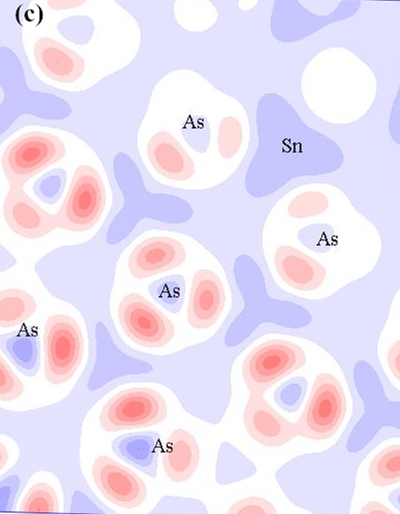
3.5 Electron density difference and Mulliken charge population
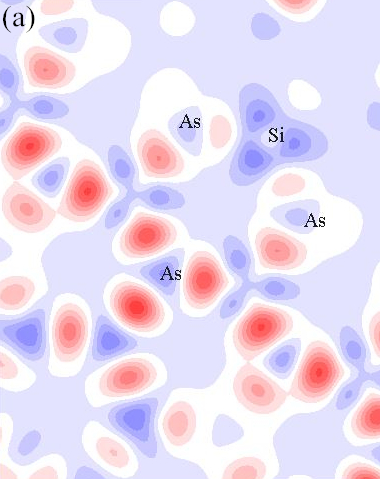
In order to investigate the chemical bonding, the electron density differences are calculated and the results are shown in figure 6. The electron density differences are the discrepancy between the electron densities of the total system and the unperturbed electron densities of X (Si, Ge and Sn) and As [16]. The contour plots show the electron density differences (between and ) due to the formation of chemical bonds in the I-42M lattice, which are relative to the electron density in an isolated atom. It is helpful to analyze how chemical bonds are formed. The electron density differences are useful for identifying the types of chemical bonds. From figure 6, we can see that As atoms get electrons, X (Si, Ge and Sn) lose electrons. The electrovalent bond is formed between X (Si, Ge and Sn) atoms and As atoms. The combination of X and As atoms is dependent on the ionic effect of Coulomb attraction. In order to further investigate the bonding behaviour of the three materials, we also obtain the Mulliken charge population. The Mulliken population results are given in table 5. Table 5 gives a quantitative determination of the number of loss electrons per X (Si, Ge and Sn) atom, the number of acquired electrons per X (Si, Ge and Sn) and the charger of per X atom and per As atom after the formation of Si3As4. From table 5, it is shown that the bonding behaviour of t-X3As4 is a combination of covalent and ionic nature.
| Structure | Species | Total | Charge (e) | ||
|---|---|---|---|---|---|
| Si3As4 | Si(1) | 1.42 | 2.42 | 3.83 | 0.17 |
| Si(2) | 1.43 | 2.39 | 3.82 | 0.18 | |
| Si(3) | 1.43 | 2.39 | 3.82 | 0.18 | |
| As(1) | 1.63 | 3.50 | 5.13 | 0.13 | |
| As(2) | 1.63 | 3.50 | 5.13 | 0.13 | |
| As(3) | 1.63 | 3.50 | 5.13 | 0.13 | |
| As(4) | 1.63 | 3.50 | 5.13 | 0.13 | |
| Ge3As4 | Ge(1) | 1.56 | 2.39 | 3.95 | 0.05 |
| Ge(2) | 1.56 | 2.37 | 3.93 | 0.07 | |
| Ge(3) | 1.56 | 2.37 | 3.93 | 0.07 | |
| As(1) | 1.67 | 3.38 | 5.04 | 0.04 | |
| As(2) | 1.67 | 3.38 | 5.04 | 0.04 | |
| As(3) | 1.67 | 3.38 | 5.04 | 0.04 | |
| As(4) | 1.67 | 3.38 | 5.04 | 0.04 | |
| Sn3As4 | Sn(1) | 1.55 | 2.28 | 3.82 | 0.18 |
| Sn(2) | 1.53 | 2.26 | 3.79 | 0.21 | |
| Sn(3) | 1.53 | 2.26 | 3.79 | 0.21 | |
| As(1) | 1.60 | 3.55 | 5.15 | 0.15 | |
| As(2) | 1.60 | 3.55 | 5.15 | 0.15 | |
| As(3) | 1.60 | 3.55 | 5.15 | 0.15 | |
| As(4) | 1.60 | 3.55 | 5.15 | 0.15 |
3.6 Optical properties
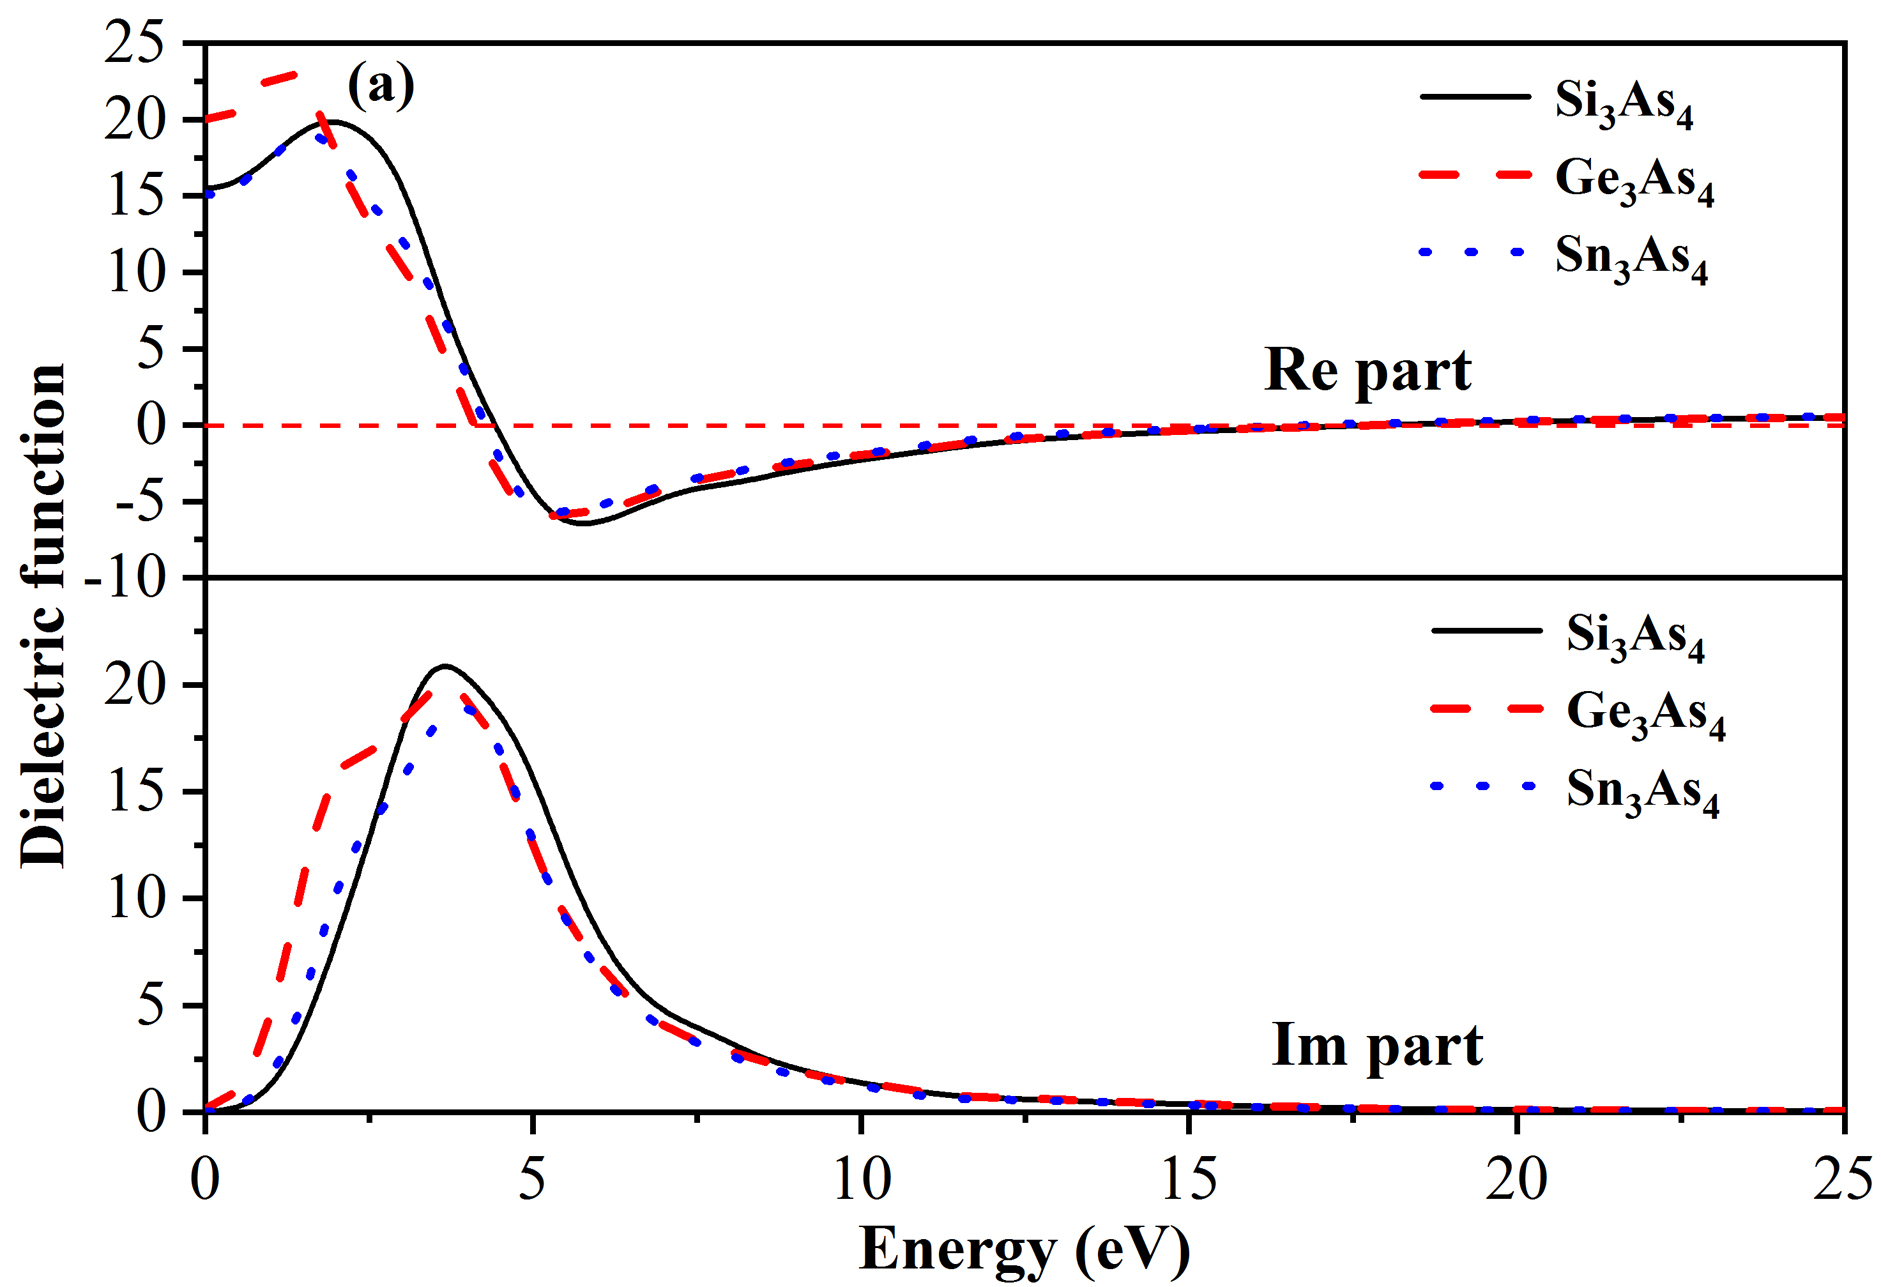
Dielectric function is the most common characteristic of materials. It can characterize the response of materials to incident electromagnetic waves [17]. Optical properties of materials can usually be evaluated on the basis of a complex dielectric function, which depends on the frequency. Complex dielectric function is shown as follows [18]:
| (23) |
where is the real part, is the imaginary part. The real and imaginary parts of the dielectric function are given in figure 7 (a). The calculated static dielectric constants, , are 15.5, 20.0 and 15.1 eV for t-Si3As4, t-Ge3As4 and t-Sn3As4, respectively. For t-Si3As4, t-Ge3As4 and t-Sn3As4, the real parts of dielectric function enhance with an increasing photon energy and get to the highest values at about 1.94, 1.30 and 1.48 eV, respectively. The imaginary part curves increase with an increase of photon energy and get to the highest values at about 3.69, 3.54 and 3.97 eV.
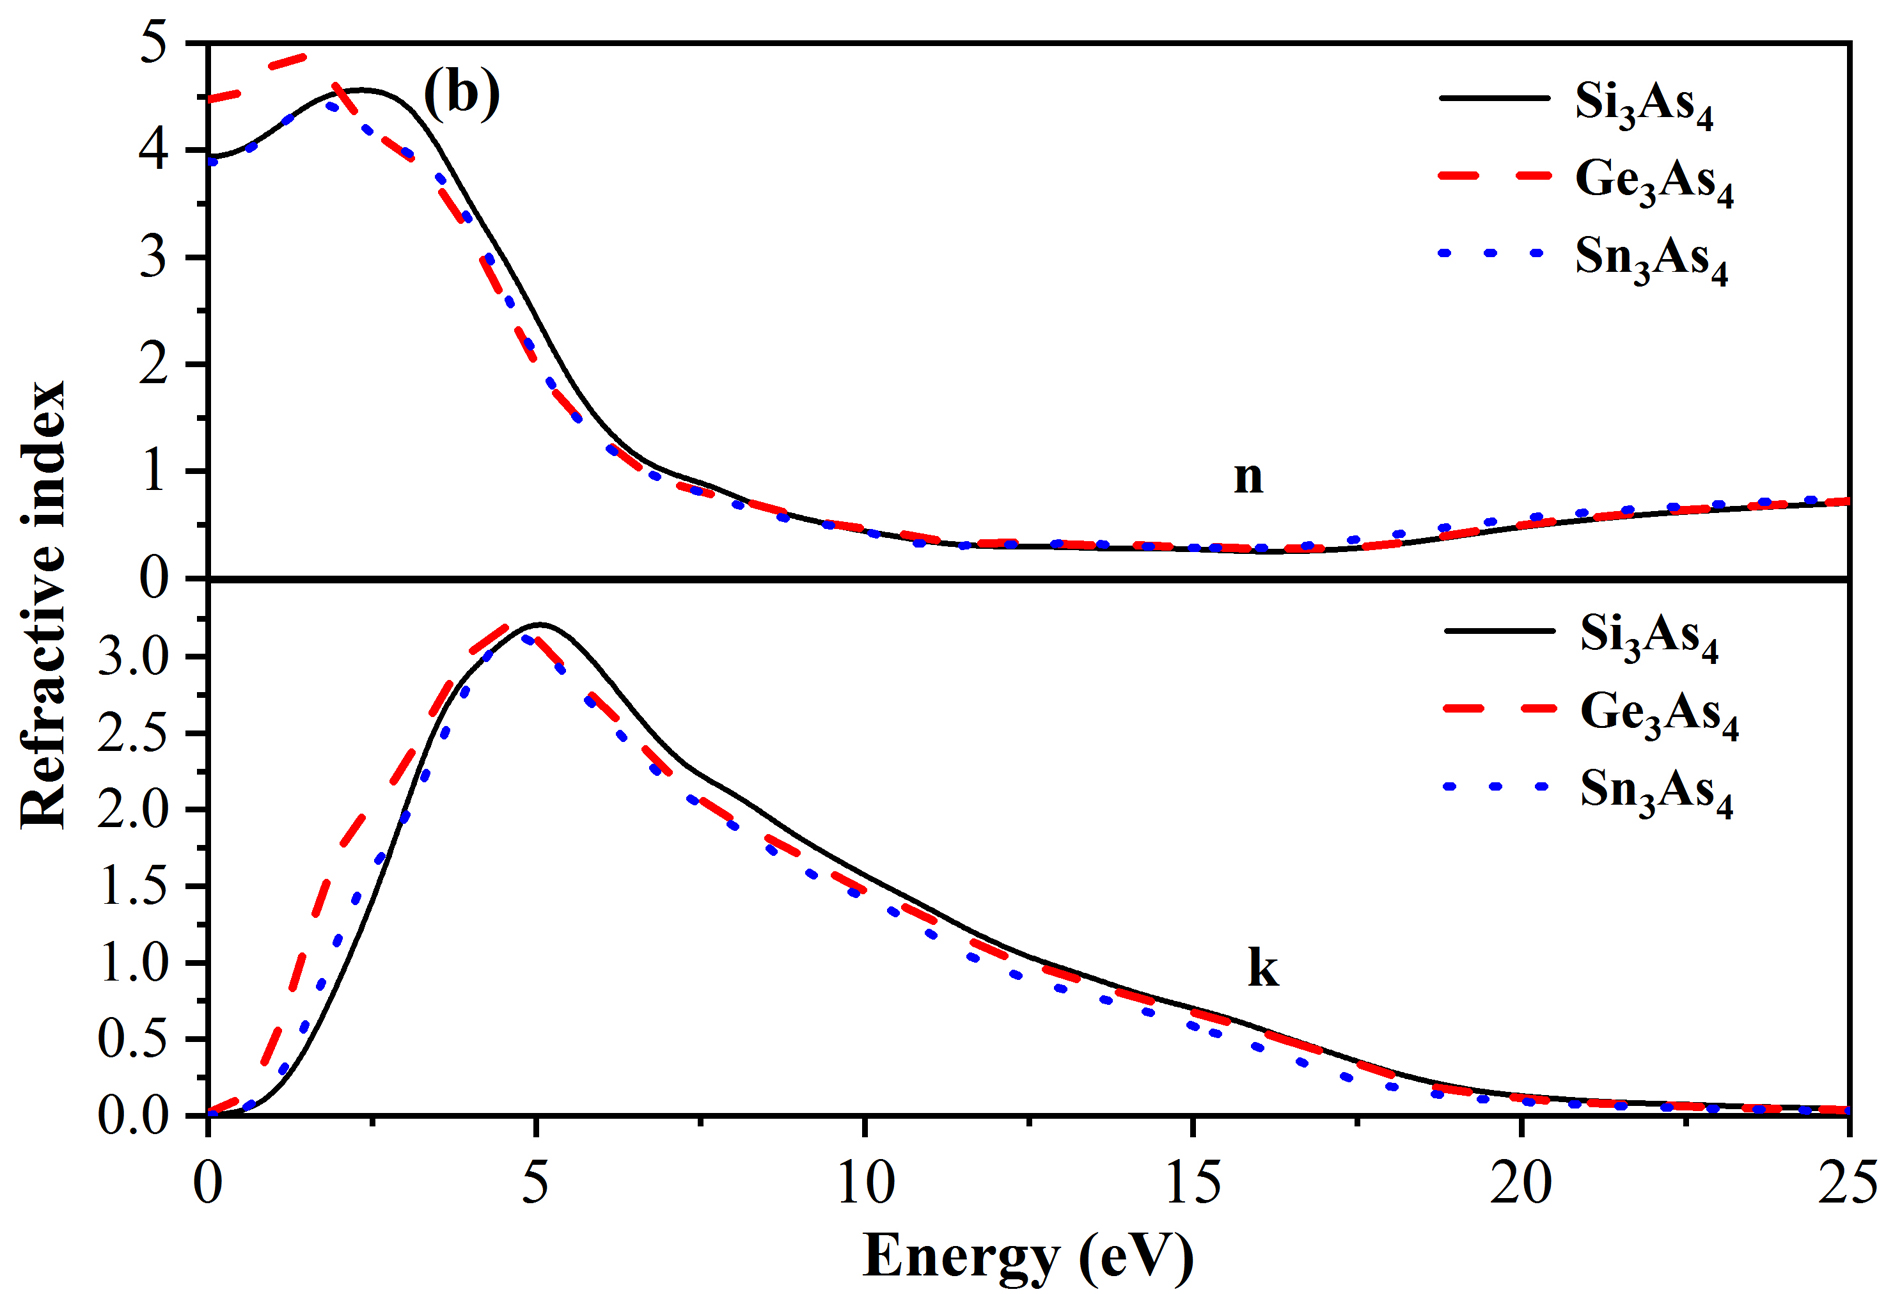
Refractive index and extinction coefficient of t-X3As4 can be obtained from and :
| (24) |
| (25) |
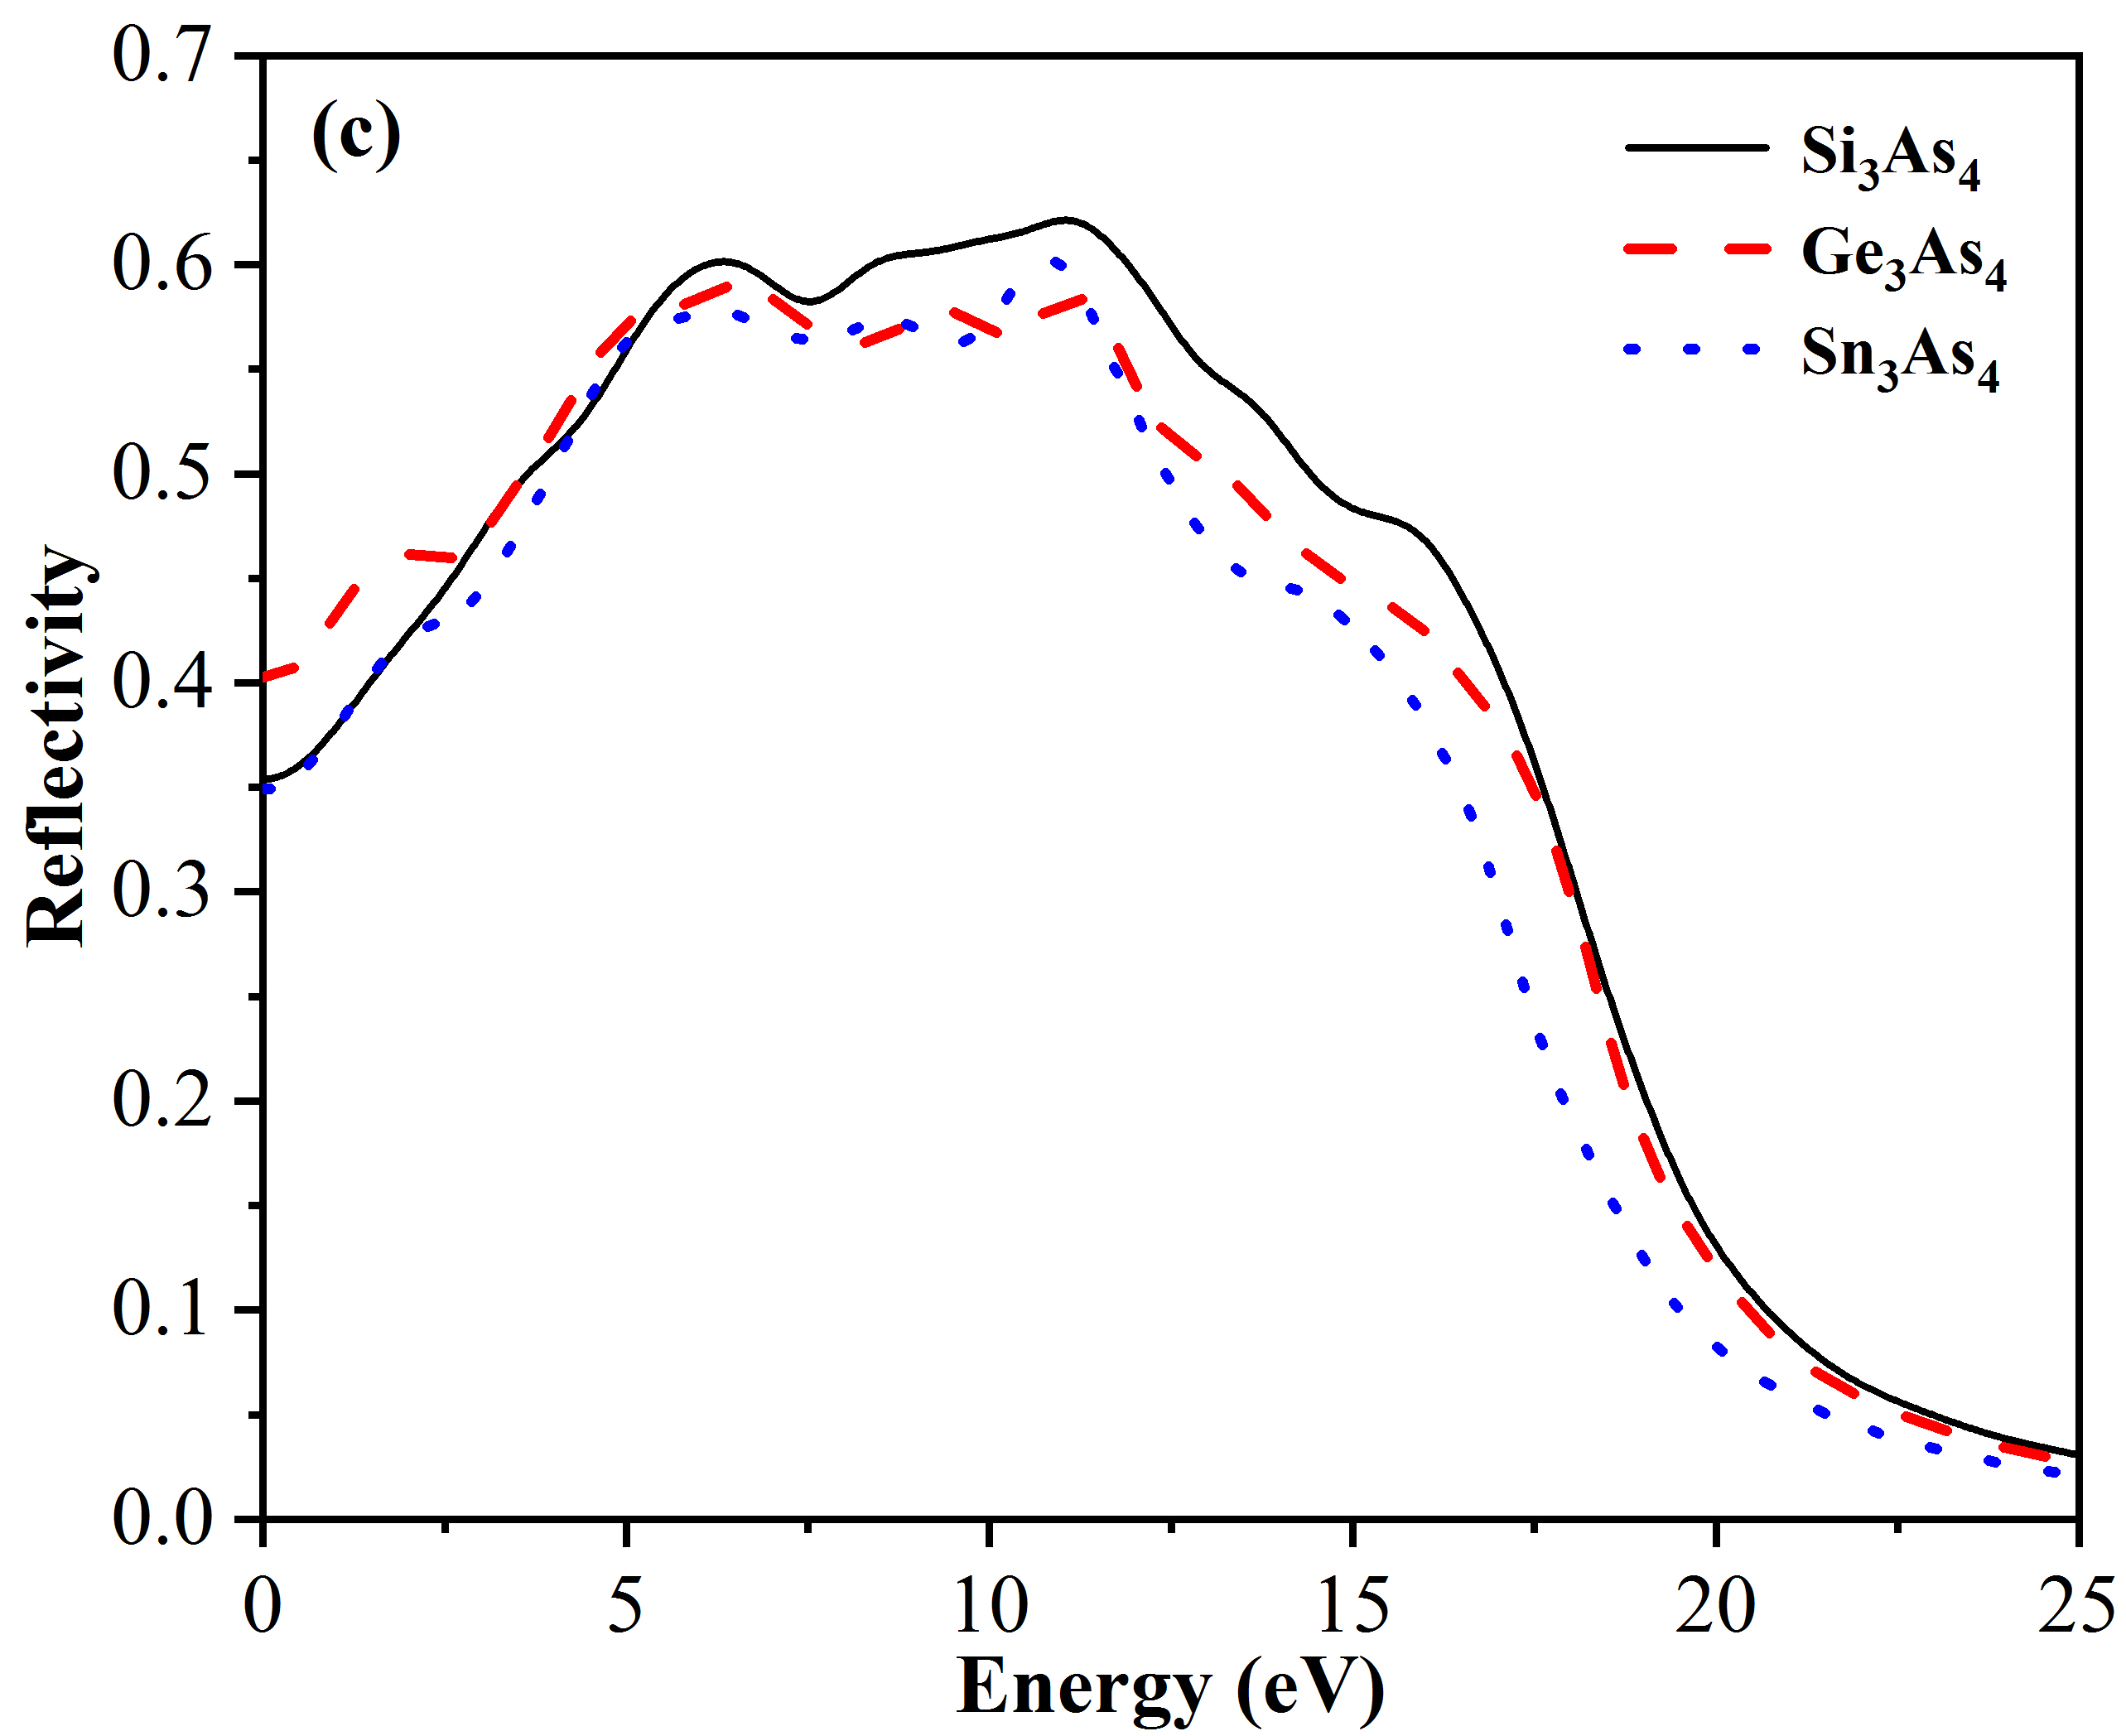
The static refractive indices are found to be 3.94, 4.48 and 3.89 eV for t-Si3As4, t-Ge3As4 and t-Sn3As4, respectively. The values of increase with an increasing photon energy in the visible light region, and in the ultraviolet band, reach the peaks at about 2.24, 1.40 and 1.67 eV for t-Si3As4, t-Ge3As4 and t-Sn3As4, respectively. In figure 7 (c), the reflective coefficients are displayed. The main peaks lie at 11.1, 6.55 and 10.8 eV, respectively.
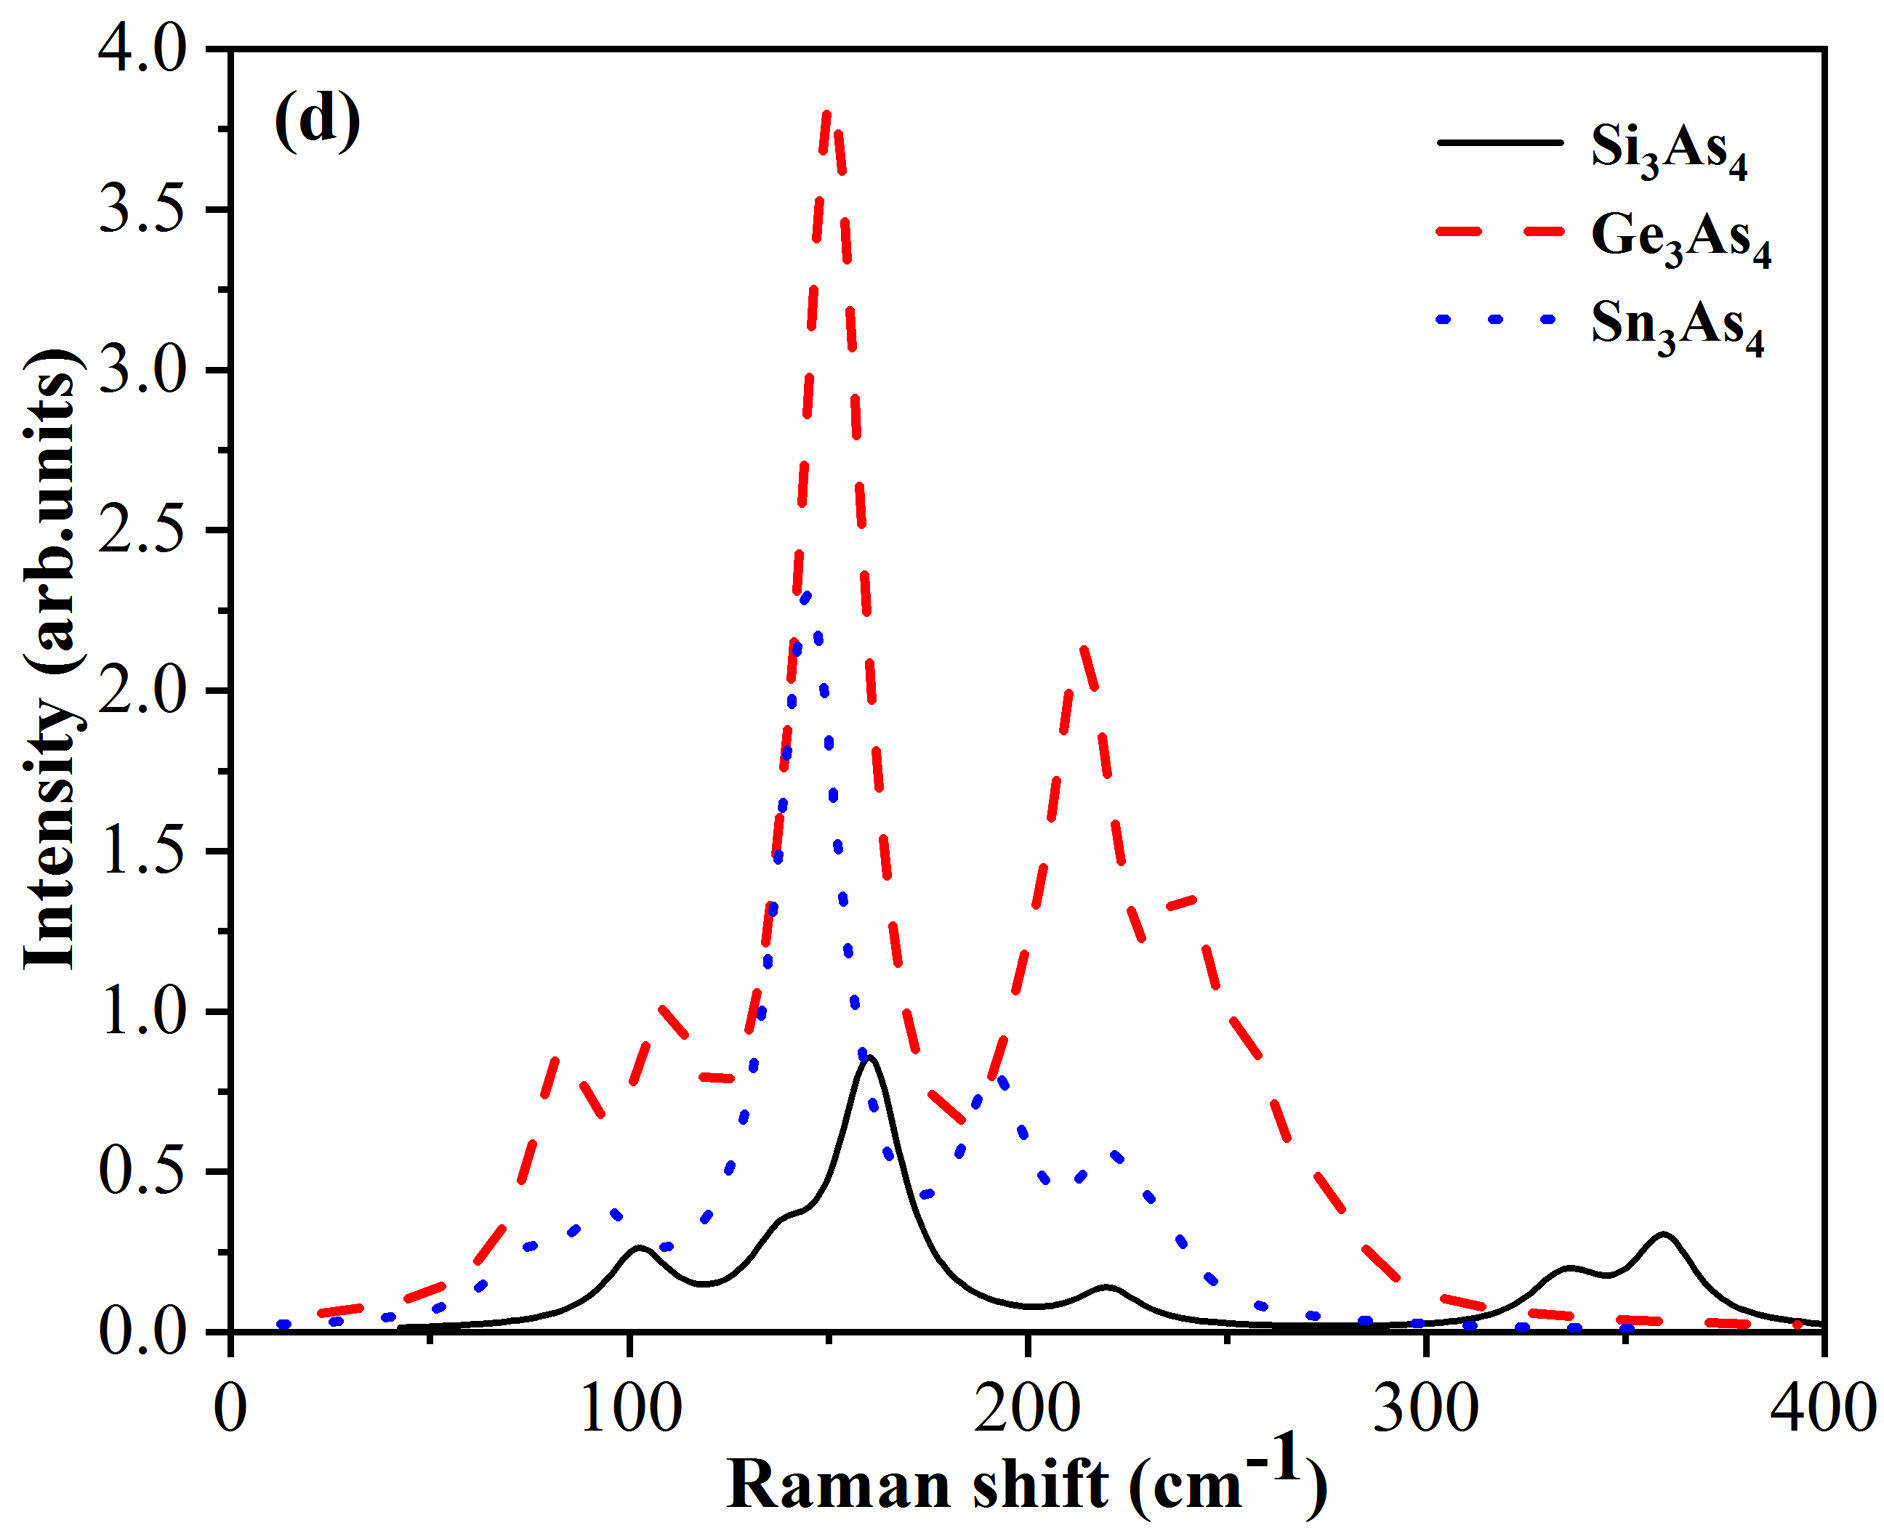
Vibrational Raman spectroscopy is one of the widely used optical techniques in materials science. It is a standard method for quality control of a production line. It is very effective in determining the occurrence of new phases or structural changes at extreme conditions. Moreover, it can be used in the absence of a long-range structural order as for liquid or amorphous materials. Raman spectroscopy can link Raman lines to specific microstructures. In order to further verify the crystal structure, the micro-Raman spectra of t-Si3As4, t-Ge3As4 and t-Sn3As4 were calculated by first-principles. Our Raman intensity results excited by the 514.5 nm incident light are presented in figure 7 (d). The Raman line shape is assumed to be Lorentzian, and the line-width is fixed at 10 cm-1 FWHM. The peaks mainly locate at 103, 161, 220, 336, and 361 cm-1 for t-Si3As4, 83.8, 109, 151, 214 and 239 cm-1 for t-Ge3As4, 92.8, 145, 191 and 219 cm-1 for t-Sn3As4.
3.7 Thermodynamic properties
For t-X3As4, we have studied the thermodynamic properties based on the phonon density of states at 0–1000 K temperature. According to CASTEP, the heat capacity is contributed by the lattice, is
| (26) |
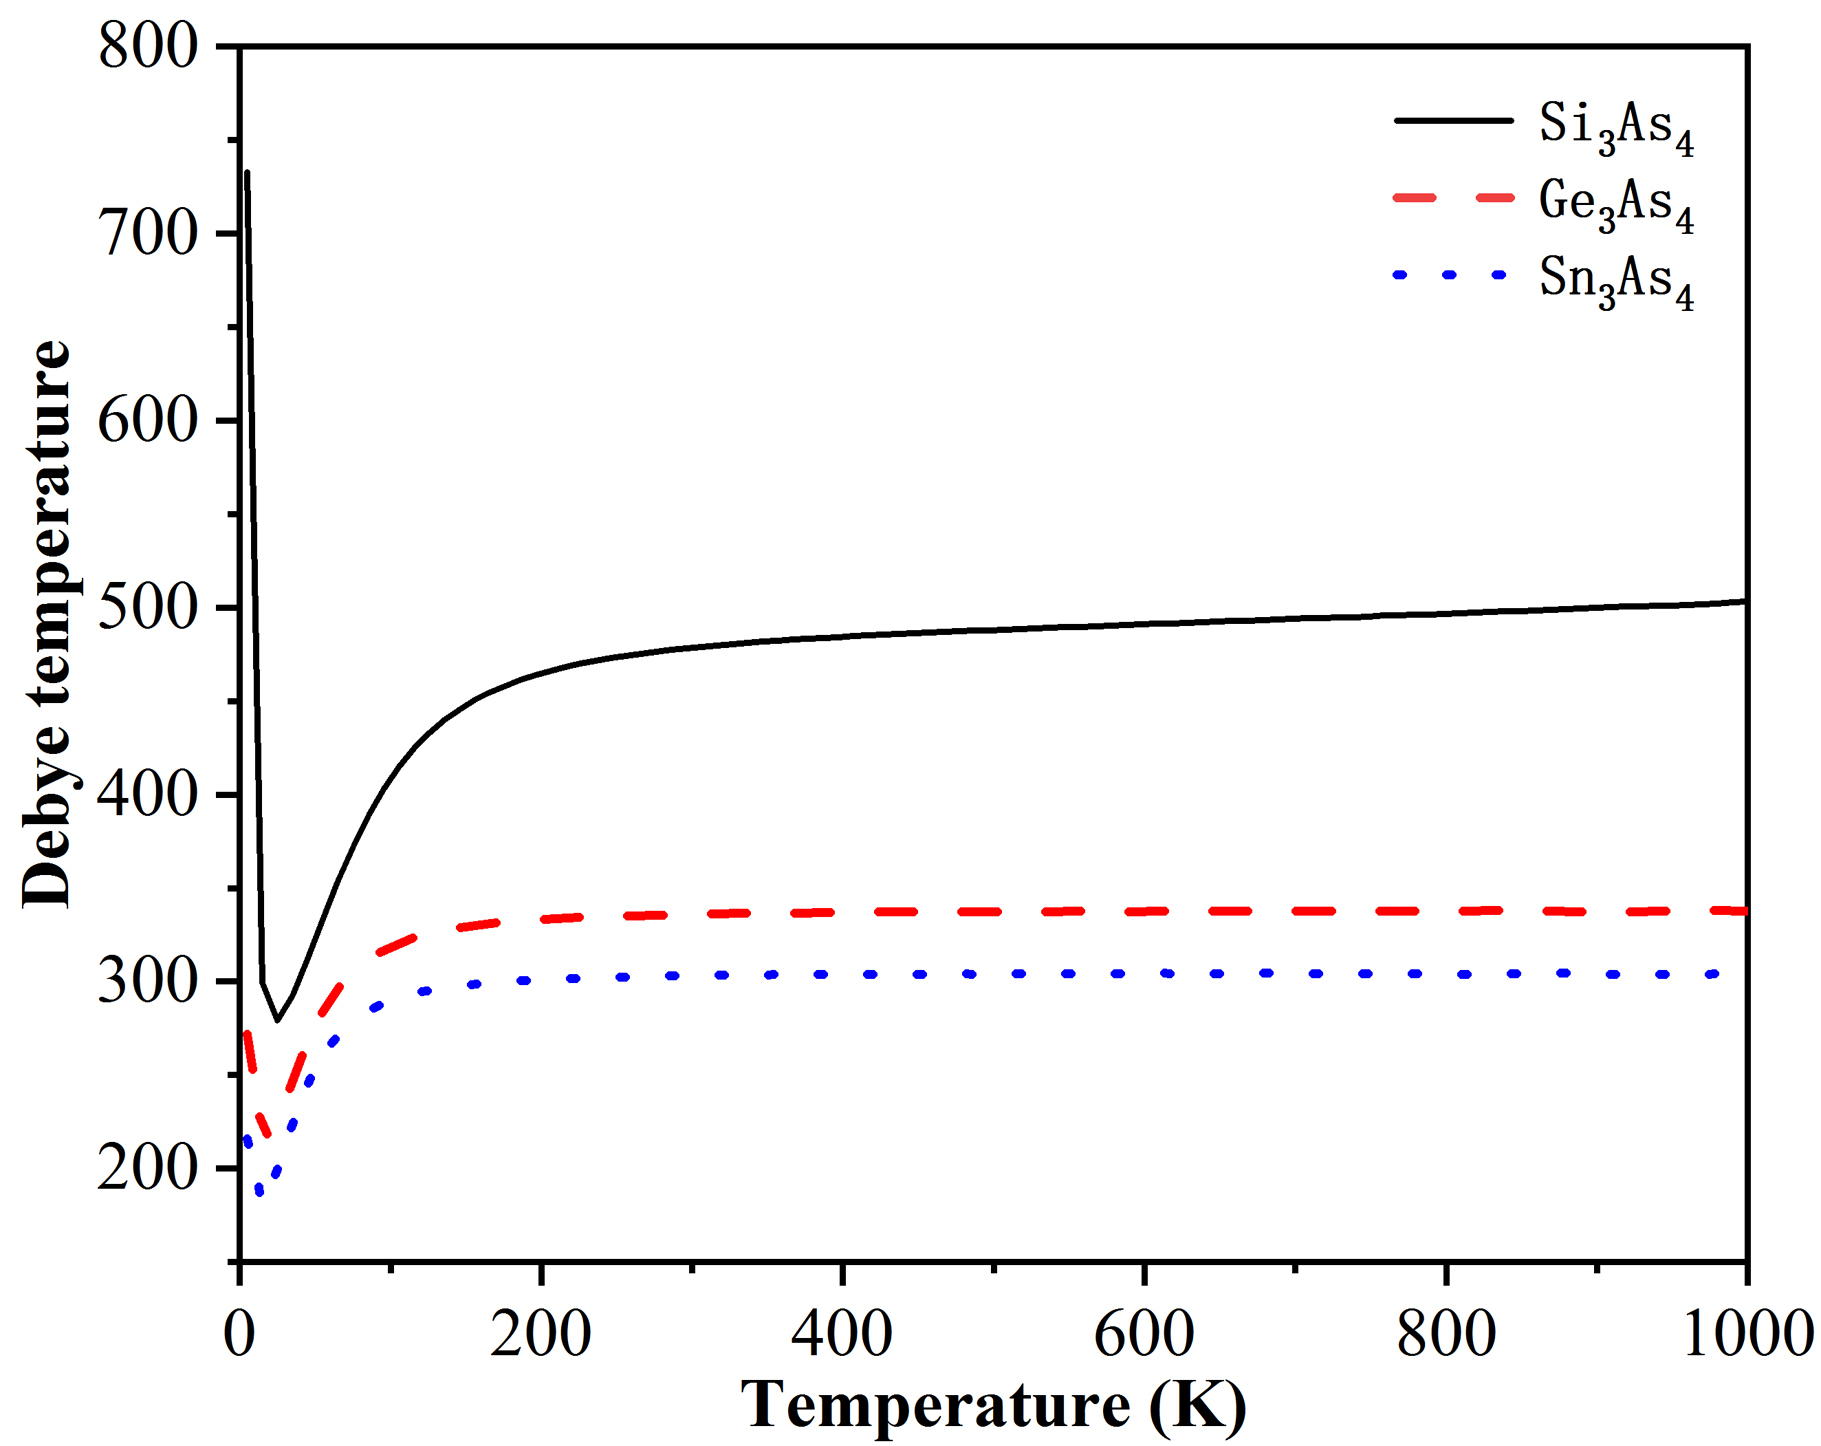
Debye temperature can be used to measure the properties of crystals, such as melting temperature, elastic constants and specific heat [19]. With the development of cryogenic technology, the deviation between Debye theory and practice increases. It is shown that the Debye temperature is different at different temperatures. According to the temperature dependence of Debye temperature at a constant volume, some general theoretical predictions can be made [20]. Heat capacity in Debye model is given by
| (27) |
where is the number of atoms per cell. Thus, the value of the Debye temperature, , at a certain temperature, , is obtained by calculating the actual heat capacity according to equation (24), then by inverting equation (25). The relations of the Debye temperature with temperature are given as figure 8. The Debye temperature of t-Si3As4 is larger than that of t-Ge3As4 and t-Sn3As4 between 0 and 1000 K. It is found that the Debye temperature decreases with an increase of temperature, and then increases after reaching a minimum, and that minimum values are 279, 216 and 181 K for t-Si3As4, t-Ge3As4 and t-Sn3As4. While above 300 K, of t-Si3As4, t-Ge3As4 and t-Sn3As4 show weak temperature dependence and approach the constant values. At 1000 K, values of are 503 K, 338 K and 304 K, respectively.
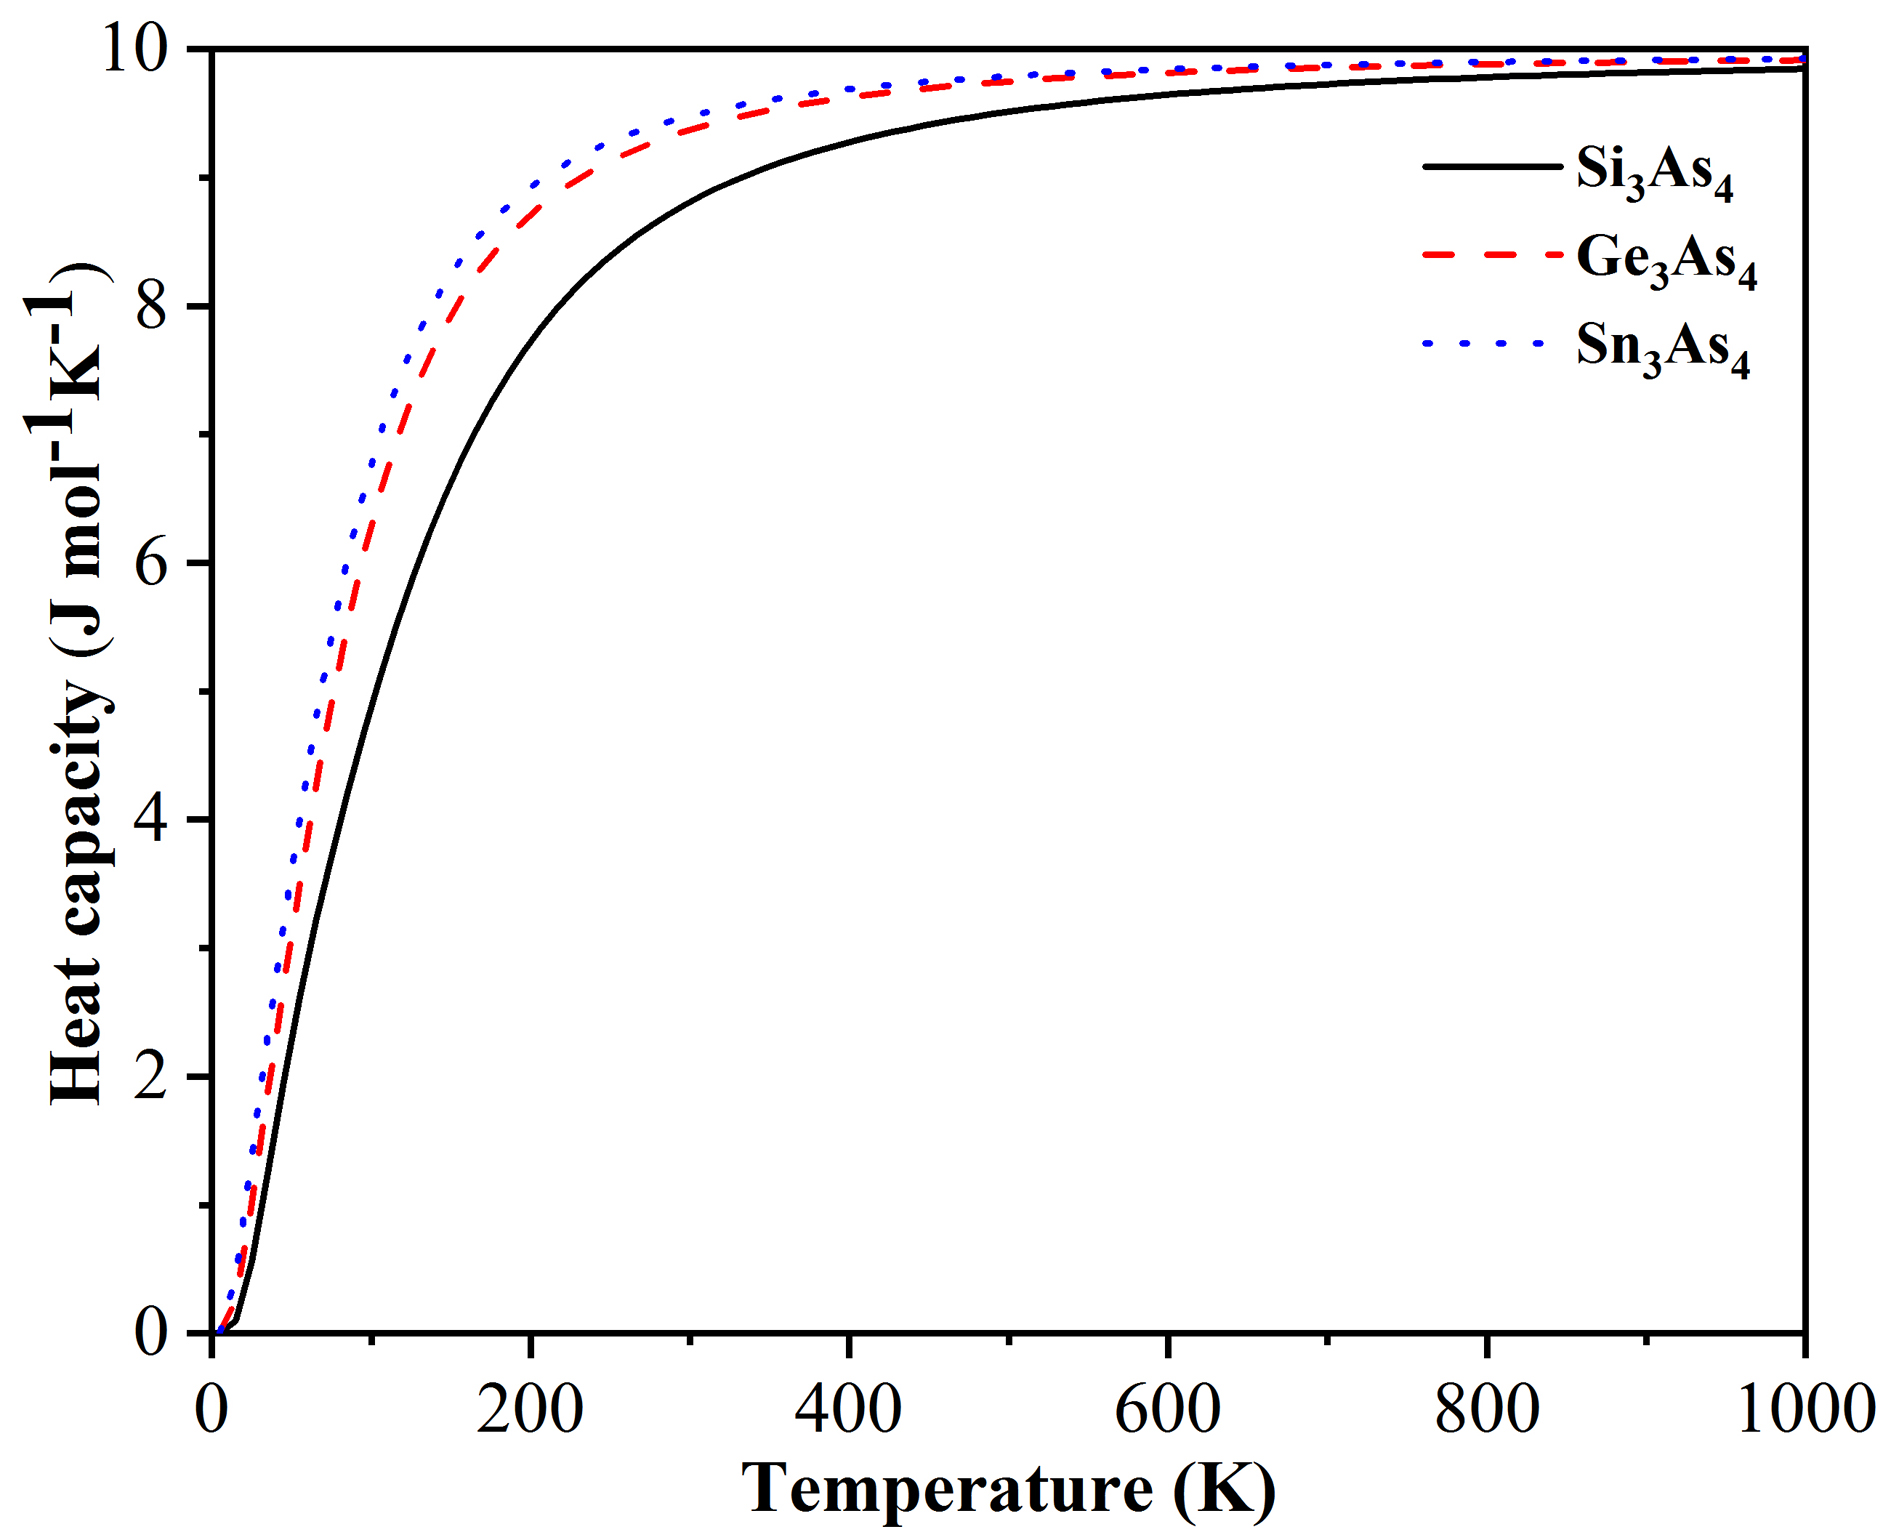
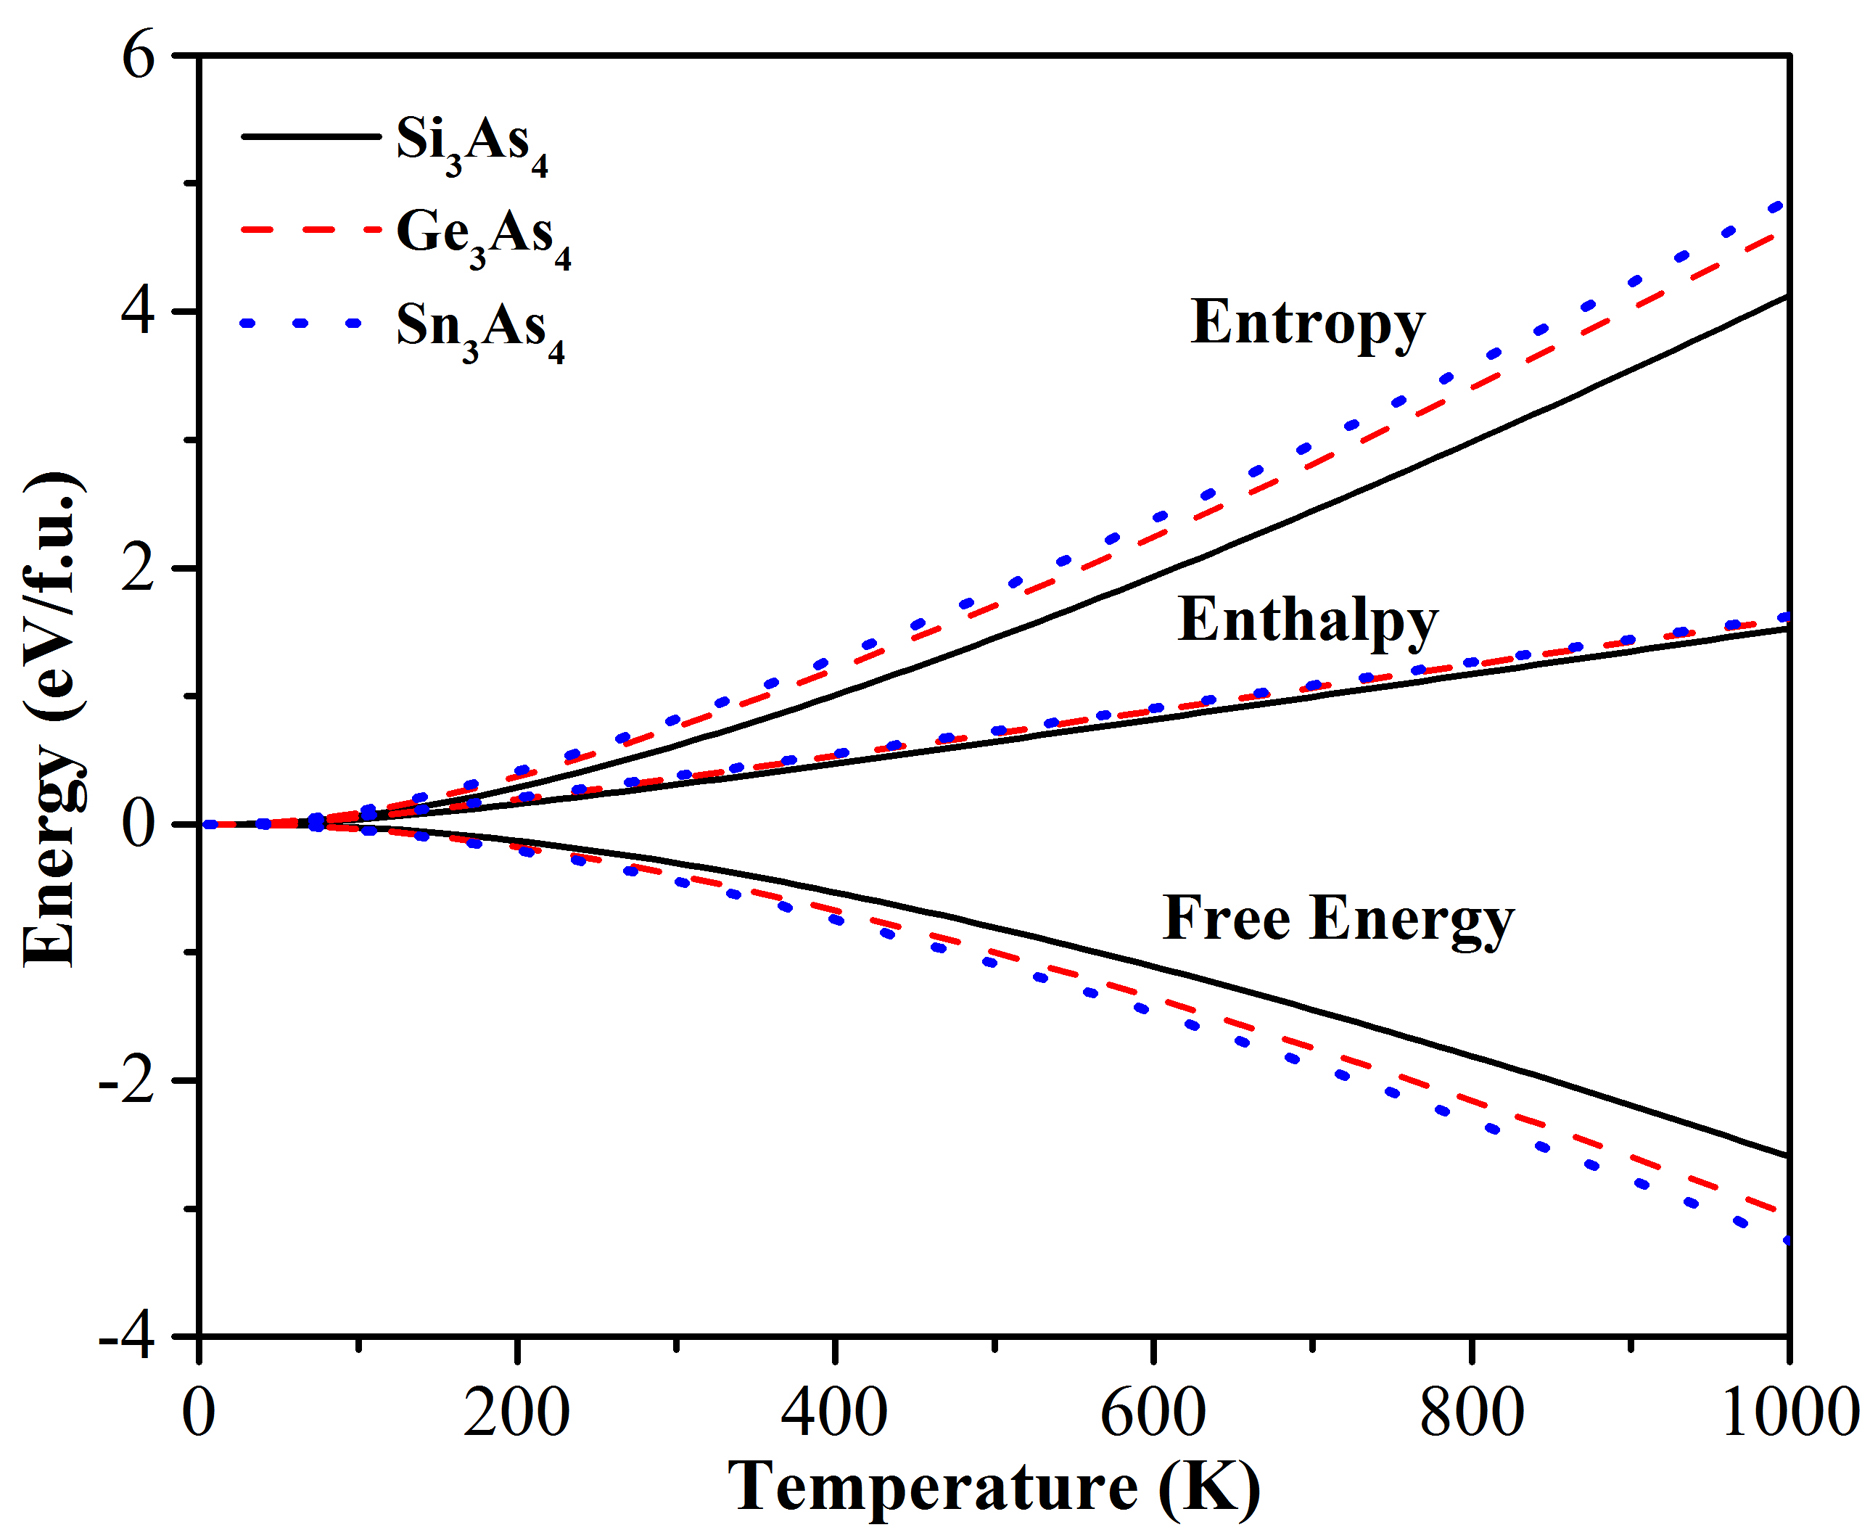
Heat capacity is an important parameter in condensed matter physics. It can also describe the vibrational properties in the heat transition process. The lattice (or phonon) contribution and the electron contribution are two main sources of heat capacity. The former contributes most at a low temperature, while the latter plays an important role at a high temperature. The relations of the constant volume heat capacity with temperature are presented in figure 9 for t-X3As4. It can be seen that these heat capacities increase rapidly with the temperature increase at a lower temperature. At a high temperature, heat capacities rise slowly and are close to the Dulong-Petit limit. It indicates that the atomic interactions in t-X3As4 occur at a low temperature. The Dulong-Petit limit of t-X3As4 is about 10 J mol-1K-1. The variations of the entropy, enthalpy and free energy with temperature at 0 Gpa are shown in figure 10. All values are given in the form of per t-X3As4 formula unit. It is noted that the free energy decreases with the temperature increase, and the entropy increases more rapidly than that of enthalpy as temperature increases. The calculated values of the entropy, enthalpy and free energy of t-X3As4 at room temperature are listed in table 6. All absolute values of the entropy, enthalpy and free energy for t-Sn3As4 are larger than those of t-Si3As4 and t-Ge3As4 under the temperature range from 0 to 1000 K, which means that t-Sn3As4 are less stable than t-Si3As4 and t-Ge3As4. From the figure 10 and table 6, we can see that the descending order of thermodynamic stability is from t-Si3As4 to t-Ge3As4 to t-Sn3As4.
| Si3As4 | Ge3As4 | Sn3As4 | |
|---|---|---|---|
| Entropy | 0.602 | 0.744 | 0.807 |
| Enthalpy | 0.305 | 0.355 | 0.377 |
| Free energy | 0.298 | 0.388 | 0.436 |
4 Conclusion
For the novel predicted t-X3As4, the structural, mechanical, electronic, optical and thermodynamic properties are studied by the first-principles calculations. It is found that t-X3As4 are stable by elastic constants and phonons analysis. The t-Sn3As4 shows to me more anisotropic than t-Si3As4 and t-Ge3As4. Due to a larger mass difference between As and Si atom, there is a larger optical band gap in the dispersion curves of t-Si3As4. By analyzing the density of phonon states in t-Si3As4, t-Ge3As4 and t-Sn3As4, we can see that the vibration of As atoms is dominant in the frequency range of eV, eV and eV, respectively. The vibration of Si and Ge atoms is dominant in the band of eV and eV, respectively. For t-Sn3As4, in the range of eV, the total PHDOS is from Sn and As, which shows that Sn and As have the similar vibrational probability. The band structures and densities of state show that the t-X3As4 (X Si and Ge) are indirect band gap semiconductors with narrow band gaps of 1.438 and 0.952, respectively. The band structure of t-Sn3As4 shows that it is a direct band gap semiconductor. By the analysis of electron density difference and Mulliken charge population, it is found that X (Si, Ge and Sn) atoms lose electrons, and As atoms acquire electrons. The static refractive indices are found to be 3.94, 4.48 and 3.89 eV for t-Si3As4, t-Ge3As4 and t-Sn3As4, respectively. The are 15.5, 20.0 and 15.1 eV for t-Si3As4, t-Ge3As4 and t-Sn3As4, respectively. The Debye temperature of t-Si3As4 is larger than that of t-Ge3As4 and t-Sn3As4. The Dulong-Petit limit of t-X3As4 is about 10 J mol-1K-1. The thermodynamic stability of t-Si3As4 is higher.
5 Acknowledgements
This work is supported by the Natural Science Basic Research plan in Shanxi Province of China [No. 2016JM1026] and supported by the 111 Project [B17035]. This work is also supported by Leihua Electronic and Technology Research Institute, Aviation Industry Corporation of China (No. MJZ-2016-S-44).
References
-
[1]
Hu J., Huang S., Xie Z., Hu H., Cheng W., J. Phys.: Condens. Matter, 2007, 19, No. 49, 496215,
doi:10.1088/0953-8984/19/49/496215. - [2] Jiang J.Z., Kragh F., Frost D.J., Ståhl K., Lindelov H., J. Phys.: Condens. Matter, 2001, 13, No. 22, L515–L520, doi:10.1088/0953-8984/13/22/111.
- [3] Liu A.Y., Cohen M.L., Phys. Rev. B, 1990, 41, No. 15, 10727–10734, doi:10.1103/PhysRevB.41.10727.
- [4] Hu C., Feng Y.P., Phys. Rev. B, 2006, 74, No. 10, 104102, doi:10.1103/PhysRevB.74.104102.
-
[5]
Yang R., Ma S., Wei Q., Du Z., Z. Naturforsch., A: Phys. Sci., 2017, 72, No. 9, 805–810,
doi:10.1515/zna-2017-0155. - [6] Zhang X.D., Shi H.F., Mater. Sci. Technol., 2014, 30, No. 6, 732–738, doi:10.1179/1743284713Y.0000000423.
- [7] Yang R., Zhu C., Wei Q., Du Z., J. Phys. Chem. Solids, 2016, 98, 10–19, doi:10.1016/j.jpcs.2016.05.012.
- [8] Ding Y., Physica B, 2012, 407, No. 12, 2190–2200, doi:10.1016/j.physb.2012.02.040.
-
[9]
Perdew J.P., Burke K., Ernzerhof M., Phys. Rev. Lett., 1996, 77, No. 18, 3865–3868,
doi:10.1103/PhysRevLett.77.3865. - [10] Wu Z.-J., Zhao E.-J., Xiang H.-P., Hao X.-F., Liu X.-J., Meng J., Phys. Rev. B, 2007, 76, No. 5, 054115, doi:10.1103/PhysRevB.76.054115.
-
[11]
Xiao B., Feng J., Zhou C.T., Jiang Y.H., Zhou R., J. Appl. Phys., 2011, 109, No. 2, 023507,
doi:10.1063/1.3532038. -
[12]
Feng J., Xiao B., Zhou R., Pan W., Clarke D.R., Acta Mater., 2012, 60, No. 8, 3380–3392,
doi:10.1016/j.actamat.2012.03.004. - [13] Pugh S.F., Lond. Edinb. Dubl. Philos. Mag., 1954, 45, No. 367, 823–843, doi:10.1080/14786440808520496.
-
[14]
Xing M.-J., Li B.-H., Yu Z.-T., Chen Q., Commun. Theor. Phys., 2015, 64, No. 2, 237–243,
doi:10.1088/0253-6102/64/2/237. - [15] Yang R., Zhu C., Wei Q., Zhang D., Solid State Commun., 2017, 267, 23–28, doi:10.1016/j.ssc.2017.09.008.
- [16] Yang R., Zhu C., Wei Q., Du Z., J. Phys. Chem. Solids, 2017, 104, 68–78, doi:10.1016/j.jpcs.2016.12.032.
-
[17]
Jiao Z.Y., Ma S.-H., Yang J.-F., Solid State Sci., 2011, 13, No. 2, 331–336,
doi:10.1016/j.solidstatesciences.2010.11.030. -
[18]
Feng J., Xiao B., Chen J.C., Zhou C.T., Solid State Sci., 2009, 11, No. 1, 259–264,
doi:10.1016/j.solidstatesciences.2008.04.015. - [19] Fan Q., Wei Q., Yan H., Zhang M., Zhang Z., Zhang J., Zhang D., Comput. Mater. Sci., 2014, 85, No. 4, 80–87, doi:10.1016/j.commatsci.2013.12.045.
- [20] Tosi M.P., Fumi F.G., Phys. Rev., 1963, 131, No. 4, 1458–1465, doi:10.1103/PhysRev.131.1458.
Ukrainian \adddialect\l@ukrainian0 \l@ukrainian
Структурнi, механiчнi, електроннi, оптичнi i термодинамiчнi властивостi t-X3As4 (X Si, Ge i Sn) з першопринципних розрахункiв Р. Янг, Ю. Ма, К. Вей , Д. Жанг, I. Жоу
Школа фiзики та оптоелектронної iнженерiї, громадський унiверситет у Сiанi, 710071, Китай
Нацiональний суперкомп’ютерний центр в Шеньчженi, Шеньчжень 518055, Китай
Iнститут електронiки та технологiчних дослiджень Лейхуа, Авiацiйна промислова корпорацiя Китаю,
Усi, Цзянсу 214063, Китай