Gas Flows Within Cavities of Circumbinary Discs in Eccentric Binary Protostellar Systems
Abstract
The structure and evolution of gas flows within the cavity of a circumbinary disk (CBD) surrounding the stellar components in eccentric binaries are examined via two-dimensional hydrodynamical simulations. The degree to which gas fills the cavity between the circumstellar disks (CSDs) and the CBD is found to be greater for highly eccentric systems, in comparison to low-eccentricity systems, reflecting the spatial extent over which mass enters into the cavity throughout the orbit. The pattern of the gas flow in the cavity differs for eccentric binaries from that of binaries in a circular orbit. In particular, the former reveals tightly wound gas streams and figure-eight-like structures for systems characterized by eccentricies, , whereas the latter only reveal relatively loosely bent streams from the CBD to the CSDs. Hence, the description of the stream structures can be a probe of sufficient non-circularity of the binary orbital motion. Given that the inner edge of the CBD is not very well defined for highly eccentric systems due to the complex gas structures, it is suggested that the area of the cavity for high-sensitivity imaging observations may prove to be a more useful diagnostic for probing the effectiveness of CBD clearing in the future.
1 Introduction
Within the last decade radio observations of protostellar binary systems at submillimeter wavelengths using interferometers at the Submillimeter Array (SMA) and Atacama Large Millimeter/subillimeter Array (ALMA) have enabled detailed spectral studies of their structures at high angular resolution. Due to the close proximity of protostellar binary systems in low mass star forming regions ( pc) and their large orbital separations ( AU) the observations of L1551 NE (Takakuwa et al. 2014), UY Aur (Tang et al. 2014) and GG Tau (Dutrey et al. 2016) have revealed significant morphological and kinematic structure in the circumstellar disk (CSD) and circumbinary disk (CBD) in these systems. In particular, observations provide estimates of the shape and size of the cavity within the CBD, the existence of gas streams from the CBD to the CSDs, the stream connecting the CSDs, and shocks as inferred from molecular tracers (e.g., SO). All these diagnostic probes provide valuable insight into the nature of these systems and the interactions between their components.
In parallel, the pioneering theoretical works of Artymowicz & Lubow (1994, 1996) have provided an interpretative framework for some of these observational data. In particular, the importance of the eccentricity of the orbit on the inner size of the CBD was pointed out by Artymowicz & Lubow (1994), Lubow & Artymowicz (1997) and summarized in a review by Dutrey et al. (2016). Recent numerical studies by Miranda, Munoz, & Lai (2017), Thun, Kley, & Picogna (2017), and Munoz, Miranda, & Lai (2018) and references therein have provided theoretical understanding for the description of the structure within the CBD, and the morphology and variability of the flows between the CBD and CSD. Of additional interest is the secular evolution of the mass accretion rates onto the individual stellar components of the binary and the angular momentum transfer rate between the CBD and the binary system.
In this Letter, we focus on the structure of the gas flowing from the CBD to the CSDs within the cavity created by the non-central gravitational forces acting on the gas within a binary system. The general case of an eccentric binary is considered as it is more appropriate for the systems under consideration where the orbital separations of the observed protobinary systems with CBD are large. Processes which can lead to the circularization of the orbital motion such as tidal dissipation are ineffective.
Previous studies by Gunther & Kley (2002), Hanawa, Ochi, & Ando (2010), and de Val-Borro, Gahm, Stempels, & Poplinksi (2011) have explored the temporal and spatial properties of gas flows for specific binary star systems and, hence, for a limited range of mass ratios and orbital eccentricities. However, we focus on the degree to which the cavity is filled and the resulting flow patterns for a range of eccentricities and mass ratios. We model the system without excising the inner binary and CSDs and adopt a viscosity parameter , a value considered appropriate for disks surrounding young stellar objects in contrast to higher values adopted in earlier studies. Our investigation is motivated, in part, by observational evidence for the presence of shocked gas within the cavity of CBDs in binary protostars (e.g., UY Aur, see Tang et al. 2014; L 1551 NE, see Takakuwa et al. 2017). As a major result, we find that the flow patterns in the cavity can be characterized by either tightly wound streams or figure-eight-like features, which are unique to moderate and highly eccentric binary systems.
In the next section, we briefly describe the numerical method, the assumptions underlying our model, and the initial setup of our calculations. The results from a suite of two-dimensional hydrodynamical simulations are presented and described with a particular focus on the patterns of the gas flow within the cavity in §3. The dependence of the character of the gas flow between the CBD and CSDs on the eccentricity and mass ratio of the system are also described. Finally, we discuss the implications of our work, their relevance to the interpretation of observations, and conclude in the last section.
| Simulation | Mass Ratio q | Eccentricity e |
|---|---|---|
| q1.0e0.0 | 1.0 | 0.0 |
| q1.0e0.2 | 1.0 | 0.2 |
| q1.0e0.4 | 1.0 | 0.4 |
| q1.0e0.6 | 1.0 | 0.6 |
| q1.0e0.8 | 1.0 | 0.8 |
| q0.8e0.0 | 0.8 | 0.0 |
| q0.6e0.0 | 0.6 | 0.0 |
| q0.4e0.0 | 0.4 | 0.0 |
| q0.8e0.6 | 0.8 | 0.6 |
| q0.6e0.6 | 0.6 | 0.6 |
| q0.4e0.6 | 0.4 | 0.6 |
2 Numerical Method and Assumptions
To model the hydrodynamical flow within the cavity of a CBD, we use the DISCO code (Duffell & MacFadyen 2012; Duffell 2016). DISCO is a moving-mesh hydrodynamics code specifically tailored to evolving astrophysical disks. Computational zones are wedge-like annular segments that orbit with a prescribed velocity. Neighboring annuli shear with respect to each other such that the mesh topology changes during the course of the calculation. DISCO evolves the hydrodynamic equations in cylindrical coordinates, explicitly conserving angular momentum.
The mesh for our fiducial simulation setup consists of 128 annuli spaced from the origin to . The highest resolution is attained near the binary, with . The azimuthal extent of each zone is chosen such that , so that the zones all have approximately aa 1:1 aspect ratio. The outer boundary at fixes all fluid quantities to the initial conditions. Zones are constructed in such a way that there is no need for any special boundary condition at . We have also performed two simulations (q1.0e0.0 and q1.0e0.6) at a factor 2 higher resolution of 256 annuli and in turn also factor 2 higher resolution in azimuthal resolution. We find that the cavity shape and area, as well the local flow patterns are only minimally changed when comparing simulations with different resolution.
We carry out each numerical calculation for orbits in order to achieve a quasi-steady state in the inner region of the CBD and cavity region. The inner disk structure at late times is insensitive to the initial conditions. The binary is imposed as a pair of point masses orbiting one another with a fixed mass ratio , semi-major axis and eccentricity . The binary motion is determined using the analytical solution to Kepler’s equations, so that the binary separation ranges from to . The disk is setup by using an isothermal equation of state, with at . We choose a uniform surface density profile, , with . Viscosity is chosen by imposing a fixed , giving a kinematic viscosity of .
We use a sink prescription to model accretion onto the protostars from the CSDs. We remove fluid smoothly from the vicinity of each protostar following the prescription described in Farris et al. (2014). Specifically, we use a source term which we add inside a radius . This removes fluid from the vicinity of each protostar by assuming an -disk model for the CSD. We choose to roughly match the expected viscosity of the CSDs, but note that other choices ( and ) do not change the results and conclusions presented in this Letter qualitatively (as noted by Tang et al 2018, this choice can affect the torque measured, but that is not the focus of this study).
3 Simulation Results
We have performed simulations at low viscosity () and for a sink rate of for different mass ratios and eccentricities. The parameters and key quantities from the simulations are presented in Table 1. We have explored mass ratios between 1.0 and 0.4 and eccentricities between and . The equal-mass circular orbits simulation q1.0e0.0 is our reference simulation.
We find differences in flow structure between the CBD and the two individual
protostellar disks that surround each of the stars. In the following we first
describe the dependence of the flow structure on the eccentricity of the binary
stars’ orbital motion and secondly describe the dependence of the accretion
flows onto the two protostellar disks when the two stars have different masses.
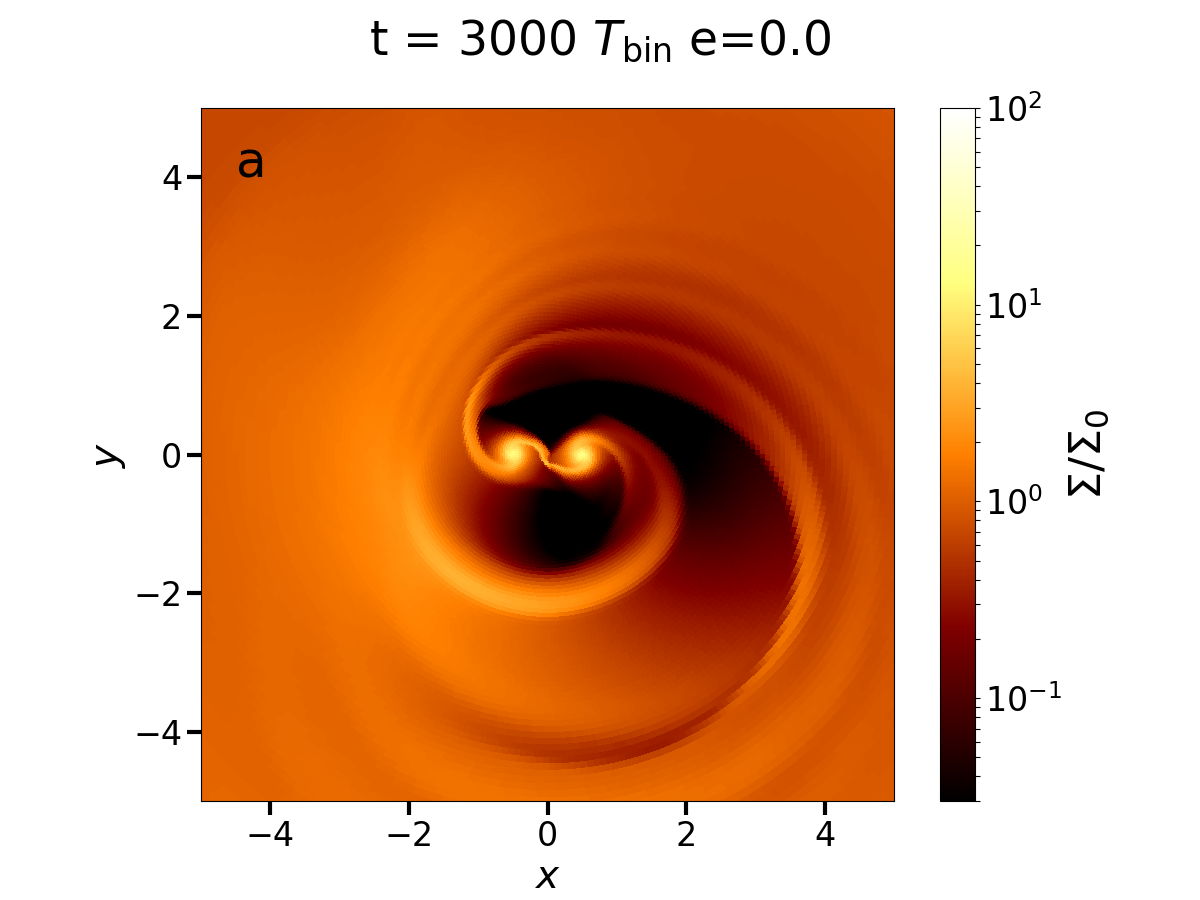
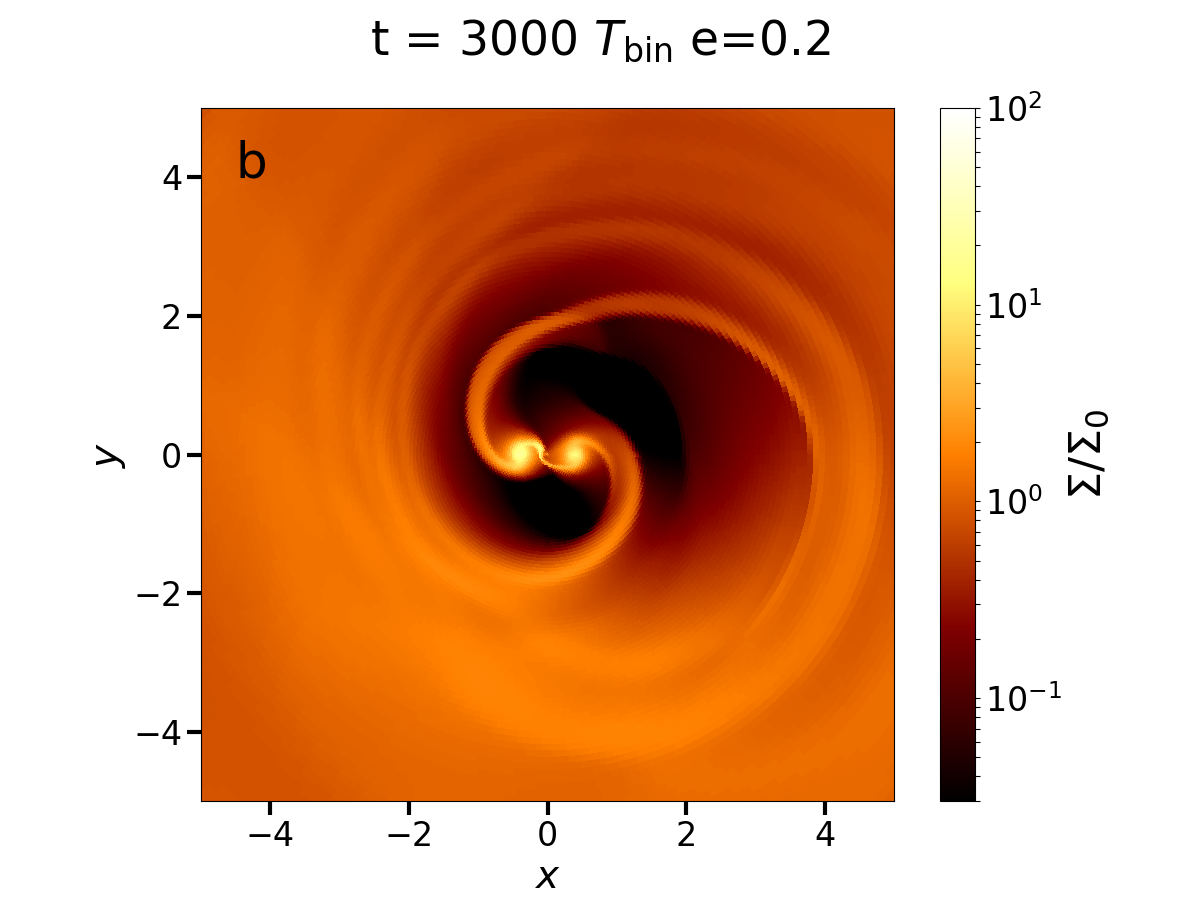
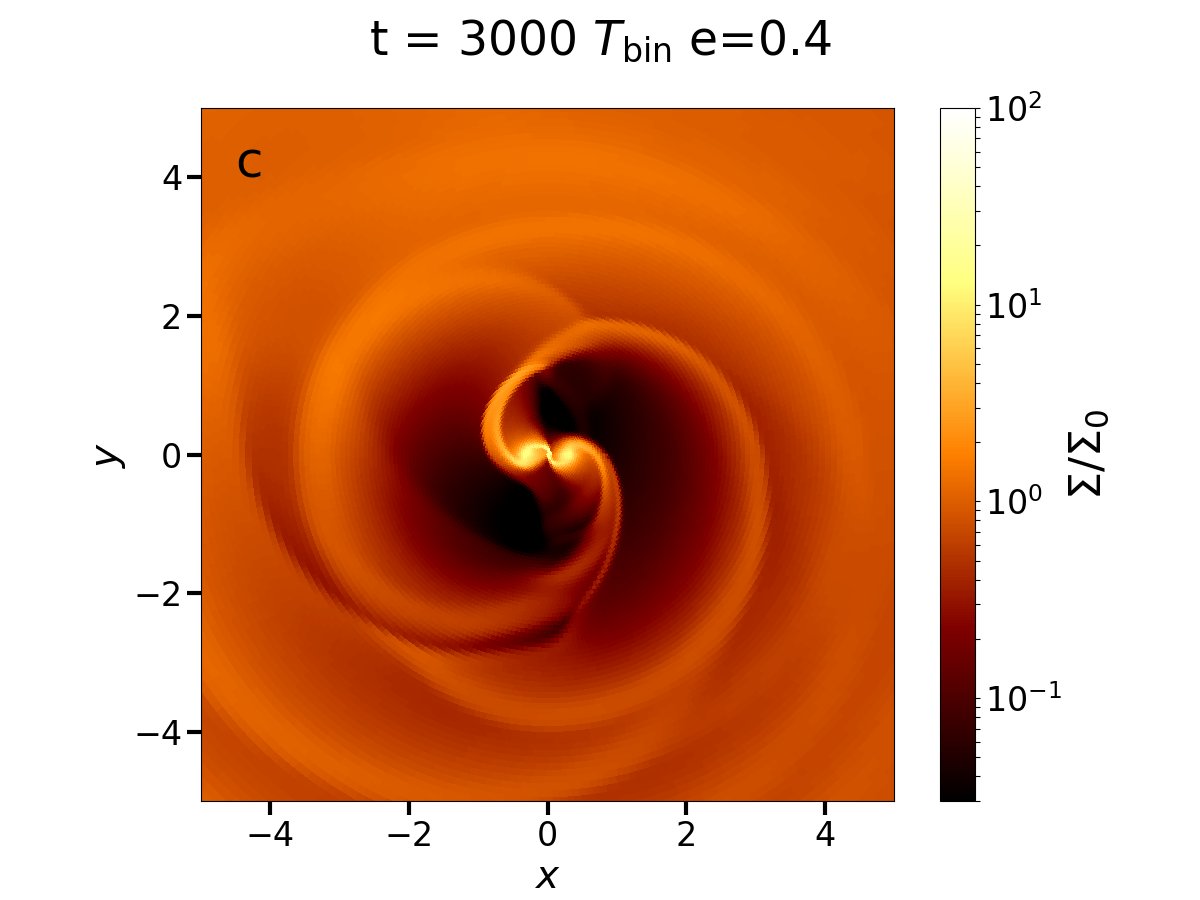
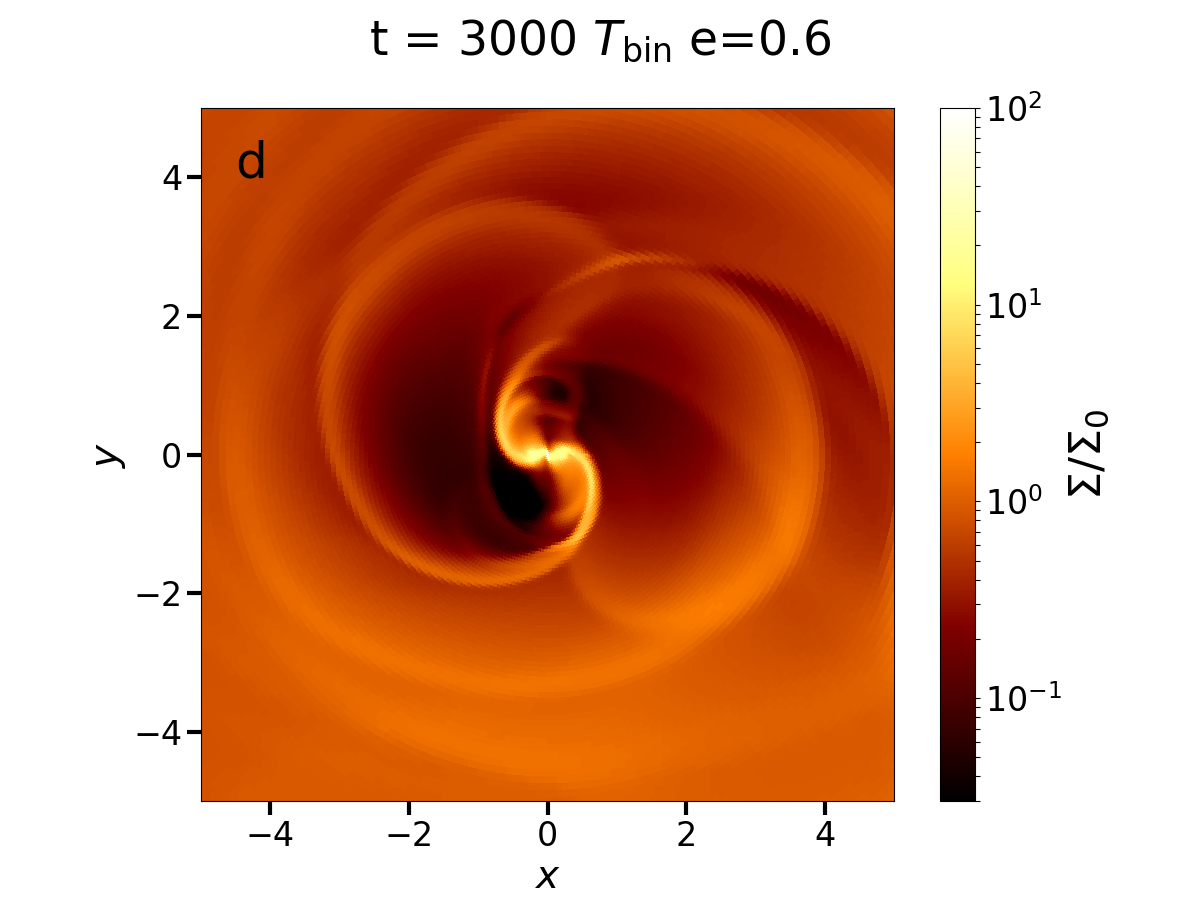
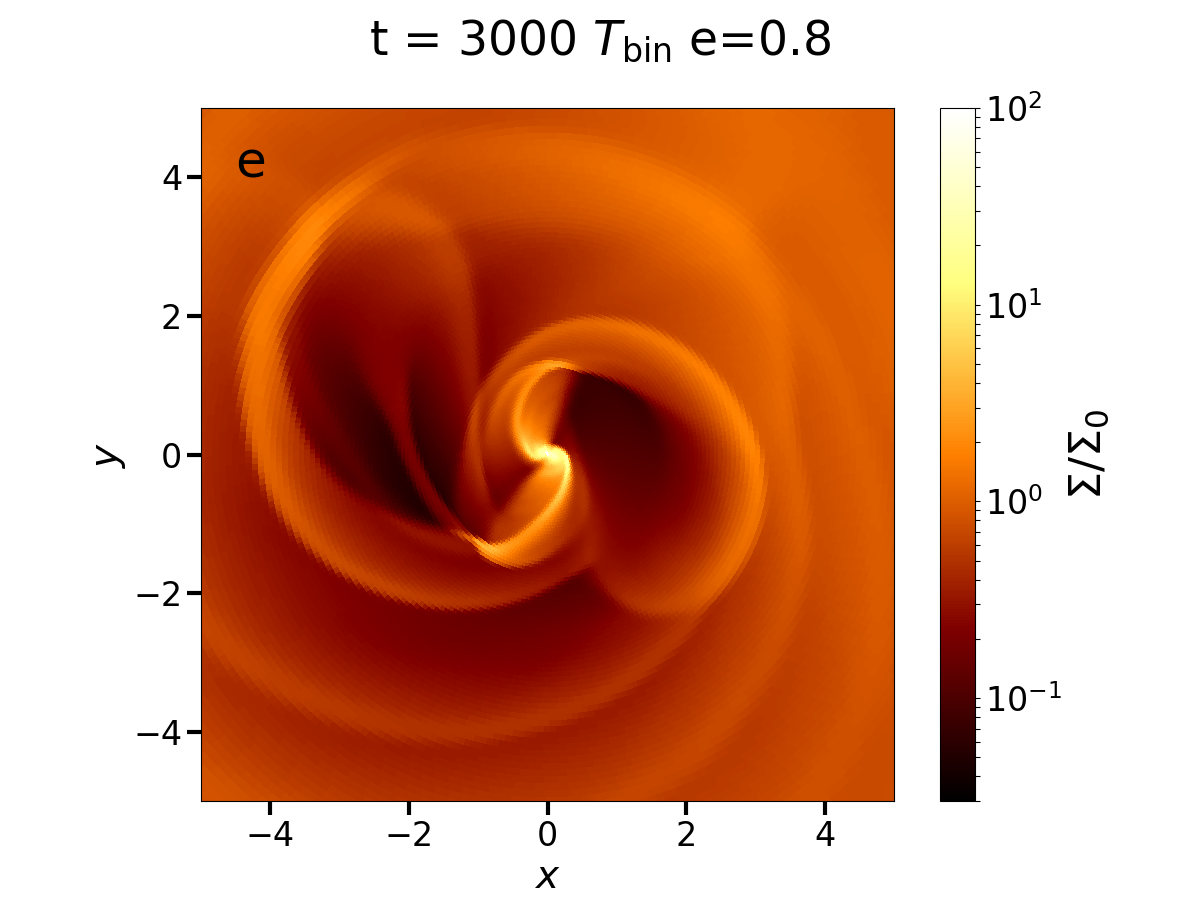
2D pseudocolor visualizations of surface density for the simulation series with varying eccentricities (q1.0e0.0 to q1.0e0.8) are shown in Fig. 1. To highlight the behavior of the binary and disk cavity we limit the extension of the color plots to . The CBD cavity becomes eccentric in all cases, but the cavity size is larger in radial extent for higher eccentricities of the binary. At the same time, the material inside the cavity has higher density and its mass is greater for higher eccentricities. Torques exerted by the binary impact the disk structure out to larger radii for more eccentric orbits. The CSDs surrounding the individual protostars are more extended in the case of zero or low eccentricity. In contrast, the accretion streams onto the CSDs from the CBD are more diffuse and less clearly defined for higher eccentricities.
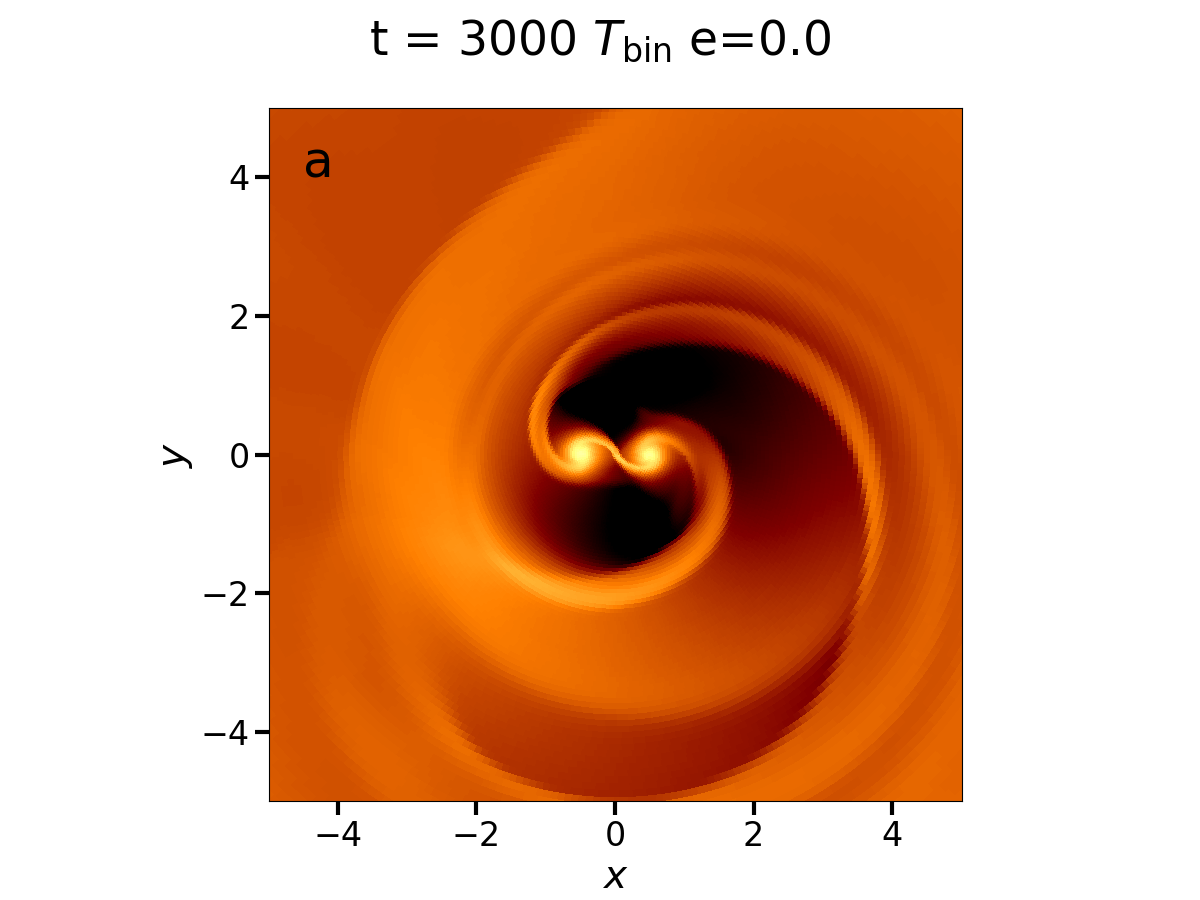
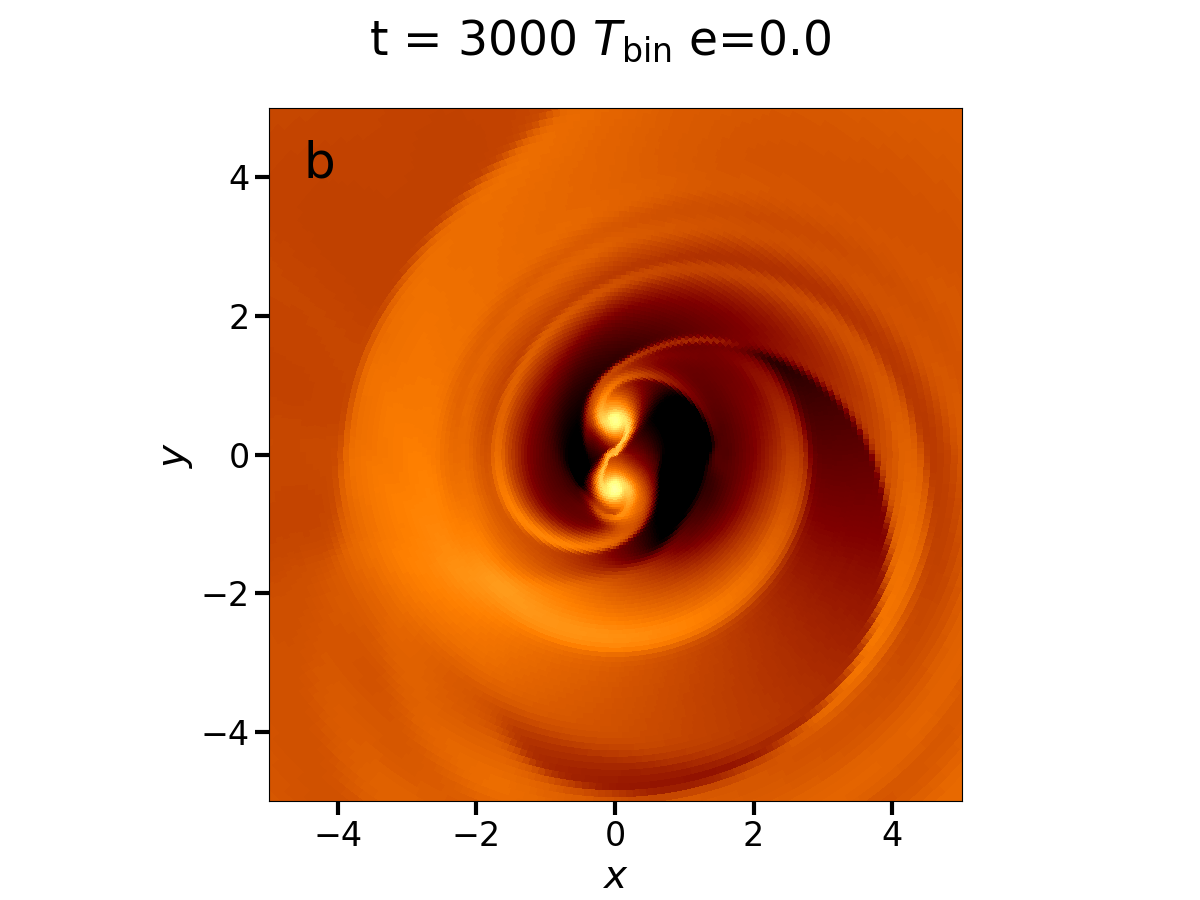
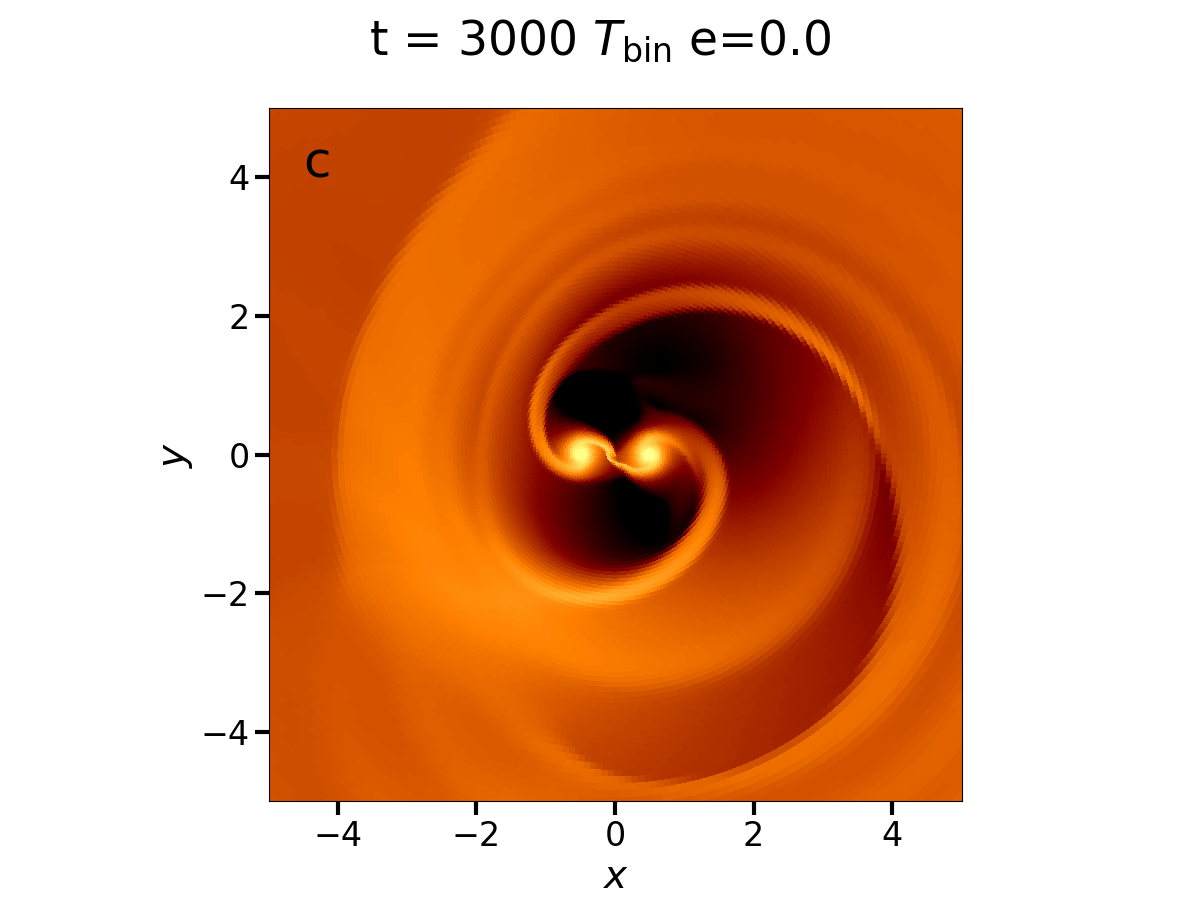
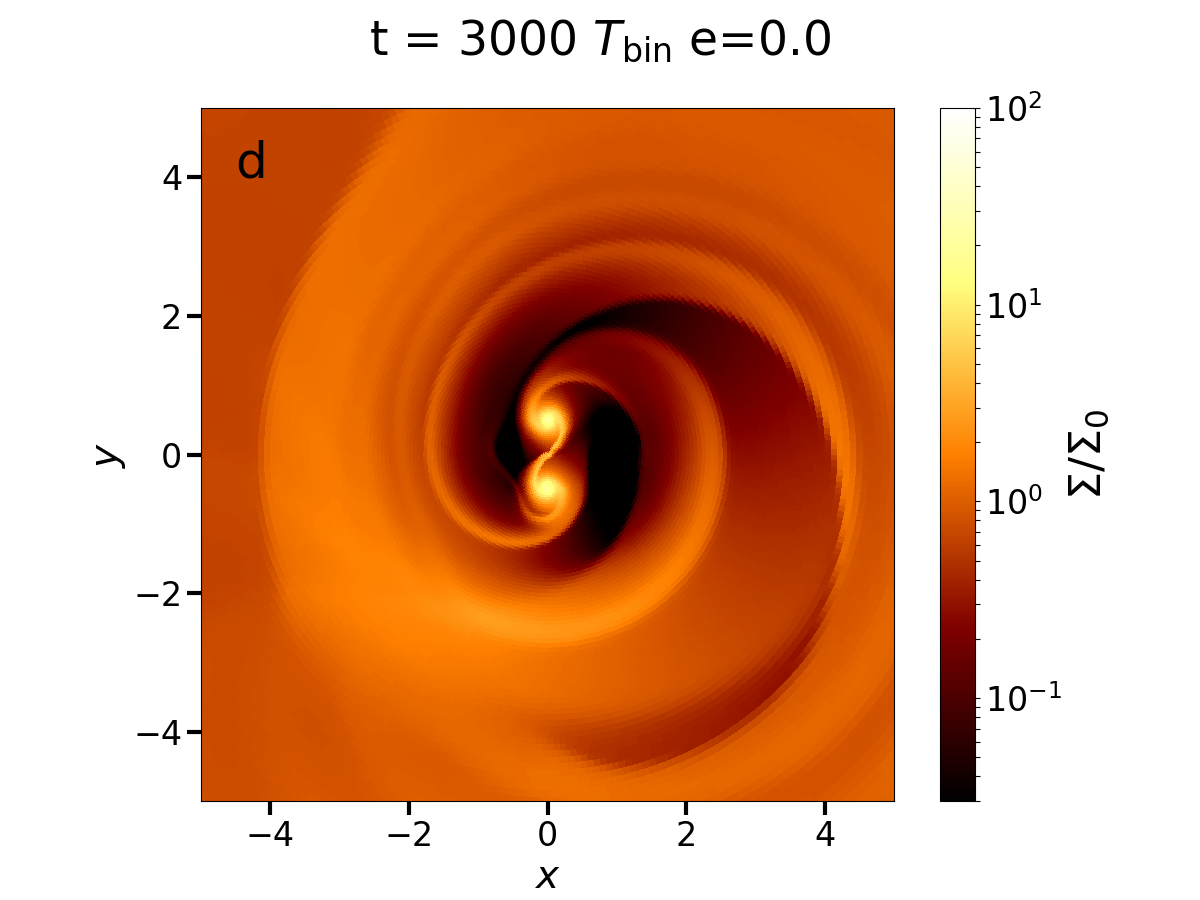
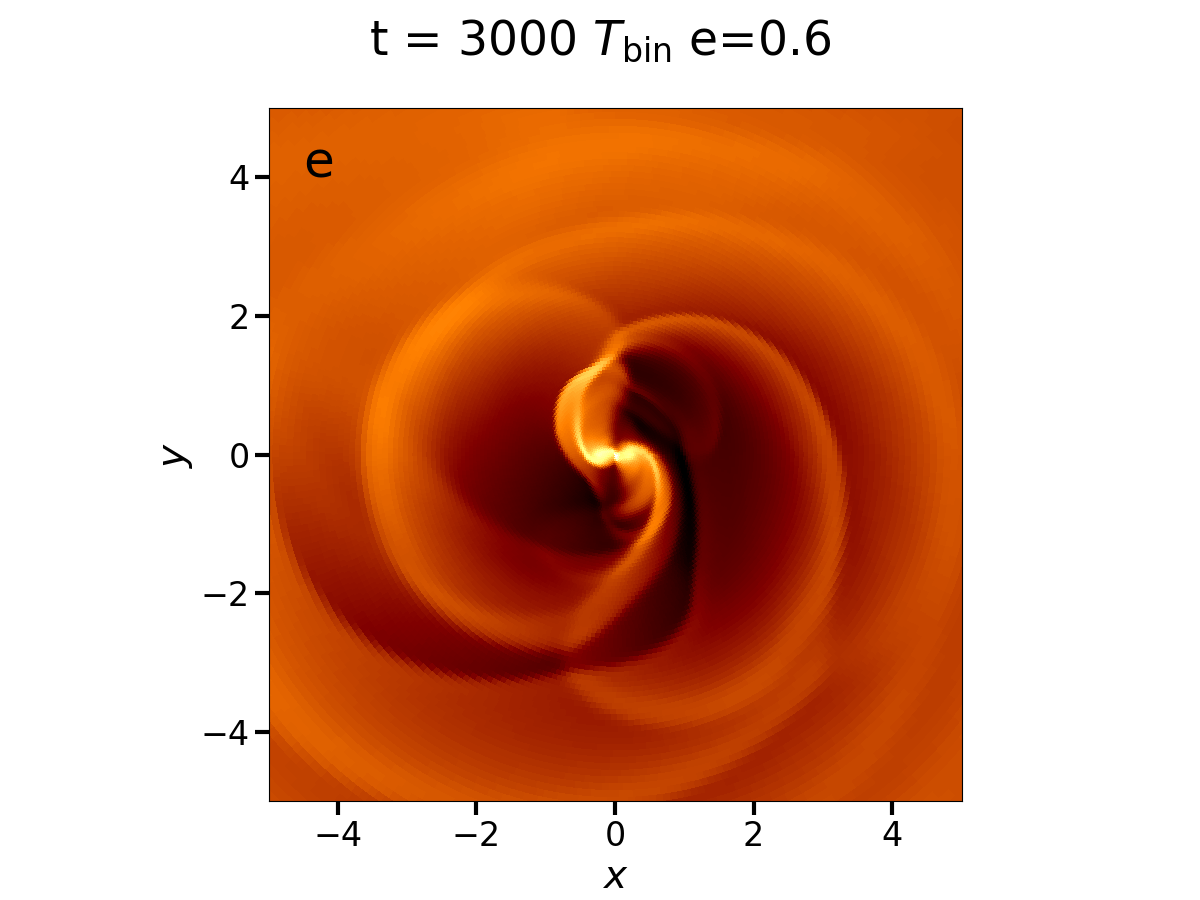
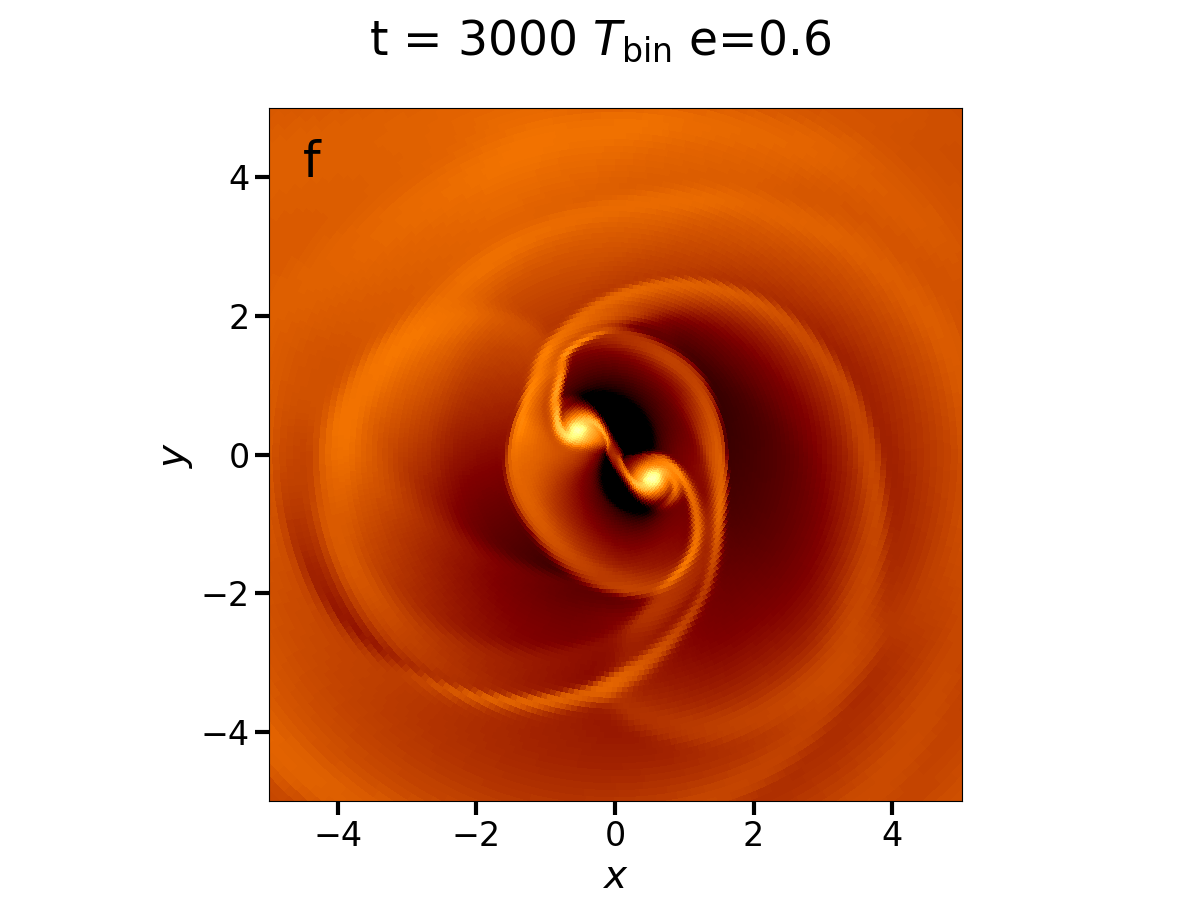
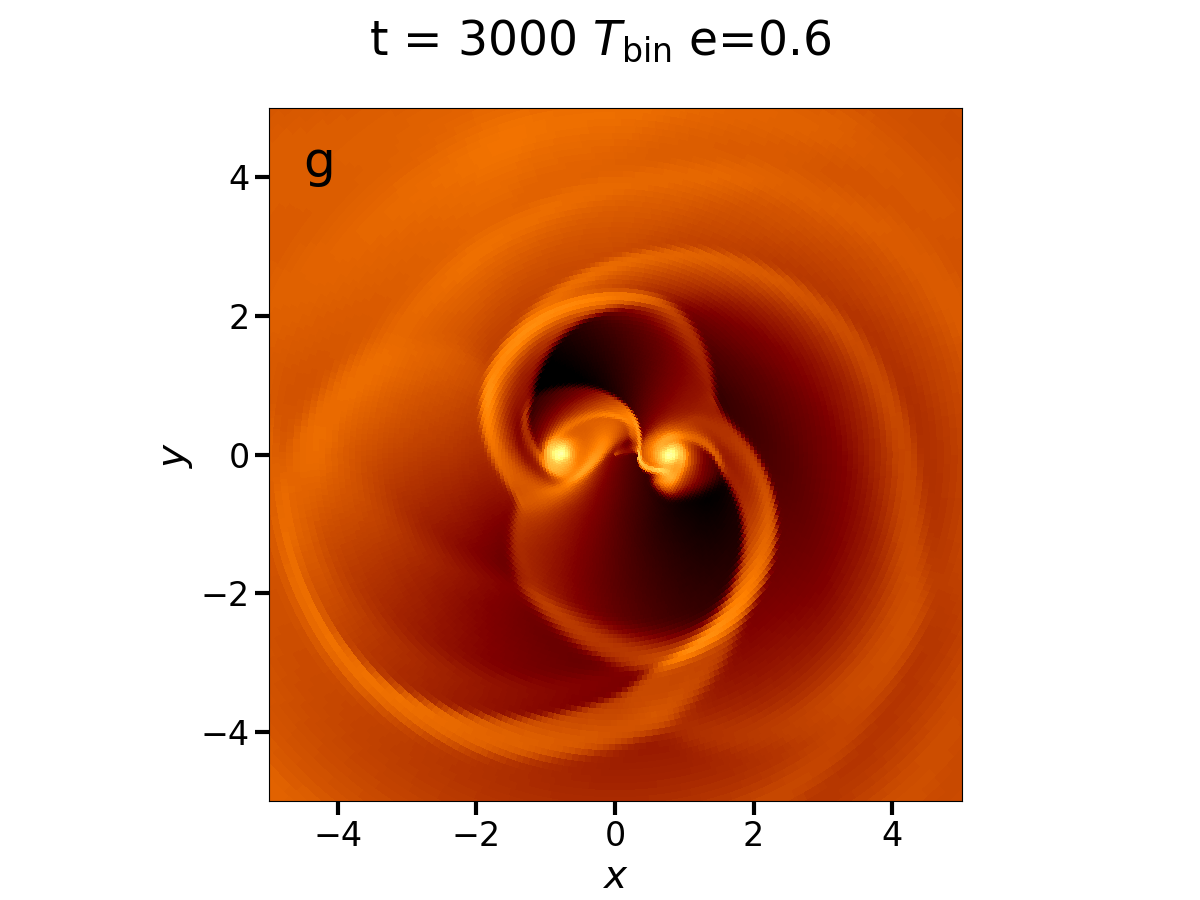
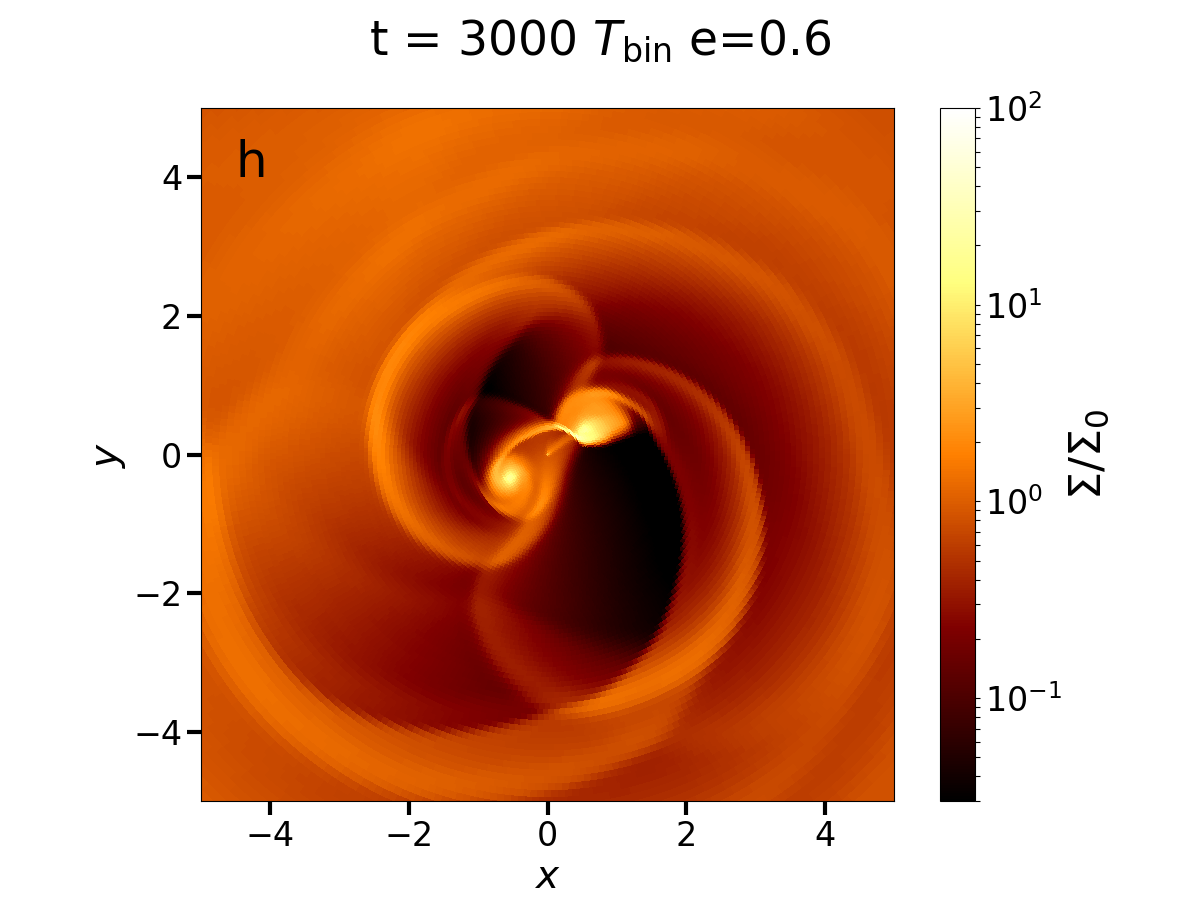
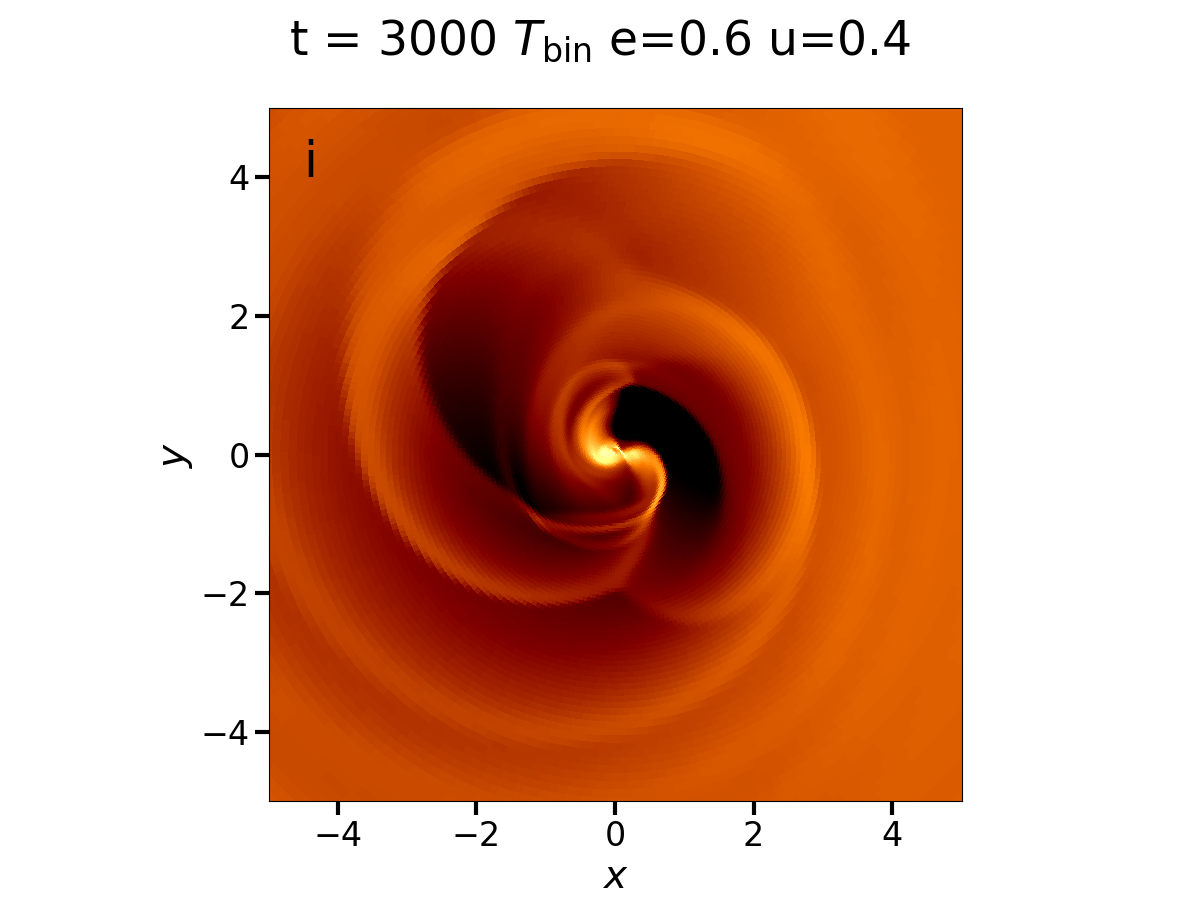
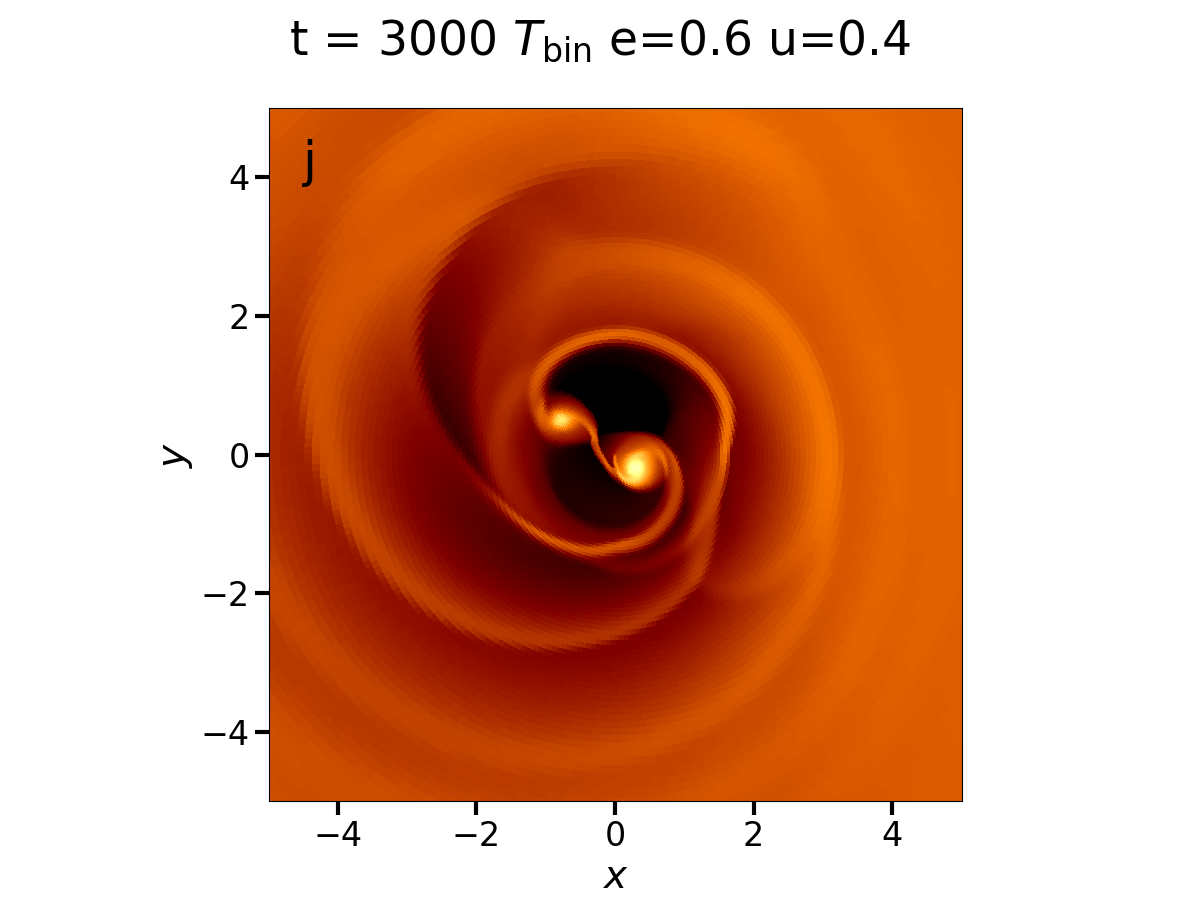
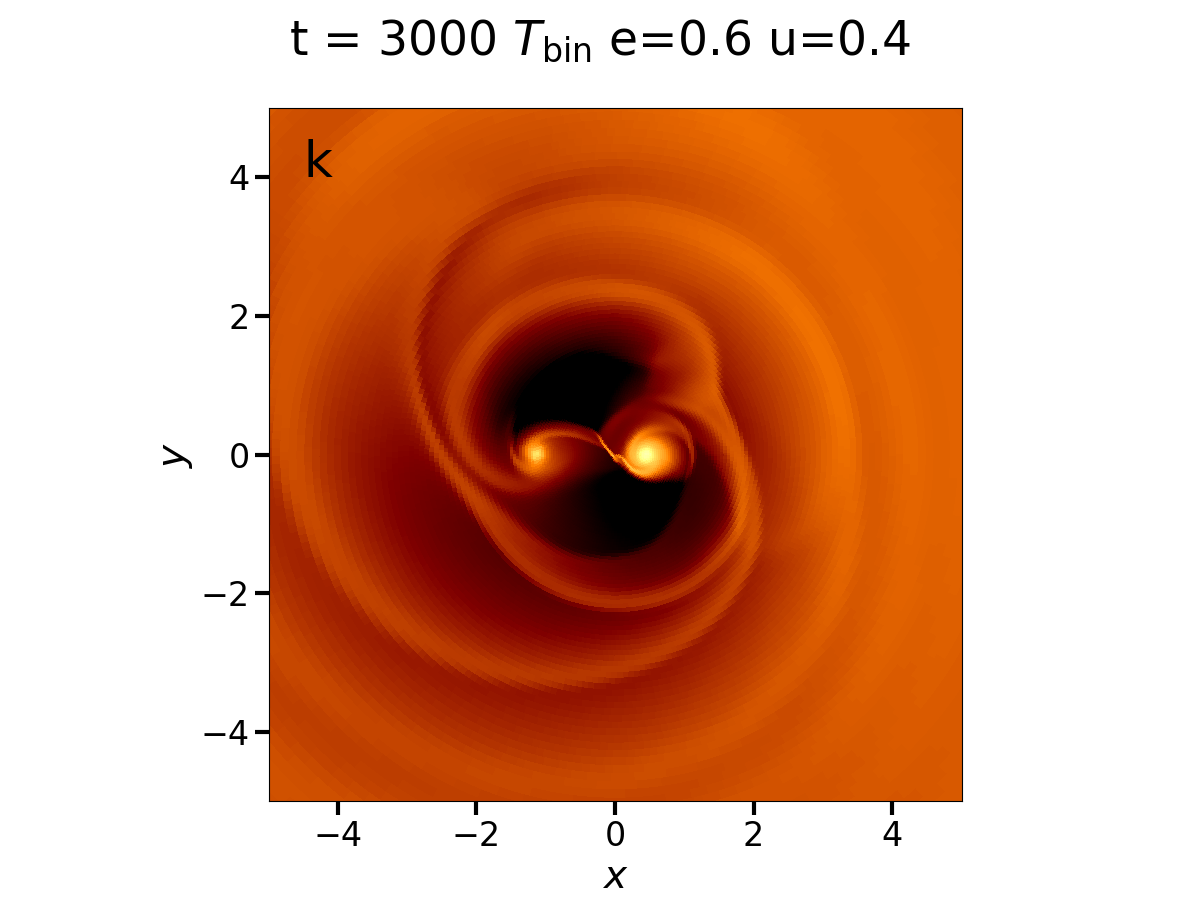
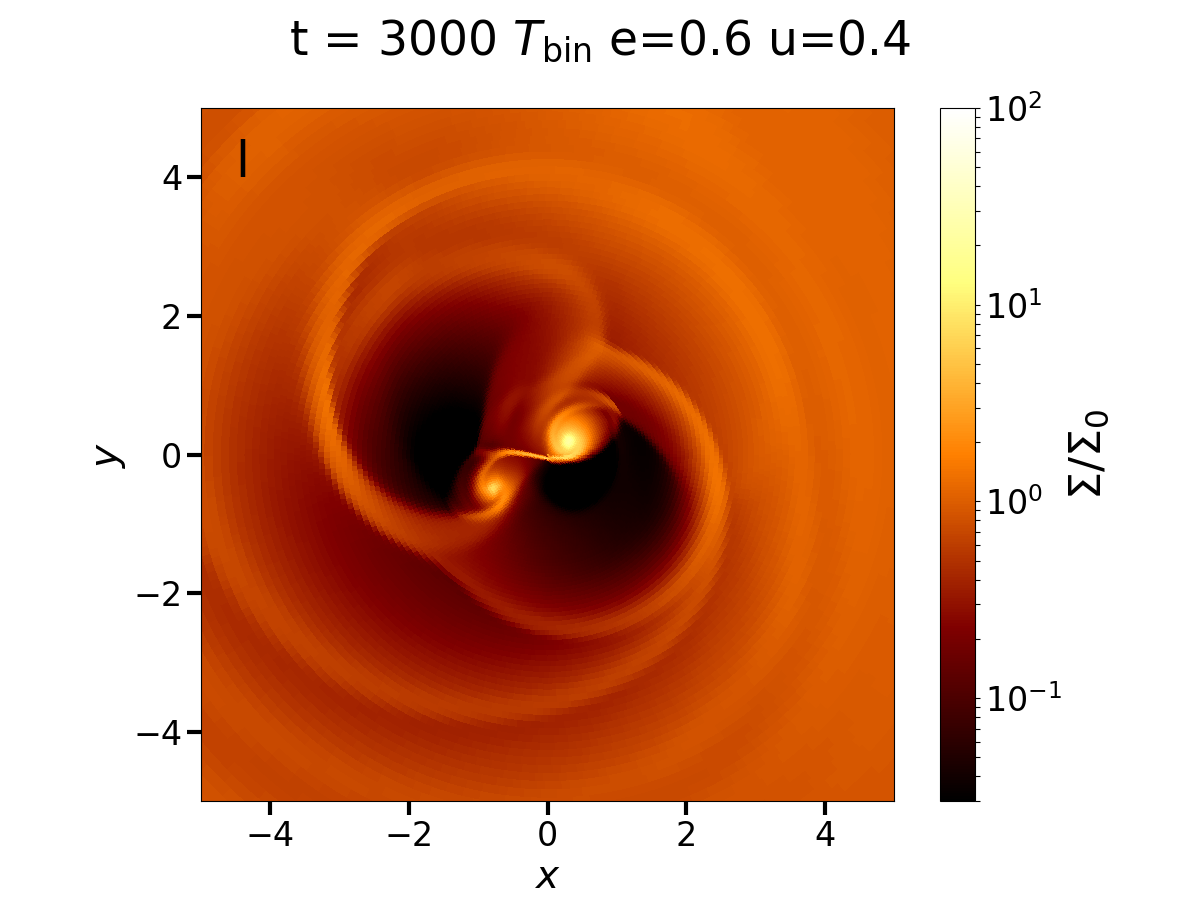
To illustrate the differences in the flow structure in the orbital evolution of the binary and CBD, we show snapshots at different times during a single orbit for simulations q1.0e0.0, q1.0e0.6, and q0.4e0.6. Panels (a)-(d) of Fig. 2 illustrate that the differences in flow structure during one orbit vary only moderately in the case for a circular orbit. Both the two CSDs around the protostars and the accretion streams onto them remain well connected and defined during the orbit. A stream connecting the two CSDs is always present during the orbit. For comparison we show the eccentric binary q1.0e0.6 in panels (e)-(h) of Fig. 2. Here, the orbital dynamics and changes in binary separation during one orbit change the behavior of the accretion flows, CSDs and stream between the CSDs significantly. At periastron (Fig. 2 panel (e), the two CSDs nearly touch as the orbital separation is the smallest. The accretion streams onto the CSDs are relatively narrow and well defined. As the binary evolves toward apastron (Fig. 2 panels (f),(g)), the accretion streams become more diffuse and the cavity structure more complicated. A figure-eight-like structure emerges that is not present in the circular orbit case. The flow between the two CSDs becomes very narrow and less dense than in the circular orbit case. In the evolution back toward periastron (Fig. 2 panel (h)), the structure disappears again. Finally, panels (i)-(l) of Fig. 2 show the eccentric unequal-mass binary q0.4e0.6. The flow patterns are very similar to the equal-mass, eccentric binary q1.0e0.6 and the same figure-eight-like structure emerges in the evolution toward apastron. This structure is also present in the binaries q1.0e0.4 and q1.0e0.8 (not shown here). Overall, in all simulations with eccentricity , there is more diffuse low-density gas in the cavity during all stages of the orbit compared to the circular orbit case and the figure-eight-like structure in the accretion flows onto the CSDs appears as a robust feature of the eccentricity in the orbits of the two stars.


Fig. 3 shows angle-averaged (in azimuthal angle ) profiles of surface density as a function of radius for the binaries q1.0e0.0 - q1.0e0.8. Panel (a) (left) shows the time-averaged surface density profiles for (solid lines). The shaded regions surrounding the time-averaged profiles show the minimum and maximum values of profiles at individual times and give an indication of the variability of the radial structure over time. Panel (b) (right) shows only the time-averaged surface density profiles as a function of radius. It can be seen that clear trends with eccentricity are present. The radius of the inner edge of the CBD becomes larger for increasing eccentricity. At the same time the cavity remains filled with higher-density material compared to the circular orbit case, making it difficult to define the location of the inner edge of the CBD with increasing eccentricity. In addition there is less variation around the mean profiles for increasing eccentricity. We note that due to the chosen value for the viscosity parameter of , only the cavity and inner regions of the CBD evolve for a full viscous time at , but there is still little to no evolution of the outer regions of the CBD. This is directly visible in the very small extent of the shaded regions beyond . This however does not impact on the results of this Letter as our focus is exclusively on the behavior of the cavity surrounding the binary and the accretion flows onto and between the CSDs surrounding the stars. As a final remark, we point out that the surface density of material in the cavity does not decrease as much in our simulations when compared to simulations that excise the stars and CSDs surrounding them (see, e.g., Miranda, Munoz, & Lai 2017 and Thun, Kley, & Picogna 2017) due to the absence of an imposed inner boundary.
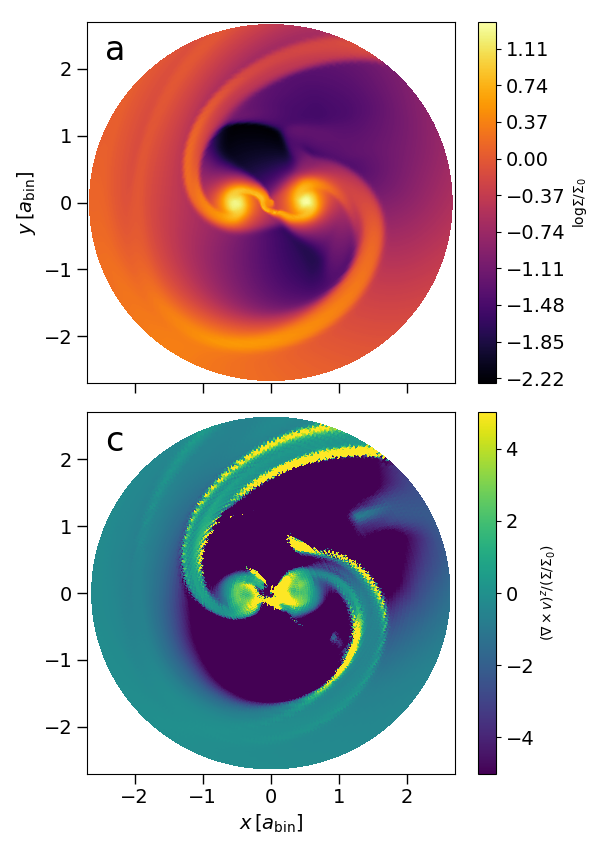
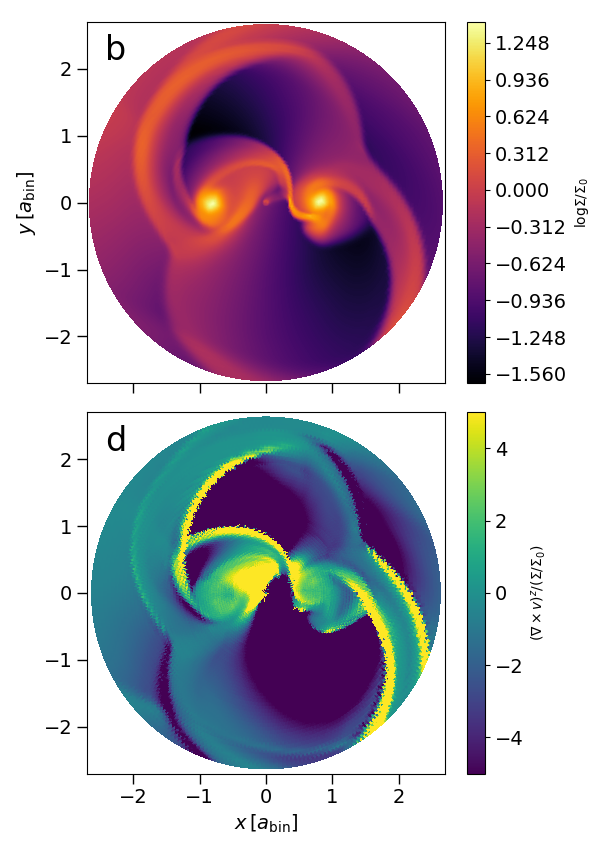
To quantify the differences in the description of the cavity as a function of eccentricity we define the area of the cavity as the area of all zones below a surface density of , where is the maximum density in the CSD. In Fig. 4, we show as a function of time for the binaries q1.0e0.0-q1.0e0.8. After an initial transient phase all binaries settle into a configuration where the does not change on longer timescales, but oscillates around a constant value on a timescale . There is a clear trend of increasing area of the cavity with increasing eccentricity. While the circular-orbit and low-eccentricity binaries q1.0e0.0 and q1.0e0.2, and the medium-eccentricity binary q1.0e0.4 show very similar dynamics, the high-eccentricity binaries q1.0e0.6 and q1.0e0.8 show a significantly increased area of the cavity. We note that we do not show radial profiles of surface density and the area of the cavity as a function of mass ratio as the overall values of these quantities only depend very weakly on in the parameter range we have explored (). One exception is the timescale of the variability of .
The increased amount of gas inside the cavity and the complicated flow dynamics for eccentric orbits raises the exciting possibility of the presence of detectable emission from shocked and unshocked material therein. In order to investigate this further we show the z-component of the potential vorticity in Fig. 5 (Li et al. 2005, Dong, Rafikov, & Stone 2011). We focus our attention on the non-eccentric binary q1.0e0.0 and the eccentric binary q1.0e0.6 and display a snapshot in time where the binary is close to apastron for the eccentric case. The snapshots correspond to panels (c) and (g) from Fig. 2. The top row shows surface density for comparison, while the bottom row shows . Large positive values of indicate highly compressed and potentially shocked material. Compressed/shocked material appears to be present in the accretion streams onto the CSDs for both the circular and eccentric orbit case. This traces out the spiral streams in the circular orbit case and the figure-eight-like structure in the eccentric case highlighting the possibility of using this feature as a potentially powerful observational probe of eccentricity.
4 Conclusions
Two-dimensional hydrodynamical simulations have been carried out to investigate the morphology of gas flows within the cavity region between a central binary and its CBD in eccentric systems. We find that the streams flowing from the CBD into the cavity are broad and can take the form of tightly wound streams or a figure-eight-like structure surrounding the binary for sufficiently eccentric systems (), with the specific pattern dependent on the orbital phase of the system. This is in contrast to the gas flows characteristic of a binary in a circular orbit or one of low eccentricity, in which relatively thin loosely bent streams directly flow from the CBD to the CSDs with the flow pattern varying little with orbital phase. We have shown that the gas in the cavity is likely to be shocked and, thus, observational strategies using molecular lines that are shock tracers are more likely to uncover these features.
It is worth asking whether the shock patterns observed in this study would be present in a fully three-dimensional calculation. Ultimately, 3D calculations will be necessary to answer this question completely, but it is reassuring that the characteristic size and shape of the shock structures consist of length scales significantly larger than the scale height, and therefore the expectation is that similar structures would be found in 3D, and in particular the figure-eight–like flow patterns would still be expected to emerge for sufficiently eccentric orbits.
Thus, the existence of the unique flow patterns in the cavity region could serve as a proxy to signify a modest to large eccentricity in the orbital motion of the binary stellar components. This imprint would serve as additional support for the inference for an eccentricity in the binary system in addition to the observations pointing to large disk gap sizes greater than about 1.7 times the orbital separation of the binary (Artymowicz & Lubow 1994).
Although there are orbital phases close to periastron in the case of an eccentric binary where the morphology of the gas flow in the cavity corresponds to two streams flowing directly from the CBD to the CSDs, similar to that in the case for circular orbit, the diversity of patterns represented throughout the bulk of the binary orbit indicate that the description of the morphology for binaries characterized by circular orbits does not necessarily transfer to binaries in eccentric orbits. Because of this result, the amount of matter in the cavity varies throughout the orbit with the tendency for a greater amount to exist in the cavity for binaries characterized by higher eccentricities. Due to the presence of this matter, the characterization of the CBD in terms of an inner radius becomes less well defined. We suggest that the area of the non-emitting region can be an alternative measure. Given a model for converting the gas surface density to the molecular emission, the flux observed from the CSDs can be used to define a threshold value for the detection/non-detection of emission/gas within the cavity as described in Fig. 4. As long as this threshold is chosen to be greater than the sensitivity for the instrumentational/observational setup it can be used to determine the area of the cavity as the region with emission below the threshold.
We have also identified the pattern of the gas flows as a specific diagnostic to probe the effect of orbital eccentricity, however, it is challenging to infer the eccentricity of the system since the orbital phase of the binary system for a given observation is unknown. In order to provide further information to place constraints on the eccentricity of the system from the structure of the gas flows alone, it is necessary to study the kinematics of the matter in the two streams. Toward this end, detailed comparisons between observations and theory would be more meaningful if theoretical data cubes were used to produce synthetic observations taking into account the detector and telescope simulator for interferometric observations. Future observational studies are encouraged to carry out high-sensitivity spectral observations at high spatial resolution to provide a further understanding of the gas flows in these binary systems in their earliest stages of evolution.
Acknowledgements
P.M. and R.E.T. would like to thank Ya-Wen Tang and Ann Dutrey for stimulating discussions all throughout the process of this work. P.M. thanks Daniel D’Orazio for discussions regarding eccentric binaries in Disco and analysis of output data. P.M. acknowledges support by NASA through Einstein Fellowship grant PF5-160140. R.E.T. acknowledges support from the Theoretical Institute for Advanced Research in Astrophysics in the Academia Sinica Institute of Astronomy & Astrophysics. P.D. acknowledges support from the Institute for Theory and Computation at the Harvard-Smithsonian Center for Astrophysics. Numerical calculations were carried out at the UC Berkeley BRC cluster savio.
References
- Artymowicz1994 (1994) Artymowicz, P., & Lubow, S. H. 1994, ApJ, 421, 651
- Artymowicz1996 (1996) Artymowicz, P., & Lubow, S. H. 1996, ApJ, 467, L77
- deVal-Borro2011 (2011) de Val-Borro, M., Gahm, G. F., Stempels, H. C., Peplinski, A., 2011, MNRAS, 413, 2679
- Dong (2011) Dong, R., Rafikov, R. R.,& Stone, J. M. 2011, ApJ, 741, 57
- Duffell (2016) Duffell, P. C. 2016, ApJS, 226, 2
- Duffell (2012) Duffell, P. C., & MacFadyen, A. I. 2012, ApJ, 755, 7
- Dutrey (2016) Dutrey, A., Di Folco, E., Beck, T., & Guilloteau, S. 2016 A & A Rev, 24, 5
- Farris (2014) Farris, B. D., Duffell, P. C., MacFadyen, A. I. & Haiman, Z. 2014, ApJ, 783, 134
- Gunther (2002) Gunther, R., & Kley, W. 2002, A&A, 387, 550
- Hanawa (2010) Hanawa, T., Ochi, Y., & Ondo, K. 2010, ApJ, 708, 485
- Li (2005) Li, S., Koller, J., Wendroff, B. B., Liska, R., Orban, C. M., Liang, E. P. T.,& Lin, D. N. C., 2005, ApJ, 624, 1003
- Lubow (1997) Lubow, S. H., & Artymowicz, P. 1997, IAU Colloquium 163 ed. D. T. Wickramasinghe, G. V. Bicknell, and L. Ferrario, Astronomical Society of the Pacific, Conf. Series, 121, 505
- Miranda (2017) Miranda, R., Munoz, D., & Lai, D. 2017, MNRAS, 466, 1170
- Munoz (2018) Munoz, D., Miranda, R. & Lai, D. 2019, ApJ, 871, 84
- Takakuwa (2017) Takakuwa, S., Saigo, K., Matsumoto, T. et al. 2017, ApJ, 837, 86
- Takakuwa (2014) Takakuwa, S., Saito, M., Saigo, K. et al. 2014, ApJ, 796, 1
- Tang (2014) Tang, Y.-W., Dutrey, A., Guilloteau, S. et al. 2014, ApJ, 793, 10
- Tang (2018) Tang, Y., Haiman, Z., & MacFayden, A. 2018, MNRAS, 476, 2249
- Thun (2017) Thun, D., Kley, W.,& Picogna, G. 2017, A & A, 604, 102