Thermopower of a Two-Dimensional Semimetal in a HgTe Quantum Well
Abstract
The thermopower in a two-dimensional semimetal existing in HgTe quantum wells 18 21 nm thick has been studied experimentally and theoretically for the first time. It has been found theoretically and experimentally that the thermopower has two components diffusion and phonon-drag and that the second component is several times larger than the first. It has been concluded that the electron hole scattering plays an important role in both mechanisms of the thermopower.
pacs:
73.43.Fj, 73.23.-b, 85.75.-dA two-dimensional semimetal appearing in HgTe quantum wells 18 21 nm thick [1, 2] currently attracts permanent interest because it is a two-component electron hole system with a number of unusual properties [3 12] caused by the coexistence of electrons and holes. One of these properties is electron hole scattering through the Landau mechanism, which is responsible for a strong temperature dependence of the resistance of a two-dimensional semimetal, in contrast to a single-component system. It is obviously important to comprehensively study kinetic effects in this system.
In this work, we report the first experimental study of the thermopower of a two-dimensional semimetal. The comparison of the experiment with the theoretically predicted diffusion contribution to the thermopower in the presence of electron hole scattering shows that this contribution underestimates the thermopower. Consequently, it is necessary to take into account another possible contribution to the thermopower from phonon drag of electrons and holes.
We studied -mm rectangular samples whose middle parts contain Hall bars with m and segments based on wide HgTe quantum wells 20 nm thick with the (013) orientation. The thermopower was measured as follows. A heater in the form of a thin metallic strip with the resistance was placed on one side of a sample against one of the electric contacts (see the inset of Fig. 1b). The opposite end of the sample through a deposited indium layer was in thermal contact with a copper thermal anchor, which was in turn in contact with a massive copper holder of the sample. To create a temperature gradient along the sample, an alternating current with a frequency of 0.4 1 Hz and a magnitude of no more than 60 mA was passed through the metallic strip (heater). The heater operated in a linear regime in the indicated current range. The temperature gradient appearing along the sample was controlled using two calibrated thermistors placed on the sides of the heater and thermal anchor. In particular, the temperature difference thus determined between contacts spaced from each other by a distance of 100 was K at T=4.2 K and 6 V. The thermal conductivity of liquid helium in the working temperature range ( K) was negligibly low as compared to the phonon thermal conductivity of the substrate. Under these conditions, the thermal conductivity of the substrate determines the temperature gradient along the sample. The thermopower signal was measured at the double frequency with the use of all potentiometric contacts. We studied about ten samples.

We begin the description of the experiment with the analysis of the transport response of the studied samples. Figure 1 shows typical dependences of the resistance on the gate voltage at different temperatures. It is seen that these dependences correspond to the behavior expected for 20-nm HgTe quantum wells where a (two-dimensional metal two-dimensional semimetal) transition occurs at the variation of the gate voltage [2, 13]. This transition is accompanied by a sharp change in the temperature dependence of the resistance: this dependence is very weak before the transition and represents a typical temperature dependence of a two-dimensional metal at ( and - are the wave vector and mean free path of the electron) and low temperatures when the phonon Seebeck coefficient is almost absent and the temperature dependence is determined by weak-localization effects, whereas a noticeable increase in the resistance with the temperature is observed after the transition to the semimetal state, which is due to electron hole scattering and is thereby proportional to the temperature squared (Fig. 1b).
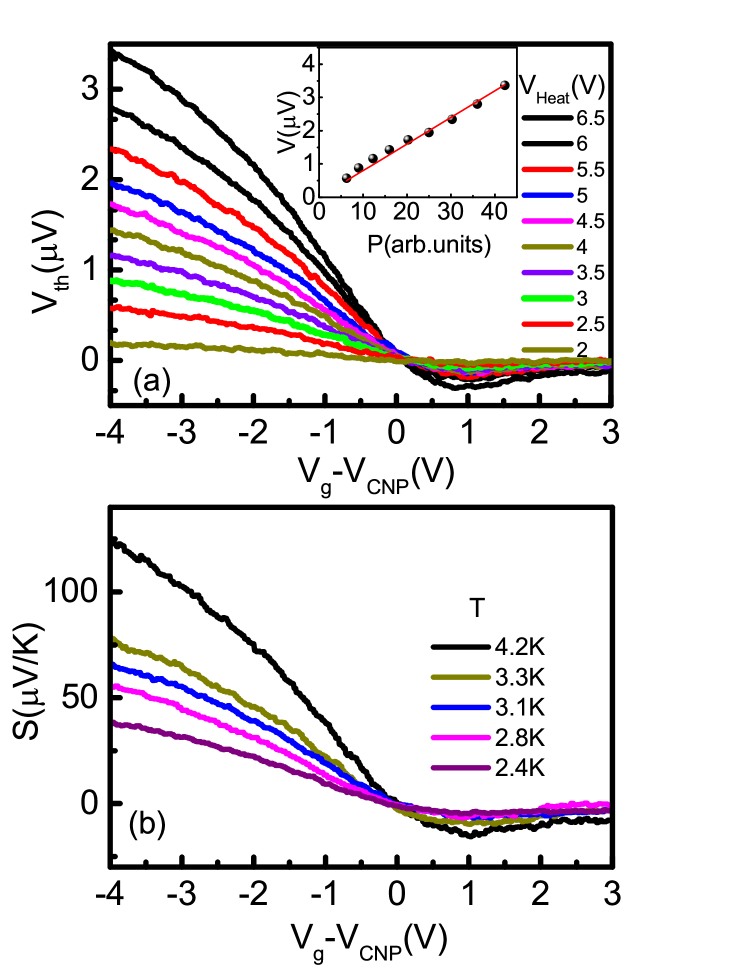
Figure 2a shows the gate voltage dependences of the temperature-gradient-induced potential difference between the potentiometric contacts of the bar with the length . The inset of this figure shows the dependence of the thermopower signal on the power applied to the heater. It is clearly seen that the measured signal is proportional to this power, which indirectly indicates that the measured signal is indeed due to the thermopower rather than possible pickups. We now qualitatively analyze the behavior of the thermopower shown in Fig. 2a. We begin with the dependence on the gate voltage. At gate voltages corresponding to the electron metal, the thermopower is relatively low and decreases with an increase in the density according to the Mott formula for the thermopower of metals. The thermopower changes sign near the transition point and begins to increase almost linearly with the development of the semimetal state (with an increase in the density of holes). Figure 2b shows the gate voltage dependences of the Seebeck coefficient is the temperature difference between potential contacts on which the signal is measured) at different temperatures. It is seen that the Seebeck coefficient increases with the temperature of the sample.
To more accurately describe the experimental results obtained in this work, we developed a theory of the diffusion component of the thermopower for a two-dimensional electron hole system consisting of two types of degenerate particles, electrons and holes. In the presence of the temperature gradient, chemical potential, and electron hole friction, the average velocities in the subsystems satisfy the equation
| (1) | |||||
Here, the subscript specifies quantities referring to electrons (e) and holes (h); () is the density of electrons (holes); is the number of valleys (); , and are the average velocity, effective mass, and charge of particles of type ( , e is the charge of the hole), respectively; is the relaxation transport time on impurities; is the friction coefficient; and T is the temperature in energy units. The friction coefficient is determined by electron hole scattering through the Landau mechanism. Equation (1) is a generalization of equations presented in [10, 11] to the case of the existence of a temperature gradient.
From the condition that the total current density vanishes, the Seebeck coefficient is obtained in the form
| (2) |
It is noteworthy that the contribution to the current from any type of charge carriers in Eq. (2) is nonzero even at zero carrier density; i.e., this formula does not have any monopolar limit:
| (3) |
In contrast to Eq. (2), Eq. (3) does not include terms corresponding to the second type of carriers, in particular, its relaxation time and friction. The reason for this between formulas (2) and (3) are different because they are obtained under the assumption that Fermi gases are degenerate. Indeed, the transition to the monopolar case at low temperatures occurs in a relatively narrow range of the chemical potential . The friction between different types of carriers distorts the linear temperature dependence of S. In the low-temperature limit, , which leads to third-order temperature corrections to the linear dependence.
The friction can become a prevailing mechanism of scattering ( ) at higher temperatures. In this case, Eq. (2) becomes independent of all relaxation constants:
| (4) |
This formula is valid far from the charge neutrality point (CNP). The Seebeck coefficient S changes sign near this point (more precisely, at the point where the numerator of Eq. (2) changes sign). The Seebeck coefficient in the region of applicability of Eq. (4) also has a linear temperature dependence similar to that at low temperatures but with a larger slope. As a result, the dependence can be close to a quadratic law in the intermediate temperature range.
Figure 3a shows the Seebeck coefficients calculated by Eqs. (2) and (3) in comparison with experimental data. All parameters necessary for the calculation by Eqs. (2) and (3) (mobilities and densities of electrons and holes and the friction coefficient) and their dependence on the gate voltage were obtained previously from transport measurements [11] and from the cyclotron resonance (effective masses of electrons and holes) [14]. The temperature gradient necessary for the determination of the Seebeck coefficient was measured experimentally according to the method described at the beginning of this paper. Thus, the comparison of the theory and experiment in Fig. 3a is free of fitting parameters.
The qualitative behavior of the Seebeck coefficient to the right of the charge neutrality point, where the electron metal exists, corresponds to the Mott theory for metals, which predicts a decrease in the Seebeck coefficient with an increase in the carrier density. For comparison with experimental data in this range of gate voltages, we used the monopolar formula (3) for electrons, which is the Mott formula under the assumption that ( is the pulse relaxation time and is the energy). As is seen, the Seebeck coefficients calculated by Eq. (3) are in satisfactory agreement with experimental points (Fig. 3a).
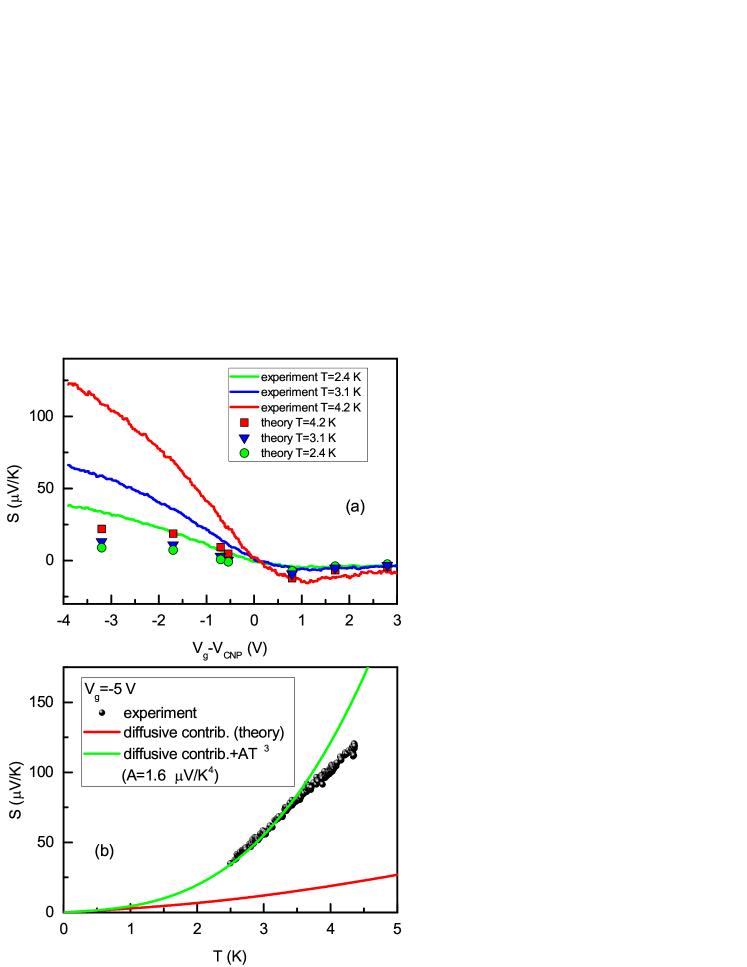
On the contrary, to the left of the charge neutrality point in Fig. 3a, i.e., in the region of gate voltages corresponding to the formation of the two-dimensional semimetal, agreement between the experiment and theory (Eq. (2)) is much worse. In this range of gate voltages, the theory gives Seebeck coefficients about one-fourth of experimental values (see Fig. 3a). This discrepancy apparently appears because Eq. (2) describes only the diffusion contribution to the thermopower of the semimetal. However, the measured thermopower can include not only the diffusion contribution but also the phonon drag contribution [15], which is disregarded in our theory. As is known, the phonon drag is proportional to the mass squared of charge carriers. The masses of electrons and holes in the 20-nm HgTe quantum well are and , respectively. For this reason, the phonon drag contribution on the left of the charge neutrality point (i.e., in the region where holes dominate) is significant, whereas this contribution on the right of the charge neutrality point, where the two-dimensional metal exists, is negligible.
Figure 3b shows the experimental points for the temperature dependence of the Seebeck coefficient at . It is seen that the experimental data are significantly higher than the corresponding diffusion contribution calculated by Eq. (2) shown by the lower red line in Fig. 3b. It can be assumed that the difference between the shown experimental and calculated dependences corresponds to the contribution to the Seebeck coefficient from phonon drag in the twodimensional semimetal under the condition of dominance of holes. As an example of phonon drag in an ordinary two-dimensional metal, we consider the contribution [15]. Through the experimental points in Fig. 3b, we plot the upper green line representing the sum of the diffusion contribution and the function (). It is seen that this line reproduces well the experimental data in the range of 2.5 3.5 K, but a discrepancy is observed at higher temperatures, where the experimental points are below the calculated curve. This discrepancy can be attributed to the scattering of phonon-dragged holes by electrons, which is enhanced with increasing temperature, reducing the measured Seebeck coefficient. However, for a more definite conclusion, it is necessary to develop a theory of phonon drag in the twodimensional semimetal in the presence of electron hole scattering.
To summarize, experimental information on the behavior of the thermopower in a two-dimensional semimetal has been obtained for the first time. A theory of the diffusion component of the thermopower in the two-dimensional semimetal in the presence of electron hole scattering has been developed. This theory underestimates the experimentally observed Seebeck coefficients. This discrepancy indicates the necessity of the inclusion of the electron phonon drag in the two-dimensional semimetal in the presence of the electron hole scattering.
This work was supported by the Russian Science Foundation (project no. 16-12-10041). The work of L.I.M. and M.V.E. was supported by the Russian Foundation for Basic Research (project no. 17-02- 00837).
References
- (1) Z. D. Kvon, E. B. Olshanetsky, D. A. Kozlov, N. N. Mikhailov, and S. A. Dvoretskii, JETP Lett. 87, 502 (2008).
- (2) E. B. Olshanetsky, Z. D. Kvon, M. V. Entin, L. I. Magarill, N. N. Mikhailov, and S. A. Dvoretsky, JETP Lett. 89, 290 (2009).
- (3) G. M. Gusev, E. B. Olshanetsky, Z. D. Kvon, N. N. Mikhailov, S. A. Dvoretsky, and J. C. Portal, Phys. Rev. Lett. 104, 166401 (2010).
- (4) G. M. Gusev, E. B. Olshanetsky, Z. D. Kvon, A. D. Levin, N. N. Mikhailov, S. A. Dvoretsky, and J. C. Portal, Phys. Rev. Lett. 108, 226804 (2012).
- (5) O. E. Raichev, G. M. Gusev, E. B. Olshanetsky, Z.D.Kvon, N. N. Mikhailov, S. A. Dvoretsky, and J. C. Portal, Phys. Rev. B 86, 155320 (2012).
- (6) G. M. Minkov, A. V. Germanenko, O. E. Rut, A. A. Sherstobitov, S. A. Dvoretski, and N. N. Mikhailov, Phys. Rev. B 88, 155306 (2013).
- (7) E. B. Olshanetsky, Z. D. Kvon, Ya. A. Gerasimenko, V. A. Prudkoglyad, V. M. Pudalov, N. N. Mikhailov, and S. A. Dvoretsky, JETP Lett. 98, 843 (2013).
- (8) M. Knap, J. D. Sau, B. I. Halperin, and E. Demler, Phys. Rev. Lett. 113, 186801 (2014).
- (9) P. S. Alekseev, A. P. Dmitriev, I. V. Gornyi, V. Yu. Kachorovskii, B. N. Narozhny, M. Schutt, and M. Titov, Phys. Rev. Lett. 114, 156601 (2015).
- (10) V. F. Gantmakher and I. B. Levinson, Sov. Phys. JETP 47, 133 (1978).
- (11) M. V. Entin, L. I. Magarill, E. B. Olshanetsky, Z. D. Kvon, N. N. Mikhailov, and S. A. Dvoretsky, J. Exp. Theor. Phys. 117, 933 (2013).
- (12) A. Kononov, S. V. Egorov, Z. D. Kvon, N. N. Mikhailov, S. A. Dvoretsky, and E. V. Deviatov, Phys. Rev. B 93, 041303(R) (2016).
- (13) E. B. Olshanetsky, Z. D. Kvon, N. N. Mikhailov, E. G. Novik, I. O. Parm, and S. A. Dvoretsky, Solid State Commun. 152, 265 (2012).
- (14) D. A. Kozlov, Z. D. Kvon, N. N. Mikhailov, S. A. Dvoretskii, and J. C. Portal, JETP Lett. 93, 170 (2011).
- (15) N. V. Zavaritskii and Z. D. Kvon, JETP Lett. 38, 97 (1983).