Luminous AGB variables in the dwarf Irregular Galaxy, NGC 3109
Abstract
In a shallow near-infrared survey of the dwarf Irregular galaxy, NGC 3109, near the periphery of the Local Group, we have found eight Mira variables, seven of which appear to be oxygen-rich (O-Miras). The periods range from about 430 days to almost 1500 days. Because of our relatively bright limiting magnitude, only 45 of the more than 400 known carbon stars were measured, but none was found to be a large amplitude variable. One of the Miras may be an unrecognised C star. Five of the O-Miras are probably hot-bottom burning stars considering that they are brighter than expected from the period–luminosity relation of Miras and that, by comparison with theoretical evolutionary tracks, they appear to have masses . A census of very long period ( days) Miras in the Galaxy and Magellanic Clouds is presented and discussed together with the newly discovered long period, but relatively blue, variables in NGC 3109. New photometry is presented for three O-rich long period Miras in the SMC (including a candidate super-AGB star).
keywords:
stars: AGB and post-AGB–galaxies: individual: NGC 3109–Local Group–stars: variables: general–infrared: stars1 Introduction
NGC 3109 is a small galaxy, classified as SB(s)m (de Vaucouleurs et al., 1991) or dIrr (McConnachie, 2012) that is associated with a group of dwarf irregular galaxies including Sextans A, Sextans B, Antlia and possibly Leo P. NGC 3109 is outside the virial radius of the Local Group and is probably not bound to it, though it may have been near the Milky Way about 7 – 9 Gyr ago (Pawlowski & McGaugh, 2014). It was nevertheless included in our infrared search at SAAO for long period variables in the Local Group (see e.g. Menzies et al., 2015).
Based on the colour of the red giant branch (RGB) (Hidalgo et al., 2008), the metallicity is very low, . Nevertheless, a spectroscopic study of blue supergiants and Hii regions in NGC 3109 (Evans et al., 2007; Hosek et al., 2014; Tramper et al., 2014) results in a metallicity that is significantly higher, . Peña et al. (2007) find for Hii regions, in good agreement with that found by Evans et al. (2007), and suggest that the current interstellar medium in NGC 3109 is chemically very homogeneous. Thus the young component of NGC 3109 has an O/H ratio about half that of the SMC.
There have been many determinations of distance, which are summarised by Soszyński et al. (2006). We use the modulus, , in this paper. The reddening is small, , with about half of this being ascribed to position-dependent internal reddening (Soszyński et al., 2006). We ignore reddening in the near infrared in the following discussion.
The galaxy is gas-rich, with an extensive Hi envelope (Jobin & Carignan, 1990; Carignan et al., 2013). The Hi is warped in the outer disk towards the neighbouring Antlia galaxy to the south-west suggesting an interaction in the past, though not at present (Carignan et al., 2013); the disk is seen almost edge-on with an inclination of 75°. The rotation curve is consistent with a dark-matter halo that dominates at all radii. Demers et al. (2003) found more than 400 C stars in the galaxy, mostly confined to the plane of the disk, and there does not appear to be an extensive halo. They find a C/M ratio of 1.75, typical for a metal-poor galaxy such as this (see e.g. Cioni, 2009).
The present investigation extends our study of AGB variables in the Local Group, which to date has covered dwarf spheroidals (Leo I: (Menzies et al., 2010), Fornax: (Whitelock et al., 2009), Sculptor: (Menzies et al., 2011)) and dwarf irregulars (NGC 6822: (Whitelock et al., 2013), IC 1613: (Menzies et al., 2015), Sgr DIG: (Whitelock et al., 2018)). Our project is to investigate AGB variables in different environments with two primary aims: first, to test models of AGB evolution (e.g. Marigo et al., 2017), and secondly to investigate how well Miras can be used as fundamental distance indicators. Short period Miras, which occur in Galactic globular clusters (e.g. Feast et al., 2002) are reasonably well understood and are proving to be useful distance indicators (e.g. Whitelock et al., 2008a; Whitelock & Feast, 2014; Huang et al., 2018; Yuan et al., 2018), that will be particularly important in the JWST era, because they are bright infrared sources.
Miras with periods significantly over 400 days, which have more massive progenitors, remain very poorly understood. These are often strong mid-infrared sources (Riebel et al., 2015; Whitelock, 2017; Boyer et al., 2017, and references therein) and are important in terms of the global dust budget for galaxies. Some of these undergo hot bottom burning (HBB) (Whitelock et al., 2003), but how this depends on their environment remains poorly defined. Of particular current interest is the upper mass limit for AGB stars, understood to be in the range (Karakas et al., 2017), that determines which stars become supernovae and which end their lives as white dwarfs. The input physics is uncertain, so models differ significantly from one to another. Observations have yet to isolate a definite example, but the best candidates are the very luminous, large amplitude, long-period variables of the type we investigate here.
Given the distance to NGC 3109, we are only sensitive to the brightest variables, so our objective in the present study is to investigate the most massive of the AGB variables. A deeper survey is required to get a complete sample.
2 Observations
Our observations were made with the SIRIUS camera on the Japanese-SAAO IRSF telescope at Sutherland. The camera produces simultaneous and images covering a 7.27.2 arcmin square field with a scale of 0.45 arcsec/pixel. NGC 3109 is extended in approximately the east-west direction and it was necessary to use 3 pointings to cover the bulk of the galaxy. These were centred at (2000.0)=10:03:06.8, (2000.0)=–26:09:31.9, (field 1), and displaced by arcmin (fields 2 and 3, respectively) in RA. The aim of this observational series was to find long-period variables; observations were made at 17 epochs spread over a little more than 3 years. For each of the 3 fields, 10 dithered images were combined after flatfielding and dark and sky subtraction. Typical exposures were of either 20 or 30 seconds’ duration, depending on the seeing and on the brightness of the sky in the band, and typically 50 or 30 exposures, respectively, were combined to produce the final images. Photometry was performed using dophot in ‘fixed-position’ mode, using the best-seeing -band image as a template. Aladin (Bonnarel et al., 2000) was used to correct the WCS on each template and RA and Dec were determined for each measured star. This allowed a cross-correlation to be made with the 2MASS catalogue, and photometric zero points were determined by comparison of our photometry with that of 2MASS. With at least 24, mostly foreground, stars in the range mag, in common in each field, the standard errors of the zero points in the three filters are mag.
3 Colour-Magnitude and Colour-Colour Diagrams
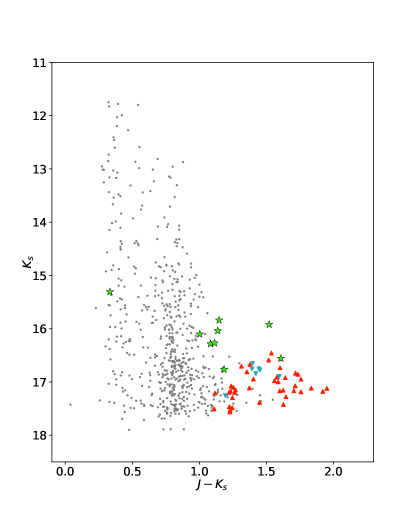
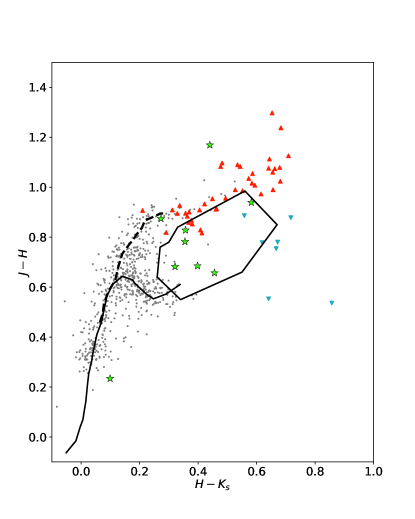
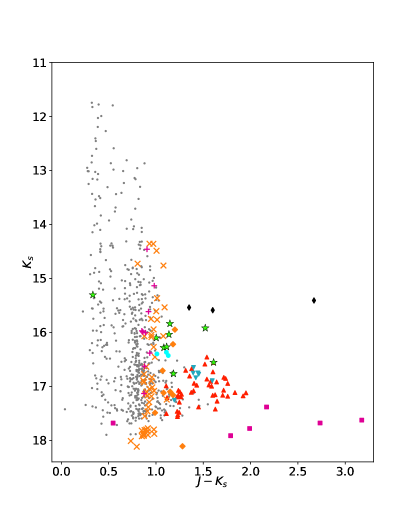
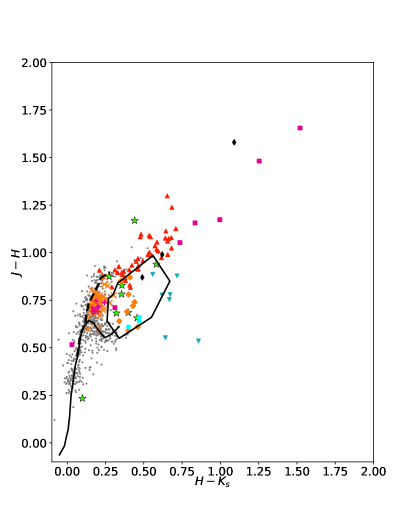
Fig. 1 shows the and diagrams. The variables and C stars are highlighted. In the two-colour diagram, the box outline, or ‘Mira coffin’ (Feast et al., 1984), shows the region where O-rich Miras in the Galaxy are found (the original coordinates of the box edges were on the SAAO system and have been transformed to the 2MASS system for this diagram using relations in Carpenter (2001)). The box is displaced with respect to the locus of normal giants in both and due to the dominance of H2O absorption in the near infrared. Galactic carbon-rich stars (including Miras), with little or no water absorption, fall along the upper left edge of the box, and extend it to larger and when they experience significant circumstellar reddening (Feast et al., 1982). Six of the newly-discovered Miras fall in the box.
Of the more than 400 C stars found in the galaxy by Demers et al. (2003) only 45 appear in our photometric catalogue because of our relatively bright limiting magnitude. A colour-magnitude diagram published by Górski et al. (2011) shows that the bulk of the C stars must be about one magnitude fainter than our observing limit.
 |
 |
3.1 Separation of Field and Member stars
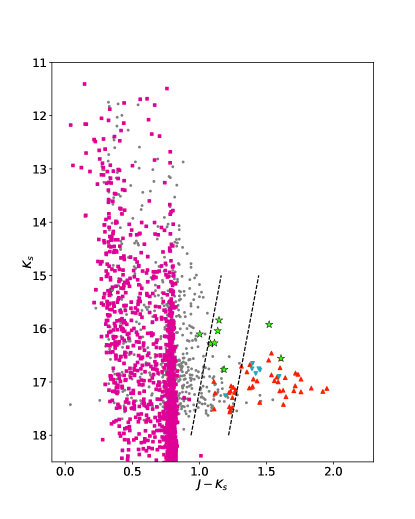
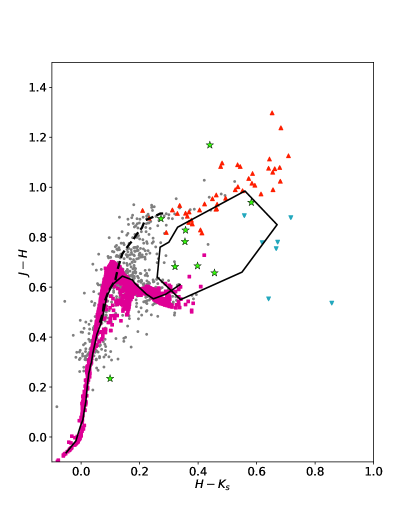
From the distribution of stars in the two diagrams, it seems clear that there are many field stars present. It is instructive to compare these diagrams with what is expected in the field based on a trilegal (Girardi et al., 2005) simulation for the same area as our photometry covers. This is shown in Fig. 2, where the trilegal points are shown in magenta superposed on our diagrams. It should be noted that no observational errors have been applied to the trilegal data.
 |
 |
It appears that, in our sample of the NGC 3109 field, unambiguous members lie to the red of . Thus, as expected, our survey is very shallow and comprises mostly the late-type giants on the AGB and supergiants (if present). The same conclusion could be reached by making and cuts in the two-colour diagram to isolate the obvious field dwarf and giant sequences.
4 Variable Stars
As stated earlier, the purpose of our study was to search for and characterise long period variables in NGC 3109. We have discovered nine large amplitude variables – eight are apparently Miras, while one is unusual, being blue and having a peculiar light curve as discussed in section 4.2.
4.1 Variables found in our catalogue
| Name | RA | Dec | Period | BC | mbol | note | |||||||
|---|---|---|---|---|---|---|---|---|---|---|---|---|---|
| (2000.0) | day | – mag– | |||||||||||
| 1067 | 150.73837 | -26.14197 | 591 | 0.88 | 1.22 | 1.00 | 16.102 | 0.682 | 0.321 | 1.003 | 3.20 | 19.30 | |
| 1112 | 150.80582 | -26.15483 | 583 | 0.49 | 0.59 | 0.62 | 16.039 | 0.782 | 0.355 | 1.137 | 3.20 | 19.24 | |
| 1153 | 150.75345 | -26.17370 | 678 | 0.91 | 0.97 | 0.93 | 16.284 | 0.685 | 0.398 | 1.083 | 3.20 | 19.48 | |
| 1224 | 150.82961 | -26.14808 | 680 | 0.73 | 0.85 | 0.74 | 16.269 | 0.657 | 0.456 | 1.113 | 3.20 | 19.47 | |
| 2075 | 150.91414 | -26.17125 | 1109 | 1.69 | 1.34 | 1.34 | 16.556 | 1.169 | 0.440 | 1.609 | 3.19 | 19.74 | |
| 2081 | 150.86487 | -26.15757 | 434 | 0.71 | 0.74 | 0.60 | 16.766 | 0.828 | 0.357 | 1.185 | 3.20 | 19.97 | |
| 3064 | 150.65652 | -26.14415 | 562 | 0.37 | 0.42 | 0.47 | 15.839 | 0.874 | 0.273 | 1.147 | 3.20 | 19.04 | |
| 3089 | 150.59729 | -26.17039 | 1486 | 1.24 | 1.18 | 0.98 | 15.921 | 0.939 | 0.582 | 1.521 | 3.19 | 19.11 | a |
| 1060 | 150.75887 | -26.14944 | 276 | 0.08 | 0.10 | 0.03 | 15.306 | 0.234 | 0.099 | 0.333 | – | – | b |
-
a
period about the same as the length of the data train.
-
b
Period and amplitudes after removal of linear trend. See text in section 4.2.
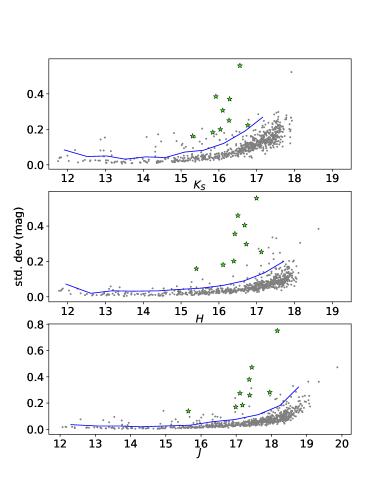
Median standard deviations were determined at half-magnitude intervals for each of the wavebands represented in Fig. 3. Lines were drawn at twice these median values (see the figure) and a star was considered variable if for all of , and its standard deviation lay above the relevant line. We used Lomb-Scargle periodograms to find possible periods. Because the data points are not well distributed in time and for some objects are relatively noisy, we found that the best results were obtained by adopting the multiband periodogram approach of VanderPlas & Ivezić (2015) whereby all 3 wavebands are fitted simultaneously. The stars for which we found periods are shown as asterisks in Fig. 3, where we plot standard deviation against magnitude for our catalogue. The stars with similarly large standard deviations may be variable but are either not periodic or may actually be marginally resolved background galaxies that appear to vary because of seeing fluctuations from image to image.
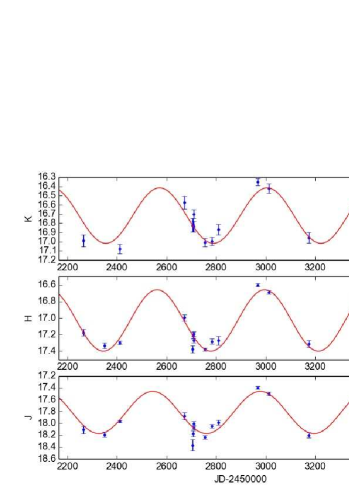
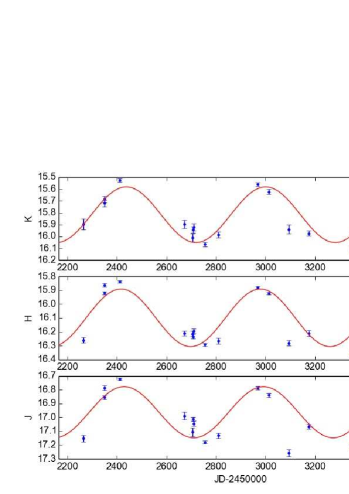
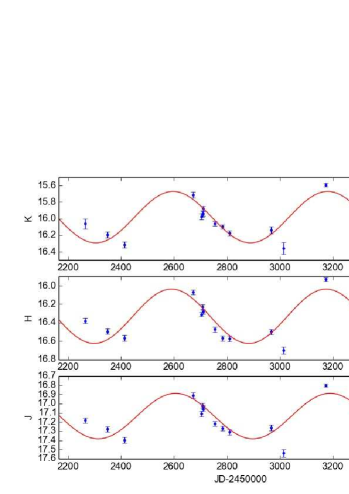
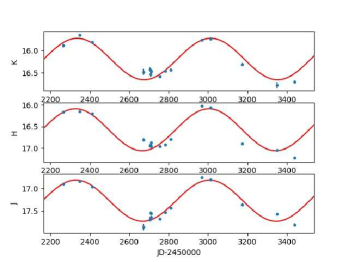
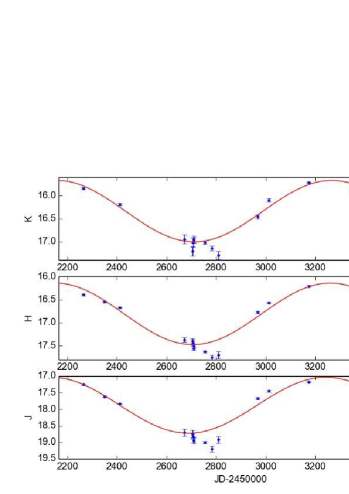
The light curves of the eight periodic variables of the eight periodic variables are shown in Fig. 4 with single-period sinusoids overplotted on the observations. Mean magnitudes estimated from the lightcurve fits are listed, together with the derived periods and peak-to-valley amplitudes (), in Table 1.
 |
 |
| (a) 2081 (434 d) | (b) 3064 (562 d) |
 |
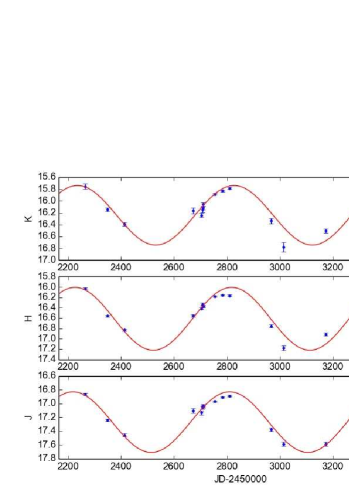 |
| (c) 1112 (583 d) | (d) 1067 (591 d) |
 |
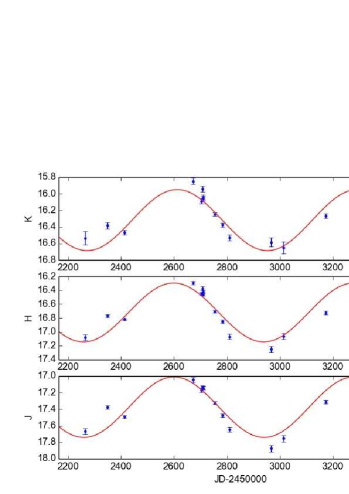 |
| (e) 1153 (678 d) | (f) 1224 (680 d) |
 |
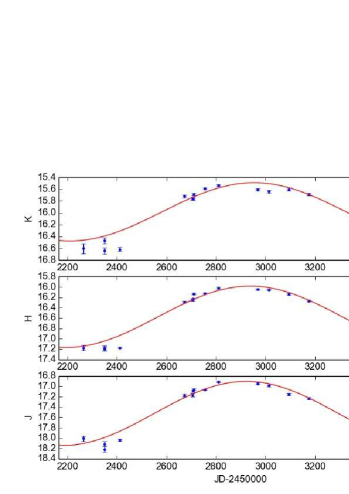 |
| (g) 2075 (1109 d) | (h) 3089 (1486 d) |
4.2 Variable object #1060
In the case of object #1060, the light curves show a steadily brightening trend with time. The , , magnitudes changed by and , respectively, over the period covered by our data. After linear slopes were removed, the period-finding program found a period of 276 day would fit the data, though the data are consistent with no variation. The data for this object are shown in Fig. 5, together with the fitted two-component lightcurves.
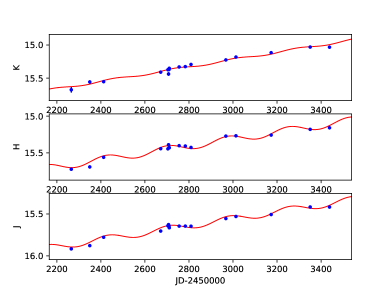
This variable is clearly blue on the basis of our photometry (). It is very close to the position of the 2MASS object, 2MASS_J10030205–2608575, which is distinctly redder and fainter (2MASS: ), though the 2MASS errors are relatively large. The 2MASS star is identified as a red supergiant by Davidge (2018).
An object at the position of #1060 was found in the Catalina survey to be variable, where it is designated SSS_J100302.1–260857, and is classified there as type VAR with a V magnitude range of 14.5 to 16.5. It appears in the Pan-STARRS1 survey DR1 (Chambers et al., 2016) as PSO J150.75885–26.1494 where it has clearly blue colours at epoch JD2456096.5, but is flagged as extended.
Our measurement appears to refer to the combined light of the red supergiant and another object. The 276-day variation might be due to the supergiant, but assuming that to have not varied since the epoch of the 2MASS measurement, the contribution of the second object at our mid observational epoch would have been (, , , ) but the 2MASS errors are too large to attach any real significance to this result, save to say that the object is bluer than the supergiant. Taken at face value these colours suggest a significant emission line flux from the blue object.
In the ACS Nearby Galaxy Survey Treasury images of NGC 3109 (Holtzman et al., 2006), there is an object about 1.15 arcsec north-east of the supergiant; it is object #12829 in Field 3, which is clearly blue with , corresponding to . Our mean epoch of observation was JD2452801, whereas that of the HST observation was JD2454411, so the object continued to be blue for some years after our observations. It could possibly be a background quasar or AGN that has undergone a long-lived outburst.
4.3 C stars
Intrinsic carbon stars form following third dredge-up (3DUP) when sufficient carbon reaches the stellar surface to change the surface chemistry from C/O 1 to C/O 1 and therefore to change the dominant molecules from etc to CN, CH, etc. (note that CO is always present and uses up most of either C (in O-rich stars) or O (in C-rich) stars). The amount of 3DUP depends on the mass and metallicity of the star, and the amount of 3DUP required to change the surface chemistry depends on the initial oxygen abundance, as the more oxygen initially present the more carbon is required to move the ratio to C/O 1. The relative numbers of C- and O-rich AGB stars is theoretically a sensitive probe of mass and metallicity (see, e.g. Marigo et al., 2017, fig. 10), although it has yet to be calibrated against observations over large ranges of these quantities.
The relative numbers of C stars and M stars is often used as a proxy for metallicity and methods such as that devised by Cioni et al. (2006) are used to establish the region in a colour-magnitude diagram (e.g. Jones et al., 2018) where the O- and C-rich stars should be expected. This is illustrated in Fig. 2 where the area in which O-rich stars are anticipated at is shown as parallel dashed lines (Cioni et al., 2006). This is a representative metallicity for the AGB stars in NGC 3109 (see Fig. 8); a change of 0.5 in [Fe/H] moves the lines by in . O-rich stars should fall between these lines, while C stars should fall to the right. Note that if this method was used on NGC 3109 then almost one third of the C-stars we observed would have been classified as O-rich. Thus this is not an effective way of isolating C stars in galaxies that are significantly different from the Magellanic Clouds, where the method was calibrated. In contrast, the Marigo models discussed in section 6 fit our observations of C stars rather well.
None of our variables matches any star in the C star list of Demers et al. (2003). None of the 45 C stars in this list that we have measured is a large amplitude variable. Our limiting magnitude is rather bright, being set by the faintest measurable stars on the reference image, so we have missed most of the C stars in our field. Close inspection of the images showed that a further 172 C stars were visible on at least 10 frames. We used Sextractor (Bertin & Arnouts, 1996) to measure these stars on as many frames as possible. The precision of the photometry is low ( mag per point), but we found no evidence for large amplitude variability. On the other hand, as suggested later in section 5, variable star #2075 may be an unrecognised C star (see section 5).
4.4 Comparison with NGC 6822, WLM, IC 1613 and the SMC
It is instructive to compare the variables in NGC 3109 with those in other dwarf irregular galaxies, namely, NGC 6822, WLM, IC 1613 and the SMC. In Fig. 6 we have added our photometry for the red supergiants from Levesque & Massey (2012) and for the O-Miras from Whitelock et al. (2013) in NGC 6822, our unpublished data for the red supergiants (Levesque & Massey, 2012) and newly discovered variables in WLM (Menzies, in preparation), as well as for the four O-rich Miras in IC 1613 (Menzies et al., 2015). We have corrected the NGC 6822 data for the differential distance modulus of 2.03 mag and an assumed reddening for that galaxy of E() = 0.13 mag. For WLM and IC 1613, where the reddening is negligible, the magnitudes have been adjusted downward by 0.7 and 1.42 mag, respectively. Data for the SMC variables are taken from the discussion in section 6. The five variables in NGC 3109 with periods between 430 and 680 days lie to the red of the supergiants in the colour-magnitude and two-colour diagrams. They occupy the same regions as do the HBB Miras in NGC 68222 and IC 1613.
 |
 |
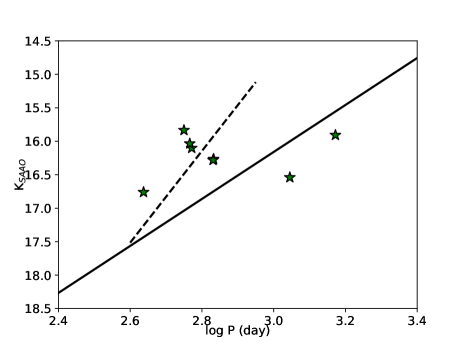
4.5 Period-Luminosity Relations
The log period-apparent luminosity diagram based on the data from Table 1 is compared with the PL relation for the LMC (Whitelock et al., 2008b) shifted from a distance modulus of 18.5 to our assumed value of 25.6 for NGC 3109 is shown in Fig. 7. The linear relation was established by Whitelock et al. (2008b) for log P 2.6 and is extrapolated beyond that in the diagram. The C-Miras follow the same relation up to log P = 2.6. We include the period-luminosity relation found by Ita & Matsunaga (2011) for variables with log P 2.6.
While the two reddest variables sit close to the LMC line, the other six are significantly brighter. They are probably O-rich stars and at least five of them are undergoing hot-bottom burning.
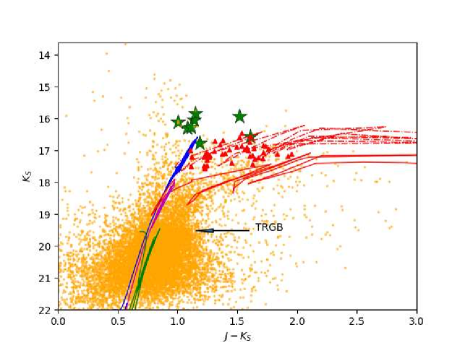
5 Evolutionary Status of the Variables and C Stars
Star formation in NGC 3109 has taken place in two episodes (Weisz et al., 2011). In the first, almost 80% of the galaxy’s stars were formed by about 10 Gyr ago; these presumably are the giants and fainter stars with a very low metallicity. In more recent times, since about 2 Gyr ago, stars have been forming at a slow rate with presumably a steady increase in metallicity to the level seen in the blue supergiants (e.g. Tramper et al., 2014). Thus we would expect there to be a range of metallicity and age amongst the AGB stars. To illustrate this, we have obtained a selection of the latest parsec + colibri tracks (Marigo et al., 2017) and overlaid them on the colour-magnitude diagram of Górski et al. (2011) in Fig. 8. This can only be illustrative, but suggests a plausible range of ages and metallicities for the AGB of NGC 3109. Note that the 0.398 Gyr track covers the C stars that we measured, while the 0.798 Gyr track overlies the bulk of the fainter, red AGB stars covered by Gorskí’s measurements.
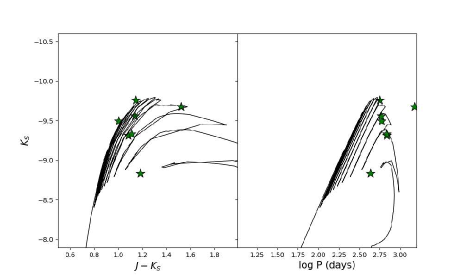
To investigate the nature of the variables further we have used a small set of evolutionary tracks for the thermally-pulsing phase of the AGB (Marigo et al., 2017) (kindly supplied by Paola Marigo) covering the mass range from 2.6 M⊙ to 5 M⊙, for metallicities Z=(0.0005, 0.001, 0.004). Five of the six proposed HBB variables are well represented by a track for a star with an O-rich atmosphere, M=5 M⊙ and Z=0.0005 to 0.001. This is in the mass range expected for HBB stars (see, eg. Marigo et al., 2017). The predicted periods at the luminosities of these variables are good matches to those observed. The track and the period evolution are shown in Fig. 9. The sixth variable (#2081), which is the faintest, shortest period one, appears to lie on a track (not illustrated here) for a 3–4 M⊙, Z=0.001–0.004 O-rich star where again the predicted period matches the observed one. It could also be a 3 M⊙ star on a track soon after becoming a C star. In the two-colour diagram, Fig 1, it is outside the O-Mira box, and at the blue end of the C-star region, though it is not identified as a C star by Demers et al. (2003). It may be in a transitional evolutionary phase. The longest period star (#3089) can be fitted by O-rich tracks for a 5 M⊙ star with Z in the range 0.0005–0.004. Its observed period far exceeds the maximum predicted for any of these tracks.
In the case of star #2075 the situation is ambiguous. It appears to be best explained as a C-rich star with mass 3 M⊙ and Z = 0.0005–0.004, although the observed period is only predicted by the Z=0.004 track. This interpretation is supported by the star’s position in the colour-colour diagram, Fig. 1. On the other hand, it could be an O-rich star of mass 4–5 M⊙, and metallicity Z=0.001–0.004, though only for the Z=0.004 case is the period predicted correctly. The variable is not listed as a C star by Demers et al. (2003) but has a large amplitude. It falls in a gap between CCDs in the CFH12K camera on the Canada-France-Hawaii Telescope, so was missed in the C star survey (S. Demers, private communication).
Further discussion of the nature of the variables can be found in section A in the Appendix. Lebzelter et al. (2018) have proposed a method of separating AGB stars into different groups on the basis of a combination of Gaia and near-infrared photometry, which we have applied to variables in NGC 3109 and in the LMC, the SMC and some of the Local Group galaxies that we have observed in the past. For NGC 3109, we find general agreement between the classification based on this approach and that based on the evolutionary tracks.
6 Very Long Period Miras
There are only a few large amplitude AGB variables known with primary pulsation periods over 1000 days, partly because they are rare, but the limited patience of observers and TACs also makes their characterization difficult. These stars are of special interest because they are uncommon and will include short-lived evolutionary phases of the most massive stars that experience the AGB. In our paper on Sgr dIG (Whitelock et al., 2018) we discussed a Mira with a period of days and suggested it was in a post-HBB phase and leaving the AGB. In view of the fact that we have found two even longer period stars in NGC3109, it is appropriate to briefly review how many very long period stars there are in the Local Group and what we know about their evolution. We start with a brief census of day Miras in the LMC, SMC and the Galaxy.
LMC: Wood et al. (1992) measured periods of over 1000 days for eight IRAS sources in the LMC and detected OH emission in four of them, confirming their O-rich nature. Whitelock et al. (2003) confirmed the long periods for six of these and measured another three with days. OGLE (Soszyński et al., 2009) confirmed the long periods for seven of the large amplitude variables and identified one more111The OGLE catalogue gives multiple periods for many stars. Here we only consider the dominant one.. On the basis of their colours Soszyński et al. (2009) suggested that seven of the variables with long periods were O-rich and one, IRAS05402–6956 (P=1352 day), was C-rich. However, this cannot be a C-star as it was one of those that Wood et al. (1992) detected as an OH maser, a detection that has recently been confirmed (Goldman et al., 2017). Groenewegen & Sloan (2018) added two further O-rich sources and five C-rich sources, as well as refining some of the periods. So the total census for the LMC is 13 O-rich large amplitude variables with periods up to 1362 days and five C-rich sources with periods up to 1209 days; these are listed in Table 2
| Name | RA | Dec | Period |
| (2000.0) | (day) | ||
| Carbon rich | |||
| IRAS 05125–7035 | 078.003208 | -70.540000 | 1115 |
| IRAS 05278–6942 | 081.850458 | -69.662472 | 1001 |
| IRAS 05506–7053 | 087.485500 | -70.886583 | 1026 |
| IRAS 05509–6956 | 087.608770 | -69.934250 | 1052 |
| IRAS 05568–6753 | 089.161500 | -67.892889 | 1209 |
| Oxygen rich | |||
| IRAS 04407–7000 | 070.118667 | -69.920417 | 1148 |
| IRAS 04498–6842 | 072.422792 | -68.630944 | 1256 |
| IRAS 04509–6922 | 072.668583 | -69.292194 | 1271 |
| IRAS 04516–6902 | 072.870792 | -68.963889 | 1095 |
| IRAS 04545–7000 | 073.541875 | -69.932833 | 1254 |
| MSX LMC 1210 | 073.835417 | -68.377583 | 1050 |
| HV 888 | 076.058875 | -67.270639 | 1005 |
| MSX LMC 642 | 082.200708 | -71.041361 | 1133 |
| IRAS 05298–6957 | 082.352600 | -69.920468 | 1265 |
| MSX LMC 807 | 083.154833 | -67.115667 | 1069 |
| IRAS 05329–6708 | 083.213875 | -67.114444 | 1303 |
| IRAS 05402–6956 | 084.937000 | -69.921667 | 1362 |
| IRAS 05558–7000 | 088.837625 | -70.000833 | 1175 |
| Name | RA | Dec | Period | * | * | |||||||
|---|---|---|---|---|---|---|---|---|---|---|---|---|
| (2000.0) | day | mag | ||||||||||
| HV11417 | 015.20071 | -72.85056 | 1092 | 1.26 | 1.48 | 1.50 | 8.86 | 0.97 | 0.47 | 1.44 | 8.86 | 1.35 |
| GM103 | 012.62764 | -72.85830 | 1062 | 1.27 | 1.34 | 1.18 | 8.91 | 1.10 | 0.61 | 1.70 | 8.91 | 1.60 |
| IRAS00483–7347 | 012.52963 | -73.52377 | 1859 | 0.98 | 0.79 | 0.57 | 8.71 | 1.72 | 1.11 | 2.83 | 8.73 | 2.67 |
-
*
Transformed from the SAAO to the 2MASS system.
SMC: The OGLE group (Soszyński et al., 2011) measured periods for three O-rich Miras in the SMC of between 1062 and 1859 days. All three Miras have confirmed M-type spectra (Elias et al., 1980; Groenewegen et al., 1998; van Loon et al., 2008). photometry for these three stars is given in Appendix B and a summary of their mean colours and amplitudes is given in Table 3, where the periods are taken from OGLE (Soszyński et al., 2011), but agree with what is derived from the measurements in the Appendix.
HV 11417 is sometimes classed as a supergiant, but these colours put it in the region of the two-colour diagram occupied by Miras (Feast et al., 1984) which, together with its large amplitude, supports the AGB classification favoured recently (Soszyński et al., 2011; Groenewegen & Sloan, 2018). The other two stars have the colours of Miras reddened by circumstellar reddening and could be either O- or C-rich. All three stars are shown in Fig. 10 where IRAS00483–7347 falls in the region dominated by C stars, showing that the classification scheme based on Gaia and near infrared photometry breaks down (as do other photometrically-based schemes) for O-rich stars with high mass-loss rates. Transforming the photometry to the 2MASS system following Carpenter (2001)222 updated: http://www.astro.caltech.edu/jmc/2mass/v3/transformations/ gives the values listed in the last two columns of the table. These are shown in Fig. 10 for comparison with the NGC 3109 Miras, assuming a distance modulus of 18.9 for the SMC.
Groenewegen & Sloan (2018) suggest that IRAS 00483–7347 (MSX SMC 055) is the best Magellanic Cloud candidate for a super-AGB star, based on its high luminosity (), long period and large amplitude. They propose a current mass of and an initial mass around larger than this. A high mass is independently supported by the measured high rubidium abundance (García-Hernández et al., 2009).
The Galaxy: The GCVS (Samus’ et al., 2017) lists 11 Miras with periods over 1000 (up to 1994) days. Only one of these, V829 Cas, with a period of 1060 days (Groenewegen et al., 1998), is a C star (Zuckerman & Dyck, 1986). This is the longest period known for a C-rich Mira in the Galaxy, and the only one above 1000 days. The models discussed by Marigo et al. (2017) do not produce C stars at high metallicities, so we would anticipate that such stars are less common in the Galaxy, particularly among the higher-mass longer-period AGB stars, than e.g., in the Magellanic Clouds.
Four of the other ten GCVS variables are either not Miras or have periods much shorter than 1000 days. The ASAS online catalogue (Pojmanski, 1997) convincingly provides shorter periods for three of them, CD Pup, V1156 Sgr and V581 CrA (the last is actually an RCB star (Miller et al., 2012)) and the AAVSO catalogue (Watson et al., 2006) gives a short period for EI Sct. The other six long period Miras in the GCVS are OH/IR stars, so they are definitely AGB stars and their long periods are at least plausible; these are listed in Table 4 with their periods and the uncertainty on the period () where it is given in the reference. The GCVS also lists three possible Miras with days; one of these, AY Lac, is a cataclysmic variable (Kroll et al., 2003), the second, V669 Cas, is a well known OH/IR star and is included in the Table. Very little is known about the third, CP Sco, but the AAVSO list a short period, so it is not included here.
There are another nine OH/IR sources for which periods over 1000 days have been determined, listed in Table 4, and several of them already have GCVS designations. So there are at least 16 O-rich Miras with periods over 1000 days in the Galaxy.
In addition to the variables discussed above there are several other OH-variables within the Galaxy with periods over 1000 days (a few over 2000 days) (e.g., Herman & Habing, 1985; van Langevelde et al., 1990), most of which are probably massive AGB stars (some may be supergiants), but have no optical or near-infrared counterpart, presumably because of circumstellar and/or interstellar absorption (they are close to the Galactic plane). So, in summary, within the Galaxy there is one C star and at least 16 O-rich stars with periods over 1000 days. The census is obviously incomplete, but the total number cannot be very large.
Long periods among Miras are rare, either because they are in a very short-lived evolutionary phase (see, e.g. Marigo et al., 2017) or because they only occur among the most massive, and therefore the rarest, of the AGB stars, or both. As summarized by Feast (2009), we understand that the initial mass of Miras with periods less than about 400 days is a function of their pulsation period. The situation is less clear for longer period stars, some of which experience HBB (see, e.g. Whitelock, 2017; Whitelock et al., 2018). Very long period OH-variables, which can be detected to very large distances, are found only close to the Galactic plane, supporting the view that they have progenitors that are significantly more massive than shorter period Miras.
It is therefore very interesting that we find two very long period stars in NGC 3109. If #2075 is indeed a C star (section 5), its period is comparable to those of the longest period LMC C-rich Miras and longer than any C-Mira known in the Galaxy. In view of the problems there have been in classifying LMC long-period stars as O- or C-rich, as described above, this must be confirmed using spectroscopy or narrow band filters. The period of 1486 days for #3089 is somewhat uncertain because of the limited temporal coverage, but the period cannot be under 1000 days. Both of these stars are much bluer (lower ) than Miras of comparable period in the Galaxy or the LMC, indicating lower circumstellar extinction and weaker stellar winds. Whitelock et al. (2018) discussed a long period ( day) O-rich Mira in Sgr dIG, emphasizing how unusual it was to find such a long period Mira with such blue colours. Using stellar evolution models they suggested that its progenitor had a mass around , and that it was close to the end of its AGB evolution. It is interesting that we find a very similar star in NGC 3109, which galaxy has about 20 times the mass in the form of stars than does Sgr dIG (McConnachie, 2012) (there is insufficient information to comment on the relative number of stars of the appropriate age to produce long period Miras). It is not entirely clear what metallicity we should associate with these, presumably massive, AGB stars, but probably not as low as in Sgr dIG. The metallicity is important as it affects the mass-loss rates of O-rich stars much more strongly than those of C-rich ones (Wood et al., 1992; Matsuura et al., 2005). As mentioned above, there is strong evidence that the young stars in NGC 3109 have higher metallicities than do those on the giant branch.
This is important in the context of the conclusions of Goldman et al. (2018) who suggest that the dusty winds, which are generally found towards the end of the evolution of the most massive cool stars, are curtailed at low metallicity (see also Wood et al., 1992; Matsuura et al., 2005, and references therein). It is also potentially important in the context of electron-capture supernova (ECSNe) (Langer, 2012, section 7.1 and references therein), the progenitors of which are probably massive AGB stars. The frequency of ECSNe may depend on metallicity, if at low metallicity the stellar winds are weaker, so that evolution is not terminated by mass loss and the core has time to grow large enough for the star to become a supernova. The discovery of two luminous long period AGB variables in the metal weak environment of NGC 3109 lends support to this channel for ECSNe.
| name | P | Ref | other | |
|---|---|---|---|---|
| V0829 Cas* | 1060 | 1 | IRAS01144+6658 | |
| V1360 Aql | 1140 | 1 | OH30.7+0.4 | |
| V1362 Aql | 1730 | 1 | OH30.1–0.7 | |
| V1363 Aql | 1490 | 1 | OH32.0–0.5 | |
| V1365 Aql | 1750 | 1 | OH32.8–0.3 | |
| V1366 Aql | 1340 | 1 | OH39.7 +1.5 | |
| V1368 Aql | 1650 | 1 | OH 42.3–0.1 | |
| V0669 Cas | 1537 | 18 | 1,2 | OH127.8–0.0 |
| NSV25875 | 1460 | 11 | 3 | OH104.9+2.4 |
| IRAS03293+6010 | 1800 | 400 | 4 | OH141.7+3.5 |
| IRAS05131+4530 | 1100 | 100 | 4 | AFGL712 |
| IRAS07222–2005 | 1200 | 200 | 4,7 | |
| V1185 Sco | 1400: | 4 | OH357–1.3 | |
| V437 Sct | 1589 | 42 | 5 | OH26.5+0.6 |
| V438 Sct | 1172 | 94 | 5 | OH26.2–0.6 |
| V441 Sct | 1785 | 114 | 5 | OH21.5+0.5 |
| IRAS03206+6521 | 1410 | 6 | OH138.0+7.2 |
Acknowledgements
JWM and PAW wish to thank Prof Rolf Kudritski for providing access to the facilities of MIAPP, where part of the work on this paper was done. This research has made use of Aladin (Bonnarel et al., 2000). This material is based upon work supported financially by the South African National Research Foundation. Some of the data presented in this paper were obtained from the Mikulski Archive for Space Telescopes (MAST). STScI is operated by the Association of Universities for Research in Astronomy, Inc., under NASA contract NAS5-26555. This publication makes use of data products from the Two Micron All Sky Survey, which is a joint project of the University of Massachusetts and the Infrared Processing and Analysis Center/California Institute of Technology, funded by the National Aeronautics and Space Administration and the National Science Foundation. The IRSF project is a collaboration between Nagoya University and the SAAO supported by the Grants-in-Aid for Scientific Research on Priority Areas (A) (no. 10147207 and no. 10147214) and Optical & Near-Infrared Astronomy Inter-University Cooperation Program, from the Ministry of Education, Culture, Sports, Science and Technology (MEXT) of Japan and the National Research Foundation (NRF) of South Africa. This research has made use of the VizieR catalogue access tool, CDS, Strasbourg, France. The original description of the VizieR service was published in A&AS 143, 23. This work has made use of data from the European Space Agency (ESA) mission Gaia (https://www.cosmos.esa.int/gaia), processed by the Gaia Data Processing and Analysis Consortium (DPAC, https://www.cosmos.esa.int/web/gaia/dpac/consortium). Funding for the DPAC has been provided by national institutions, in particular the institutions participating in the Gaia Multilateral Agreement. We are particularly grateful to Paola Marigo who generated evolutionary tracks for us. We thank Serge Demers for promptly providing a catalogue of C stars in the region of variable #2075. We also thank Marek Gorskí for providing the araucaria near-infrared data. For their contributions to the original IRSF observations, we wish to thank Toshihiko Tanabé, Yoshifusa Ita, Shogo Nishiyama, Yasuaki Haba and Enrico Olivier. The following people contributed observations to the data in the Appendix: Enrico Olivier, Jacco van Loon, Albert Zijlstra.
References
- Bertin & Arnouts (1996) Bertin E., Arnouts S., 1996, A&AS, 117, 393
- Bessell & Brett (1988) Bessell M. S., Brett J. M., 1988, PASP, 100, 1134
- Bonnarel et al. (2000) Bonnarel F., et al., 2000, A&AS, 143, 33
- Boyer et al. (2017) Boyer M. L., et al., 2017, ApJ, 851, 152
- Carignan et al. (2013) Carignan C., Frank B. S., Hess K. M., Lucero D. M., Randriamampandry T. H., Goedhart S., Passmoor S. S., 2013, AJ, 146, 48
- Carpenter (2001) Carpenter J. M., 2001, AJ, 121, 2851
- Carter (1990) Carter B. S., 1990, MNRAS, 242, 1
- Chambers et al. (2016) Chambers K. C., et al., 2016, preprint, (arXiv:1612.05560)
- Cioni (2009) Cioni M.-R. L., 2009, A&A, 506, 1137
- Cioni et al. (2006) Cioni M.-R. L., Girardi L., Marigo P., Habing H. J., 2006, A&A, 448, 77
- Davidge (2018) Davidge T. J., 2018, ApJ, 856, 129
- Demers et al. (2003) Demers S., Battinelli P., Letarte B., 2003, A&A, 410, 795
- Elias et al. (1980) Elias J. H., Frogel J. A., Humphreys R. M., 1980, ApJ, 242, L13
- Evans et al. (2007) Evans C. J., Bresolin F., Urbaneja M. A., Pietrzyński G., Gieren W., Kudritzki R.-P., 2007, ApJ, 659, 1198
- Feast (2009) Feast M. W., 2009, in AGB Stars and Related Phenomena. p. 48 (arXiv:0812.0250)
- Feast et al. (1982) Feast M. W., Robertson B. S. C., Catchpole R. M., Lloyd Evans T., Glass I. S., Carter B. S., 1982, MNRAS, 201, 439
- Feast et al. (1984) Feast M. W., Whitelock P. A., Catchpole R. M., Carter B. S., 1984, The Observatory, 104, 217
- Feast et al. (2002) Feast M., Whitelock P., Menzies J., 2002, MNRAS, 329, L7
- Gaia Collaboration et al. (2016) Gaia Collaboration et al., 2016, A&A, 595, A1
- Gaia Collaboration et al. (2018) Gaia Collaboration et al., 2018, A&A, 616, A1
- García-Hernández et al. (2009) García-Hernández D. A., et al., 2009, ApJ, 705, L31
- Girardi et al. (2005) Girardi L., Groenewegen M. A. T., Hatziminaoglou E., da Costa L., 2005, A&A, 436, 895
- Goldman et al. (2017) Goldman S. R., et al., 2017, MNRAS, 465, 403
- Goldman et al. (2018) Goldman S. R., et al., 2018, MNRAS, 473, 3835
- Górski et al. (2011) Górski M., Pietrzyński G., Gieren W., 2011, AJ, 141, 194
- Groenewegen & Sloan (2018) Groenewegen M. A. T., Sloan G. C., 2018, A&A, 609, A114
- Groenewegen et al. (1998) Groenewegen M. A. T., Whitelock P. A., Smith C. H., Kerschbaum F., 1998, MNRAS, 293, 18
- Herman & Habing (1985) Herman J., Habing H. J., 1985, Astronomy and Astrophysics Supplement Series, 59, 523
- Hidalgo et al. (2008) Hidalgo S. L., Aparicio A., Gallart C., 2008, AJ, 136, 2332
- Holtzman et al. (2006) Holtzman J. A., Afonso C., Dolphin A., 2006, ApJS, 166, 534
- Hosek et al. (2014) Hosek Jr. M. W., et al., 2014, ApJ, 785, 151
- Huang et al. (2018) Huang C. D., et al., 2018, ApJ, 857, 67
- Ita & Matsunaga (2011) Ita Y., Matsunaga N., 2011, MNRAS, 412, 2345
- Jiménez-Esteban et al. (2006) Jiménez-Esteban F. M., García-Lario P., Engels D., Manchado A., 2006, A&A, 458, 533
- Jobin & Carignan (1990) Jobin M., Carignan C., 1990, AJ, 100, 648
- Jones et al. (2018) Jones O. C., Maclay M. T., Boyer M. L., Meixner M., McDonald I., Meskhidze H., 2018, ApJ, 854, 117
- Karakas et al. (2017) Karakas A., Ventura P., Dell’Agli F., Di Criscienzo M., 2017, Mem. Soc. Astron. Italiana, 88, 226
- Kroll et al. (2003) Kroll P., Samus N., Volkov I., 2003, Information Bulletin on Variable Stars, 5441, 1
- Langer (2012) Langer N., 2012, Annual Review of Astronomy and Astrophysics, 50, 107
- Lebzelter et al. (2018) Lebzelter T., Mowlavi N., Marigo P., Pastorelli G., Trabucchi M., Wood P. R., Lecoeur-Taïbi I., 2018, A&A, 616, L13
- Levesque & Massey (2012) Levesque E. M., Massey P., 2012, AJ, 144, 2
- Marigo et al. (2017) Marigo P., et al., 2017, ApJ, 835, 77
- Matsuura et al. (2005) Matsuura M., et al., 2005, A&A, 434, 691
- McConnachie (2012) McConnachie A. W., 2012, AJ, 144, 4
- Menzies et al. (2010) Menzies J. W., Whitelock P. A., Feast M. W., Matsunaga N., 2010, MNRAS, 406, 86
- Menzies et al. (2011) Menzies J. W., Feast M. W., Whitelock P. A., Matsunaga N., 2011, MNRAS, 414, 3492
- Menzies et al. (2015) Menzies J. W., Whitelock P. A., Feast M. W., 2015, MNRAS, 452, 910
- Miller et al. (2012) Miller A. A., Richards J. W., Bloom J. S., Cenko S. B., Silverman J. M., Starr D. L., Stassun K. G., 2012, ApJ, 755, 98
- Orosz et al. (2017) Orosz G., et al., 2017, AJ, 153, 119
- Pawlowski & McGaugh (2014) Pawlowski M. S., McGaugh S. S., 2014, MNRAS, 440, 908
- Peña et al. (2007) Peña M., Stasińska G., Richer M. G., 2007, A&A, 476, 745
- Pérez-Mesa et al. (2017) Pérez-Mesa V., Zamora O., García-Hernández D. A., Plez B., Manchado A., Karakas A. I., Lugaro M., 2017, A&A, 606, A20
- Pojmanski (1997) Pojmanski G., 1997, Acta Astron., 47, 467
- Riebel et al. (2015) Riebel D., et al., 2015, ApJ, 807, 1
- Riechers et al. (2005) Riechers D., Balega Y., Driebe T., Hofmann K. H., Men’shchikov A. B., Shenavrin V. I., Weigelt G., 2005, A&A, 436, 925
- Samus’ et al. (2017) Samus’ N. N., Kazarovets E. V., Durlevich O. V., Kireeva N. N., Pastukhova E. N., 2017, Astronomy Reports, 61, 80
- Soszyński et al. (2006) Soszyński I., Gieren W., Pietrzyński G., Bresolin F., Kudritzki R.-P., Storm J., 2006, ApJ, 648, 375
- Soszyński et al. (2009) Soszyński I., et al., 2009, Acta Astron., 59, 239
- Soszyński et al. (2011) Soszyński I., et al., 2011, Acta Astron., 61, 217
- Suh & Kim (2002) Suh K.-W., Kim H. Y., 2002, A&A, 391, 665
- Tramper et al. (2014) Tramper F., Sana H., de Koter A., Kaper L., Ramírez-Agudelo O. H., 2014, A&A, 572, A36
- VanderPlas & Ivezić (2015) VanderPlas J. T., Ivezić Ž., 2015, ApJ, 812, 18
- Watson et al. (2006) Watson C. L., Henden A. A., Price A., 2006, Society for Astronomical Sciences Annual Symposium, 25, 47
- Weisz et al. (2011) Weisz D. R., et al., 2011, ApJ, 739, 5
- Whitelock (2017) Whitelock P. A., 2017, preprint, (arXiv:1711.08932)
- Whitelock & Feast (2014) Whitelock P. A., Feast M. W., 2014, in EAS Publications Series. pp 263–269, doi:10.1051/eas/1567047
- Whitelock et al. (2003) Whitelock P. A., Feast M. W., van Loon J. T., Zijlstra A. A., 2003, MNRAS, 342, 86
- Whitelock et al. (2008a) Whitelock P. A., Feast M. W., Van Leeuwen F., 2008a, MNRAS, 386, 313
- Whitelock et al. (2008b) Whitelock P. A., Feast M. W., van Leeuwen F., 2008b, MNRAS, 386, 313
- Whitelock et al. (2009) Whitelock P. A., Menzies J. W., Feast M. W., Matsunaga N., Tanabé T., Ita Y., 2009, MNRAS, 394, 795
- Whitelock et al. (2013) Whitelock P. A., Menzies J. W., Feast M. W., Nsengiyumva F., Matsunaga N., 2013, MNRAS, 428, 2216
- Whitelock et al. (2018) Whitelock P. A., Menzies J. W., Feast M. W., Marigo P., 2018, MNRAS, 473, 173
- Wood et al. (1992) Wood P. R., Whiteoak J. B., Hughes S. M. G., Bessell M. S., Gardner F. F., Hyland A. R., 1992, ApJ, 397, 552
- Yuan et al. (2018) Yuan W., Macri L. M., Javadi A., Lin Z., Huang J. Z., 2018, preprint, (arXiv:1807.03544)
- Zuckerman & Dyck (1986) Zuckerman B., Dyck H. M., 1986, ApJ, 304, 394
- de Vaucouleurs et al. (1991) de Vaucouleurs G., de Vaucouleurs A., Corwin Jr. H. G., Buta R. J., Paturel G., Fouqué P., 1991, Third Reference Catalogue of Bright Galaxies. Volume I: Explanations and references. Volume II: Data for galaxies between 0h and 12h. Volume III: Data for galaxies between 12h and 24h.
- van Langevelde et al. (1990) van Langevelde H. J., van der Heiden R., van Schooneveld C., 1990, A&A, 239, 193
- van Loon et al. (2008) van Loon J. T., Cohen M., Oliveira J. M., Matsuura M., McDonald I., Sloan G. C., Wood P. R., Zijlstra A. A., 2008, A&A, 487, 1055
Appendix A Gaia Photometry and Classes of Variables
Lebzelter et al. (2018) have proposed an interesting method for separating AGB stars into different subgroups (e.g. C-rich, O-rich AGB stars of low mass, etc) based on Gaia DR2(Gaia Collaboration et al., 2016, 2018) and magnitudes combined with 2MASS magnitudes. They considered the LMC and showed how stars grouped in the , plane, where and are Wesenheit functions (see Lebzelter et al., 2018, for details).
We constructed such a diagram for SMC AGB stars and found a very similar distribution to that for the LMC, in spite of the metallicity difference. Encouraged by this we computed the Wesenheit magnitudes for the long-period variables in NGC 3109, IC 1613, NGC 6822, the three very long period SMC variables from Table 3 and the eight variables from Table 6 that have Gaia data. A matching radius of 1 arcsec was used in all cases.
| Galaxy/Star * | RA | Dec | |||||
|---|---|---|---|---|---|---|---|
| (2000.0) | |||||||
| IC 1613 | |||||||
| 1017 | 16.27831 | 2.22648 | 15.14 | 1.11 | 18.26 | 2.53 | 0.60 |
| 3011 | 16.20428 | 2.09140 | 15.17 | 1.01 | 17.92 | 2.57 | 0.10 |
| 2035 | 16.11180 | 2.17299 | 15.20 | 1.13 | 17.99 | 2.15 | 0.77 |
| 1016 | 16.26576 | 2.19903 | 15.04 | 1.14 | 18.05 | 1.99 | 1.20 |
| NGC 6822 | |||||||
| 12557 | 296.18396 | -14.78028 | 17.12 | 1.11 | 19.22 | 0.56 | 2.14 |
| 20331 | 296.20413 | -14.63472 | 15.46 | 1.12 | 17.97 | 2.26 | 0.34 |
| 10184 | 296.22358 | -14.77472 | 15.13 | 1.31 | 17.97 | 1.53 | 1.75 |
| 30133 | 296.21812 | -14.88028 | 15.09 | 1.21 | 18.36 | 1.88 | 1.66 |
| 20134 | 296.21321 | -14.68083 | 15.07 | 1.28 | 18.12 | 2.76 | 0.35 |
| 40139 | 296.20425 | -14.74278 | 13.92 | 1.33 | 17.29 | 2.71 | 0.76 |
| 10198 | 296.25087 | -14.76778 | 14.19 | 1.31 | 17.08 | 2.08 | 1.09 |
| 30292 | 296.18800 | -14.87222 | 14.68 | 1.20 | 17.79 | 2.68 | 0.45 |
| 10091 | 296.26700 | -14.76306 | 14.18 | 1.28 | 17.23 | 2.46 | 0.73 |
| 20004 | 296.21292 | -14.73222 | 12.57 | 1.15 | 15.92 | 2.91 | 0.36 |
| 12790 | 296.20389 | -14.75535 | 16.59 | 1.44 | 18.91 | 1.30 | 1.62 |
| 10817 | 296.23639 | -14.83054 | 16.04 | 1.66 | 18.38 | 0.79 | 2.45 |
| 20540 | 296.18011 | -14.71067 | 16.39 | 1.49 | 19.01 | 1.58 | 1.59 |
| 40590 | 296.28567 | -14.73952 | 16.39 | 1.62 | 19.16 | 1.50 | 1.93 |
| 12751 | 296.21027 | -14.75973 | 16.29 | 1.60 | 18.79 | 1.17 | 2.08 |
| 20578 | 296.29065 | -14.69641 | 16.14 | 1.66 | 18.98 | 1.09 | 2.56 |
| 20542 | 296.17703 | -14.71031 | 16.02 | 1.82 | 19.28 | 1.88 | 2.07 |
| NGC 3109 | |||||||
| 1067 | 150.73837 | -26.14197 | 16.10 | 1.00 | 18.60 | 1.82 | 0.82 |
| 1112 | 150.80582 | -26.15483 | 16.04 | 1.14 | 18.24 | 1.44 | 1.11 |
| 1153 | 150.75345 | -26.17370 | 16.28 | 1.08 | 18.65 | 1.80 | 0.76 |
| 2075 | 150.91414 | -26.17125 | 16.56 | 1.61 | 19.31 | 1.46 | 1.96 |
| 2081 | 150.86487 | -26.15757 | 16.77 | 1.18 | 19.14 | 1.60 | 1.10 |
| 3064 | 150.65652 | -26.14415 | 15.84 | 1.15 | 18.61 | 1.93 | 1.05 |
| SMC | |||||||
| IRAS00483–7347 | 12.52963 | -73.52377 | 8.71 | 2.83 | 16.19 | 3.67 | 4.65 |
| GM103 | 12.62764 | -72.85830 | 8.91 | 1.70 | 13.34 | 4.94 | -0.82 |
| HV11417 | 15.20071 | -72.85056 | 8.86 | 1.44 | 14.34 | 4.81 | 0.21 |
| LMC | |||||||
| IRAS 04407–7000 | 070.118667 | -69.920417 | 8.69 | 1.96 | 15.45 | 5.84 | 0.51 |
| IRAS 04498–6842 | 072.422792 | -68.630944 | 7.49 | 1.64 | 13.04 | 5.68 | -0.69 |
| IRAS 04509–6922 | 072.668583 | -69.292194 | 7.93 | 1.95 | 14.35 | 5.29 | 0.88 |
| IRAS 04516–6902 | 072.870792 | -68.963889 | 7.91 | 2.01 | 15.70 | 4.14 | 3.79 |
| MSX LMC 1210 | 073.835417 | -68.377583 | 9.72 | 2.94 | 16.44 | 3.25 | 4.51 |
| HV 888 | 076.058875 | -67.270639 | 6.78 | 1.23 | 9.53 | 2.66 | 0.14 |
| MSX LMC 642 | 082.200708 | -71.041361 | 9.88 | 3.12 | 14.74 | 5.18 | 0.27 |
| IRAS 05558–7000 | 088.837625 | -70.000833 | 9.13 | 2.86 | 17.60 | 4.41 | 4.69 |
-
*
Distance moduli used in Fig. 10: IC 1613 (24.4), NGC 6822 (23.5), NGC 3109 (25.6), SMC (18.92), LMC (18.50).
| Galaxy/Star * | RA | Dec | |||||
|---|---|---|---|---|---|---|---|
| (2000.0) | |||||||
| IC 1613 | supergiants | ||||||
| 1027 | 16.25295 | 2.18007 | 15.52 | 0.51 | 16.85 | 1.18 | 0.15 |
| 4013 | 16.22231 | 2.08931 | 14.60 | 0.87 | 16.69 | 1.81 | 0.34 |
| 1004 | 16.24328 | 2.15233 | 13.19 | 0.91 | 15.80 | 2.40 | 0.11 |
| 1003 | 16.25696 | 2.14422 | 13.01 | 0.92 | 15.29 | 1.90 | 0.44 |
| 1009 | 16.27144 | 2.19849 | 14.31 | 0.82 | 16.29 | 1.68 | 0.36 |
| 1010 | 16.29004 | 2.20715 | 13.98 | 0.92 | 16.16 | 1.83 | 0.42 |
| 1008 | 16.31963 | 2.18765 | 13.92 | 0.91 | 16.17 | 1.95 | 0.34 |
| 3003 | 16.16047 | 2.01605 | 13.34 | 0.82 | 15.44 | 2.05 | -0.01 |
| NGC 6822 | supergiants | ||||||
| 30016 | 296.19067 | -14.87276 | 12.78 | 1.13 | 15.56 | 2.25 | 0.63 |
| 40115 | 296.19919 | -14.84817 | 13.26 | 1.15 | 16.08 | 2.37 | 0.52 |
| 40177 | 296.21021 | -14.73628 | 14.06 | 1.08 | 16.63 | 2.01 | 0.70 |
| 10089 | 296.22278 | -14.76476 | 14.02 | 1.08 | 16.50 | 1.88 | 0.78 |
| 10032 | 296.22696 | -14.80191 | 13.34 | 1.14 | 16.07 | 2.25 | 0.59 |
| 40278 | 296.22726 | -14.85778 | 12.33 | 1.10 | 15.08 | 2.27 | 0.55 |
| 40315 | 296.23212 | -14.86564 | 12.33 | 1.06 | 15.11 | 2.38 | 0.41 |
| 10011 | 296.23883 | -14.82247 | 12.46 | 1.14 | 15.29 | 2.26 | 0.67 |
| 10015 | 296.24945 | -14.75443 | 12.70 | 0.94 | 14.99 | 1.96 | 0.39 |
| 20101 | 296.26492 | -14.72723 | 14.81 | 1.15 | 17.38 | 1.88 | 0.91 |
| NGC 6822 | S stars | ||||||
| 10870 | 296.17892 | -14.82286 | 16.19 | 1.34 | 18.98 | 1.44 | 1.84 |
| 10784 | 296.21545 | -14.83469 | 16.20 | 1.26 | 18.53 | 1.24 | 1.58 |
| 11004 | 296.27341 | -14.80861 | 16.27 | 1.33 | 18.77 | 1.12 | 1.97 |
| 11029 | 296.28308 | -14.80497 | 16.22 | 1.24 | 18.66 | 1.00 | 1.99 |
| 30528 | 296.19156 | -14.89296 | 16.51 | 1.26 | 19.27 | 1.60 | 1.55 |
| 10326 | 296.25522 | -14.82579 | 15.52 | 1.30 | 18.21 | 1.57 | 1.54 |
-
*
Distance moduli used in Fig. 10: IC 1613 (24.4), NGC 6822 (23.5).
The data for the Miras are tabulated in Table 5 where and are Gaia DR2 blue and red magnitudes, and are ’colours’ as defined in Lebzelter et al. (2018). The supergiants and S stars are in Table 6. In Fig. 10 we plot M against . The solid lines separate the regions defined by Lebzelter et al. (2018); they are to some extent arbitrary and points lying close to them cannot be confidently assigned to a particular region. We have included known supergiants in the galaxies in the diagram. Absolute magnitude is plotted on the y axis in contract to apparent LMC magnitude in Lebzelter et al. (2018).
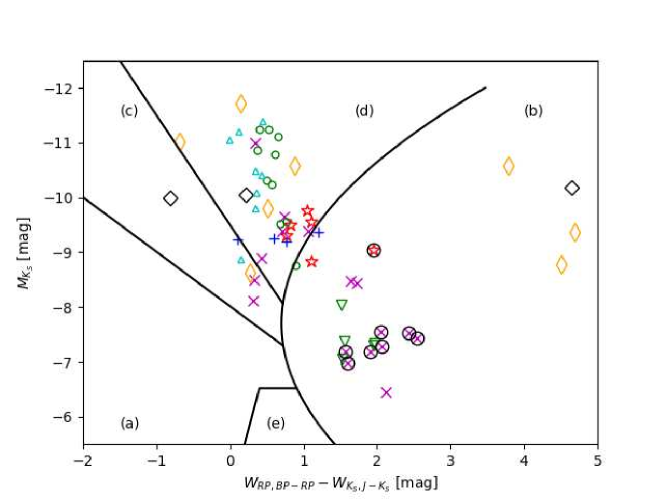
Because the stars are relatively faint, Gaia photometry is not available for them all. In IC 1613 only the four brightest O-rich Miras were found. These were considered by Menzies et al. (2015) to be massive stars undergoing HBB, and they appear in Fig. 10 in region (b) as expected. All the unambiguous red supergiants cluster in region (d), while the Cepheid, v25, lies in region (c).
For NGC 6822 there are data for seven of the 50 C-rich Miras (Whitelock et al., 2013) which all fall in region (b), and 10 of the 11 O-rich Miras. The four HBB stars and the possible red supergiant appear in region (d), and two of the other O-rich variables are in region (c). However, the remaining three are unexpectedly in region (b) amongst the C-rich stars. As discussed by Lebzelter et al. (2018) such stars might have dust shells which contribute extra reddening not accounted for in the Wesenheit formulae. The non-variable red supergiants appear in region (d), while the S stars are to be found in the lower C star region as Lebzelter et al. (2018) suggested they would be.
Six of the eight Miras in NGC 3109 reported in this paper have data. Four of the suspected HBB stars fall in region (d) as would be expected, while a fifth is in region (b), close to the boundary with region (d). The very long period star (#2075) lies in region (b) and may be C-rich as speculated in section 5.
The SMC stars are all O-rich. Two appear in regions (a) and (d), while the third is in region (b) where extreme C stars are expected. In the last case, there must be a very thick dust shell providing extra reddening.
For the LMC stars, we only have single-epoch 2MASS measurements. These stars are likely to have relatively large amplitudes so the positions in Fig. 10 in the vertical direction are somewhat more uncertain than for the stars in the other galaxies. Nevertheless, three of the LMC stars lie in a similar position to the single extremely red SMC Mira and, like it, probably have thick dust shells.
None of the WLM variables have Gaia DR2 data so could not be included.
Thus, most of this small sample of Miras in Local Group galaxies appear in the Lebzelter diagram where predicted on the basis of the LMC data. However, this diagram can only be used as supporting evidence for the chemical characteristics of a specific variable; spectra are necessary for a definite attribution to be made.
Appendix B Very Long Period Variables in the SMC
The measurements reported here were obtained with the 1.9-m telescope at SAAO and are on the SAAO photometric system as defined by Carter (1990), i.e. they are different from the IRSF photometry reported in the body of the paper (Carpenter (2001) provides transformation equations between the SAAO and 2MASS systems). The errors are less than 0.03 mag at and less than 0.05 mag at except where marked with a colon where they are less than 0.1 mag. Fourier mean values for the photometry are given in Table 3.
| JD | ||||
|---|---|---|---|---|
| (mag) | ||||
| 0391.38 | 10.37 | 9.44 | 8.93 | 8.41 |
| 0446.31 | 10.57 | 9.59 | 9.06 | 8.51: |
| 0499.28 | 10.75 | 9.76 | 9.22 | 8.60: |
| 0702.60 | 11.07 | 10.11 | 9.49 | 8.64: |
| 0761.30 | 11.07 | 10.15 | 9.52 | 8.79: |
| 0795.31 | 10.65 | 9.82 | 9.30 | 8.61: |
| 1012.72 | 9.86 | 8.87 | 8.52 | 7.98 |
| 1210.33 | 9.65 | 8.65 | 8.27 | 7.84 |
| 1451.50 | 10.14 | 9.91 | 8.71 | 8.25 |
| 1481.39 | 10.27 | 9.27 | 8.80 | 8.30 |
| 1539.29 | 10.43 | 9.41 | 8.90 | 8.45: |
| JD | ||||
|---|---|---|---|---|
| (mag) | ||||
| 6658.56 | 11.05 | 9.45 | 8.44 | 7.18 |
| 6686.47 | 11.09 | 9.46 | 8.45 | 7.19 |
| 6704.49 | 11.02 | 9.47 | 8.45 | |
| 6721.36 | 11.08 | 9.48 | 8.46 | 7.21 |
| 6746.46 | 11.11 | 9.53 | 8.53 | 7.29 |
| 6783.29 | 11.19 | 9.52 | 8.49 | 7.27 |
| 6841.27 | 11.17 | 9.53 | 8.50 | 7.23 |
| 6981.64 | 11.48 | 9.83 | 8.75 | 7.46 |
| 7078.43 | 11.62 | 9.94 | 8.85 | 7.53 |
| 7096.33 | 11.69 | 9.97 | 8.85 | |
| 7120.32 | 11.69 | 9.97 | 8.85 | 7.54 |
| 7133.31 | 11.71 | 10.11 | 8.88 | 7.56 |
| 7160.31 | 11.76 | 10.05 | 8.92 | |
| 7362.53 | 12.14 | 10.28 | 9.04 | 7.55 |
| 7383.63 | 12.12 | 10.28 | 9.02 | 7.58 |
| 7425.45 | 11.98 | 10.16 | 8.93 | 7.50 |
| 7462.47 | 11.92 | 10.07 | 8.82 | 7.38 |
| 7484.41 | 11.82 | 10.01 | 8.80 | 7.31 |
| 7767.48 | 11.79 | 10.03 | 8.85 | 7.42 |
| 7782.41 | 8.99 | |||
| 7838.44 | 11.85 | 10.13 | 8.95 | 7.47 |
| 8592.32 | 11.28 | 9.46 | 8.38 | 6.92 |
| JD | ||||
|---|---|---|---|---|
| (mag) | ||||
| 387.32 | 11.25 | 10.08 | 9.39 | 8.62 |
| 442.38 | 10.95 | 9.89 | 9.21 | 8.34 |
| 500.27 | 10.45 | 9.47 | 8.86 | 7.88 |
| 705.49 | 10.05 | 8.91 | 8.38 | 7.50 |
| 762.3 | 10.02 | 8.87 | 8.34 | 7.53 |
| 793.3 | 9.99 | 8.88 | 8.34 | 7.50 |
| 1013.72 | 10.33 | 9.26 | 8.70 | 8.01 |
| 1181.72 | 10.90 | 9.90 | 9.24 | 8.49 |
| 1209.32 | 11.09 | 10.00 | 9.35 | 8.72 |
| 1391.66 | 11.22 | 10.11 | 9.44 | 8.71 |
| 1453.52 | 11.26 | 10.14 | 9.43 | 8.67 |
| 1482.33 | 11.21 | 10.13 | 9.43 | 8.59 |
| 1538.29 | 10.56 | 9.65 | 8.98 | 8.12 |
| 1712.69 | 10.28 | 9.14 | 8.57 | 7.73 |
| 1813.46 | 10.19 | 8.97 | 8.40 | 7.61 |
Appendix C Photometric data for NGC 3109
The time-series photometry for the variables reported on in this paper is presented in the following nine tables, Tables 10 to 18. Column contents are indicated by the headings and are obvious except that , etc are photometric errors. A sample of the photometric data catalogue is shown in the accompanying Table 19. The full photometric catalogue and the variable star files can be obtained online.
| JD | ||||||
|---|---|---|---|---|---|---|
| 2452265.49565 | 15.675 | 0.041 | 15.722 | 0.010 | 15.917 | 0.008 |
| 2452349.50323 | 15.557 | 0.022 | 15.691 | 0.011 | 15.878 | 0.009 |
| 2452412.50586 | 15.553 | 0.015 | 15.560 | 0.014 | 15.778 | 0.010 |
| 2452671.54266 | 15.409 | 0.023 | 15.443 | 0.013 | 15.704 | 0.013 |
| 2452704.31954 | 15.373 | 0.017 | 15.445 | 0.008 | 15.641 | 0.008 |
| 2452707.27169 | 15.437 | 0.027 | 15.389 | 0.010 | 15.627 | 0.008 |
| 2452709.50897 | 15.370 | 0.014 | 15.429 | 0.009 | 15.649 | 0.008 |
| 2452710.52247 | 15.351 | 0.018 | 15.430 | 0.009 | 15.665 | 0.008 |
| 2452755.38687 | 15.331 | 0.011 | 15.402 | 0.010 | 15.645 | 0.009 |
| 2452783.35084 | 15.326 | 0.011 | 15.407 | 0.009 | 15.645 | 0.007 |
| 2452809.26936 | 15.293 | 0.015 | 15.426 | 0.010 | 15.646 | 0.007 |
| 2452967.58335 | 15.225 | 0.017 | 15.272 | 0.010 | 15.555 | 0.009 |
| 2453013.43395 | 15.182 | 0.017 | 15.268 | 0.008 | 15.530 | 0.006 |
| 2453173.26920 | 15.116 | 0.010 | 15.258 | 0.008 | 15.507 | 0.009 |
| 2453350.52446 | 15.031 | 0.014 | 15.180 | 0.007 | 15.417 | 0.005 |
| 2453438.42628 | 15.033 | 0.013 | 15.159 | 0.008 | 15.418 | 0.010 |
| JD | ||||||
|---|---|---|---|---|---|---|
| 2452265.49565 | 15.755 | 0.041 | 16.028 | 0.014 | 16.864 | 0.017 |
| 2452349.50323 | 16.149 | 0.031 | 16.560 | 0.019 | 17.239 | 0.020 |
| 2452412.50586 | 16.394 | 0.029 | 16.830 | 0.017 | 17.456 | 0.018 |
| 2452671.54266 | 16.165 | 0.052 | 16.555 | 0.025 | 17.105 | 0.034 |
| 2452704.31954 | 16.240 | 0.039 | 16.417 | 0.017 | 17.130 | 0.029 |
| 2452707.27169 | 16.150 | 0.043 | 16.336 | 0.026 | 17.056 | 0.025 |
| 2452709.50897 | 16.116 | 0.027 | 16.369 | 0.014 | 17.046 | 0.016 |
| 2452710.52247 | 16.055 | 0.028 | 16.377 | 0.014 | 17.027 | 0.016 |
| 2452755.38687 | 15.886 | 0.014 | 16.185 | 0.010 | 16.967 | 0.011 |
| 2452783.35084 | 15.829 | 0.015 | 16.157 | 0.012 | 16.911 | 0.009 |
| 2452809.26936 | 15.784 | 0.018 | 16.165 | 0.014 | 16.889 | 0.014 |
| 2452967.58335 | 16.338 | 0.043 | 16.756 | 0.027 | 17.372 | 0.026 |
| 2453013.43395 | 16.777 | 0.078 | 17.178 | 0.041 | 17.584 | 0.032 |
| 2453173.26920 | 16.506 | 0.035 | 16.914 | 0.029 | 17.585 | 0.028 |
| 2453350.52446 | 15.864 | 0.028 | 16.010 | 0.012 | 16.740 | 0.014 |
| 2453438.42628 | 15.626 | 0.017 | 15.925 | 0.009 | 16.709 | 0.014 |
| JD | ||||||
|---|---|---|---|---|---|---|
| 2452265.49565 | 16.061 | 0.061 | 16.380 | 0.028 | 17.181 | 0.028 |
| 2452349.50323 | 16.193 | 0.037 | 16.494 | 0.029 | 17.276 | 0.028 |
| 2452412.50586 | 16.314 | 0.037 | 16.567 | 0.033 | 17.396 | 0.029 |
| 2452671.54266 | 15.713 | 0.035 | 16.072 | 0.025 | 16.911 | 0.032 |
| 2452704.31954 | 15.974 | 0.035 | 16.310 | 0.021 | 17.111 | 0.029 |
| 2452707.27169 | 15.940 | 0.039 | 16.227 | 0.026 | 17.018 | 0.025 |
| 2452709.50897 | 15.941 | 0.028 | 16.281 | 0.023 | 17.034 | 0.023 |
| 2452710.52247 | 15.874 | 0.028 | 16.281 | 0.023 | 17.055 | 0.024 |
| 2452755.38687 | 16.062 | 0.028 | 16.474 | 0.028 | 17.216 | 0.024 |
| 2452783.35084 | 16.097 | 0.026 | 16.568 | 0.028 | 17.269 | 0.023 |
| 2452809.26936 | 16.176 | 0.034 | 16.573 | 0.029 | 17.309 | 0.028 |
| 2452967.58335 | 16.138 | 0.041 | 16.497 | 0.029 | 17.261 | 0.030 |
| 2453013.43395 | 16.357 | 0.068 | 16.701 | 0.037 | 17.539 | 0.041 |
| 2453173.26920 | 15.589 | 0.021 | 15.932 | 0.019 | 16.800 | 0.019 |
| 2453350.52446 | 16.054 | 0.045 | 16.402 | 0.024 | 17.145 | 0.025 |
| 2453438.42628 | 16.133 | 0.039 | 16.540 | 0.032 | 17.300 | 0.031 |
| JD | ||||||
|---|---|---|---|---|---|---|
| 2265.49565 | 15.895 | 0.045 | 16.163 | 0.018 | 16.900 | 0.018 |
| 2349.50323 | 15.662 | 0.022 | 16.146 | 0.015 | 16.845 | 0.017 |
| 2412.50586 | 15.816 | 0.021 | 16.200 | 0.015 | 16.958 | 0.014 |
| 2671.54266 | 16.482 | 0.068 | 16.807 | 0.035 | 17.853 | 0.074 |
| 2704.31954 | 16.425 | 0.048 | 16.939 | 0.032 | 17.679 | 0.052 |
| 2707.27169 | 16.538 | 0.056 | 16.917 | 0.041 | 17.541 | 0.035 |
| 2709.50897 | 16.473 | 0.039 | 16.867 | 0.020 | 17.556 | 0.028 |
| 2710.52247 | 16.467 | 0.048 | 16.950 | 0.025 | 17.633 | 0.028 |
| 2755.38687 | 16.585 | 0.028 | 16.957 | 0.018 | 17.666 | 0.020 |
| 2783.35084 | 16.461 | 0.023 | 16.919 | 0.024 | 17.522 | 0.019 |
| 2809.26936 | 16.435 | 0.037 | 16.793 | 0.028 | 17.430 | 0.026 |
| 2967.58335 | 15.771 | 0.027 | 16.026 | 0.017 | 16.756 | 0.017 |
| 3013.43395 | 15.743 | 0.034 | 16.057 | 0.014 | 16.807 | 0.018 |
| 3173.26920 | 16.310 | 0.028 | 16.891 | 0.028 | 17.354 | 0.026 |
| 3350.52446 | 16.776 | 0.068 | 17.047 | 0.032 | 17.567 | 0.029 |
| 3438.42628 | 16.705 | 0.041 | 17.225 | 0.032 | 17.803 | 0.032 |
| JD | ||||||
|---|---|---|---|---|---|---|
| 2452265.49565 | 16.534 | 0.082 | 17.082 | 0.041 | 17.666 | 0.034 |
| 2452349.50323 | 16.381 | 0.039 | 16.770 | 0.022 | 17.378 | 0.023 |
| 2452412.50586 | 16.464 | 0.029 | 16.820 | 0.015 | 17.492 | 0.018 |
| 2452671.54266 | 15.848 | 0.039 | 16.290 | 0.025 | 17.047 | 0.032 |
| 2452704.31954 | 16.090 | 0.032 | 16.447 | 0.018 | 17.172 | 0.028 |
| 2452707.27169 | 15.940 | 0.037 | 16.371 | 0.026 | 17.136 | 0.024 |
| 2452709.50897 | 16.043 | 0.028 | 16.460 | 0.015 | 17.140 | 0.016 |
| 2452710.52247 | 16.055 | 0.030 | 16.418 | 0.017 | 17.143 | 0.018 |
| 2452755.38687 | 16.247 | 0.024 | 16.706 | 0.015 | 17.324 | 0.015 |
| 2452783.35084 | 16.374 | 0.025 | 16.849 | 0.024 | 17.476 | 0.021 |
| 2452809.26936 | 16.528 | 0.035 | 17.068 | 0.035 | 17.646 | 0.030 |
| 2452967.58335 | 16.584 | 0.054 | 17.252 | 0.043 | 17.875 | 0.041 |
| 2453013.43395 | 16.651 | 0.070 | 17.063 | 0.039 | 17.754 | 0.039 |
| 2453173.26920 | 16.265 | 0.028 | 16.725 | 0.027 | 17.313 | 0.024 |
| 2453350.52446 | 15.988 | 0.032 | 16.409 | 0.018 | 17.049 | 0.018 |
| 2453438.42628 | 16.311 | 0.032 | 16.861 | 0.025 | 17.496 | 0.028 |
| JD | ||||||
|---|---|---|---|---|---|---|
| 2452265.49564 | 15.847 | 0.025 | 16.395 | 0.024 | 17.255 | 0.028 |
| 2452349.50322 | – | – | 16.548 | 0.018 | 17.619 | 0.026 |
| 2452412.50586 | 16.192 | 0.025 | 16.671 | 0.014 | 17.843 | 0.018 |
| 2452671.54854 | 16.948 | 0.093 | 17.373 | 0.052 | 18.706 | 0.109 |
| 2452704.33801 | 17.204 | 0.103 | 17.393 | 0.043 | 18.749 | 0.119 |
| 2452707.30243 | 17.019 | 0.097 | 17.449 | 0.046 | 18.825 | 0.092 |
| 2452709.53763 | 16.963 | 0.061 | 17.566 | 0.039 | 18.932 | 0.081 |
| 2452710.55110 | 16.951 | 0.075 | 17.511 | 0.046 | 18.943 | 0.089 |
| 2452755.42294 | 17.014 | 0.039 | 17.629 | 0.021 | 19.004 | 0.043 |
| 2452783.37426 | 17.140 | 0.054 | 17.751 | 0.048 | 19.198 | 0.081 |
| 2452809.29359 | 17.298 | 0.089 | 17.707 | 0.076 | 18.921 | 0.097 |
| 2452968.55510 | 16.459 | 0.041 | 16.771 | 0.024 | 17.674 | 0.034 |
| 2453013.46903 | 16.097 | 0.043 | 16.565 | 0.019 | 17.450 | 0.025 |
| 2453173.29094 | 15.715 | 0.018 | 16.207 | 0.017 | 17.185 | 0.017 |
| 2453350.54581 | 15.894 | 0.029 | 16.316 | 0.014 | 17.236 | 0.018 |
| 2453438.44598 | 15.991 | 0.019 | 16.478 | 0.014 | 17.521 | 0.017 |
| 2453533.26144 | 16.158 | 0.028 | 16.603 | 0.019 | 17.741 | 0.027 |
| JD | ||||||
|---|---|---|---|---|---|---|
| 2452265.49564 | 16.987 | 0.064 | 17.174 | 0.041 | 18.109 | 0.061 |
| 2452349.50322 | – | – | 17.334 | 0.035 | 18.189 | 0.046 |
| 2452412.50586 | 17.075 | 0.051 | 17.295 | 0.022 | 17.963 | 0.021 |
| 2452671.54854 | 16.573 | 0.071 | 16.996 | 0.037 | 17.877 | 0.057 |
| 2452704.33801 | 16.820 | 0.072 | 17.377 | 0.043 | 18.369 | 0.093 |
| 2452707.30243 | 16.819 | 0.075 | 17.210 | 0.037 | 18.174 | 0.046 |
| 2452709.53763 | 16.700 | 0.048 | 17.193 | 0.028 | 18.075 | 0.034 |
| 2452710.55110 | 16.834 | 0.057 | 17.268 | 0.029 | 18.001 | 0.037 |
| 2452755.42294 | 17.008 | 0.043 | 17.378 | 0.019 | 18.233 | 0.025 |
| 2452783.37426 | 16.994 | 0.043 | 17.283 | 0.032 | 18.043 | 0.028 |
| 2452809.29359 | 16.867 | 0.056 | 17.272 | 0.052 | 17.987 | 0.037 |
| 2452968.55510 | 16.352 | 0.039 | 16.600 | 0.019 | 17.397 | 0.024 |
| 2453013.46903 | 16.421 | 0.054 | 16.688 | 0.021 | 17.498 | 0.028 |
| 2453173.29094 | 16.957 | 0.056 | 17.312 | 0.043 | 18.201 | 0.046 |
| 2453350.54581 | 16.675 | 0.052 | 16.991 | 0.026 | 17.690 | 0.030 |
| 2453438.44598 | 16.454 | 0.032 | 16.665 | 0.018 | 17.496 | 0.018 |
| 2453533.26144 | 16.721 | 0.045 | 17.049 | 0.025 | 17.863 | 0.029 |
| JD | ||||||
|---|---|---|---|---|---|---|
| 2452265.49731 | 15.897 | 0.043 | 16.260 | 0.019 | 17.152 | 0.023 |
| 2452349.50466 | 15.685 | 0.028 | 15.863 | 0.012 | 16.785 | 0.017 |
| 2452412.50517 | 15.526 | 0.015 | 15.837 | 0.009 | 16.721 | 0.009 |
| 2452671.55656 | 15.898 | 0.034 | 16.211 | 0.017 | 16.989 | 0.027 |
| 2452704.35866 | 16.010 | 0.035 | 16.213 | 0.018 | 17.105 | 0.032 |
| 2452707.32826 | 15.943 | 0.027 | 16.234 | 0.015 | 17.012 | 0.014 |
| 2452709.56404 | 15.921 | 0.028 | 16.193 | 0.016 | 17.043 | 0.018 |
| 2452755.44707 | 16.066 | 0.018 | 16.292 | 0.010 | 17.179 | 0.010 |
| 2452809.30990 | 15.985 | 0.026 | 16.266 | 0.021 | 17.131 | 0.019 |
| 2452968.58457 | 15.561 | 0.015 | 15.880 | 0.009 | 16.787 | 0.013 |
| 2453013.50454 | 15.622 | 0.023 | 15.921 | 0.009 | 16.838 | 0.014 |
| 2453093.27710 | 15.939 | 0.037 | 16.281 | 0.018 | 17.258 | 0.026 |
| 2453173.30900 | 15.974 | 0.023 | 16.210 | 0.020 | 17.066 | 0.018 |
| 2453350.56978 | 16.109 | 0.029 | 16.364 | 0.014 | 17.196 | 0.017 |
| 2453438.47422 | 15.800 | 0.018 | 16.004 | 0.010 | 16.850 | 0.015 |
| 2453533.27828 | 15.613 | 0.016 | 15.951 | 0.012 | 16.797 | 0.014 |
| JD | ||||||
|---|---|---|---|---|---|---|
| 2452265.49731 | 16.603 | 0.086 | 17.175 | 0.048 | 18.006 | 0.050 |
| 2452349.50466 | 16.469 | 0.050 | 17.175 | 0.041 | 18.112 | 0.054 |
| 2452412.50517 | 16.615 | 0.035 | 17.176 | 0.018 | 18.038 | 0.023 |
| 2452671.55656 | 15.722 | 0.029 | 16.291 | 0.019 | 17.174 | 0.030 |
| 2452704.35866 | 15.762 | 0.028 | 16.249 | 0.018 | 17.163 | 0.035 |
| 2452707.32826 | 15.767 | 0.024 | 16.229 | 0.014 | 17.091 | 0.016 |
| 2452709.56404 | 15.687 | 0.024 | 16.130 | 0.013 | 17.058 | 0.018 |
| 2452755.44707 | 15.590 | 0.014 | 16.124 | 0.009 | 17.064 | 0.010 |
| 2452809.30990 | 15.534 | 0.018 | 16.020 | 0.017 | 16.913 | 0.017 |
| 2452968.58457 | 15.609 | 0.020 | 16.042 | 0.010 | 16.946 | 0.014 |
| 2453013.50454 | 15.641 | 0.025 | 16.056 | 0.010 | 16.989 | 0.014 |
| 2453093.27710 | 15.605 | 0.028 | 16.141 | 0.014 | 17.152 | 0.023 |
| 2453173.30900 | 15.689 | 0.018 | 16.270 | 0.018 | 17.233 | 0.021 |
| 2453350.56978 | 15.981 | 0.027 | 16.595 | 0.017 | 17.600 | 0.021 |
| 2453438.47422 | 16.122 | 0.024 | 16.771 | 0.020 | 17.773 | 0.026 |
| 2453533.27828 | 16.300 | 0.029 | 16.913 | 0.026 | 17.990 | 0.034 |
| RA | Dec | N a | b | b | b | Note c | ||||||
|---|---|---|---|---|---|---|---|---|---|---|---|---|
| (J2000.0) | ||||||||||||
| 150.75345 | -26.17370 | 1153 | 17.367 | 0.379 | 16.682 | 0.405 | 16.284 | 0.371 | 0.685 | 0.398 | 1.083 | V |
| 150.80502 | -26.16340 | 1171 | 18.258 | 0.062 | 17.503 | 0.104 | 17.463 | 0.284 | 0.755 | 0.040 | 0.795 | |
| 150.81224 | -26.16286 | 1173 | 18.018 | 0.110 | 17.109 | 0.079 | 16.704 | 0.125 | 0.909 | 0.405 | 1.314 | C |
| 150.79617 | -26.16277 | 1174 | 17.823 | 0.061 | 17.080 | 0.046 | 16.973 | 0.116 | 0.743 | 0.107 | 0.850 | |
| 150.80377 | -26.16170 | 1177 | 18.196 | 0.145 | 17.310 | 0.123 | 16.752 | 0.110 | 0.886 | 0.558 | 1.444 | G |
-
a
catalogue star number
-
b
standard deviation of tabulated magnitude
-
c
V indicates variable; C indicates C star; G indicates probable background galaxy