Ultracool Dwarfs Survey. V. High superflare rates on rapidly rotating late-M dwarfs
Abstract
We observed strong superflares (defined as flares with energy in excess of 1033 erg) on three late-M dwarfs: 2MASS J08315742+2042213 (hereafter 2M0831+2042; M7 V), 2MASS J08371832+2050349 (hereafter 2M0837+2050; M8 V) and 2MASS J08312608+2244586 (hereafter 2M0831+2244; M9 V). 2M0831+2042 and 2M0837+2050 are members of the young (700 Myr) open cluster Praesepe. The strong superflare on 2M0831+2042 has an equivalent duration (ED) of 13.7 hr and an estimated energy of 1.3 1035 erg. We observed five superflares on 2M0837+2050, on which the strongest superflare has an ED of 46.4 hr and an estimated energy of 3.5 1035 erg. This energy is larger by 2.7 orders of magnitude than the largest flare observed on the older (7.6 Gyr) planet-hosting M8 dwarf TRAPPIST-1. Furthermore, we also observed five superflares on 2M0831+2244 which is probably a field star. The estimated energy of the strongest superflare on 2M0831+2244 is 6.1 1034 erg. 2M0831+2042, 2M0837+2050 and 2MASS J0831+2244 have rotation periods of 0.5560.002, 0.1930.000 and 0.2920.001 d respectively, which we measured by using light curves. We compare the flares of younger targets with those of TRAPPIST-1 and discuss the possible impacts of such flares on planets in the habitable zone of late-M dwarfs.
keywords:
stars: individual: (2MASS J08371832+2050349, 2MASS J08315742+2042213, 2MASS J08312608+2244586, TRAPPIST-1) - stars: activity - stars: low-mass - stars: flare1 Introduction
M dwarfs make up 75% of all main sequence stars in the local stellar population and are commonly referred to as red dwarfs (Clements
et al., 2017). They are smaller, cooler and less luminous than the Sun. Using the full four-year data, Dressing &
Charbonneau (2015) estimated an occurence rate of 0.24 Earth-size planets and 0.21 super-Earths per M dwarf habitable zone (HZ). These results and the discovery of the TRAPPIST-1 planetary system (Gillon
et al., 2016, 2017; Luger
et al., 2017) demonstrate that there is a significant chance of finding habitable planets around M dwarfs. The Transiting Exoplanet Survey Satellite (TESS; Ricker 2014) will find many more HZ planets orbiting M dwarfs (Barclay
et al., 2018). With the discovery of many such planets, an essential next step in exoplanet research is to identify those with maximum probability of being habitable, especially those bright enough to be characterized by upcoming missions such as NASA’s James Webb Space Telescope (JWST).
Because the M dwarfs have smaller luminosity than the sun, in order to have the right temperature for liquid water to exist, the HZ around them must have average orbital radii () that are a fraction of an AU. TRAPPIST-1, with = 5 10-4 (Van Grootel
et al., 2018) has an HZ at 0.022 AU, i.e. closer to the parent star by a factor of 50 than the Earth is to the Sun.
Furthermore, M dwarfs are typically magnetically active, with frequent flares from systems with ages of a few million years to billions of years (Lacy
et al., 1976; Davenport, 2016; Paudel
et al., 2018a). CFHT-BD-Tau 4 is an example of a very young 1 Myr old M7 dwarf on which a superflare with energy up to 1038 erg, was observed (Paudel
et al., 2018b) and TRAPPIST-1 is an example of an old star with age 7.62.2 Gyr (Burgasser &
Mamajek, 2017) on which multiple flares were observed (Paudel
et al., 2018a). The energy of the strongest flare observed on TRAPPIST-1 was 7.11032 erg in the ultra-violet/visible/infra-red wavelengths (Paudel
et al., 2018a). SDSS J022116.84+194020.4 (M8 dwarf) is another example of a late-M dwarf, whose estimated age is in between 200 Myr and few Gyr, and on which a superflare with a total -band energy of 1034 erg was observed (Schmidt
et al., 2014). The closeness of the HZ to the parent star in an M dwarf planetary system implies that any planets located in the HZ of M dwarfs are more likely to be exposed to enhanced X-rays, UV radiation, high energy particles and coronal mass ejections (CMEs) associated with flares on the parent star. For example, if a flare occurs on Proxima Centauri (Prox Cen; M5.5 dwarf) with the same energy as a typical solar flare, then the HZ planet Prox Cen b receives 250 more X-rays than Earth, 30 more EUV flux and 10 more FUV flux (Ribas
et al., 2016). The intense radiation and energetic particles may perturb the thermo-chemical equilibrium of the planet’s atmosphere, including the destruction of ozone layer and loss of surface water.
Segura et al. (2010) and
Tilley et al. (2017) have reported on modeling the effects of flares on planetary atmospheres. Segura et al. (2010) studied the possible impacts of the 1985 April 12 flare from the dM3 star AD Leo (Hawley &
Pettersen, 1991), on an Earth-like planet in the HZ of this mid-M dwarf. Likewise, Tilley et al. (2017) studied the effects of high flare rate and high flare energies (1030.5 - 1034 erg) of the dM4 flare star GJ1243 on an Earth-like planet. In general, both studies find that if the flare output consists only of photons, then no significant ozone layer destruction occurs. In order to destroy the ozone, the main contributors must be energetic particles analogous to the solar energetic particles (SEP) which are generated along with coronal mass ejections (CMEs) in large solar flares. Assuming that particle fluxes can be generated by scaling from solar flares, Tilley et al. (2017) calculate that, in the case of a stellar flare with energy 1034 ergs, the CME/SEP effects could cause extensive ozone destruction on time-scales of years to decades. Even smaller repeated events can lead to extensive ozone destruction on century-long timescales (Youngblood
et al., 2017). However, studies of Type II radio bursts in flare stars (Crosley &
Osten, 2018) indicate that a simple scaling from solar CME rates to CMEs in stellar flares is not consistent with their data: they conclude that this “casts serious doubt on the assumption that a high flaring rate corresponds to a high rate of CMEs”. As a result, impact of flares on ozone layer depletion remains under investigation.
In order to assess the habitability of M dwarf planets, it is important to constrain the flare rates of M dwarfs as a function of their masses and ages. Because of this, we have been studying the flare rates of various mid and late-M dwarfs and early-L dwarfs which were observed by the mission (Howell
et al., 2014) in various campaigns (see for e.g., Gizis et al. 2017b; Paudel
et al. 2018a). Here we present our results on superflares which we have observed on three late-M dwarfs: 2MASS J08315742+2042213 (hereafter 2M0831+2042), 2MASS J08371832+2050349 (hereafter 2M0837+2050) and 2MASS J08312608+2244586 (hereafter 2M0831+2244). In Section 2, we discuss the physical and photometric characteristics of the targets. In Section 3, we present the data reduction, flare photometry and flare energy computation. We discuss the results in Section 4.
2 Target Characteristics
The properties of our three targets are listed in Table 1. We have also listed the corresponding properties of TRAPPIST-1 in the same table to enable readers to compare its properties with other stars studied in this paper. We estimated radial velocities (RVs) and components of space motion of our targets. The RVs were measured via cross correlation of SDSS spectra to the Bochanski et al. (2007) template spectra, and the were calculated from photometric distances and proper motions from SDSS-2MASS-WISE coordinates, described in Schmidt et al. (2019, in prep.).
The stars 2M0831+2042 and 2M0837+2050 have spectral types of M7 and M8 respectively (West
et al., 2011). Both objects are members of the open cluster Praesepe (Boudreault et al., 2012), which is also known as the Beehive Cluster, M44 or NGC 2632. Gaia
Collaboration et al. (2018b) estimate the distance of this cluster to be 186.2 pc (distance modulus = 6.350) and its age to be 700 Myr. The M7 and M8 stars mentioned above have H emission with equivalent width (hereafter EW) 9.30.3 and 20.30.6 respectively (Schmidt
et al., 2015).
2M0831+2244 is an M9 dwarf (West
et al., 2011) located at a distance of 74.0 pc (Gaia Collaboration, Brown, Vallenari,
Prusti, de Bruijne, Babusiaux & Bailer-Jones, 2018a). It has an H emission with EW 7.30.5 (Schmidt
et al., 2015). It has a tangential velocity of 21 km s-1 suggesting that it is younger than another late-M dwarf TRAPPIST-1 which has a tangential velocity of 60 km s-1. Youth is also supported by its rotation period of 7 hrs measured by . The BANYAN tool (Gagné
et al., 2018) suggests that it is not a member of any known nearby moving groups or stellar associations within 150 pc, by using astrometry measured by and the RV we estimated. So 2M0831+2244 is probably a field star.
| PHOTOMETRIC PROPERTIES | |||||||
| Target name | sp. type | H EW | |||||
| (mag) | (mag) | (mag) | (mag) | Å | |||
| 2M0831+2042 | M7 | 19.6 | 15.560.06 | 14.700.09 | 18.510.01 | 9.30.3a | |
| 2M0837+2050 | M8 | 20.0 | 15.900.07 | 14.880.09 | 18.800.01 | 20.30.6a | |
| 2M0831+2244 | M9 | 19.8 | 14.910.04 | 13.840.04 | 18.770.01 | 7.30.5a | |
| TRAPPIST-1 | M8 | 15.9 | 11.350.02 | 10.300.02 | 15.110.00 | 4.9b | |
| KINEMATIC PROPERTIES | |||||||
| Vtan | RV | ||||||
| (mas yr-1) | (mas yr-1) | (km s-1) | (km s-1) | (km s-1) | (km s-1) | (km s-1) | |
| 2M0831+2042 | -35.80.9 | -13.50.5 | 34 | 38 11 | 4112 | 10 12 | 1 12 |
| 2M0837+2050 | -39.21.2 | -13.30.6 | 37 | 3012 | 2310 | 216 | 8.38.3 |
| 2M0831+2244 | 59.70.9 | -2.410.59 | 21 | 425 | -16 19 | 128.4 | 21 13 |
| TRAPPIST-1 | 9244c | -4673c | 60 | -53 d | -44e | -67e | 16e |
| EPIC IDS AND OTHER PROPERTIES | |||||||
| EPIC ID | Member | Age | parallax | period | |||
| 2M0831+2042 | 212027121 | Praesepe | 700 Myr | 5.360.05 mas | 0.5560.002 d | ||
| 2M0837+2050 | 212035340 | Praesepe | 700 Myr | 5.360.05 mas | 0.1930.000 d | ||
| 2M0831+2244 | 212136544 | 13.50.6 mas | 0.2920.001 d | ||||
| TRAPPIST-1 | 200164267 | 7.62.2 Gyrf | 82.40.8g mas | 3.29 0.07 d |
Note:
i) Spectral types are from West
et al. (2011) and Liebert &
Gizis (2006).
ii) and magnitudes are from 2MASS Survey (Cutri
et al., 2003).
iii) magnitudes are from Pan-STARRS Survey (Chambers
et al., 2016).
v) The distances and proper motions are from DR2 except for TRAPPIST-1.
References:
aSchmidt
et al. (2015); bGizis et al. (2000); cTheissen (2018); dReiners
et al. (2018); eReiners &
Basri (2009); fBurgasser &
Mamajek (2017); gVan Grootel
et al. (2018)
3 Data reduction and computations
3.1 K2 photometry
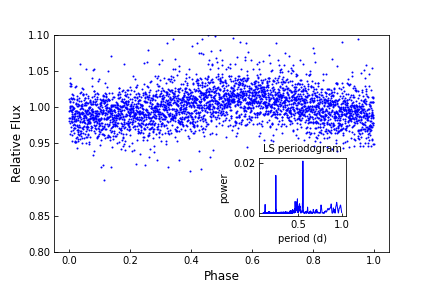
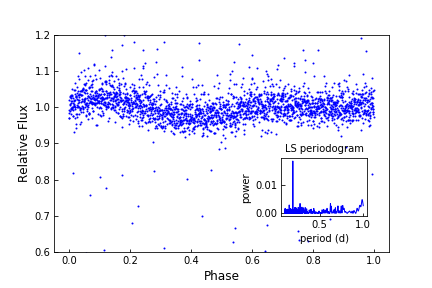
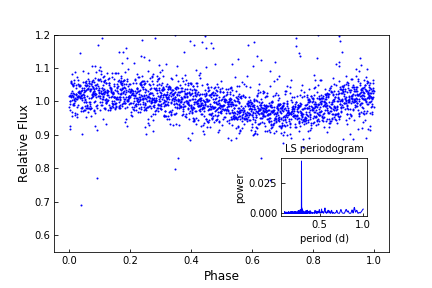
All three objects were observed by the mission twice: once in Campaign 5 (27 April, 2015 - 10 July, 2015), and once in Campaign 18 (12 May, 2018 - 02 July, 2018). Both observations were obtained in long cadence (30 minute) mode (Jenkins et al., 2010). Additionally, 2M0831+2042 was observed in Campaign 16 (07 December, 2017 - 25 February, 2018). We performed point source function (psf) photometry to extract the lightcurves of our targets from their Target Pixel Files (TPFs). For this we also used the Python package ‘Lightkurve’ (Vinícius, Barentsen, Hedges, Gully-Santiago & Cody, 2018). The lightcurves were then detrended using the K2 Systematics Correction (‘K2SC’, Aigrain et al. (2016)). The median count rates of 2M0831+2042, 2M0837+2050 and 2M0831+2244 are 192, 132 and 163 counts s-1 respectively. The Kepler magnitude () of each object is listed in Table 1. was estimated using the Lund et al. (2015) relation 25.3 - 2.5log(count rate). We used only good quality (Q = 0) data points for flare photometry presented in this paper. Using the Lomb-Scargle periodogram (hereafter LSP), we detected periodic features with periods of 0.5560.002, 0.1930.000 and 0.2920.001 d in the lightcurves of 2M0831+2042, 2M0837+2050 and 2M0831+2244 respectively. The uncertainties in the periods are based on half width at half maximum (HWHM) of the periodogram peaks (Mighell & Plavchan, 2013). These periods might be due to spot modulations of the objects: if so, the features most likely represent their rotation periods. If this is correct, the fastest rotator among our targets (2M0837+2050) rotates in a period which is shorter than 97% of the M dwarfs which are classified as “Class A rotators” by Newton et al. (2016). Interestingly, this target turns out to be the site of the largest flare we report in this paper. The phase folded light curves of three targets are shown in Figure 1, 2 and 3 respectively. The corresponding periodogram is also shown inside each figure.
3.2 Flare detection
We used the method described in Osten et al. (2012) to identify the flares in the light curves of our targets. For each data point in the K2SC detrended light curve, we calculated the relative flux , defined as:
| (1) |
where Fi is the flux in ith epoch and Fmean is the mean flux of the entire light curve of each target. Using the values of , we then calculated a statistic for each consecutive observation epoch () as:
| (2) |
Here is the error in the flux which is associated with the ith epoch. We then identified possible flare candidates in the light curve by using the false discovery rate analysis described in Miller
et al. (2001). More detailed explanation regarding this method of flare detection can be found in Osten et al. (2012) and Paudel
et al. (2018a). In order for the flare candidate to be qualified as a real flare event, we imposed an additional criterion, namely, that the detrended flux should exceed the photospheric level (the median count rate in the light curve) by 2.5. The final flare sample was chosen by inspecting the flare light curve and pixel level data by eye. We excluded flare candidates with only a single epoch brightening. All the flares identified on our targets have at least two epoch pairs for which 0 and 0 which ensures flux brightening for multiple times.
In the case of light curves measured in the long cadence mode, very small flares have relatively small amplitudes and last only for a few minutes (less than the duration of one long cadence at 30 minutes). They show up as single point brightening. Because of this, they do not qualify as flare candidates and hence are difficult to identify by using robust statistical techniques.
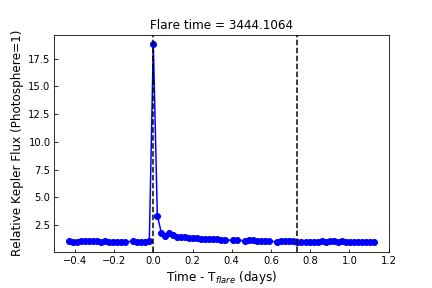
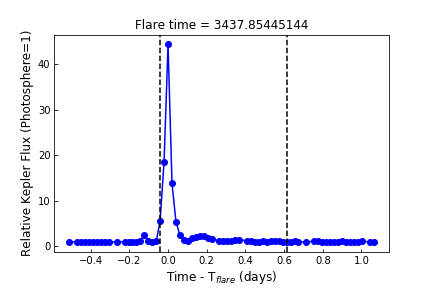
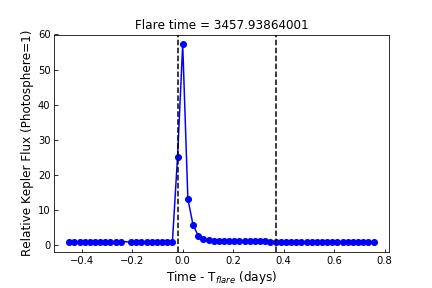
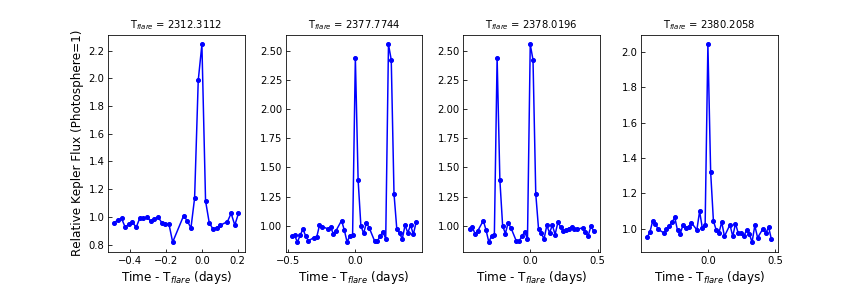
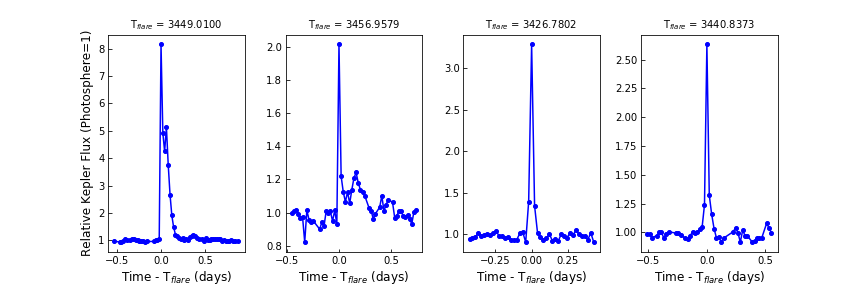
We searched for flares on our targets in all the available light curves using our flare detection method. We identified one strong superflare on 2M0831+2042, one on 2M0837+2050, and five superflares on 2M0831+2244 in Campaign 18 light curves. We also identified four superflares on 2M0837+2050 in Campaign 5 data. The peak flare times, equivalent durations, changes in magnitude () and flare durations of each superflares are listed in Table 2. We plot the strongest superflares on our targets in Figure 4, 5 and 6. Likewise, we plot the remaining superflares identified on 2M0831+2050 in Figure 7 and those on 2M0831+2244 in Figure 8 respectively. In each plot, the flare flux is normalized by the median flux in the corresponding light curve. The time on the top of each plot is the peak flare (Kepler mission) time of the corresponding flare inside the plot.
3.3 Flare Energies
The most common method to estimate energy of a flare is to use its equivalent duration (ED) which is independent of the distance to the flaring object. It depends on the filter and the photospheric properties of the stars. It has units of time and is the area under the flare light curve (Gershberg, 1972). It is the time during which the flare emits the same energy as the (sub)stellar object emits when it is in its quiescent state. We followed the procedures described in Gizis et al. (2017a, b) to estimate the flare energies. We first estimated the photospheric spectrum of our targets by using the matching active M dwarf template (Bochanski et al., 2007) normalized to match Pan-STARRS -band photometry (Tonry et al., 2012; Chambers et al., 2016; Magnier et al., 2016). As a white light flare can be best described by using 10,000 K blackbody model (see for e.g., Hawley & Pettersen 1991; Gizis et al. 2013), we modeled the flare as an 10,000 K blackbody normalized to have the same count rate through the response curve as the photosphere of the corresponding object to estimate the energy emitted corresponding to an ED of 1 s. We emphasize that we calibrated the flare energies by extrapolating to ultra-violet and infra-red wavelengths that are not detected by . So the energies reported here are those emitted by the blackbody continuum in UV/visible/IR wavelengths. They also include atomic emission features between 430 nm and 900 nm which can be detected by but not the emission features in UV. The blackbody continuum dominates the flare energy budget in UV/visible wavelengths (Hawley & Pettersen, 1991; Osten & Wolk, 2015). We find that a flare with ED of 1 s on 2M0831+2042 has an energy of 2.6 1030 erg. Likewise, a flare with ED of 1s on 2M0837+2050 has 2.1 1030 erg and a flare with ED of 1 s on 2M0831+2244 has 3.4 1029 erg. We estimated the flare energies by multiplying these energies with the EDs of flares observed on corresponding targets. All the flare energies are listed in Table 2.
| Target | Tpeak | ED | Energy | flare duration | |
|---|---|---|---|---|---|
| (BJD - 2454833) | (hr) | (erg) | (d) | ||
| 2M0831+2042 | 3444.1064 | -3.2 | 13.7 | 1.31035 | 0.74 |
| 2M0837+2050 | 3437.8544 | -4.1 | 46.4 | 3.51035 | 0.65 |
| 2M0837+2050 | 2378.0196 | -1.1 | 1.7 | 1.31034 | 0.06 |
| 2M0837+2050 | 2312.3112 | -1.0 | 1.3 | 1.01034 | 0.06 |
| 2M0837+2050 | 2377.7744 | -1.1 | 1.0 | 7.41033 | 0.04 |
| 2M0837+2050 | 2380.2058 | -0.9 | 0.7 | 5.21033 | 0.04 |
| 2M0831+2244 | 3457.9386 | -4.4 | 50.21 | 6.1 1034 | 0.40 |
| 2M0831+2244 | 3449.0100 | -2.3 | 12.6 | 1.51034 | 0.50 |
| 2M0831+2244 | 3426.7801 | -1.3 | 1.6 | 1.91033 | 0.06 |
| 2M0831+2244 | 3456.9579 | -0.8 | 1.3 | 1.6 1033 | 0.31 |
| 2M0831+2244 | 3440.8373 | -1.1 | 1.2 | 1.41033 | 0.08 |
3.4 Comparison of flare rates with TRAPPIST-1
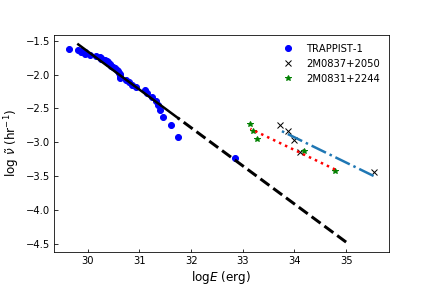
In Figure 9, we compare the flare frequency distribution of TRAPPIST-1 with two of our targets: 2M0837+2050 and 2M0831+2244. This is a log-log plot of cumulative frequency() of flare energies. The cumulative frequency of flares with energy is the number of flares with energies . The flare energies of TRAPPIST-1 are taken from Paudel
et al. (2018a). The total observation time of TRAPPIST-1 is 70.6 days and there are 39 flares with energies in the range (0.65 - 710) 1030 erg in the UV/visible/IR wavelengths. The total observation times of 2M0837+2050 and 2M0831+2244 are 115.58 and 112.78 days respectively, and include both Campaign 5 and 18.
The flare energy distribution of TRAPPIST-1 follows a power law of form
| (3) |
with 0.6 (Vida et al., 2017; Paudel
et al., 2018a). In the case of TRAPPIST-1, the black solid line represents this distribution of observed flare energies while the dashed black line represents the extrapolation of the fitted line up to flare energy of 1035 erg to make it easier to compare with the other two targets. The extrapolation may not necessarily represent the true distribution. Likewise, the dashed lines overplotted on flare energies of 2M0837+2050 and 2M0831+2244 also represent the fitted lines. However, the lack of sufficient data point means they may not be the best representation of the real flare energy distribution of the corresponding targets.
We should note here that TRAPPIST-1 light curves were obtained in short cadence (1 minute) mode while we do not have such light curves for 2M0837+2050 and 2M0831+2244. This is why we did not detect flares of smaller energies that are detected in the TRAPPIST-1 light curve.
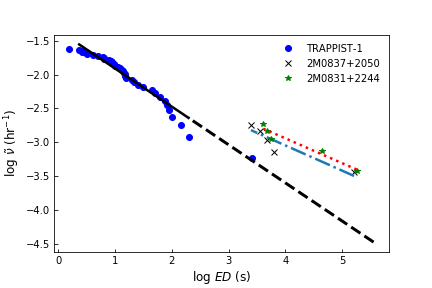
In Figure 10, we compare the flare rates using the EDs of flares.
3.5 X-ray energy emitted during the strongest flare on 2M0837+2050
To understand the relative impact of these superflares on exoplanets, we place these superflares in the solar context using the (Geostationary Operational Environmental Satellite) flare classification scheme. The flare classification scheme (A, B, C, M, X) is based solely on the peak 18 soft X-ray solar flux as observed from Earth, and each letter represents an increased order of magnitude from 10-8 W m-2 to 10-3 W m-2 as observed at 1 AU. In the units of energy emitted per second, A1 flare corresponds to 2.8 1022 erg s-1 and X1 flare corresponds to 2.8 1027 erg s-1 . To estimate the flare energy in the bandpass, we use the energy partition from Osten & Wolk (2015) which estimates that 6% of the bolometric flare energy is emitted in the 18 bandpass for active stars. We do not have such estimates for late-M dwarfs. To estimate the peak flare flux in the band, we also assume that the soft X-ray lightcurve is the same shape as the lightcurve, and find that the peak is approximately 4 1030 erg s-1, corresponding roughly to an X10,000 class flare.
4 Summary and Discussion
We detected strong superflares on three late-M dwarfs: 2M0831+2042 (M7 V), 2M0837+2050 (M8 V) and 2M0831+2244 (M9 V), in K2 long cadence light curves. The strong superflare observed on 2M0831+2042 has an ED of 13.7 hr and has an estimated energy of 1.3 1035 erg. We detected five superflares on 2M0837+2050 with EDs in the range (0.7 - 46.4) hr and estimated energies in the range (5.2 - 350) 1033 erg. Likewise, we also detected five superflares on 2M0831+2244 with EDs in the range (1.2 - 50.21) hr and estimated energies in the range (1.4 - 61) 1033 erg.
2M0837+2050 and 2M0831+2244 now have the highest known superflare rates among late-M dwarfs. 2M0837+2050 is 700 Myr old and 2M0831+2244 also appears to be young as suggested by its tangential velocity estimate. In addition, they are rapidly rotating with periods of 0.1930.000 and 0.2920.001 d respectively, which we detected in their light curves using Lomb-Scargle periodogram. The high flare rates could be the result of strong magnetic dynamos enhanced by rapid rotation. Our results are in tension with those of Mondrik
et al. (2018) who analyzed the flare rates of a sample of 34 mid-to-late M dwarfs. They found that the flare rates are small among the slowest rotators with periods 70 d, but also are small among the fastest rotators with periods 10 d. Maximum flare rates are found among intermediate period rotators with periods of (10 - 70) d.
The rapid rotation rates and hence high flare rates of 2M0837+2050 and 2M0831+2244 could also be the result of their presence in binary systems. Douglas et al. (2017) measured the rotation periods of 677 low-mass stars (1 0.1 ) in the Praesepe cluster by using light curves and found that 50% of the rapidly rotating stars are in binary systems. The sample consisted of both confirmed and candidate binary systems but there is no information regarding binarity of the remaining 0.3 fast rotators. Furthermore, Douglas
et al. (2016) found that almost all 0.3 fast rotating stars in the Hyades cluster, with age comparable to the Praesepe cluster, are in binary systems.
4.1 Flare rates of 700 Myr TRAPPIST-1 like objects
The flare rates of the M8 dwarf 2M0837+2050 are of particular importance for studies which are focused on the atmospheres of planets in the HZ of TRAPPIST-1. This is because both 2M0837+2050 and TRAPPIST-1 have a similar spectral type (M8) but different ages (700 Myr, 7.6 Gyr respectively). We compare the flare frequency distributions of the two targets in Figure 9. The energy of the largest flare on 2M0837+2050 is larger by 2.7 orders of magnitude than the largest flare observed on TRAPPIST-1 and occurs at approximately the same frequency. Our results may provide some guidance as to how large flares could have been on TRAPPIST-1 during its youth. While we do not have enough flares to reliably constrain the flare rates, the observed flares suggest that 1034 erg flares occur on 2M0837+2050 at a 10 times higher rate than on TRAPPIST-1. To be sure, the two M8 stars are not exactly comparable because 2M0837-2050 rotates almost 20 times faster than TRAPPIST-1. In view of this faster rotation, it is hardly surprising that the flare energy on 2M0837+2050 is hundreds of times larger than the largest flare on TRAPPIST-1.
The higher superflare rate of M9 dwarf 2M0831+2244 supports the claims we made in the previous paragraph. Comparison of the tangential velocity of TRAPPIST-1 (60 km s-1) with that of the 2M0831+2244 (21 km s-1) suggests that the latter is a younger object, with an age less than 7.5 Gyr. 2M0837+2050 and 2M0831+2244 have almost identical flare frequency distributions as seen in Figure 9. The small differences between them might be due to differences in the rotation rates and/or the effective temperatures. The larger EW of H emission of 2M0837+2050 is also consistent with a higher flare rate than 2M0831+2244.
In Figure 10, we compare the rates using only the EDs of flares. It suggests that the rates are almost similar for 2M0837+2050 and 2M0831+2244. However, we have only one data point of TRAPPIST-1 for which the ED value overlaps with the EDs of 2M0837+2050 and 2M0831+2244 flares. Though this single data point suggests that flares with comparable EDs occur more frequently on younger targets, we cannot perform any further statistical analysis and conclude anything at this point.
4.2 Particle flux associated with the largest superflare on 2M0837+2050
In Section 3.5, we estimated that the largest superflare from 2M0837+2050 is approximately X10,000 class in the GOES classification scheme of solar flares. For comparison, the Carrington event of 1859, probably the largest solar flare ever recorded, was X45 class(Cliver &
Dietrich, 2013) . Segura et al. (2010) estimate that the Great AD Leo flare (Hawley &
Pettersen, 1991) was X2300 class, and the extreme flare from young M dwarf binary DG CVn that triggered the Swift Burst Alert Telescope was estimated to be X600,000 class (Osten
et al., 2016). Solar flares X10 class have a 100% probability of accompaniment by a CME (Yashiro et al., 2006), but events larger than the Carrington event have never been observed from the Sun and the relationship between CME properties and superflares is not yet known (e.g., Aarnio et al. (2011)). Extending solar scaling relations (Cliver et al., 2012) out to this observationally unconstrained superflare regime, we find that the 10 MeV proton flux expected at 0.02 AU (approximately the location of Trappist-1 d) is 4.9 1011 pfu (proton cm-2 s-1 sr-1). For comparison, the 10 MeV proton flux that Segura et al. (2010) estimated would have impacted a hypothetical HZ planet at 0.16 AU for the Great AD Leo flare was 6 108 pfu, and this proton flux was sufficient to destroy 94% of the O3 column density of a modeled Earth-like planet.
4.3 Comparison of superflare on 2M0837+2050 with that on M2 dwarf GSC 8056-0482 for possible UV flux estimates
It is also instructive to compare the flare we discovered on one of our targets with a flare on another M dwarf, although they differ in their global properties. The superflare which we have discovered on the M8 dwarf 2M0837+2050 is larger by 100 than the 4 1033 erg flare observed on GSC 8056-0482 by Loyd et al. (2018). The latter star (hereafter GSC) differs from our target star 2M0837+2050 in that it is warmer (sp. type = M2, 3440 K; Pecaut &
Mamajek 2013) and younger (40 Myr; Kraus et al. 2014). In view of these differences, we need to exercise caution in making comparisons. The FUV energy of the superflare on GSC was estimated to be 1032.1 erg and is the largest energy flare ever observed in the FUV with the Hubble Space Telescope (HST). Assuming the same ratio (18%: Loyd et al. 2018) of FUV energy to bolometric energy of the GSC flare, we estimate that the FUV energy of our superflare on 2M0837+2050 is 6.3 1034 erg (we do not have the estimate of total bolometric energy of the flare on 2M0837+2050). This suggests that the FUV energy emitted during the superflare on 2M0837+2050 is greater than that on GSC by more than 2.7 orders of magnitude.
Loyd et al. (2018) analyzed FUV flares on 12 M dwarfs in the 40 Myr Tuc-Hor young moving group, with spectral types M0.0-M2.3. They found that the flares on those M dwarfs were 100-1000 more energetic than those on field age (1 - 9 Gyr) M dwarfs. Combining their results with those we obtained in this paper, it is possible that strong flares with FUV energy in excess of 1036 erg can occur on the young 40 Myr M8 dwarfs. If superflares with energies of 1036 ergs occur frequently on young M8 dwarfs, the large amount of UV flux in the superflares may have serious consequences on the atmospheres of planets in HZ including complete loss of O3 column (Segura et al., 2010; Tilley et al., 2017; Youngblood
et al., 2017; Howard
et al., 2018). Such results will be very important to study the environment arount planet-hosting stars like TRAPPIST-1 when they were very young.
4.4 Timescales of planet formation and life on Earth
The median lifetime of circumstellar disks, the planets forming regions, is 3 Myr and the dissipiation rate is slower in case of low mass stars than that of high-mass stars (Williams &
Cieza, 2011). The disk lifetimes of M dwarfs are of the order of 10 Myr. This is inferred from the fact that the dust disk around young M dwarfs are similar to those around T-Tauri stars whose disk life timescales are 10 Myr (Boss, 2006; Pascucci
et al., 2011). On the other hand, the timescale of formation of rocky planets in our solar system is 10-120 Myr and that of gas giants is 5 Myr. A longer disk lifetime of M dwarfs may indicate a different timescale of planet formation around them. (Apai, 2013). It is very likely the M dwarf planets might have already formed at ages of the Praesepe cluster.
On the other hand, the emergence of life also requires a minimum amount of time: in the only system for which we have data, it appears that an interval of some 200 Myr elapsed between the time of Earth formation and the time when the oldest known life emerged (Dodd et al., 2017). If this time-scale is relevant to emergence of life on exoplanets, then the level of flare activity on a star whose age is less than 200 Myr may not be relevant to astrobiology.
The timescale for decay in superflare rate may also set timescale for life emergence. The latter also depends on planet properties such as the presence of magnetic fields.
4.5 How can the superflares be beneficial to studies regarding CMEs associated with stellar flares?
The presence of strong superflares highlights the importance of studying the distribution of magnetic field strengths on late-M dwarfs. Information about field strengths is necessary if we are to determine whether they are strong enough to supress the CMEs associated with the strong superflares. For example, Alvarado-Gómez et al. (2018) estimated that a large-scale dipolar field of strength 75 G is sufficient to supress the escape of the largest solar-like CMEs with kinetic energies of 3 1032 erg. Assuming that the requisite field strength to suppress a CME of a certain kinetic energy (KE) scales in such a way that /8 KE, Mullan et al. (2018) have argued that a global stellar field of 750 G could suffice to suppress CMEs in Trappist-1 with KE = 31034 ergs. Using the same scaling, magnetic fields of order 7.5 kG may be required to suppress CMEs with KE = 31036 ergs. Such supression of energetic CMEs seems possible in some M dwarfs similar to WX UMa on which strong mean magnetic fields of strength 7.0 kG exist (Shulyak et al., 2017). But we do not know the upper limit of the flare energy and the KE of CMEs that can be emitted by an M dwarf of given mass and age. Hence it is important to the study of evolution of M dwarf flares through time to know the maximum flare energies that can be produced by each spectral type at different ages. In addition, we need more simultaneous observations of M dwarf flares at multiple wavelengths to constrain the flare energy distribution, which together with the maximum flare energies will enable us to estimate the total energy budgets received by the planets from their parent stars. Such energies will be valuable inputs to exoplanet atmosphere and climate models. If information can be obtained as to the time which must elapse before life emerges on an exoplanet, then the results of atmosphere and climate models at times could help put constraints on the habitability of planets in the HZ of M dwarfs.
4.6 Possible benefits of superflares to the planets in the HZ of M dwarfs
The superflares could also be beneficial to the planets in the HZ of M dwarfs. In an Earth-like planet orbiting within the classical HZ of a solar-type star or M dwarf, an H/He envelope having mass-fraction (ratio of mass of envelope to mass of core, ) of the order of 1% may lead to very high surface temperatures and pressures unsuitable for the existence of liquid water. However, liquid water can be retained if the H/He envelope mass-fraction can be reduced to 10-3 via photoevaporation or other mechanisms (Owen &
Mohanty 2016 and references therein). In this regard, the superflares may be helpful to strip off the thick H/He envelope if it is present. In addition, the superflares could help in producing haze forming monomers through photolysis of methane, in planets whose atmosphere is dominated by methane. The hazes might shield the planet’s surface from UV radiation which in certain circumstances can be harmful to life to life (Tilley et al., 2017). Moreover, enhancement of photon fluxes is not always harmful to life. Certain UV photons can be beneficial for the onset of life by contributing to generation of the bases which occur in nucleic acids (Airapetian et al., 2016; Ranjan et al., 2017). And as another example of positive consequences of enhanced photon fluxes, we note that the optical photons which are enhanced during flares will increase the effectiveness of oxygenic photosynthesis in a planet lying in the HZ of a flare star (Mullan &
Bais, 2018).
Acknowledgements
The material in this paper is based upon work supported by NASA under award Nos. NNX15AV64G, NNX16AE55G and NNX16AJ22G. Some/all of the data presented in this paper were obtained from the Mikulski Archive for Space Telescopes (MAST). STScI is operated by the Association of Universities for Research in Astronomy, Inc., under NASA contract NAS5-26555. This paper includes data collected by the Kepler mission. Funding for the Kepler mission is provided by the NASA Science Mission directorate. This work has made use of data from the European Space Agency (ESA) mission
Gaia (https://www.cosmos.esa.int/gaia), processed by the Gaia
Data Processing and Analysis Consortium (DPAC,
https://www.cosmos.esa.int/web/gaia/dpac/consortium). Funding for the DPAC
has been provided by national institutions, in particular the institutions
participating in the Gaia Multilateral Agreement. This research has made use of the VizieR catalogue access tool, CDS,
Strasbourg, France. The original description of the VizieR service was
published in A&AS 143, 23. This work made use of the http://gaia-kepler.fun crossmatch database created by Megan Bedell.
References
- Aarnio et al. (2011) Aarnio A. N., Stassun K. G., Hughes W. J., McGregor S. L., 2011, Sol. Phys., 268, 195
- Aigrain et al. (2016) Aigrain S., Parviainen H., Pope B., 2016
- Airapetian et al. (2016) Airapetian V. S., Glocer A., Gronoff G., Hébrard E., Danchi W., 2016, Nature Geoscience, 9, 452
- Alvarado-Gómez et al. (2018) Alvarado-Gómez J. D., Drake J. J., Cohen O., Moschou S. P., Garraffo C., 2018, ApJ, 862, 93
- Apai (2013) Apai D., 2013, Astronomische Nachrichten, 334, 57
- Astropy Collaboration et al. (2013) Astropy Collaboration et al., 2013, A&A, 558, A33
- Barclay et al. (2018) Barclay T., Pepper J., Quintana E. V., 2018, ApJS, 239, 2
- Bochanski et al. (2007) Bochanski J. J., West A. A., Hawley S. L., Covey K. R., 2007, AJ, 133, 531
- Boss (2006) Boss A. P., 2006, ApJ, 643, 501
- Boudreault et al. (2012) Boudreault S., Lodieu N., Deacon N. R., Hambly N. C., 2012, MNRAS, 426, 3419
- Burgasser & Mamajek (2017) Burgasser A. J., Mamajek E. E., 2017, ApJ, 845, 110
- Chambers et al. (2016) Chambers K. C., et al., 2016, preprint, (arXiv:1612.05560)
- Clements et al. (2017) Clements T. D., Henry T. J., Hosey A. D., Jao W.-C., Silverstein M. L., Winters J. G., Dieterich S. B., Riedel A. R., 2017, AJ, 154, 124
- Cliver & Dietrich (2013) Cliver E. W., Dietrich W. F., 2013, Journal of Space Weather and Space Climate, 3, A31
- Cliver et al. (2012) Cliver E. W., Ling A. G., Belov A., Yashiro S., 2012, ApJ, 756, L29
- Crosley & Osten (2018) Crosley M. K., Osten R. A., 2018, ApJ, 862, 113
- Cutri et al. (2003) Cutri R. M., et al., 2003, 2MASS All Sky Catalog of point sources.
- Davenport (2016) Davenport J. R. A., 2016, ApJ, 829, 23
- Dodd et al. (2017) Dodd M. S., Papineau D., Grenne T., Slack J. F., Rittner M., Pirajno F., O’Neil J., Little C. T. S., 2017, Nature, 543, 60 EP
- Douglas et al. (2016) Douglas S. T., Agüeros M. A., Covey K. R., Cargile P. A., Barclay T., Cody A., Howell S. B., Kopytova T., 2016, ApJ, 822, 47
- Douglas et al. (2017) Douglas S. T., Agüeros M. A., Covey K. R., Kraus A., 2017, ApJ, 842, 83
- Dressing & Charbonneau (2015) Dressing C. D., Charbonneau D., 2015, ApJ, 807, 45
- Gagné et al. (2018) Gagné J., et al., 2018, ApJ, 856, 23
- Gaia Collaboration et al. (2018a) Gaia Collaboration Brown A. G. A., Vallenari A., Prusti T., de Bruijne J. H. J., Babusiaux C., Bailer-Jones C. A. L., 2018a, preprint, (arXiv:1804.09365)
- Gaia Collaboration et al. (2018b) Gaia Collaboration et al., 2018b, A&A, 616, A10
- Gershberg (1972) Gershberg R. E., 1972, Ap&SS, 19, 75
- Gillon et al. (2016) Gillon M., et al., 2016, Nature, 533, 221
- Gillon et al. (2017) Gillon M., et al., 2017, Nature, 542, 456
- Gizis et al. (2000) Gizis J. E., Monet D. G., Reid I. N., Kirkpatrick J. D., Liebert J., Williams R. J., 2000, AJ, 120, 1085
- Gizis et al. (2013) Gizis J. E., Burgasser A. J., Berger E., Williams P. K. G., Vrba F. J., Cruz K. L., Metchev S., 2013, ApJ, 779, 172
- Gizis et al. (2017a) Gizis J. E., Paudel R. R., Schmidt S. J., Williams P. K. G., Burgasser A. J., 2017a, ApJ, 838, 22
- Gizis et al. (2017b) Gizis J. E., Paudel R. R., Mullan D., Schmidt S. J., Burgasser A. J., Williams P. K. G., 2017b, ApJ, 845, 33
- Hawley & Pettersen (1991) Hawley S. L., Pettersen B. R., 1991, ApJ, 378, 725
- Howard et al. (2018) Howard W. S., et al., 2018, ApJ, 860, L30
- Howell et al. (2014) Howell S. B., et al., 2014, PASP, 126, 398
- Hunter (2007) Hunter J. D., 2007, Computing In Science & Engineering, 9, 90
- Jenkins et al. (2010) Jenkins J. M., et al., 2010, ApJ, 713, L120
- Kluyver et al. (2016) Kluyver T., et al., 2016, in Loizides F., Schmidt B., eds, Positioning and Power in Academic Publishing: Players, Agents and Agendas. pp 87 – 90
- Kraus et al. (2014) Kraus A. L., Shkolnik E. L., Allers K. N., Liu M. C., 2014, AJ, 147, 146
- Lacy et al. (1976) Lacy C. H., Moffett T. J., Evans D. S., 1976, ApJS, 30, 85
- Liebert & Gizis (2006) Liebert J., Gizis J. E., 2006, PASP, 118, 659
- Loyd et al. (2018) Loyd R. O. P., Shkolnik E. L., Schneider A. C., Barman T. S., Meadows V. S., Pagano I., Peacock S., 2018, ApJ, 867, 70
- Luger et al. (2017) Luger R., et al., 2017, Nature Astronomy, 1, 0129
- Lund et al. (2015) Lund M. N., Handberg R., Davies G. R., Chaplin W. J., Jones C. D., 2015, ApJ, 806, 30
- Magnier et al. (2016) Magnier E. A., et al., 2016, preprint, (arXiv:1612.05242)
- Mighell & Plavchan (2013) Mighell K. J., Plavchan P., 2013, AJ, 145, 148
- Miller et al. (2001) Miller C. J., et al., 2001, AJ, 122, 3492
- Mondrik et al. (2018) Mondrik N., Newton E., Irwin D. C. J., 2018, preprint, (arXiv:1809.09177)
- Mullan & Bais (2018) Mullan D. J., Bais H. P., 2018, ApJ, 865, 101
- Mullan et al. (2018) Mullan D. J., MacDonald J., Dieterich S., Fausey H., 2018, preprint, (arXiv:1811.04149)
- Newton et al. (2016) Newton E. R., Irwin J., Charbonneau D., Berta-Thompson Z. K., Dittmann J. A., West A. A., 2016, ApJ, 821, 93
- Oliphant (2015) Oliphant T. E., 2015, Guide to NumPy, 2nd edn. CreateSpace Independent Publishing Platform, USA
- Osten & Wolk (2015) Osten R. A., Wolk S. J., 2015, ApJ, 809, 79
- Osten et al. (2012) Osten R. A., Kowalski A., Sahu K., Hawley S. L., 2012, ApJ, 754, 4
- Osten et al. (2016) Osten R. A., et al., 2016, ApJ, 832, 174
- Owen & Mohanty (2016) Owen J. E., Mohanty S., 2016, MNRAS, 459, 4088
- Pascucci et al. (2011) Pascucci I., et al., 2011, in Johns-Krull C., Browning M. K., West A. A., eds, Astronomical Society of the Pacific Conference Series Vol. 448, 16th Cambridge Workshop on Cool Stars, Stellar Systems, and the Sun. p. 469 (arXiv:1101.1913)
- Paudel et al. (2018a) Paudel R. R., Gizis J. E., Mullan D. J., Schmidt S. J., Burgasser A. J., Williams P. K. G., Berger E., 2018a, ApJ, 858, 55
- Paudel et al. (2018b) Paudel R. R., Gizis J. E., Mullan D. J., Schmidt S. J., Burgasser A. J., Williams P. K. G., Berger E., 2018b, ApJ, 861, 76
- Pecaut & Mamajek (2013) Pecaut M. J., Mamajek E. E., 2013, ApJS, 208, 9
- Perez & Granger (2007) Perez F., Granger B. E., 2007, Computing in Science and Engineering, 9, 21
- Ranjan et al. (2017) Ranjan S., Wordsworth R., Sasselov D. D., 2017, ApJ, 843, 110
- Reiners & Basri (2009) Reiners A., Basri G., 2009, ApJ, 705, 1416
- Reiners et al. (2018) Reiners A., et al., 2018, A&A, 612, A49
- Ribas et al. (2016) Ribas I., et al., 2016, A&A, 596, A111
- Ricker (2014) Ricker G. R., 2014, Journal of the American Association of Variable Star Observers (JAAVSO), 42, 234
- Schmidt et al. (2014) Schmidt S. J., et al., 2014, ApJ, 781, L24
- Schmidt et al. (2015) Schmidt S. J., Hawley S. L., West A. A., Bochanski J. J., Davenport J. R. A., Ge J., Schneider D. P., 2015, AJ, 149, 158
- Segura et al. (2010) Segura A., Walkowicz L. M., Meadows V., Kasting J., Hawley S., 2010, Astrobiology, 10, 751
- Shulyak et al. (2017) Shulyak D., Reiners A., Engeln A., Malo L., Yadav R., Morin J., Kochukhov O., 2017, Nature Astronomy, 1, 0184
- Theissen (2018) Theissen C. A., 2018, ApJ, 862, 173
- Tilley et al. (2017) Tilley M. A., Segura A., Meadows V. S., Hawley S., Davenport J., 2017, preprint, (arXiv:1711.08484)
- Tonry et al. (2012) Tonry J. L., et al., 2012, ApJ, 750, 99
- Van Grootel et al. (2018) Van Grootel V., et al., 2018, ApJ, 853, 30
- Vida et al. (2017) Vida K., Kővári Z., Pál A., Oláh K., Kriskovics L., 2017, ApJ, 841, 124
- Vinícius et al. (2018) Vinícius Z., Barentsen G., Hedges C., Gully-Santiago M., Cody A. M., 2018, KeplerGO/lightkurve, doi:10.5281/zenodo.1181928, http://doi.org/10.5281/zenodo.1181928
- West et al. (2011) West A. A., et al., 2011, AJ, 141, 97
- Williams & Cieza (2011) Williams J. P., Cieza L. A., 2011, ARA&A, 49, 67
- Yashiro et al. (2006) Yashiro S., Akiyama S., Gopalswamy N., Howard R. A., 2006, ApJ, 650, L143
- Youngblood et al. (2017) Youngblood A., et al., 2017, ApJ, 843, 31