22email: iain.mcdonald-2@jb.man.ac.uk 33institutetext: Bundesdeutsche Arbeitsgemeinschaft für Veränderliche Sterne e.V. (BAV), Berlin, Germany;
33email: klaus.bernhard@liwest.at 44institutetext: American Association of Variable Star Observers (AAVSO), Cambridge, MA, USA 55institutetext: INAF – Osservatorio Astronomico, 64100 Italy 66institutetext: INFN – Sezione di Perugia, Italy 77institutetext: Instituut voor Sterrenkunde, Celestijnenlaan 200D, bus 2401, 3001 Leuven, Belgium; 77email: david.gobrecht@kuleuven.be
Interplay between pulsation, mass loss, and third dredge-up: More about Miras with and without technetium††thanks: Tables LABEL:taba1 and LABEL:taba2 are only available in electronic form at the CDS via anonymous ftp to cdsarc.u-strasbg.fr (130.79.128.5) or via http://cdsweb.u-strasbg.fr/cgi-bin/qcat?J/A+A/.
Abstract
Context. We follow-up on a previous finding that AGB Mira variables containing the third dredge-up indicator technetium (Tc) in their atmosphere form a different sequence of colour as a function of pulsation period than Miras without Tc. A near- to mid-infrared colour such as is a good probe for the dust mass-loss rate of the stars. Contrary to what might be expected, Tc-poor Miras show redder colours (i.e. higher dust mass-loss rates) than Tc-rich Miras at a given period.
Aims. Here, the previous sample is extended and the analysis is expanded towards other colours and dust spectra. The most important aim is to investigate if the same two sequences can be revealed in the gas mass-loss rate.
Methods. We analysed new optical spectra and expanded the sample by including more stars from the literature. Near- and mid-IR photometry and ISO dust spectra of our stars were investigated where available. Literature data of gas mass-loss rates of Miras and semi-regular variables were collected and analysed.
Results. Our results show that Tc-poor Miras are redder than Tc-rich Miras in a broad range of the mid-IR, suggesting that the previous finding based on the colour is not due to a specific dust feature in the 22 band. We establish a linear relation between and the gas mass-loss rate. We also find that the 13 feature disappears above mag, corresponding to . No similar sequences of Tc-poor and Tc-rich Miras in the gas mass-loss rate vs. period diagram are found, most probably owing to limitations in the available data.
Conclusions. Different hypotheses to explain the observation of two sequences in the vs. diagram are discussed and tested, but so far, none of them convincingly explains the observations. Nevertheless, we might have found an hitherto unknown but potentially important process influencing mass loss on the TP-AGB.
Key Words.:
stars: AGB and post-AGB – stars: late-type – stars: evolution – stars: mass-loss – stars: oscillations1 Introduction
For low- to intermediate-mass stars , the final stage of energy production through nuclear burning is the asymptotic giant branch (AGB). In this phase, stars become very luminous, and their atmospheres are very cool. Three important processes characterise stars on the AGB: i) pulsations of the outer atmosphere; ii) internal nucleosynthesis and mixing; and iii) mass loss.
The pulsations have their origin deep within the convective envelope of the star and cause it to appear strongly variable in the visual range of the spectrum. The long-period variables (LPVs), consisting of Miras, semi-regular (SRVs), and irregular (Lb) variables, pulsate on timescales of 80 to more than 1000 days and have visual amplitudes larger than 0.1 mag. It has been shown that LPVs follow period-luminosity sequences depending on their pulsation mode (Wood et al.,, 1999; Whitelock et al.,, 2008; Riebel et al.,, 2010; Wood,, 2015). Mira variables almost certainly pulsate in the fundamental mode, whereas SRVs tend to pulsate in the first or higher overtones (Trabucchi et al.,, 2017). It should be noted, however, that semi-regular variables of type a (SRa) have comparatively regular light curves and probably pulsate in the fundamental mode as well: their amplitude is only too low for them to be classified as Miras (, Samus et al.,, 2017).
The elemental abundances at the visible photosphere of evolved AGB stars are altered by the mixing of nuclear-burning products to the outer layers of the star following thermal pulses (TPs). This process is called third dredge-up (3DUP) and typically occurs several times on the AGB. One important nuclear product is carbon, which is usually less abundant than oxygen in the stellar atmosphere but can be enriched so much by 3DUP that it becomes more abundant (by number of atoms) than oxygen. This has important consequences on the spectral appearance of the stars because the more abundant species will determine which molecules, oxygen- or carbon-bearing, will form (Cristallo et al.,, 2007; Lloyd Evans,, 2010). Intermediate-mass stars may avoid becoming carbon-rich by converting carbon to nitrogen in the CN-cycle at the hot base of the convective envelope. This process is known as hot bottom burning (HBB; e.g. Sackmann & Boothroyd,, 1992). Another result of HBB is that these stars can become strongly enriched in lithium (García-Hernández et al.,, 2013).
In addition to carbon, heavy elements are synthesised deep within the star by the slow neutron-capture process (s-process). The element technetium (Tc) is an important indicator of s-process and 3DUP because it has only radioactively unstable isotopes. The longest-lived isotope that is produced in the s-process, 99Tc, has a half-life of years, much shorter than the stellar lifetime. Absorption lines of Tc can thus be used to distinguish AGB stars that have produced Tc in situ and undergone a 3DUP event from those that have not (e.g. Uttenthaler et al.,, 2007). Hence, Tc-poor is synonymous for stars before the 3DUP stage (pre-3DUP), whereas Tc-rich is synonymous for stars that have undergone 3DUP events (post-3DUP).
The process that eventually determines the fate of the star is mass loss from its surface, rather than nuclear burning in its interior. The stellar pulsations are thought to play an important role in the mass-loss process because pulsation-induced shock waves lift gas to cooler, but still dense layers of the atmosphere where dust grains can form and condense. The dust grains then absorb or scatter photons from the stellar surface, so gaining momentum away from the star. They then collide with atoms and molecules in the gas phase, thus transferring momentum to them and triggering the outflow (Höfner,, 2008). While a relation between pulsation and mass loss is widely accepted, the details of the mass-loss process are still a matter of debate in particular for oxygen-rich stars (Willson,, 2000; Höfner,, 2008; Eriksson et al.,, 2014; Höfner et al.,, 2016). In general, the poor knowledge of the mass-loss process is one of the major uncertainties in the modelling of AGB star evolution (e.g. Straniero et al.,, 2006). For details and the current understanding of AGB mass loss, we refer to the recent review by Höfner & Olofsson, (2018).
Following from this description, the three processes (pulsation, 3DUP, and mass loss) influence each other. Indeed, some correlation between pulsation period and mass-loss rate has been found. For example, McDonald & Zijlstra, (2016) find that a threshold period of d exists above which the dust mass-loss rate, as indicated by a near- to mid-infrared colour, increases significantly, while Glass et al., (2009) find a similar discontinuity using different mid-IR bands. McDonald & Zijlstra, (2016) also demonstrated that the mass-loss rate is less well correlated to the luminosity of nearby cool giant stars, indicating that radiation pressure on dust has little influence on the mass-loss rate at this evolutionary stage. This is important because most stellar evolution calculations assume a Reimers-like mass-loss law (Reimers,, 1975), which is directly related to the stellar luminosity.
A second increase in mass-loss rate as a function of pulsation period is found between 300 and 400 d of period (Vassiliadis & Wood,, 1993; Matsunaga et al.,, 2005). Probably, this transition coincides with the timescale for dust to effectively form and grow, so that the radiation pressure on dust grains can drive the mass loss. However, a more linear correlation between mass-loss rate and period of Miras is not always obvious, see Jura et al., (1993), for instance. Such a correlation may become apparent only when Miras with very long pulsation period ( d) are included (Groenewegen et al.,, 2009) or when the selection is restricted to C-rich Miras (Whitelock et al.,, 2006). Most recently, Goldman et al., (2016) have found only a weak dependence of mass-loss rate on pulsation period for intermediate-mass (OH/IR) stars in the late super-wind phase.
The relation between chemistry (3DUP) and mass loss has been investigated by a few works. For example, Groenewegen & De Jong, (1998) found that S-type Miras follow the same period – gas mass-loss rate relation as C-type Miras. However, gas mass-loss rates derived from radio CO rotational lines have large uncertainties (Ramstedt et al.,, 2008), and effects of 3DUP become visible in a stellar spectrum before it becomes an S-type star (e.g. Uttenthaler et al.,, 2011).
In a previous work (Uttenthaler,, 2013, hereafter Paper I), it was shown that Mira variables form two separate sequences in the pulsation period versus colour diagram (henceforth called the vs. diagram) if a distinction is made for the presence of Tc. Here, is the 22 band of the Wide-field Infrared Survey Explorer (WISE) space observatory (Wright et al.,, 2010). The colour is an indicator of the dust mass-loss rate of the stars. Such a clear correlation between period and mass-loss rate has previously not been found in these stars. Interestingly, at a given period, the pre-3DUP Miras were found to have a higher dust mass-loss rate than the post-3DUP Miras. This result is somewhat counter-intuitive because one would expect the post-3DUP Miras to be more evolved than the pre-3DUP Miras, thus that they would have higher mass-loss rates. So far, there is no satisfactory explanation for these observations.
This paper is a follow-up work on Paper I. It is motivated along several lines. First of all, since the publication of Paper I, the sample was expanded by analysing new observations. Moreover, more Tc-rich SRVs have been included in the present work because it was noted in Paper I that these stars form a sequence of increasing colour at short periods ( d). SRVs probably represent an evolutionary stage before a star switches to the fundamental pulsation mode of the Mira phase (Lebzelter & Hron,, 1999; Trabucchi et al.,, 2017), making a comparison interesting. Second, the observations from Paper I were analysed and discussed in more detail, for example by presenting diagrams that involve other combinations of near- to mid-IR colours, as well as Infra-red Space Observatory (ISO) dust spectra of stars with and without Tc.
The most important motivation comes from the fact that the colour used in the previous work is only an indicator of the dust mass-loss rate. Basically, probes the dust column density, which can be translated into a dust mass-loss rate if the expansion velocity is known. This can be measured from rotational lines of CO in the gas phase, for instance, which are observable at radio wavelengths. More importantly, dust is only a minor (although important) fraction of the total mass lost from a cool giant star; most of the mass is lost in the form of gas. It may be assumed that the gas mass-loss rate () equals the total mass-loss rate. The latter assumption is justified by the fact that typical dust-to-gas mass ratios in AGB stars, depending on the individual star, are of the order 10-4-10-2. A question that naturally arises is whether the two sequences identified in the vs. diagram also show up if the gas mass-loss rate is inspected instead of the dust column density. Thus, we here aim to expand our analysis to the gas mass-loss rate and its relation to the pulsation period on the one hand, and the occurrence of 3DUP on the other. This could help to identify the underlying processes that cause the two separate sequences in the vs. diagram.
The paper is structured in the following way: In Sect. 2 the data used in this work are described. These data are analysed in Sect. 3, where results are also presented. Hypotheses for explaining the observations are discussed in Sect. 4. In Sect. 5 our results are applied to a sample of Galactic bulge Miras to search for the occurrence of 3DUP in that stellar population. Finally, the results and conclusions are summarised in Sect. 6.
2 Data
The data set compiled for Paper I also forms the basis of the present paper. The sample was extended in two ways: First, 25 Tc-rich SRVs were added from the works of Little et al., (1987), Van Eck et al., (1998), Lebzelter & Hron, (1999), Van Eck & Jorissen, (1999), and Van Eck et al., (2000). Second, we searched the spectra from the ESO Large Programme X-shooter Spectral Library (XSL; Chen et al.,, 2014) for AGB stars that could be analysed for their Tc content.
2.1 Stars from the X-shooter library
All available Phase-3 science-ready spectra of M-, S-, and C-type stars observed in the XSL were downloaded from the ESO archive. These spectra were obtained with the X-shooter spectrograph (Vernet et al.,, 2011) mounted to UT2 of ESO’s Very Large Telescope on Cerro Paranal, Chile. Dwarf and supergiant stars were excluded from the study (as expected, none of them was found to exhibit the Tc lines in the subsequent analysis). Of the remaining stars, many had a signal-to-noise ratio (S/N) in the wavelength range of interest (4200 – 4300 Å) that was too low to decide on the presence or absence of the Tc lines.
The spectra were first shifted to the rest-frame by measuring the radial velocity in the wavelength range 5365 – 5435 Å, using a cross-correlation technique. This interval was chosen because the very red sample stars emit much more flux here than in the vicinity of the Tc lines. After correcting for the radial velocity shift, we searched for the Tc i lines at 4238.191, 4262.270, and 4297.058 Å (Bozman et al.,, 1968) by visually inspecting and comparing the spectra and by applying the flux-ratio method introduced by Uttenthaler et al., (2007). In this method, the mean flux in a narrow region around a nearby quasi-continuum point is divided by the mean flux in a few wavelength points around the laboratory wavelengths of the Tc lines. Tc-rich stars are identified by having enhanced ratios in all three lines, clearly separating them from Tc-poor ones. In principle, there are subordinate lines of Tc at even shorter wavelengths that have been identified previously (Merrill & Greenstein,, 1956), but these were not analysed here because they would yield little additional information due to the low flux of the stars and the comparably low spectral resolution.
The XSL spectra have a resolving power of at the wavelength of the Tc lines, which is lower than what has previously been used to determine the presence of Tc lines in red giant stars. Although already somewhat at the limit of viability, this resolution is still sufficient to distinguish stars with Tc from those without. This is demonstrated in Fig. 1, where a portion of the spectrum of the Miras R Cha and CM Car is shown around the 4262.270 Å Tc line. The vertical dotted line indicates the laboratory wavelength of this transition. Clearly, R Cha ( d, ) has an absorption at the wavelength of the Tc line, whereas CM Car ( d, ) lacks this line. Except for this, the spectra are very similar. The small flux excess in the quasi-continuum point of R Cha seen here may influence the flux ratio determined for this particular line, but the classification into Tc-poor and Tc-rich is always done based on all three lines and on visual inspection of the spectra. This pair of Miras with comparable pulsation periods illustrates the strongly differing colours of Tc-rich and Tc-poor stars (cf. Paper I).

Eventually, we were able to decide on the presence of Tc in 18 giant stars with high enough S/N. These stars were added to the original sample of Paper I and are identified by reference 15 in Col. 3 of Table LABEL:taba1. Two of the stars in the XSL sample are located in the Large Magellanic Cloud (LMC), namely SHV 0520261-693826 (abbreviated SHV 0520 in Table LABEL:taba1) and HV 12667. Thus, these are the first oxygen-rich stars outside the Milky Way Galaxy whose Tc content and hence 3DUP activity has been determined. While SHV 0520 does contain Tc in its atmosphere, HV 12667 does not. HV 12667 shows a 6708 Å Li line of significant strength, thus is likely an intermediate-mass () AGB star that undergoes HBB.
Furthermore, we also found that the C-type stars X Cnc, HD 198140, and IRAS 10151-6008 do not show lines of Tc. This confirms the result by Little et al., (1987) for X Cnc. Hence, these stars are extrinsic carbon stars that owe their carbon enrichment to mass transfer from a now extinct binary companion. Since we aim at investigating genuine AGB stars and their mass-loss and pulsation properties, we excluded these stars from further analysis. The carbon star Y Hya was also observed by XSL, but the S/N of the spectrum is too low to decide on the presence of Tc.
Finally, the S-type star SU Mon is contained in XSL and its spectrum has a very high S/N. However, we were unable to determine the presence of Tc because its spectral lines appear to be extremely broadened for an unknown reason. IR photometry of SU Mon suggests that it is an intrinsic S-star (Groenewegen,, 1993), but since we are unable to confirm this with spectral observations, this star was also excluded from the sample.
The data of the new sample stars such as pulsation period, near-IR magnitudes, and spectral types have been collected in the same fashion as was done for Paper I. We refer to Sect. 2 of that paper for details. For most of the new stars, J- and K-band magnitudes were available only from the Two Micron All Sky Survey (2MASS) catalogue (Skrutskie et al.,, 2006), whereas for many of the sample stars of Paper I, measurements at two or more epochs were available. We also included observations in the 65 and 90 bands of the Akari satellite (Murakami et al.,, 2007) to increase the wavelength coverage by the data and to improve the data quality at the long-wavelength end compared to Infrared Astronomical Satellite (IRAS, Neugebauer et al.,, 1984) data. Throughout the paper, magnitudes are stated up to the third digit after the decimal point, as in the catalogues, even if the accuracy due to the stellar variability is certainly poorer than that.
The collected data are presented in Table LABEL:taba1 in the appendix. This table supersedes the one from Paper I published at the CDS. The extended sample contains 18 new stars from XSL and 25 Tc-rich SRVs to give a new total of 240 stars, or a sample size increase of % compared to Paper I.
2.2 Mass-loss rates from radio CO observations
In order to satisfy the main motivation of this work, that is, to determine whether the two separate sequences of Miras can also be revealed if the gas mass-loss rate is used instead of a dust mass-loss rate indicator, we also collected such measurements of AGB stars from the literature. Because we are interested in measurements that are independent from IR photometry, we only collected gas mass-loss rates determined from radio CO rotational lines, while those obtained from dust radiative transfer models were neglected. In total, data of 135 Mira stars with known period were collected in Table LABEL:taba2. This is a comprehensive but by no means complete sample. For each star, preference was given to the most recent mass-loss rate determination in the hope that more recent observations would be more sensitive and more recent works would apply more sophisticated methods for determining the rates. The listed rate might not be the most accurate for each individual star, but this procedure was deemed advantageous for the sample as a whole. Nevertheless, for stars where more than one measurement was found in the literature, usually these agreed reasonably well.
Data for SR and Lb variables were adopted only from the list of Olofsson et al., (2002), which contains 65 stars. This was preferred because this is a homogeneous analysis of a sizeable sample, whereas a literature compilation would be more inhomogeneous. These data are not reproduced in Table LABEL:taba2, which contains only data of Mira stars. Instead, we refer to Table 3 of Olofsson et al., (2002). Pulsation periods of the stars have been updated, in particular, with data from the All Sky Automated Survey (ASAS, Pojmanski,, 1997). Since there appears to be no real difference between SRV and Lb (Lebzelter & Obbrugger,, 2009), we refer to this simply as the SRV sample.
It should be mentioned that despite all the care taken, CO mass-loss rate determinations suffer from a number of uncertainties. These trace back to uncertainties in distance (hence luminosity), inhomogeneities in the outflow (clumpiness, asymmetries), the dependence of the CO:H2 ratio on the chemical type and metallicity, the derivation of CO mass-loss rate from the observations, and variable dissociation by interstellar UV radiation. Ramstedt et al., (2008) estimated that these determinations are uncertain to within a factor of three.
3 Analysis and results
3.1 Miras in the vs. diagram
Figure 2 shows the updated version of the vs. diagram presented in Paper I. Most of the newly added stars confirm the separation of Tc-poor and Tc-rich Miras reported earlier. Miras with periods d will have masses (Feast,, 2009) and are thus expected to never undergo 3DUP. In the period interval d, the Tc-poor Miras are clearly redder than the Tc-rich ones, likely indicating a higher (dust) mass-loss rate at a given period. This is supported by the mean colour shown in Fig. 2.
Tc-rich Miras appear in substantial numbers only above a period of d. This may be used to infer the age of these stars and hence the initial mass required for a star to experience 3DUP during its AGB evolution.
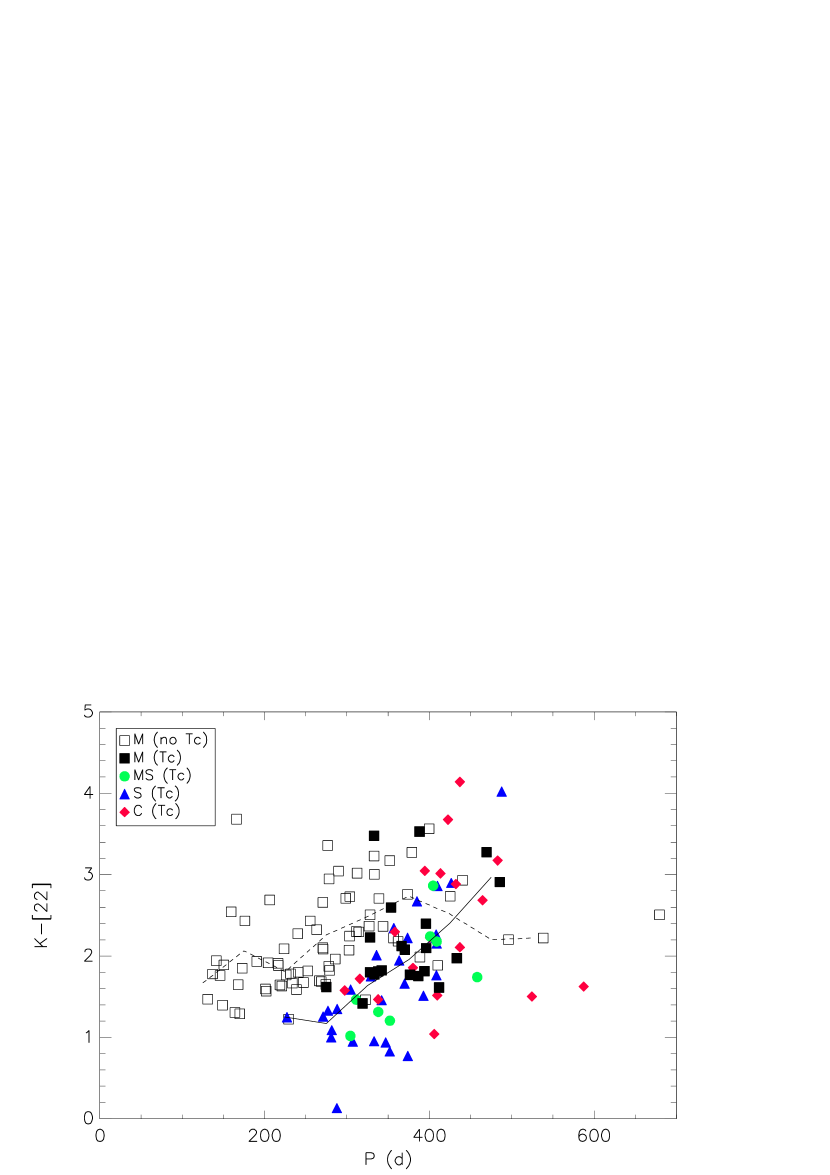
It is useful to discuss a few outliers in Fig. 2 to understand their physical origin. As noted in Paper I, the stars R Cen, R Nor, and possibly W Hya, are intermediate-mass star candidates undergoing HBB. The Tc-poor object at d is the LMC star HV 12667 and is newly added to the sample from XSL observations. As mentioned in Sec. 2.1, this star has a strong Li line, indicating that it is an intermediate-mass star undergoing HBB similar to those identified by Smith et al., (1995) in the Magellanic Clouds. These few stars are the reason why the mean colour of the Tc-poor stars is lower than that of Tc-rich ones at d. As has been shown by García-Hernández et al., (2013), intermediate-mass stars on the early AGB have high Li abundances that are accompanied by weak or no s-process element enhancements because HBB is strongly activated during the first TPs, but the 22Ne neutron source needs many more TPs to be efficiently activated. Moreover, more 3DUP episodes are needed for the s-elements to become detectable at the stellar surface. In addition, the Tc abundance in intermediate-mass stars may be slightly reduced because of the reduced effective half-life time of 99Tc at temperatures in excess of K (Schatz,, 1983; Mathews et al.,, 1986).
Tc-rich Mira variables that are confirmed to be members in a binary system, such as Cet and R Aqr (Whitelock,, 1987), appear to be outliers in the sense that they have redder colours than other Tc-rich Miras at comparable periods. These stars have been excluded from computing the run of the mean colour (dashed and solid lines). W Aql is a binary AGB star as well, but it does not deviate so significantly from the sequence of the other stars, although it is the reddest S-type Mira and the second-reddest star in the whole sample. On the other hand, the Tc-poor outlier R Cet, which has been mentioned in Paper I, might also be a binary star. It is the reddest star with a period shorter than 200 d. The unusually high amount of dust could be caused by a binary companion. The two longest-period carbon stars LX Cyg and BH Cru are blue outliers, most probably because they just recently turned into carbon stars (Lloyd Evans,, 1985; Uttenthaler et al.,, 2016).
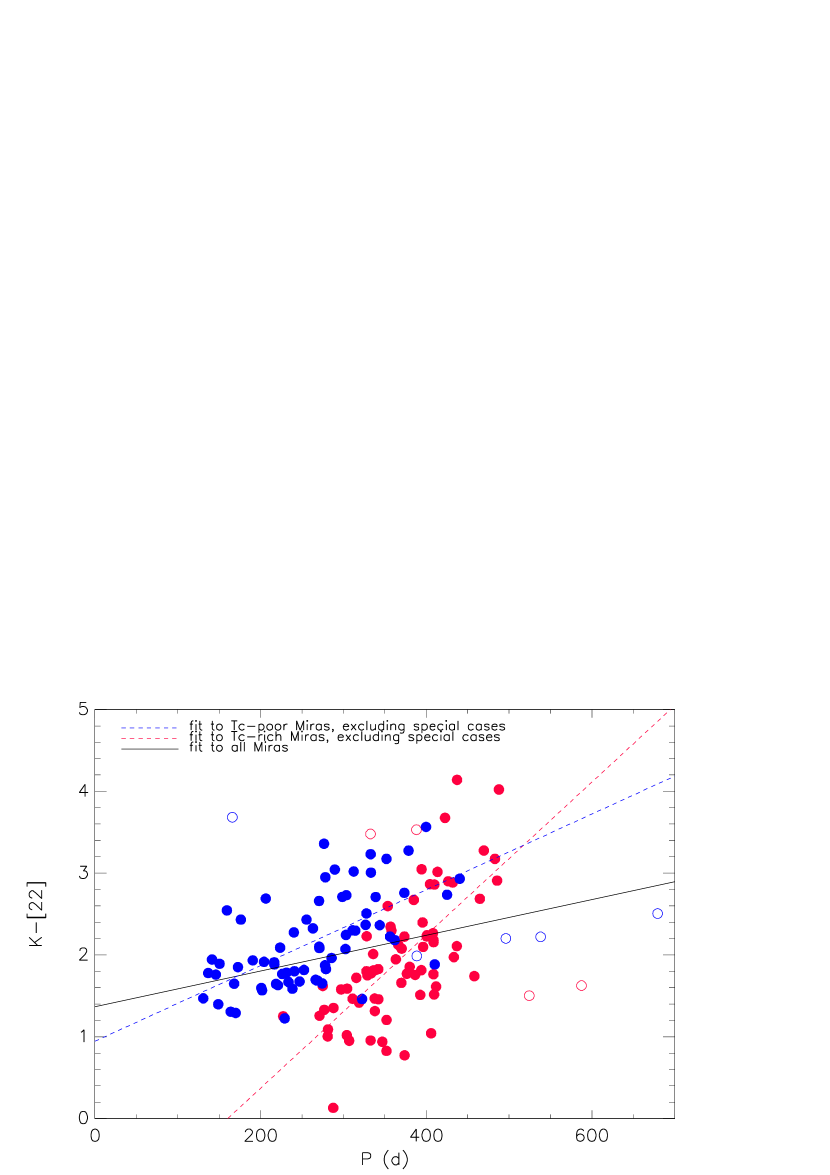
In the upper panel of Fig. 3 we show linear least-squares fits to the sub-samples of Tc-poor (filled blue circles) and Tc-rich (filled red circles) Miras, respectively. In this plot, the stars are not differentiated by their spectral types. This figure demonstrates very clearly how well the two groups are separated. The outliers mentioned above were excluded from the fits (open red and blue circles, respectively). The linear fit to the Tc-rich Miras has a much steeper slope than that to the Tc-poor ones. The two fits formally cross at d, but the longest-period Tc-poor Mira that is not a hot bottom burner is at d. It is also noteworthy that the linear fit to all Mira stars has a quite shallow slope. Thus, without making a distinction for the Tc content, the correlation between pulsation period and dust mass-loss rate seems weak. However, for the two separate groups, the correlation becomes very strong. Table 1 summarises the slopes, intercepts, and correlation coefficients of the three linear fits plotted in the upper panel of Fig. 3.
| Sample | Slope | Intercept | |
|---|---|---|---|
| All Miras | 0.298 | ||
| Tc-poor | 0.612 | ||
| Tc-rich | 0.696 |
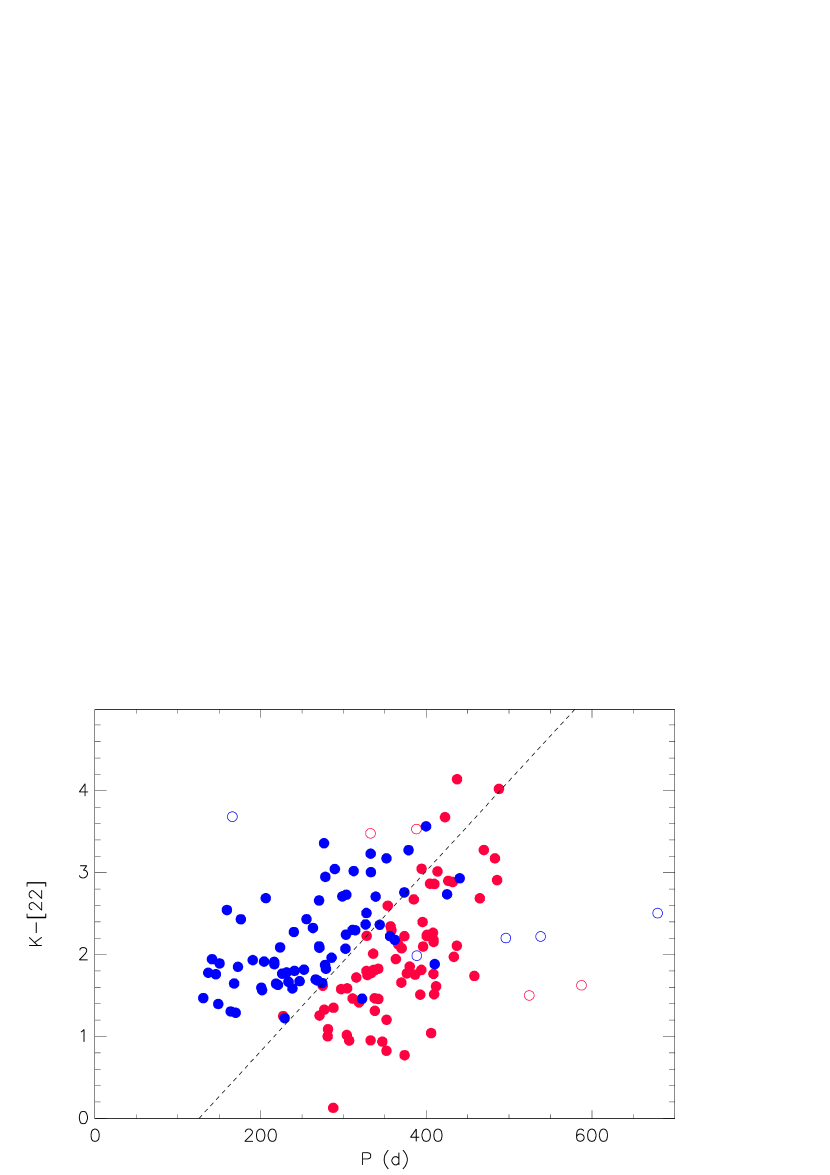
Tc-poor and Tc-rich Miras mainly occupy two different regions in the vs. diagram, and we note that the transition is very sharp. We can thus construct a straight line that best separates the two groups. An amoeba routine was used to find slope and intercept of the line at which the accuracy, as defined for binary tests (i.e. the probability that a randomly chosen instance will be correct), becomes maximal. The visually defined line of Paper I was used as starting point. The optimisation routine yields the relation
| (1) |
Out of the 73 Tc-poor Miras, 62 are above this line, and out of the 78 Tc-rich ones, 70 are below the line. This yields an accuracy of (outliers discussed above were not excluded). Of the stars that are on the ”wrong” side of the line, many miss the line only by a very narrow margin. The lower panel of Fig. 3 illustrates the regions that are occupied by the two groups of Miras and that are separated by the (dashed) line of Eq. 1. In Sect. 5 we use this separating line to investigate how common 3DUP is among Galactic bulge Miras.
3.2 Other combinations of filters
The behaviour of Tc-poor and Tc-rich Miras could be unique to the colour if the band covered a particular mid-IR dust feature that is very sensitive to stellar atmospheric composition, for example, or to other parameters that could be influenced by 3DUP. The filter of WISE has its peak sensitivity between (Wright et al.,, 2010).
A few dust features fall in this range. One of them is the 23 feature of crystalline silicates in oxygen-rich stars, but this reaches only an intensity of a few percent of the local continuum flux (Jones et al.,, 2012). Another feature is that of FeO at 20 , which may be present in metal-poor, oxygen-rich stars (McDonald et al.,, 2010; Posch et al.,, 2002). Finally, the so-called 21 feature, which peaks at (Volk et al.,, 1999), falls in the filter. This feature has been associated with TiC as carrier (von Helden et al.,, 2000). However, it has been observed only in C-rich post-AGB stars and is thus unlikely to play an important role in our stars, many of which are O rich. Nevertheless, we also inspected other combinations of near- to mid-IR colours that were collected in Table LABEL:taba1.
Two examples are shown in Fig. 4. The upper panel of this figure shows the vs. diagram, with being the 90 band of the Akari satellite. The lower panel shows the colour as a function of period. Here, is the time-averaged flux measured in the 2.2 band of the Diffuse Infrared Background Experiment (DIRBE) on board the Cosmic Background Explorer (COBE, Price et al.,, 2010), while the 18 flux comes from Akari. The number of stars in this plot is reduced because on the one hand, only a few of our sample stars are included in the data set of Price et al., (2010), and on the other hand, very bright stars are saturated in Akari. Still, the band data are expected to be of high quality because many individual measurements distributed over a number of pulsation cycles within the 3.6 years time of DIRBE observations have been averaged. Both panels broadly reproduce what is found in the colour (Fig. 2): At a given pulsation period, Tc-poor Miras tend to have a higher near- to mid-IR colour index than Tc-rich Miras, even among a modest number of stars.

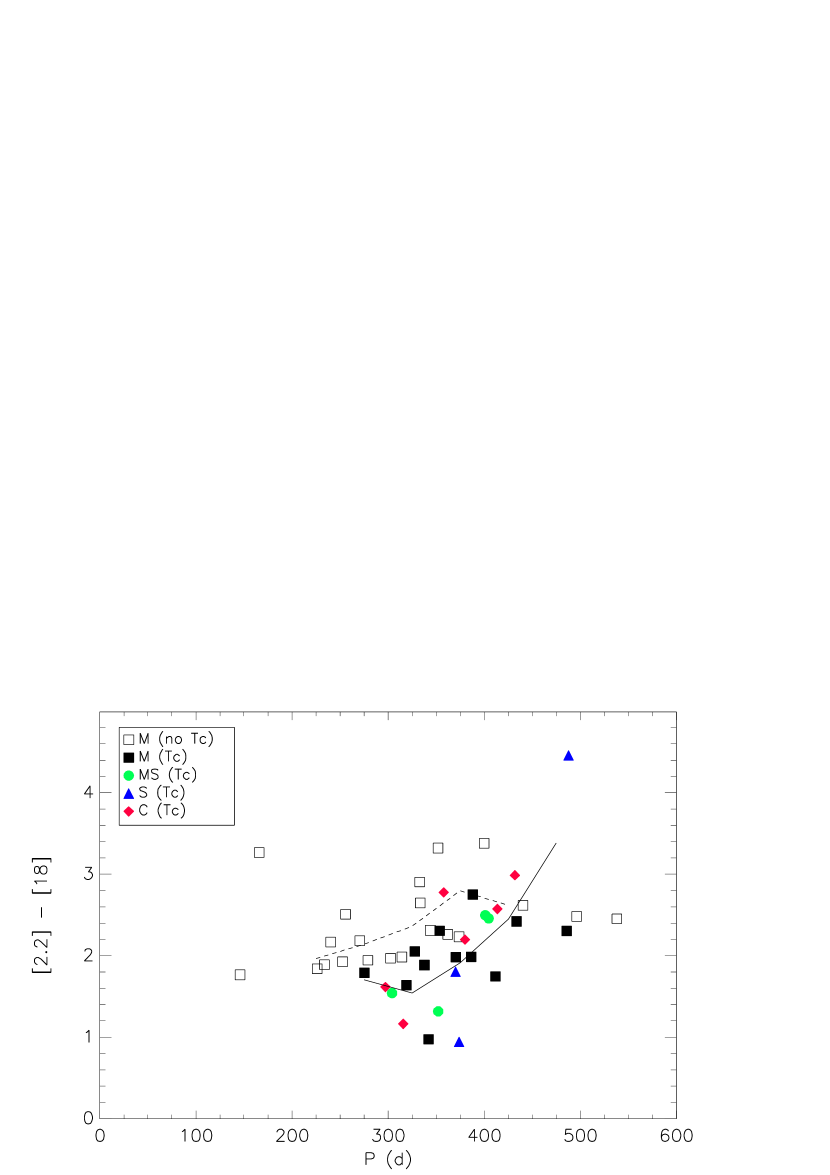
We thus can establish that Tc-poor Miras have a higher near- to mid-IR excess than Tc-rich Miras over a wide range of the mid-IR region. This means that the observed separation is not related to a particular mid-IR dust feature, but rather related to a general difference in the intensity of the mid-IR emission.
3.3 ISO dust spectra
3.3.1 General dust emission
The conclusion of the previous section can be further substantiated by inspecting broad-band dust spectra of stars in the two groups. The dust spectra of nearby AGB stars obtained with the Short Wavelength Spectrometer (SWS) on board ISO cover the range . These spectra, processed and renormalized in a uniform manner, have been published by Sloan et al., 2003b 111https://users.physics.unc.edu/gcsloan/library/swsatlas/atlas.html. Unfortunately, there is little overlap between the ISO sample and the sample of AGB stars with information on Tc content discussed here. Nevertheless, interesting conclusions can be drawn already from this limited overlap.
In particular, it is insightful to compare ISO dust spectra of Tc-poor and Tc-rich Miras with similar pulsation periods. As an example, this is done for one such pair, RR Aql and R Hya, in Fig. 5. The short-wavelength end of the spectra is longward of the K band, therefore no direct scaling of the spectra to the same K-band flux is possible. Therefore, the flux maxima of the spectra between 3 and 4 were normalised to 1.0 for comparison purposes (the flux shortward of 3 is reduced by the CO first-overtone band). The aim here is just to illustrate the difference in flux between near- and mid-IR wavelengths, and the chosen normalisation should be sufficiently precise for this purpose. As indicated in the figure legend, the two stars have similar pulsation periods, but very different colours. This fact is reflected in the appearance of the ISO spectra: The Tc-poor Mira RR Aql has more flux than the Tc-rich Mira R Hya (relative to the maximum at ) not only in the wavelength range in which the WISE [22] bandpass is most sensitive (), but basically at all wavelengths longward of . In particular, the silicate features at 10 and 18 are very prominent in RR Aql, but weak in R Hya. Comparisons with other Tc-rich stars, for instance, T Cep ( d, ) and S Vir ( d, ), yield similar results. Although the sample is small, the Tc-poor and Tc-rich Miras distinctly differ in the ISO dust spectra, with the Tc-rich stars having much lower mid-IR excess than the Tc-poor ones over a wide wavelength range. This confirms the results found in Sect. 3.1 from the combinations of various near- and mid-IR filters.
3.3.2 13 feature
On the other hand, inspection of the ISO spectra shows that, among other features, the 13 feature is clearly present in R Hya, but absent or lost in the wing of the silicate feature in RR Aql. The 13 is thought to be emitted by grains of alumina dust (Al2O3, Sloan et al., 2003a, ). The presence of the feature seems to be related neither to the presence of Tc nor to the pulsation period. It is clearly related to the excess, however, thus to the (dust) mass-loss rate, confirming earlier results by Lebzelter et al., (2006) based on observations of globular cluster stars. This is demonstrated in Table 2, in which the stars in common between the Tc and the ISO SWS sample are sorted by increasing colour. The reddest star showing the 13 feature is R Cen with , the bluest one without is NO Aur at . Hence, the threshold at which the 13 feature disappears is . Using the relation between and the gas mass-loss rate that we derive in Section 3.5 (Eq. 2), we find that this threshold corresponds to a mass-loss rate of . For the error estimate, the formal variation of the coefficients in Equ. 2, as well as the uncertainty in the threshold, have been taken into account. We note, however, that the total variation in gas mass-loss rate at the threshold value is large, up to an order of magnitude either side of the mean value (see Fig. 7). Current dynamic AGB atmosphere models producing mass loss, such as those of Höfner et al., (2016), propose Al2O3 grains as seed particles for larger silicate grains. Our results suggest that at a mass-loss rate of the density in the outflow is high enough for the formation of significant silicate mantles around the alumina seed grains so that the alumina 13 feature disappears. Models of AGB winds can be tested by reproducing the observed threshold.
| Object | Tc | Sp. | Var. | Period | 13 | |
|---|---|---|---|---|---|---|
| name | type | type | (d) | feature | ||
| R Dor | 0 | M | SRV | 327.1 | 1.290 | y |
| RX Lac | 1 | MS | SRV | 331.4 | 1.295 | y |
| T Cet | 1 | MS | SRV | 159.3 | 1.444 | y |
| T Cep | 1 | M | Mira | 386.6 | 1.756 | y |
| R Hya | 1 | M | Mira | 376.6 | 1.770 | y |
| W Hya | 0 | M | Mira? | 388.6 | 1.987 | y |
| ST Her | 1 | MS | SRV | 147.0 | 1.999 | y |
| S Vir | 1 | M | Mira | 370.4 | 2.077 | y |
| NO Aur | 1 | MS | SRV | 102.1 | 2.110 | n |
| R Cen | 0 | M | Mira | 538.1 | 2.221 | y |
| Gru | 1 | S | SRV | 198.8 | 2.253 | n |
| Cyg | 1 | S | Mira | 408.2 | 2.266 | n |
| R Aql | 0 | M | Mira | 270.6 | 2.660 | n |
| R And | 1 | S | Mira | 409.9 | 2.861 | n |
| Cet | 1 | M | Mira | 332.7 | 3.479 | n |
| R Aqr | 1 | M | Mira | 388.2 | 3.531 | n |
| RR Aql | 0 | M | Mira | 399.8 | 3.565 | n |
3.4 Semi-regular variables
Investigating the behaviour of SRVs may give interesting insights because they differ from the Miras mainly in that they tend to pulsate in one of the overtones, not in the fundamental mode. The upper panel in Fig. 6 thus shows how Tc-rich SRVs distribute in the well-known vs. diagram. Three different groups may be distinguished among them.
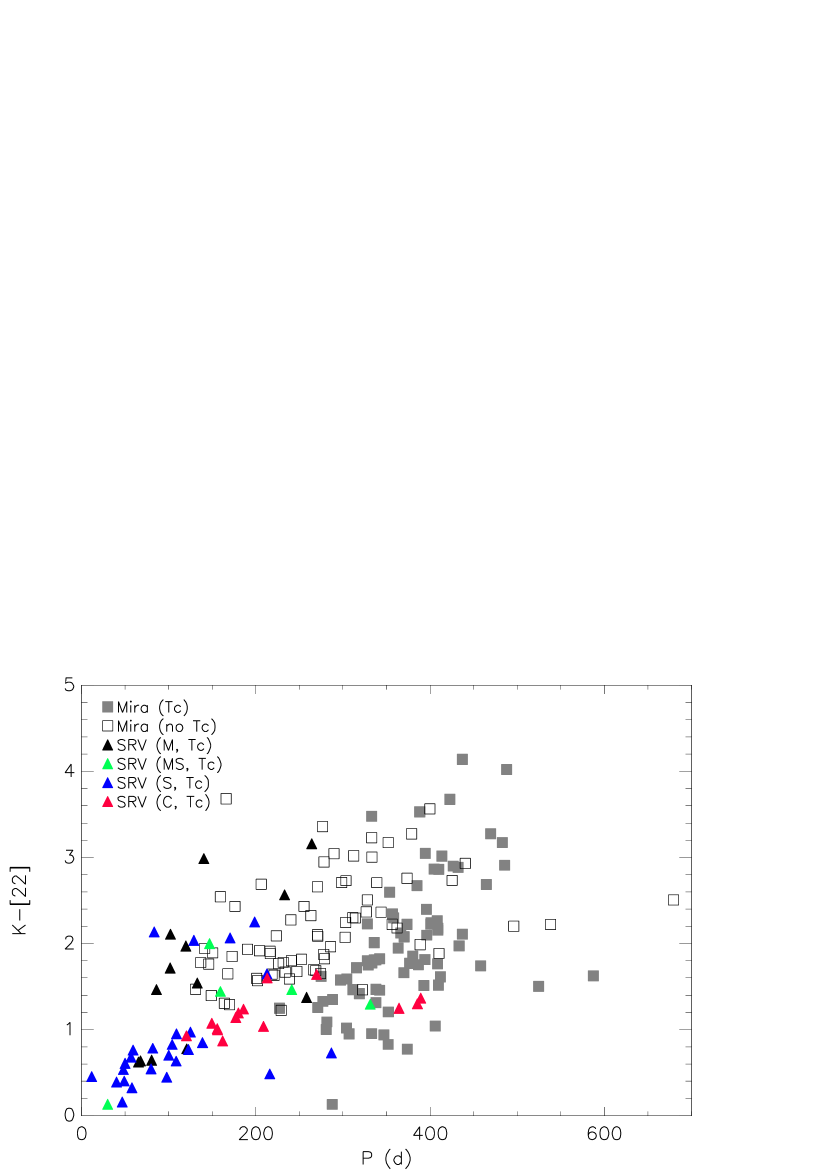
First, there is a relatively tight sequence of S and C stars with colour increasing with pulsation period. This group extends the sequence formed by the Miras to shorter periods. This sequence has already been noted in Paper I. Interestingly, a number of C-type SRVs are near the long-period end of the sequence that is formed mostly by S-type stars, which are thought to precede the C-type stars in the evolution. Because there are very few Miras with , it seems likely that SRVs switch to fundamental mode (Mira phase) only from the upper end of this sequence.
Next, there are a few SRVs that have longer periods and fall among the Tc-rich Miras (filled grey squares). These are likely SRa variables, that is, fundamental mode pulsators. First-overtone pulsators indeed only reach periods up to d; already above 200 d of period, the number of first-overtone pulsators is very low (Riebel et al.,, 2010). Interestingly, most of these long-period, Tc-rich SRVs are in a region of the diagram where Tc-rich Miras are found as well, namely at colours that are bluer than those of Tc-poor Miras, supporting the finding from that group of stars.
Nevertheless, there are Tc-rich SRVs that are scattered around at relatively red . There are 15 stars with and d. Among these, L2 Pup (e.g. Kervella et al.,, 2015) and Gru (e.g. Mayer et al.,, 2014) are confirmed binary stars. They have the largest and third-largest excess among the Tc-rich SRVs, respectively. Among the remaining stars in this area of the diagram, T Cet, W Cyg, and ST Her are listed by Ortiz & Guerrero, (2016) as binary star candidates with main-sequence companions based on GALEX UV photometry. Thus, it seems likely that also among SRVs the colour, hence the dust-production rate, is enhanced by the presence of a binary companion, just like among Miras (see Sect. 3.1).
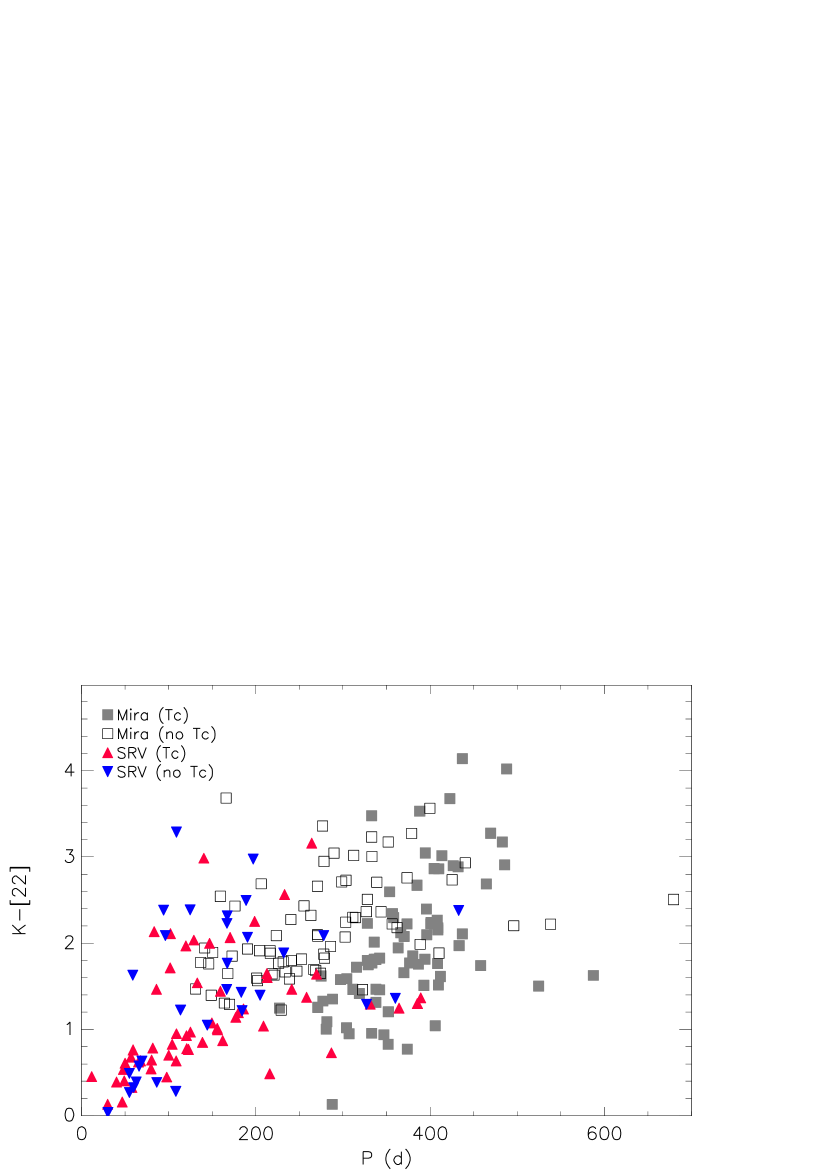
The Tc-poor SRVs in the sample do not show much structure in the vs. diagram, see the blue triangles in the lower panel of Fig. 6. There are a few stars at the base of the sequence that is formed by the Tc-rich SRVs, which might be direct precursors of the latter. Again, some of the longer-period stars could be SRa. Some of these stars have relatively red colours compared to Tc-rich SRVs at similar periods, as might be expected. Furthermore, binary stars with enhanced dust-production rate might be found among the Tc-poor SRVs. In conclusion, SRVs evidently confirm the findings from the Mira stars.
3.5 Gas mass-loss rate
As outlined in the introduction, the main motivation of this paper is to expand the analysis to the gas mass-loss rate of the stars. In order to investigate the – diagram, we collected from the literature the data outlined in Sect. 2.2 that are presented in Table LABEL:taba2 in the appendix. First, we examine the distribution of stars in the vs. diagram, see Fig. 7. Generally, increases with increasing excess. The regions of the diagram occupied by M-, S-, and C-type Miras, as well as the (M-type) SRVs, largely overlap (there is only one MS-type star in the sample). As expected, the carbon Miras extend to larger colours than the other stars. The increase in seems to flatten off at . At the other end of the distribution, several M-type stars have fairly low gas mass-loss rates, even though some of them have a considerable excess. We note that this tail of low mass-loss rate Miras comes from the works of Young, (1995) and Groenewegen et al., (1999) and is separated from the remaining sample by a dashed line in Fig. 7. (A comparison of mass-loss rates of stars in common between these two and more recent works reveals that i) there seems to be no systematic difference between Young, (1995) and more recent works; ii) could be systematically underestimated by Groenewegen et al., (1999), but not by much; and iii) both works contain a number of stars whose is severely lower than what more recent works find. We thus conclude that the mass-loss rates of the stars from Young, (1995) and Groenewegen et al., (1999) not separated out by the dashed line in Fig. 7 should be fairly reliable.) Between these regions, the relationship between and appears to be fairly linear. An ordinary linear least-squares fit to the data yields the relation
| (2) |
This relation, plotted in Fig. 7 as a solid line, can be used to estimate the gas mass-loss rate of AGB stars and should be applicable roughly in the range .
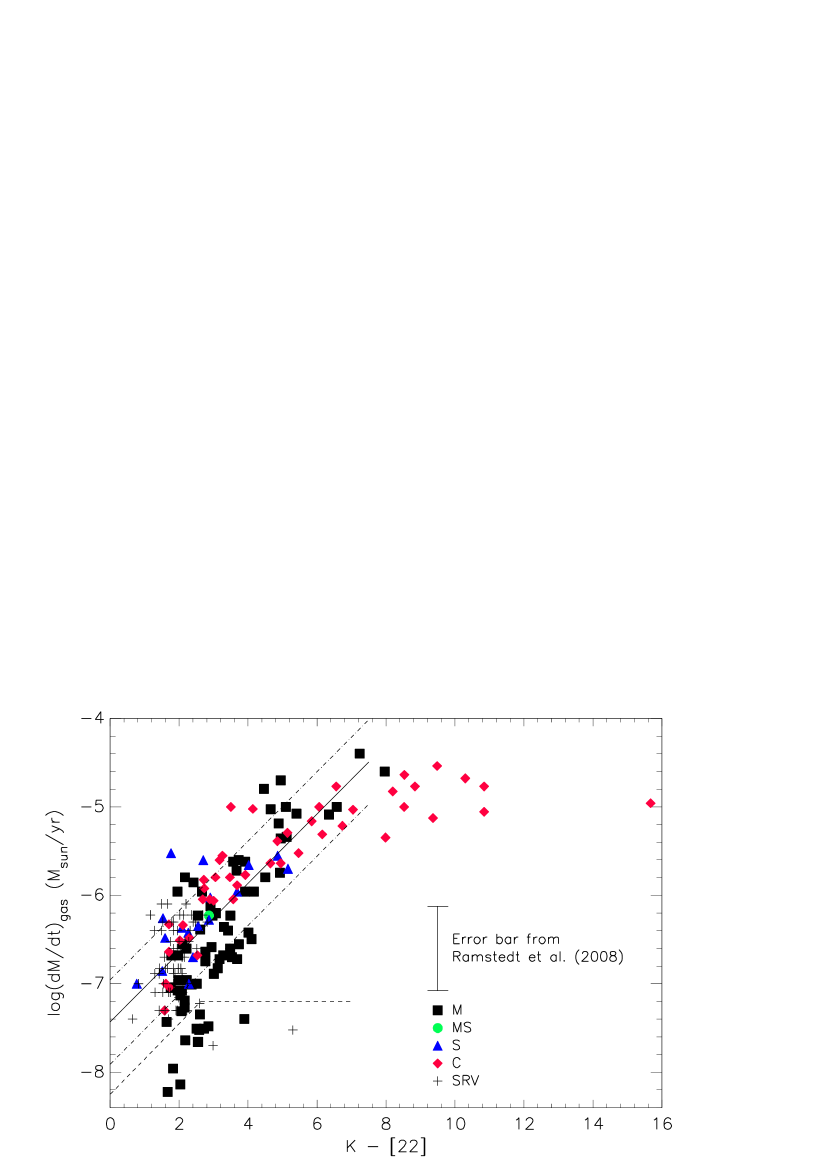
We also plot in Fig. 7 the error bar of a factor of 3 that was found by Ramstedt et al., (2008) to be a lower limit to the uncertainty in current mass-loss rate estimates. The values scatter with a standard deviation of around the linear fit, corresponding to a factor of . From the existence of the relation between and , one might expect that the same two sequences as in the vs. diagram might show up in the – ) plane, although with increased scatter.
Next, we study the – diagram of all stars for which the gas mass-loss rates were collected, see Fig. 8. Such diagrams have been used in the past to construct empirical period – mass-loss-rate relations (Vassiliadis & Wood,, 1993; Straniero et al.,, 2006). The precise functional form of this relation has profound impacts on evolutionary models of the AGB because the mass-loss rate often greatly exceeds the nuclear-burning rate. Figure 8 is an updated version with almost double the number of stars as that in Straniero et al., (2006). Their relation is over-plotted as a solid line in our figure. It captures the distribution of stars very well at the longer periods, but seems to somewhat underestimate the mass-loss rate at periods d. We note, however, that their relation extends to longer periods where most of the mass loss occurs on the AGB and that is not covered by the present sample. The overtone SRVs also probably have higher initial (and current) masses than the short-period Miras (Vassiliadis & Wood,, 1993; Feast et al.,, 1972).
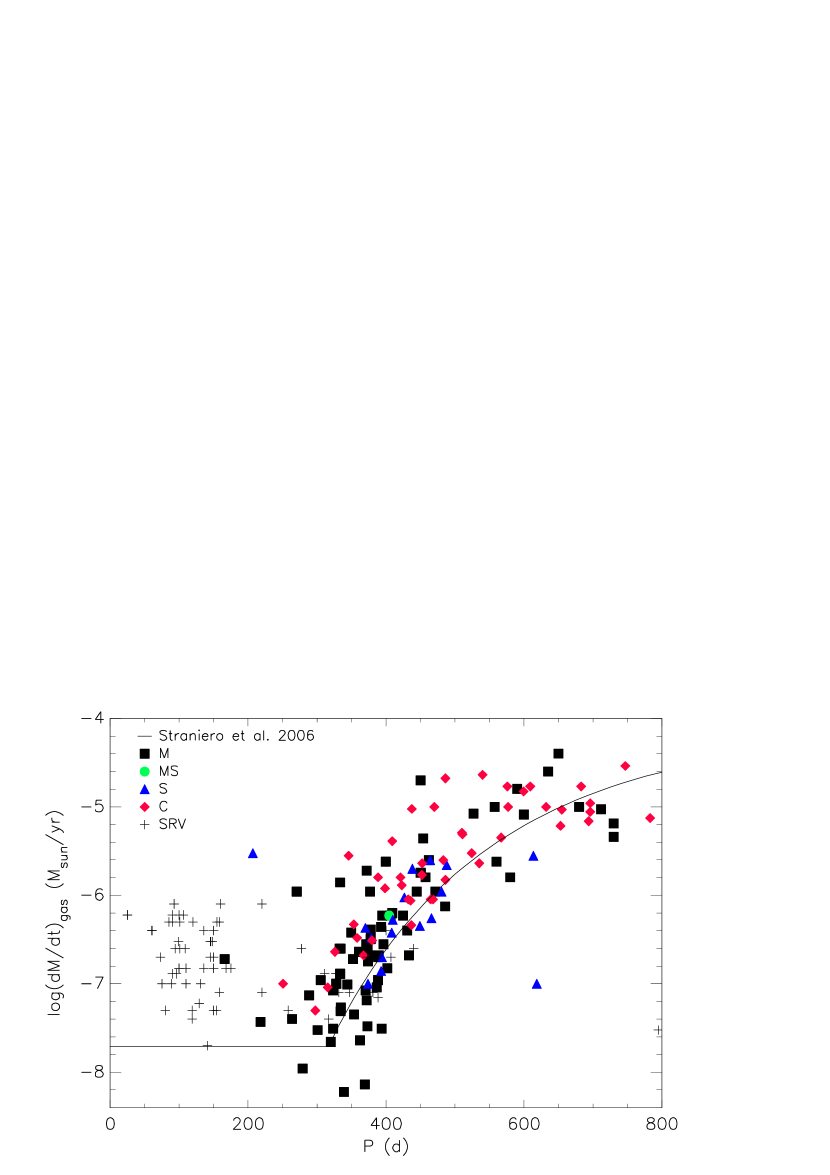
Importantly, Miras of all spectral types share more or less the same area in Fig. 8. This has been shown before by Groenewegen & De Jong, (1998, their Fig. 6) to be the case for S- and C-type Miras. Clearly, there is an increase in gas mass-loss rate between and d. A marked increase in mass-loss in this period range has been noted by Vassiliadis & Wood, (1993), Matsunaga et al., (2005, their Fig. 10), and McDonald & Zijlstra, (2016). At longer periods, the mass-loss rate flattens off around (Vassiliadis & Wood,, 1993). Moreover, the SRa variables with periods above 200 d share the same area as the Miras in this period range. This agrees with the findings of Groenewegen & De Jong, (1998, their Fig. 6). The shorter-period SRVs also have gas mass-loss rates in the same range, despite their shorter periods. However, the Mira sequences observed in colour are not apparent from Fig. 8.
We investigate this in more detail in Fig. 9, which includes only Miras with information on their Tc content. Two Tc-poor Miras clearly have higher gas mass-loss rates than the Tc-rich Miras at similar periods. These are R Aql and RR Aql, at d and 400 d. They have higher gas mass-loss rates than all Tc-rich Miras, except for three carbon Miras and one S-type Mira, all of which have longer pulsation periods, however. The gas mass-loss rate of R Cet, at d and noted in Paper I to be very red in for its period, is much higher than what would be expected if the Mira sequence of Fig. 8 were extrapolated to its period. However, many SRVs with similar pulsation periods have gas mass-loss rates of the same order of magnitude. We also note that the Tc-rich M-type Mira with the shortest period in Fig. 9 is the binary Cet. Another binary, R Aqr, is included in this diagram. Their stellar wind might therefore deviate considerably from spherical symmetry (e.g. Ramstedt et al.,, 2018), which is a usual assumption to derive gas mass-loss rates from radio CO line observations, and their mass-loss rate might be more uncertain. Finally, we note that the three M-type Miras with the lowest gas mass-loss rates in this diagram are in the tail of low mass-loss rate stars that are identified and separated by the dashed line in Fig. 7.
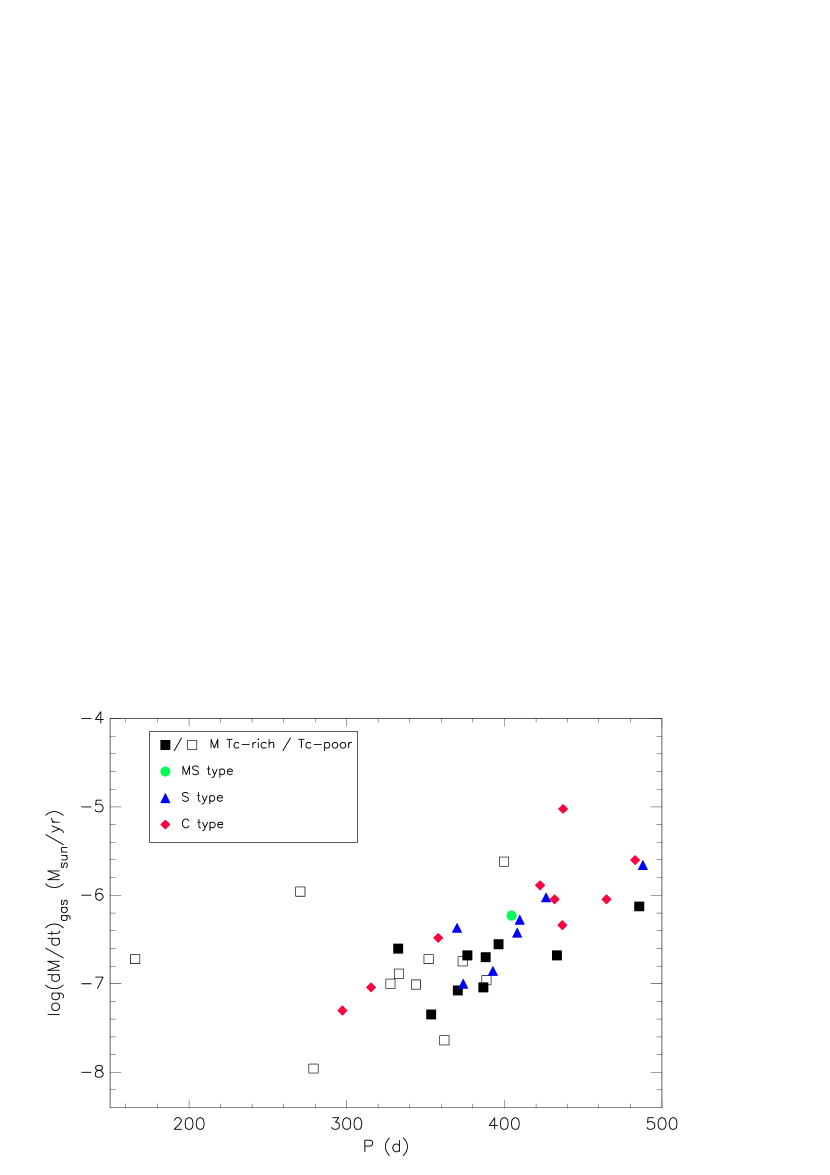
In conclusion, with the available observations it can neither be confirmed nor excluded that Tc-poor Miras also have higher gas mass-loss rates than Tc-rich ones at a similar pulsation period and that there is a real split. Several limitations prevent us from drawing stronger conclusions. First of all, the same stars as in Fig. 9 plotted in the vs. plane do not clearly exhibit the two sequences either. Second, as shown in Sect. 3.1, the two sequences merge in somewhere between 350 and 400 d of period, but there are few stars with period below 350 d in Fig. 9. It is also important to take into account that there are larger uncertainties attached to the determination than to the colour. The determination of is a complex undertaking that uses radiative transfer models of the circumstellar envelope. Uncertainties introduced by necessary assumptions might contribute to scatter the sequences that are observed in , which might be a much more direct and reliable measure of the mass-loss rate. Variability of the stars will not play a large role in the colour because (as much as possible) averaged -band magnitudes were used, whereas the variability amplitude in the 22 band is expected to be small (Guha Niyogi et al.,, 2011).
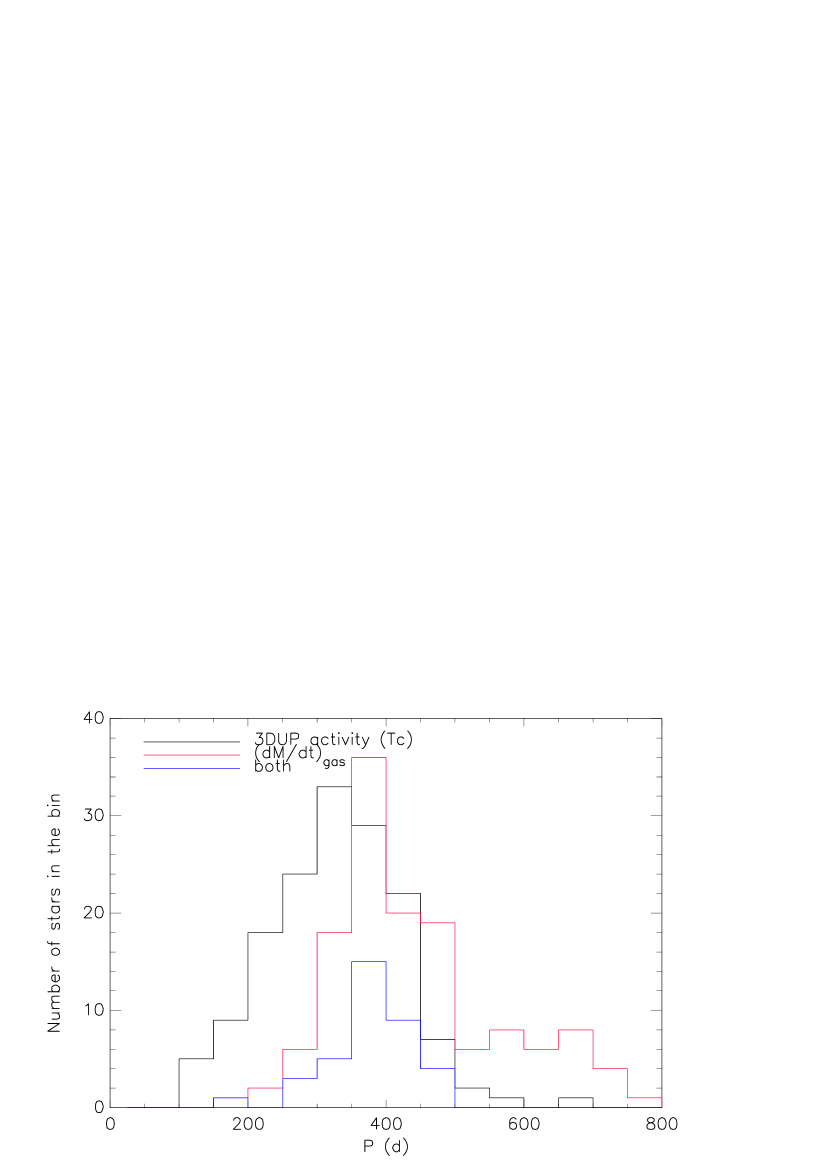
An obvious obstacle in the analysis is the small number of stars available, however. While samples of 135 Miras with a determined gas mass-loss rate and 151 Miras with information on their 3DUP activity were compiled, only for a mere 37 stars do we have information on both. As illustrated in Fig. 10, the two samples have period distributions that differ considerably. The reason for this is most likely an observational bias: The Tc lines can only be inspected in optically bright Miras that are not too much obscured by circumstellar absorption, which favours shorter-period stars as targets. On the other hand, traditionally, the longer-period Miras have been targeted for radio CO measurements, also due to sensitivity reasons. We also observe in the literature that the same Miras are targeted over and over again for their molecular radio emission, while hardly any new objects are added to the sample. With APEX and ALMA, for example, very sensitive radio facilities are available to researchers, who are encouraged to use them for observations of shorter-period Miras ( d). In general, more Miras with information on their Tc content should be observed to investigate the interplay between pulsation, mass loss, and 3DUP in more detail.
Finally, we recall that, as already observed in Sect. 3.1 (see also Fig. 3), the transition between the regions occupied by Tc-poor and the Tc-rich Miras, respectively, is very sharp. This sharp transition could be accomplished by a mechanism that acts very quickly on the colour. The 22 band probes relatively warm dust that is thought to be at a distance of a few or several stellar radii from the photosphere of the star. Assuming a typical outflow velocity of the wind ( km s-1), it takes only a few decades to fully replace the material in this region of the CSE. The radio CO lines observed to determine the gas mass-loss rate, on the other hand, probe a much larger region of the CSE, which is replenished only within yrs. Thus, the CO lines measure the mass-loss rate averaged over a time span that is longer by some two orders of magnitude than that probed by the colour. Hence, even if the uncertainties in determining the gas mass-loss rates from radio CO lines were very small, it is not granted that a similar separation between Tc-poor and Tc-rich Miras can be found in the vs. diagram because the transition that the star undergoes could be much slower in than in (e.g. if a single 3DUP episode is sufficient to impact the colour). Nevertheless, we encourage observers to add more Miras to the sample of stars with known gas mass-loss rate, especially both Tc-poor and Tc-rich Miras in the period range of overlap.
3.6 Pulsation amplitudes and mass-loss rates
It has been suggested that pulsation is the main trigger of strong mass loss (e.g. McDonald & Zijlstra,, 2016). However, it is not clear if pulsation period or (radial) pulsation amplitude is the decisive factor for strong mass loss. From the observational side this is difficult to investigate because the amplitude in the visual range, which would be readily available for a large sample of stars, is not a good indicator for the true pulsation amplitude due to its strong dependence on molecular absorption bands, which in turn are very sensitive to the chemistry, temperature, density, and related changes over a pulsation cycle. Light curves and thus amplitudes in the near-IR range, on the other hand, would be much better measures of the true pulsation amplitude, but are available only for relatively few stars. A homogeneous sample of IR light curves has been published by Price et al., (2010). We cross-matched our sample with their data of variable stars and found 48 stars in common, a reasonable number to analyse the dependence of dust mass-loss rate (i.e. the colour) on pulsation amplitude.
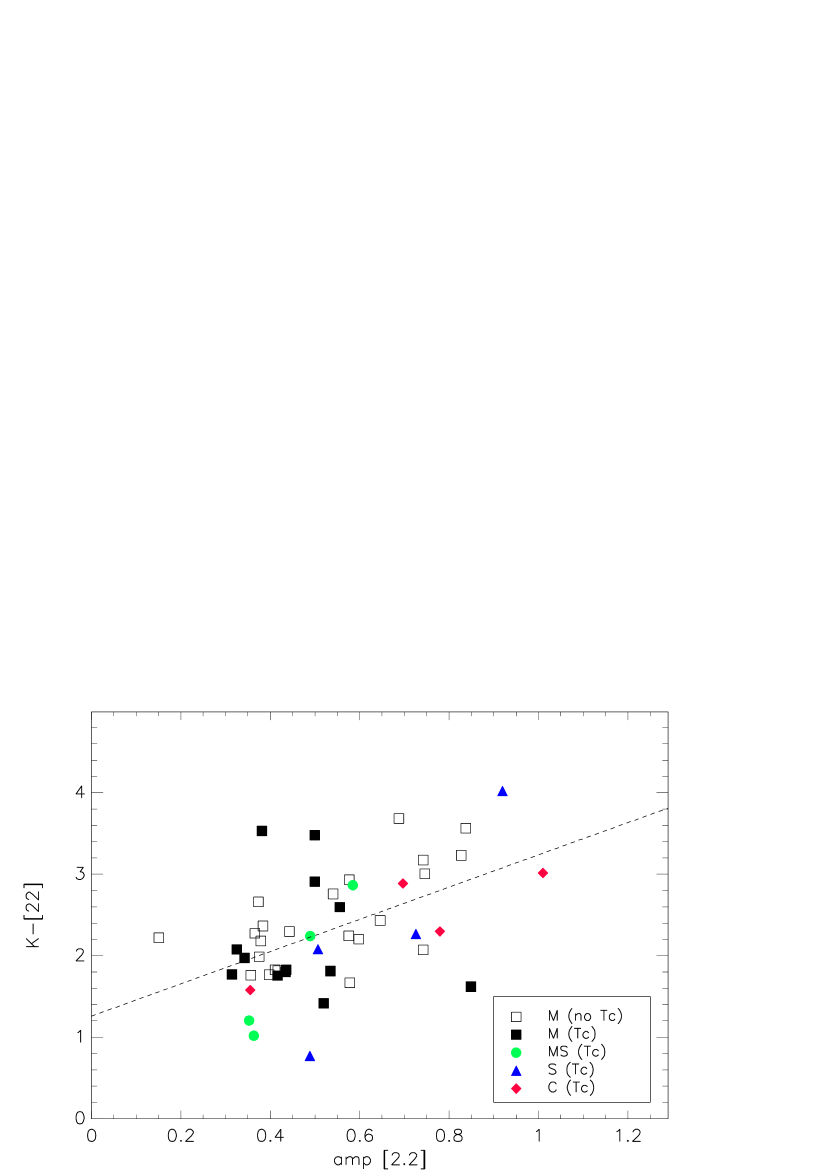
Figure 11 shows a diagram of the colour as a function of the (full) amplitude at 2.2 , which is essentially the same wavelength as the band. It becomes clear from this diagram that the dust mass-loss rate increases with increasing amplitude. This holds also for the amplitude at 1.25 , which is also reported by Price et al., (2010), with the main difference that the amplitude is larger at this shorter wavelength. The correlation also holds for the different chemical subtypes, except for the Tc-rich M-stars (filled squares), which do not seem to show this correlation. However, behaviour is skewed by the fact that the two Tc-rich M-type stars with the reddest colour are binaries, and there is only one Tc-rich M-star with a full amplitude above 06.
When we exclude the binaries Cet and R Aqr, the correlation coefficient is 0.59. This correlation coefficient is comparable to that between pulsation period and colour of the Tc-poor and Tc-rich Miras, respectively, see Table 1. Interestingly, there is hardly any correlation between pulsation period and amplitude. It seems that the dust mass-loss rate depends both on pulsation period and amplitude, but that pulsation period and amplitude vary almost independently from one to another.
A correlation between mass-loss rate and near-IR pulsation amplitude has in the past been shown to exist, for instance, by Whitelock et al., (1987). Recently, Riebel et al., (2015) have demonstrated a correlation between dust-production rate and Spitzer [3.6] amplitude among C-rich stars in the Magellanic Clouds. However, the correlation among their O-rich stars is feeble at best. Fig. 11 demonstrates that such a relation is also present among O-rich stars (type M and S), and that it is independent from the occurrence of 3DUP.
4 Hypotheses for the origin of the two sequences
As has been noted in Paper I, it is counter-intuitive that Tc-poor Miras have a redder colour (i.e. dust mass-loss rate) than Tc-rich Miras at the same pulsation period. (It should be noted here that a difference in temperature could also cause part of the separation between the two sequences of Miras. Stars of lower temperature have larger colour. We find that black bodies of temperatures 2600 K and 3600 K differ in by . Here, 2600 K is a realistic effective temperature for many Miras, whereas the hottest Miras could have an effective temperature close to 3600 K. Thus, the full difference between the two sequences of (Fig. 2) cannot be explained by a difference in temperature. Most of all, it also defies a straightforward explanation why Tc-rich Miras should be hotter than Tc-poor ones and only shifts the problem.) Naïvely, one would expect that an AGB star evolves in the vs. plane towards longer period (also by mode switching) and higher (dust) mass-loss rate, when at some point 3DUP sets in, and the star continues to evolve to higher mass-loss rate without much disturbance. (We note that the TP preceding a 3DUP event has a profound but short-term impact on both period and mass loss, but only a fraction of of Miras is expected to undergo a TP at any one time.) In particular, the relatively small abundance change imposed by one 3DUP event is not expected to lead to large changes in the pulsation period or mass-loss rate, or both. Thus, the observed behaviour of stars is surprising and deserves further attention to understand the underlying mechanism(s). We developed hypotheses to explain the observations, which we discuss in the following.
4.1 Hypothesis 1: 3DUP influences the pulsation period
One hypothesis that was formulated in Paper I was that 3DUP somehow influences the pulsation period of a star, that is, shifting it to longer periods by changing its density. In this way, a previously Tc-poor star would be shifted to a longer period while the colour could essentially stay constant, and the star would appear in the Tc-rich sequence. Scholz et al., (2014) investigated the effect of moderate abundance changes that may be induced by 3DUP, such as of the C/O ratio, on the atmospheric structure and colours of a series of Mira pulsation models. They found relatively little influence on the pulsation periods of the model stars, for example. Furthermore, one might expect that such a period shift would also be noticeable in period – magnitude (or period – luminosity) diagrams by a broadening of the fundamental mode sequence, for instance. This is not observed, however (Whitelock et al.,, 2008; Riebel et al.,, 2010, 2015). Because hypothesis 1 is supported neither by theoretical nor observational evidence, we regard it as falsified.
It should also be stated here that the Tc-poor Miras are most likely fundamental-mode pulsators, not overtone pulsators, just as the Tc-rich Miras. As already mentioned, first-overtone pulsators only reach periods up to d; already above 200 d of period, the number of first-overtone pulsators is very low (Riebel et al.,, 2010). Many of the Tc-poor Miras, on the other hand, have pulsation periods longer than 240 d, up to 440 d (Fig. 3). Thus, the two sequences in the vs. plane cannot be explained by Tc-poor and Tc-rich Miras oscillating in different modes.
4.2 Hypothesis 2: Tc-poor and Tc-rich Miras are groups of stars with different masses
AGB evolutionary models predict that a threshold mass exists below which a star never experiences a 3DUP event on the AGB; this threshold mass depends on metallicity. In Paper I, the hypothesis was put forward that the two sequences of Miras could be related to two groups of stars with different masses, the Tc-rich Miras being the more massive group at a given period. It was speculated that the two groups evolve differently, thus occupying different areas in the vs. diagram. Among others, this hypothesis was given credibility based on the fact that the Tc-rich Miras are (on average) closer to the Galactic midplane, which indicates a higher average birth mass of the stars. Here we perform a more careful analysis than in Paper I of the distance from the Galactic midplane as a function of period.
As in Paper I, we derived the distance of the stars from the Sun using the period-magnitude relation of Riebel et al., (2010, their Sequence 1), assuming that all sample Miras are fundamental-mode pulsators and assuming a distance modulus to the LMC of 1850. If some of the sample stars were overtone pulsators, their distances would be significantly overestimated. The lack of an absolute luminosity and hence distance calibration means that the distances assigned to AGB stars are a major uncertainty in this analysis. Nevertheless, the so determined distances from the Sun were then used to calculate their distance from the Galactic midplane using their Galactic coordinates.
Figure 12 shows the absolute value of the distance from the Galactic midplane as a function of pulsation period of the Galactic disc Miras. Tc-rich Miras (filled red circles) on average have longer periods than the Tc-poor ones (open circles). However, at a given period, the two samples have, on average, a similar distance from the Galactic midplane. This is illustrated by the dashed lines, which show the run of the mean in 50 d period bins. The shortest-period objects are surprisingly close to the midplane, but this can easily be understood as a bias towards close-by, apparently bright stars that will of course also be relatively close to the midplane. With increasing period, the mean distance from the midplane decreases in parallel for the two groups. Because the mean distance from the midplane is a good indicator of the age of a group of stars, hence of their initial mass, the mass also seems to increase smoothly with pulsation period, regardless of the presence of Tc.

The mass-loss rate itself could be more directly related to the stellar mass than Tc-content. At any period, Miras with a higher mass-loss rate could be the less massive ones, as their surface gravities may be expected to be lower, hence their atmospheres are more weakly bound. Therefore, we also separated the sample into two groups, one of them bluer than the median , and one redder than this, and again inspected as a function of pulsation period. However, these two groups show no significant difference either. From this analysis we do not find evidence that Tc-rich and Tc-poor Miras are groups of stars of different masses at a given pulsation period. We caution, however, that the distances to the stars analysed here have significant uncertainties.
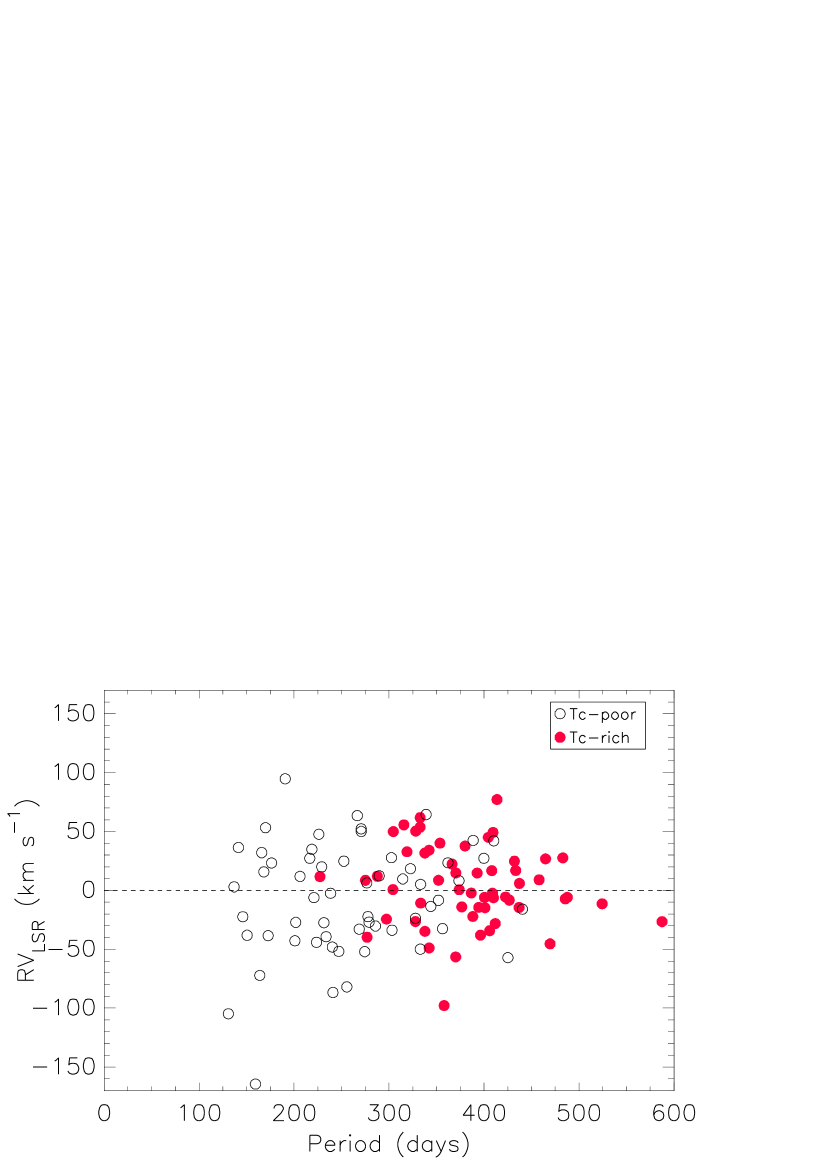
One kinematic tracer that can be assessed independently from the knowledge of the stellar distances is the radial velocity. Just as height above the Galactic midplane, the radial velocity dispersion of Miras decreases with increasing period, hence with decreasing age (Feast,, 1963). Heliocentric radial velocity measurements are indeed available for a substantial fraction of the Galactic disc Miras in our sample (59 Tc-poor, 72 Tc-rich). These were converted into radial velocities with respect to the local standard of rest () and are plotted as a function of period in Fig. 13. The figure seems to confirm the general decrease of velocity dispersion with increasing period. However, the transition from Tc-poor to Tc-rich stars is smooth. In the period range of overlap between 227 and 441 d (longer than the shortest-period Tc-rich Mira, but shorter than the longest-period Tc-poor Mira), the standard deviation of the velocities is 39.4 km s-1 and 34.9km s-1 for the 37 Tc-poor and 48 Tc-rich Miras, respectively. The small difference may be entirely attributed to the general decrease in velocity dispersion with period. This means that kinematics does not provide evidence either for a difference in mass at a given period between the two groups of Miras.
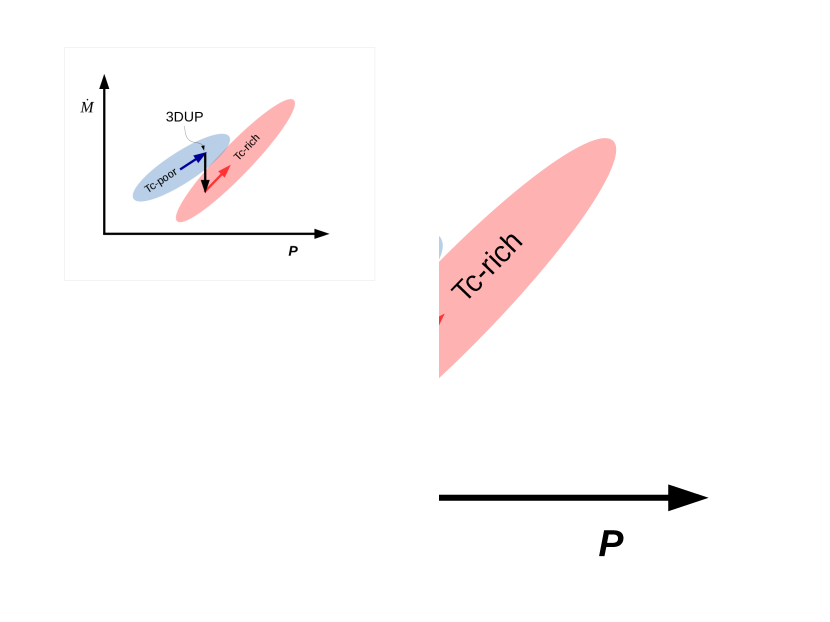
4.3 Hypothesis 3: 3DUP decreases the mass-loss rate
The third hypothesis that is put forward assumes that a 3DUP event somehow leads to a reduction of the (dust) mass-loss rate from a star. In this way, upon a 3DUP event, a Mira from the Tc-poor sequence would be shifted downwards in the vs. diagram at a constant pulsation period. Figure 14 shows a schematic representation of the evolution of a star in the vs. diagram under this paradigm. We note that the fractional change to the pulsational period of a Mira during its lifetime as a Mira can only be rather small (Whitelock et al.,, 1994). The period at which 3DUP and thus the reduction in mass loss-rate takes place is mostly a function of mass and metallicity of the star. Later in its evolution as Tc-rich object, the star may enter the super-wind phase where its circumstellar envelope (CSE) becomes so thick that the flux especially in the blue spectral range becomes too low to detect the Tc lines.
The physical mechanism by which 3DUP could reduce the mass-loss rate is not obvious, however. If 3DUP somehow reduces the formation of dust, it could lead to a reduction of the mass-loss rate because the transfer of momentum from the stellar photons to the dust and gas would become less efficient. The atmospheric composition of post-3DUP stars differs from that of pre-3DUP stars in a number of aspects, most notably in the content of He and C, but also in that of heavier elements, including radioactively unstable isotopes. The ions produced by the decay of unstable isotopes could influence the formation of dust. For example, these ions could produce so many seeds for the nucleation of dust that only small grains form in the atmosphere, so that absorption and most of all scattering (Höfner,, 2008) of stellar photons becomes inefficient. This would reduce the transfer of momentum to the gas, thus reduce mass-loss rate. Moreover, the ions could strongly influence a key reaction in the formation of dust grains. Quantum-chemical calculations of dust-forming aluminum oxide clusters show that the structures, potential energies, and dust formation routes differ significantly when ions are included, compared to the neutral case (Desai et al.,, 1997).
We made an estimate of the energy input and the number of ions per second produced by decaying unstable isotopes in a typical AGB atmosphere. For this purpose, we selected from the FRUITY database (Cristallo et al.,, 2009) the model with , , zero initial rotation velocity, and a standard 13C pocket. This should be a fairly representative model of a typical AGB star in the solar neighbourhood. For the estimate, we selected from this model the composition after the third 3DUP event. This is relatively early in the evolution of this model, which undergoes nine 3DUP events in total. This choice is justified by the fact that already stars with very little s-element enrichment (spectral type M) but with Tc in their spectra appear to have reduced .
Only three isotopes contribute significantly to the total amount of energy released per second by radioactive decay, namely 26Al (91.9%), 59Ni (4.5%), and 60Fe (2.9%, taking into account the energy released by the following, fast decay of 60Co to 60Ni). Interestingly, the element Al is part of alumina dust (see Sect. 3.3.2) that is a potential candidate to trigger the onset of dust formation in oxygen-rich AGB stars (see e.g. Karovicova et al.,, 2013; Decin et al.,, 2017). We also note that the lithium-rich, intermediate-mass AGB star candidates are comparably blue in for their long pulsation periods, and they are predicted to be rich in 26Al.
The decay of 26Al and other unstable isotopes releases about 189 MeV s-1 g-1, where the energy carried away by the antineutrino is already subtracted. For the ionisation by the electrons and positrons from the -decays, we further assume for the sake of simplicity that the gas is solely composed of H (76% by mass) and He (24%), thus the weighted mean ionisation potential per gas particle is 14.697 eV. From this it follows that about ions per second per gram of gas are produced. We further find that the recombination timescale is s.
This can be compared to other sources of ions in the AGB atmosphere. Atmospheric models that follow the non-equilibrium chemistry in gas shocked periodically by the stellar pulsations (e.g. Gobrecht et al.,, 2016) find ionisation fractions of in post-shock gas at K (depending on the composition, dust grains condense at K). Assuming the same composition of H+He as above, this translates into a number of ions per gram of gas. Even if this ionisation fraction is reached only for a small fraction of the pulsation period of a few hundred days, it is clear that this outweighs the number of ions produced by radioactive decays by far. Eventually, other sources of ions must also be considered, for example UV radiation from the stellar chromosphere, far-UV photons from the interstellar radiation field, and cosmic rays.
The effect of radioactive decays on circumstellar envelopes has previously been investigated by Glassgold, (1995), who concluded that the ionisation of AGB winds is likely to be due in part to in situ radioactive decays, at least for stars such as IRC +10216. Thus, a mechanism as sketched under hypothesis 3 might accomplish the sharp separation of Tc-poor and Tc-rich stars observed here (lower panel of Fig. 3), but further investigation of this issue is certainly warranted.
4.4 Hypothesis 4: 3DUP decreases dust emissivity
A variation of hypothesis 3 is that 3DUP reduces the dust emissivity, and thus the colour, but not necessarily the dust mass-loss rate. The dust emissivity depends on the grain size distribution, and on the composition, shape, and structure of the dust grains. All these could be influenced by a change in gas composition due to 3DUP, as sketched above. Again, the physical mechanism that could be at work is not immediately obvious. We note that Jones et al., (2012) ruled out changes in silicate composition with period. Nevertheless, radio CO observations to measure the gas mass-loss rate of Tc-poor and Tc-rich Miras, respectively, would be very helpful to rule out one or the other hypothesis.
4.5 Hypothesis 5: Tc lines are unobservable in some stars
Finally, we consider the hypothesis that Tc may become invisible in stars not because it is underabundant, but because the Tc lines are not excited. This may be because lines are blanketed (e.g. by TiO, or C2, CH, or CN), because Tc becomes ionised, or because gas-phase Tc condenses into molecules. In this way, a separation of Tc-poor and Tc-rich Miras could be mimicked.
Line blanketing of Tc could occur in particularly cool objects, but the relative opacity at these wavelengths is weak. Ionisation of Tc i Tc ii can occur at 2500 K at 10-7 bar, rising to 3000 K at 10-5 bar (Gorfer, (2005); cf. Speck, (2012) for temperature–pressure curves in AGB stars). This may become significant, depending on the stellar effective temperature (as measured around the wavelength of Tc lines) and the presence of a stellar chromosphere. The chemistry of Tc, particularly at low pressures, is not well understood. TcO is not well-measured in the literature, but TcO2 is known to be stable up to high ( K) temperatures (Rard,, 1983).
Figure 1 shows that the absorption features are weaker in the Tc-poor star than in the Tc-rich one. This may indicate that higher atmospheric opacity obscures the lines in the Tc-poor star, for exmaple by facilitated dust production. We compared lines of Fe i and V i with similar excitation potentials as the Tc resonance lines and confirm that all of these lines are somewhat weaker in the star without Tc than in the star with Tc. However, other comparisons of Tc-poor and Tc-rich star spectra do not generally reveal such a trend (e.g. Uttenthaler et al.,, 2007, 2011). Furthermore, the effect of line weakening has been observed in Mira stars, which varies with phase and even from cycle to cycle (Merrill et al.,, 1962). Thus, any conclusions from such comparisons are not straightforward.
Without further characterisation of the line formation region in these stars, and the technetium chemistry involved, it is not possible to state with confidence whether the factors mentioned above contribute to Tc being absent in some stars. Including a more realistic and detailed Tc chemistry and line formation in current model atmospheres would be very helpful to further study this aspect. However, we note that stars with higher mass-loss rate but shorter period (possibly smaller and hotter) are preferentially Tc-poor, indicating that either higher temperature or pressure may be important.
5 Searching for 3DUP in Galactic bulge Miras
Third dredge-up and subsequent mass loss are important for the chemical evolution and global properties of a stellar population. Because the position of a Mira star in the vs. diagram is a strong predictor of the presence of Tc (lower panel of Fig. 3), we may use this diagram in the reverse way to assess the occurrence of 3DUP in Miras in a specific stellar population. In Paper I, this method of detecting 3DUP has been applied to a small sample of Galactic bulge Miras. Here we apply the same approach to a much larger sample, using the best-separating line calculated above (Eq. 1).
The Galactic bulge has been found to lack intrinsic carbon stars, that is, luminous stars on the TP-AGB that owe their carbon enhancement to internal nucleosynthesis and dredge-up, rather than to mass transfer from a binary companion. It appears that the implied luminosities of C-stars in the direction of the bulge are too low for them to be on the TP-AGB (Azzopardi et al.,, 1988; Blanco & Terndrup,, 1989; Tyson & Rich,, 1991), except maybe for a very few objects (Miszalski et al.,, 2013; Matsunaga et al.,, 2017). The central regions of other galaxies also exhibit a lack of carbon stars (Boyer et al.,, 2013). This has been interpreted as a sign that 3DUP does not occur or is not efficient enough to form carbon stars in these stellar populations. This may be either due to low mass (old age), high metallicity, or high helium content (Karakas,, 2014). A high oxygen abundance would also prevent the formation of carbon stars, even if the stars experience 3DUP, because the amount of carbon needed to reach C/O1 increases with increasing oxygen abundance. However, a few AGB stars in the outer Galactic bulge, which are included in the present sample, have been found to contain Tc (Uttenthaler et al.,, 2007). Here we would like to shed light on the question if 3DUP is not efficient enough in the Galactic bulge to form carbon stars, or if it is not very common at all. The goal of this investigation is not to compile a comprehensive list of 3DUP candidates in the bulge, but rather to check how large a fraction of bulge Miras potentially experiences 3DUP and how common this mixing process is in bulge stars.
The sample considered here are the 1094 Galactic bulge Miras in the Massive Astrophysical Compact Halo Object (MACHO) survey database identified by Bernhard & Hümmerich, (2013, and references therein). This sample was chosen because all light curves and pulsation periods have been checked visually, thus it is expected to constitute a very clean sample of bulge Miras. Nevertheless, for three of the MACHO stars, no precise period could be determined, thus reducing the sample to 1091 objects. -band magnitudes were extracted from the 2MASS catalogue and 22 magnitudes from the WISE catalogue. (Only 2MASS magnitudes are used in this section, therefore we use the notation band here. The sample discussed in the rest of the paper has also been observed in other photometric systems, therefore, although the magnitudes have been transformed to the 2MASS system, we use the notation -band in all other sections or when referring to that sample.) Interstellar extinction is non-negligible towards stars n the Galactic bulge, therefore we extracted the -band extinction towards the objects from the BEAM calculator222http://mill.astro.puc.cl/BEAM/calculator.php provided by Gonzalez et al., (2011). The reddening law of Nishiyama et al., (2009) was assumed because it is more appropriate for the bulge than other laws (Nataf,, 2016; Qin et al.,, 2018), as well as an extinction ratio to calculate the de-reddened colour . The result of this exercise is shown in Fig. 15.
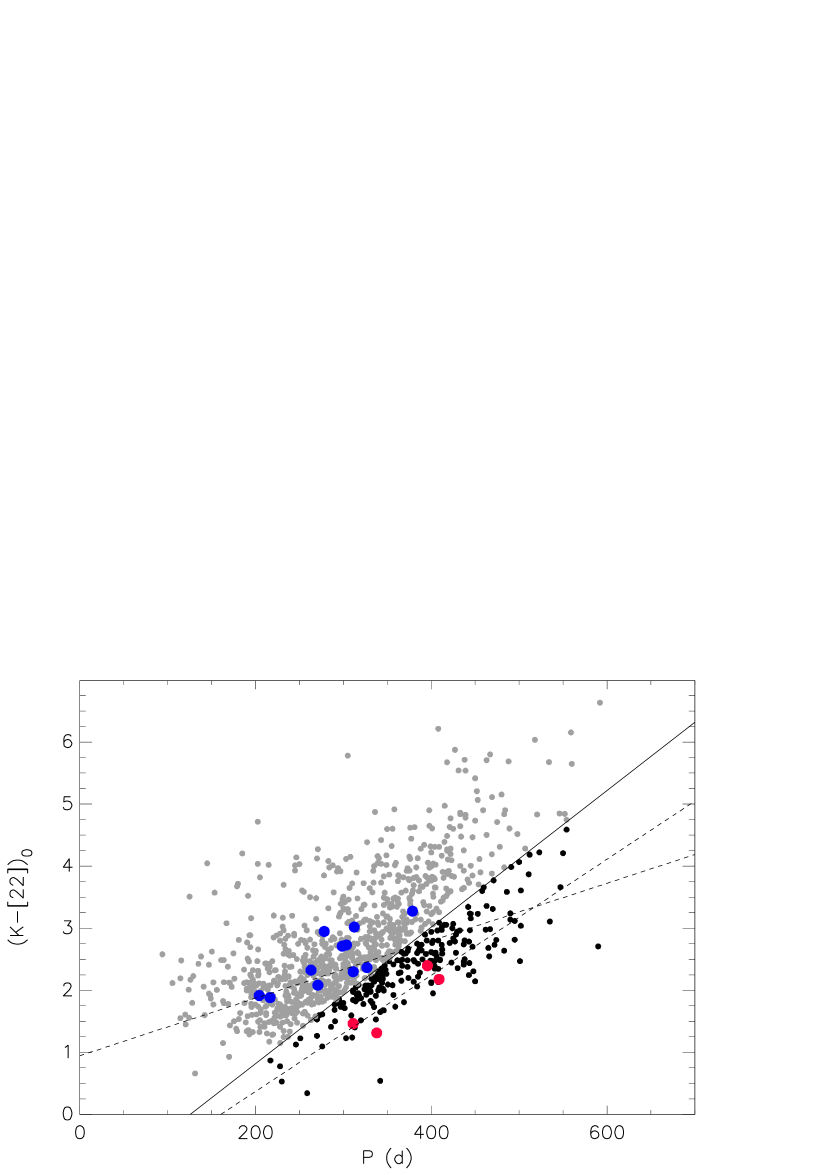
The whole sample exhibits a clearly increasing colour with increasing period. We note that the ordinate range in Fig. 15 is expanded with respect to Fig. 2. While the reddest stars with information on their Tc content in Table LABEL:taba1 have just above 4, some bulge Miras have greater than 6. Very red Miras are missing in the former sample because they would be unobservable in the blue spectral range. The Plaut stars are also included in Fig. 15. They have been investigated for their Tc content by spectral observations by Uttenthaler et al., (2007). These stars clearly follow the linear relations defined by all Tc-poor and Tc-rich Miras, respectively, in the upper panel of Fig. 3. Furthermore, they exactly follow the separation into Tc-poor and Tc-rich Miras prescribed by Eq. 1.
Of the total sample of 1091 MACHO objects, 885 (81%) fall above the best separating line, and 206 (19%) fall below it. To compare these fractions to the disc sample (Sect. 3.1), short-lived intermediate-mass star candidates have to be excluded because they are not expected to be present in the predominantly old bulge ( Gyr). When these are excluded from the disc sample, 87% of Tc-poor Miras are above the line. This would mean that in the Galactic bulge a few more stars fall below the line than would be expected if none of them had 3DUP. This means that a few of the Galactic bulge Miras may indeed undergo 3DUP.
However, we must also take into account several effects that may broaden the whole distribution in the colour: i) only one epoch of -band observations is available for the MACHO Miras (the minimum peak-to-peak -band amplitude for Mira classification is 04.) ; ii) there is an uncertainty attached to the extinction correction; iii) a high Galactic dust background emission impedes an accurate measurement of the 22 flux; and iv) the different metallicities of these stars may produce a different colour at a given mass-loss rate. The number of Miras below the line may be increased by these effects. If the whole sample were shifted upward by 02 in , which may be comparable to making the distribution narrower by this amount, a fraction of 88% of stars would fall above the line. We conclude that, while 3DUP may occur in some Galactic bulge Miras, we do not find evidence that it is a widespread phenomenon. Carbon stars in the Galactic bulge may be rare because 3DUP may be a rare event in first place.
Any bulge AGB star that undergoes 3DUP may have the same origin as the C-rich bulge Miras identified by Matsunaga et al., (2017). Following their discussion, we suggest that these could be either merged binaries (Renzini & Greggio,, 1990), members of a younger, metal-rich population (Bensby et al.,, 2013), or accreted from a dwarf galaxy such as the Sagittarius dwarf galaxy (Whitelock et al.,, 1996).
6 Summary and conclusions
We presented a follow-up paper on a previous work (Uttenthaler,, 2013, Paper I), using a larger sample and expanding the analysis. The main finding of Paper I is confirmed here, namely that Tc-poor and Tc-rich Miras form two separate sequences in the vs. diagram, and that at a given period, Tc-poor Miras have a higher excess than Tc-rich Miras. Both sequences show a very strong correlation with pulsation period, whereas the correlation is weak if no distinction is made with respect to the presence of Tc. Other combinations of near-to-mid-IR colours and ISO dust spectra are used to demonstrate that the higher excess is not confined to the band or a specific dust feature in this band.
Tc-rich SRVs are found to form another sequence of increasing colour with increasing pulsation period (Fig. 6). A mode switch from overtone to fundamental-mode (Mira) pulsation most probably only occurs near the upper end of this SRV sequence because most Miras have much redder colours than the SRVs on that sequence. Fundamental-mode SRa-type pulsators basically confirm the findings from Miras. In general, it is concluded that red outliers in the vs. plane, be they SRVs or Miras, are good candidates to host a close binary systems.
We also find that there is a sharp threshold at above which the 13 feature disappears. This colour corresponds to a total mass-loss rate of .
A central aim of this work was to investigate if gas mass-loss rates, determined from radio CO lines, also show two sequences if a distinction is made with respect to Tc in the atmosphere of the stars. The gas mass-loss rates were found to have a strong correlation with the colour. We established a linear relationship that relates the colour to gas mass-loss rate in the range , which may be used to estimate mass-loss rates from colour. Moreover, clearly increases with pulsation period, where a strong increase is seen between and d of period. However, the available data revealed no such sequences in the vs. diagram. A number of obstacles inhibit our endeavour, one of them being uncertainties attached to the determined gas mass-loss rates, but most importantly the low number of Miras with both a determined and information on Tc content in the period range of interest. We encourage researchers to increase the number of radio CO line observations for gas mass-loss rate determinations of (optically bright) Miras in particular in the period range to study the interplay between pulsation, mass loss, and third dredge-up in more detail.
An inspection of near-IR pulsation amplitudes reveals that it is tightly correlated with colour, with a similar correlation coefficient as between period and colour for Tc-poor and Tc-rich Miras, respectively. Thus, the dust mass-loss rate seems to be dependent on both pulsation period and amplitude.
We also discussed hypotheses to elucidate the process(es) that might be at work to form the two sequences of Miras. We find that a mechanism that leads to an increase of pulsation period upon 3DUP appears unlikely. We do not find supportive evidence that the sequences could be the result of two groups of stars with different masses (at a given pulsation period) because the implied distance from the Galactic mid-plane as well as the radial velocity dispersion decrease in parallel and smoothly with increasing period for both groups. The analysis suffers from uncertainties on the distances, however. Two more hypotheses suggest that the (dust) mass-loss rate and/or the dust emissivity decrease upon 3DUP. It is conceivable that dust grains form less efficiently when the atmospheric composition of the star changes upon 3DUP, or that reactions that are important for dust formation are strongly influenced by the presence of ions that are produced by the radioactive decay of unstable isotopes that result from internal nucleosynthesis (e.g. 26Al). However, the physical mechanism at the microscopic scale that would be required by these hypotheses are not directly obvious. Finally, the chemistry and line formation of Tc in cool stellar atmospheres are not well understood, and we considered the possibility that stars in a certain parameter range appear Tc-poor not because Tc is not present, but because the Tc lines are not excited. In conclusion, at this point in time we cannot offer a hypothesis that plausibly explains the available observational evidence.
We also applied the clear separation of Tc-poor from Tc-rich Miras to a large sample of Galactic bulge Miras to investigate if 3DUP occurs in this population. Several bulge Miras were indeed found in the region of the vs. diagram where post-3DUP Miras are expected to be found. However, their number is not large, and we conclude that 3DUP is possible in bulge stars, but probably not a wide-spread phenomenon. This is in agreement with the finding that intrinsic carbon stars on the TP-AGB are rare in the bulge.
We encourage further studies of the observational evidence presented in this paper, which might be a hint at a hitherto unknown, but potentially important process influencing mass loss on the TP-AGB.
Acknowledgements.
We thank T. Lebzelter for helpful comments and discussions. SU thanks his brother Richard for help with installing the GNU Data Language (GDL) that was used for the data analysis in this paper. IM acknowledges support from the UK Science and Technology Facilities Council under grant ST/L000768/1. We thank the XSL team for collecting, reducing, and making available the data used for this work, in particular Anaïs Gonneau for her support with retrieving the XSL data. We acknowledge with thanks the variable star observations from the AAVSO International Database contributed by observers worldwide and used in this research. This publication makes use of data products from the Two Micron All Sky Survey, which is a joint project of the University of Massachusetts and the Infrared Processing and Analysis Center/California Institute of Technology, funded by the National Aeronautics and Space Administration and the National Science Foundation. This publication makes use of data products from the Wide-field Infrared Survey Explorer, which is a joint project of the University of California, Los Angeles, and the Jet Propulsion Laboratory/California Institute of Technology, funded by the National Aeronautics and Space Administration. This research is based on observations with AKARI, a JAXA project with the participation of ESA.References
- Abia et al., (2002) Abia, C., Domínguez, I., Gallino, R., Busso, M., Masera, S., et al., 2002, ApJ, 579, 817
- Azzopardi et al., (1988) Azzopardi, M., Lequeux, J., & Rebeirot, E., 1988, A&A, 202, L27
- Barnbaum & Morris, (1993) Barnbaum, C., & Morris, M., 1993, AAS, 182, 4617
- Bensby et al., (2013) Bensby, T., Yee, J. C., Feltzing, S., Johnson, J. A., Gould, A., et al., 2013, A&A, 549, A147
- Bernhard & Hümmerich, (2013) Bernhard, K., & Hümmerich, S., 2013, Open European Journal on Variable Stars, 159, 1
- Blanco & Terndrup, (1989) Blanco, V. M., & Terndrup, D. M., 1989, AJ, 98, 843
- Blommaert, (1992) Blommaert, J. A. D. L., 1992, Ph.D. thesis, Leiden University, the Netherlands
- Boyer et al., (2013) Boyer, M. L., Girardi, L., Marigo, P., Williams, B. F., Aringer, B., et al., 2013, ApJ, 774, 83
- Bozman et al., (1968) Bozman, W. R., Corliss, C. H., & Tech, J. L., 1968, Journal of Research of the National Institute of Standards and Technology, Sect. A 72(6), 559–608
- Catchpole et al., (1979) Catchpole, R. M., Robertson, B. S. C., Lloyd-Evans, T. H. H., Feast, M. W., Glass, I. S., et al., 1979, South African Astron. Obs. Circ., 1, 61
- Chen et al., (2014) Chen, Y.-P., Trager, S. C., Peletier, R. F., Lançon, A., Vazdekis, A., et al., 2014, The Messenger, 158, 30
- Cioni et al., (2000) Cioni, M.-R., Loup, C., Habing, H. J., Fouqué, P., Bertin, E., et al., 2000, A&AS, 144, 235
- Cristallo et al., (2007) Cristallo, S., Straniero, O., Lederer, M. T., & Aringer, B., 2007, ApJ, 667, 489
- Cristallo et al., (2009) Cristallo, S., Straniero, O., Gallino, R., Piersanti, L., Domínguez, I., & Lederer, M. T., 2009, ApJ, 696, 797
- Cutri et al., (2012) Cutri, R. M., Skrutskie, M. F., van Dyk, S., Beichman, C. A., Carpenter, J. M., et al., 2012, VizieR Online Data Catalog, 2281
- Danilovich et al., (2015) Danilovich, T., Teyssier, D., Justtanont, K., Olofsson, H., Cerrigone, L., et al., 2015, A&A, 581, A60
- De Beck et al., (2010) De Beck, E., Decin, L., de Koter, A., Justtanont, K., Verhoelst, T., et al., 2010, A&A, 523, A18
- Decin et al., (2017) Decin, L., Richards, A. M. S., Waters, L. B. F. M., Danilovich, T., Gobrecht, D., et al., 2017, A&A, 608, A55
- DENIS Consortium, (2005) DENIS Consortium, 2005, VizieR Online Data Catalog, 2263
- Desai et al., (1997) Desai, S. R., Wu, H., Rohlfing, C. M., & Wang, L.-S., 1997. J. Chem. Phys., 106, 1309
- Eriksson et al., (2014) Eriksson, K., Nowotny, W., Höfner, S., Aringer, B., & Wachter, A., 2014, A&A, 566, A95
- Feast, (1963) Feast, M. W., 1963, MNRAS, 125, 367
- Feast et al., (1972) Feast, M. W., Woolley, R., & Yilmaz, N., 1972, MNRAS, 158, 23
- Feast, (2009) Feast, M. W., 2009, in AGB Stars and Related Phenomena, eds. Ueta, T., Matsunaga, N., and Ita, Y., p. 48
- Fouque et al., (1992) Fouque, P., Le Bertre, T., Epchtein, N., Guglielmo, F., & Kerschbaum, F., 1992, A&AS, 93, 151
- García-Hernández et al., (2013) García-Hernández, D. A., Zamora, O., Yagüe, A., Uttenthaler, S., Karakas, A. I., et al., 2013, A&A, 555, L3
- Glass et al., (2009) Glass, I. S., Schultheis, M., Blommaert, J. A. D. L., Sahai, R., Stute, M., et al., 2009, MNRAS, 395, L11
- Glassgold, (1995) Glassgold, A. E., 1995, ApJ, 438, L111
- Gobrecht et al., (2016) Gobrecht, D., Cherchneff, I., Sarangi, A., Plane, J. M. C., & Bromley, S. T., 2016, A&A, 585, A6
- Goldman et al., (2016) Goldman, S. R., van Loon, J. Th., Zijlstra, A. A., Green, J. A., Wood, P. R., et al., arXiv:1610.05761, accepted for publication in MNRAS
- Gonzalez et al., (2011) Gonzalez, O. A., Rejkuba, M., Zoccali, M., Valenti, E., & Minniti, D., 2011, A&A, 534, A3
- Gorfer, (2005) Gorfer, M., 2005, Master thesis, University of Vienna, Austria
- Groenewegen, (1993) Groenewegen, M. A. T., 1993, A&A, 271, 180
- Groenewegen et al., (1999) Groenewegen, M. A. T., Baas, F., Blommaert, J. A. D. L., Stehle, R., & Josselin, E., et al., 1999, A&AS, 140, 197
- Groenewegen & De Jong, (1998) Groenewegen, M. A. T., & de Jong, T., 1998, A&A, 337, 797
- Groenewegen et al., (2009) Groenewegen, M. A. T., Sloan, G. C., Soszyński, I., & Petersen, E. A., 2009, A&A, 506, 1277
- Guha Niyogi et al., (2011) Guha Niyogi, S., Speck, A. K., & Onaka, T., 2011, ApJ, 733, 93
- Höfner, (2008) Höfner, S., 2008, A&A, 491, L1
- Höfner et al., (2016) Höfner, S., Bladh, S., Aringer, B., & Ahuja, R., 2016, A&A, 594, A108
- Höfner & Olofsson, (2018) Höfner, S., & Olofsson, H., 2018, A&ARv, 26, 1
- Jura et al., (1993) Jura, M., Yamamoto, A., & Kleinmann, S. G., 1993, ApJ, 413, 298
- Jones et al., (2012) Jones, O. C., Kemper, F., Sargent, B. A., McDonald, I., Gielen, C., et al., 2012, MNRAS, 427, 3209
- Karakas, (2014) Karakas, A. I., 2014, MNRAS, 445, 347
- Karovicova et al., (2013) Karovicova, I., Wittkowski, M., Ohnaka, K., Boboltz, D. A., Fossat, E., & Scholz, M., 2013, A&A, 560, A75
- Kerschbaum & Hron, (1994) Kerschbaum, F., & Hron, J., 1994, A&AS, 106, 397
- Kerschbaum, (1995) Kerschbaum, F., 1995, A&AS, 113, 441
- Kervella et al., (2015) Kervella, P., Montarges, M., Lagadec, E., Ridgway, S. T., Haubois, X., et al., 2015, A&A, 578, A77
- Knapp, (1985) Knapp, G. R., 1985, ApJ, 293, 273
- Knapp, (1986) Knapp, G. R., 1986, ApJ, 311, 731
- Knapp & Morris, (1985) Knapp, G. R., & Morris, M., 1985, ApJ, 292, 640
- Knapp et al., (1998) Knapp, G. R., Young, K., Lee, E., & Jorissen, A., 1998, ApJS, 117, 209
- Lebzelter & Hron, (1999) Lebzelter, T., & Hron, J., 1999, A&A, 351, 533
- Lebzelter & Hron, (2003) Lebzelter, T., & Hron, J., 2003, A&A, 411, 533
- Lebzelter & Obbrugger, (2009) Lebzelter, T., & Obbrugger, M., 2009, AN, 330, 390
- Lebzelter et al., (2006) Lebzelter, T., Posch, T., Hinkle, K., Wood, P. R., & Bouwman, J., 2006, ApJ, 653, L145
- Little et al., (1987) Little, S. J., Little-Marenin, I. R., & Bauer, W. H., 1987, AJ, 94, 981
- Lloyd Evans, (1985) Lloyd Evans, T., 1985, Cool Stars with Excesses of Heavy Elements, Proceedings of the Strasbourg Observatory Colloquium, 114, eds. M. Jaschek and P. C. Keenan (Dordrecht, D. Reidel Publishing Co.), 163
- Lloyd Evans, (2010) Lloyd Evans, T., 2010, JApA, 31, 177
- Macri et al., (2015) Macri, L. M., Ngeow, C.-C., Kanbur, S. M., Mahzooni, S., & Smitka, M. T., 2015, AJ, 149, 117
- Mathews et al., (1986) Mathews, G. J., Takahashi, K., Ward, R. A., Howard, W. M., 1986, ApJ, 302, 410
- Matsunaga et al., (2005) Matsunaga, N., Fukushi, H., & Nakada, Y., 2005, MNRAS, 364, 117
- Matsunaga et al., (2017) Matsunaga, N., Menzies, J. W., Feast, M. W., Whitelock, P. A., Onozato, H., et al., 2017, MNRAS, 469, 4949
- Mayer et al., (2014) Mayer, A., Jorissen, A., Paladini, C., Kerschbaum, F., Pourbaix, D., et al., 2014, A&A, 570, A113
- McDonald et al., (2010) McDonald, I., Sloan, G. C., Zijlstra, A. A., Matsunaga, N., Matsuura, M., et al., 2010, ApJ, 717, L92
- McDonald & Zijlstra, (2016) McDonald, I., & Zijlstra, A. A., 2016, ApJ, 823, L38
- Merrill & Greenstein, (1956) Merrill, P. W., & Greenstein, J. L., 1956, ApJS, 2, 225
- Merrill et al., (1962) Merrill, P. W., Deutsch, A. J., & Keenan, P. C., 1962, ApJ, 136, 21
- Miszalski et al., (2013) Miszalski, B., Mikołajewska, J., & Udalski, A, 2013, MNRAS, 432, 3186
- Murakami et al., (2007) Murakami, H., Baba, H., Barthel, P., Clements, D. L., Cohen, M., et al., 2007, PASJ, 59, S369
- Nataf, (2016) Nataf, D. M., 2016, PASA, 33, 24
- Neugebauer et al., (1984) Neugebauer, G., Habing, H. J., van Duinen, R., Aumann, H. H., Baud, B., et al., 1984, ApJ, 278, L1
- Nishiyama et al., (2009) Nishiyama, S., Tamura, M., Hatano, H., Kato, D., Tanabe, T., et al., 2009, ApJ, 696, 1407
- Nyman et al., (1992) Nyman, L.-Å,̇ Booth, R. S., Carlstrom, U., Habing, H. J., Heske, A., et al., 1992, A&AS, 93, 121
- Olofsson et al., (1988) Olofsson, H., Eriksson, K., & Gustafsson, B., 1988, A&A, 196, L1
- Olofsson et al., (2002) Olofsson, H., González Delgado, D., Kerschbaum, F., & Schöier, F. L., 2002, A&A, 391, 1053
- Ortiz & Guerrero, (2016) Ortiz, R., & Guerrero, M. A., 2016, MNRAS, 461, 3036
- Pojmanski, (1997) Pojmanski, G., 1997, Acta Astronomica, 47, 467
- Posch et al., (2002) Posch, T., Kerschbaum, F., Mutschke, H., Dorschner, J., & Jäger, C., 2002, A&A, 393, L7
- Price et al., (2010) Price, S. D., Smith, B. J., Kuchar, T. A., Mizuno, D. R., & Kraemer, K. E., 2010, ApJS, 190, 203
- Qin et al., (2018) Qin, W., Nataf, D. M., Zakamska, N., Wood, P. R., & Casagrande, L., accepted for publication in ApJ, arxiv:1808.01294
- Ramstedt & Olofsson, (2014) Ramstedt, S., & Olofsson, H., 2014, A&A, 566, A145
- Ramstedt et al., (2009) Ramstedt, S., Schöier, F. L., & Olofsson, H., 2009, A&A, 499, 515
- Ramstedt et al., (2008) Ramstedt, S., Schöier, F. L., Olofsson, H., & Lundgren, A. A., 2008, A&A, 487, 645
- Ramstedt et al., (2018) Ramstedt, S., Mohamed, S., Olander, T., Vlemmings, W. H. T., Khouri, T., et al., 2018, A&A accepted, arXiv:1806.04979
- Rard, (1983) Rard, J. A., 1983, ”Critical review of the chemistry and thermodynamics of technetium and some of its inorganic compounds and aqueous species”. Technical Report, Lawrence Livermore National Lab., United States
- Renzini & Greggio, (1990) Renzini, A., & Greggio, L., 1990, in Jarvis B. J., Terndrup D. M, eds., Bulges of Galaxies. ESO, Garching, p. 47
- Reimers, (1975) Reimers, D., 1975, Mémoires of the Société Royale des Sciences de Liège, 8, 369
- Riebel et al., (2010) Riebel, D., Meixner, M., Fraser, O., Srinivasan, S., Cook, K., et al., 2010, ApJ, 723, 1195
- Riebel et al., (2015) Riebel, D., Boyer, M. L., Srinivasan, S., Whitelock, P., Meixner, M., et al., 2015, ApJ, 807, 1
- Sackmann & Boothroyd, (1992) Sackmann, I.-J., & Boothroyd, A. I., 1992, ApJ, 392, L71
- Samus et al., (2017) Samus, N. N., Kazarovets, E. V., Durlevich, O. V., Kireeva, N. N., & Pastukhova, E. N., 2017, General Catalogue of Variable Stars: Version GCVS 5.1, Astronomy Reports, 61, 80
- Schatz, (1983) Schatz, G., 1983, A&A, 122, 327
- Schöier & Olofsson, (2001) Schöier, F. L., & Olofsson, H., 2001, A&A, 368, 969
- Schöier et al., (2006) Schöier, F. L., Olofsson, H., & Lundgren, A. A., 2006, A&A, 454, 247
- Schöier et al., (2013) Schöier, F. L., Ramstedt, S., Olofsson, H., Lindqvist, M., Bieging, J. H., et al., 2013, A&A, 550, A78
- Schöier et al., (2002) Schöier, F. L., Ryde, N., & Olofsson, H., 2002, A&A, 391, 577
- Scholz et al., (2014) Scholz, M., Ireland, M. J., & Wood, P. R., 2014, A&A, 565, A119
- Schultheis et al., (1998) Schultheis, M., Ng, Y. K., Hron, J., & Kerschbaum, F., 1998, A&A, 338, 581
- Skrutskie et al., (2006) Skrutskie, M. F., Cutri, R. M., Stiening, R., Weinberg, M. D., Schneider, S., et al., 2006, AJ, 131, 1163
- (100) Sloan, G. C., Kraemer, K. E., Goebel, J. H., & Price, S. D., 2003a, ApJ, 594, 483
- (101) Sloan, G. C., Kraemer, K. E., Price, S. D., & Shipman, R. F., 2003b, ApJS, 147, 379
- Smith & Lambert, (1988) Smith, V. V., & Lambert, D. L., 1988, ApJ, 333, 219
- Smith et al., (1995) Smith, V. V., Plez, B., Lambert, D. L., & Lubowich, D. A., 1995, ApJ, 441, 735
- Smolders et al., (2012) Smolders, K., Neyskens, P., Blommaert, J. A. D. L., Hony, S., Van Winckel, H., et al., 2012, A&A, 540, A72
- Speck, (2012) Speck, A., 2012, JAVSO, 40, 244
- Straniero et al., (2006) Straniero, O., Gallino, R., & Cristallo, S., 2006, Nuclear Physics A, 777, 311
- Tabur et al., (2009) Tabur, V., Kiss, L. L., & Bedding, T. R., 2009, ApJ, 703, 72
- Trabucchi et al., (2017) Trabucchi, M., Wood, P. R., Montalbán, J., Marigo, P., Pastorelli, G., & Girardi, L., 2017, ApJ, 847, 139
- Tyson & Rich, (1991) Tyson, N. D., & Rich, R. M., 1991, ApJ, 367, 547
- Uttenthaler et al., (2007) Uttenthaler, S., Hron, J., Lebzelter, T., Busso, M., Schultheis, M., & Käufl, H. U., 2007, A&A, 463, 251
- Uttenthaler & Lebzelter, (2010) Uttenthaler, S., & Lebzelter, T., 2010, A&A, 510, A62
- Uttenthaler et al., (2011) Uttenthaler, S., Van Stiphout, K., Voet, K., Van Winckel, H., Van Eck, S., et al., 2011, A&A, 531, A88
- Uttenthaler, (2013) Uttenthaler, S., 2013, A&A, 556, A38 (Paper I)
- Uttenthaler et al., (2016) Uttenthaler, S., Meingast, S., Lebzelter, T., Aringer, B., Joyce, R. R., et al., 2016, A&A, 585, A145
- Van Eck & Jorissen, (1999) Van Eck, S., & Jorissen, A., 1999, A&A, 345, 127
- Van Eck et al., (2000) Van Eck, S., Jorissen, A., Udry, S., Mayor, M., Burki, G., et al., 2000, A&AS, 145, 51
- Van Eck et al., (1998) Van Eck, S., Jorissen, A., Udry, S., Mayor, M., & Pernier, B., 1998, A&A, 329, 971
- Vanture et al., (1991) Vanture, A. D., Wallerstein, G., Brown, J. A., & Bazan, G., 1991, ApJ, 381, 278
- Vassiliadis & Wood, (1993) Vassiliadis, E., & Wood, P. R., 1993, ApJ, 413, 641
- Vernet et al., (2011) Vernet, J., Dekker, H., D’Odorico, S., Kaper, L., Kjaergaard, P., et al., 2011, A&A, 536, A105
- Volk et al., (1999) Volk, K., Kwok, S., & Hrivnak, B. J., 1999, ApJ, 516, L99
- von Helden et al., (2000) von Helden, G., Tielens, A. G. G. M., van Heijnsbergen, D., Duncan, M. A., Hony, S., et al., 2000, Science, 288, 313
- Willson, (2000) Willson, L. A., 2000, ARA&A, 38, 573
- Winters et al., (2003) Winters, J. M., Le Bertre, T., Jeong, K. S., Nyman, L.-Å., & Epchtein, N., 2003, A&A, 409, 715
- Whitelock, (1987) Whitelock, P. A., 1987, PASP, 99, 573
- Whitelock et al., (1987) Whitelock, P. A., Pottasch, S. R., & Feast, M. W., 1987, in Late stages of stellar evolution; Proceedings of the Workshop, Calgary, Canada, p. 269
- Whitelock et al., (1994) Whitelock, P. A., Menzies, J., Feast, M., Marang, F., Carter, B., et al., 1994, MNRAS, 267, 711
- Whitelock et al., (1996) Whitelock, P. A., Irwin, M., & Catchpole, R. M., 1996, New Astron., 1, 57
- Whitelock et a., (2000) Whitelock, P. A., Marang, F., & Feast, M. W., 2000, MNRAS, 319, 728
- Whitelock et al., (2006) Whitelock, P. A., Feast, M. W., Marang, F., & Groenewegen, M. A. T., 2006, MNRAS, 369, 751
- Whitelock et al., (2008) Whitelock, P. A., Feast, M. W., & Van Leeuwen, F., 2008, MNRAS, 386, 313
- Wood et al., (1999) Wood, P. R., Alcock, C., Allsman, R. A., Alves, D., Axelrod, T. S., et al., 1999, in IAU Symp. 191, Asymptotic Giant Branch Stars, ed. T. L. Bertre, A. Lebre, & C. Waelkens (Cambridge: Cambridge Univ. Press), 151
- Wood, (2000) Wood, P. R., 2000, PASA, 17, 18
- Wood, (2015) Wood, P. R., 2015, MNRAS, 448, 3829
- Wright et al., (2010) Wright, E. L., Eisenhardt, P. R. M., Mainzer, A. K., Ressler, M. E., Cutri, R. M., et al., 2010, AJ, 140, 1868
- Young, (1995) Young, K., 1995, ApJ, 445, 872
- Zijlstra et al., (2004) Zijlstra, A. A., Bedding, T. R., Markwick, A. J., Loidl-Gautschy, R., Tabur, V., et al., 2004, MNRAS, 352, 325
1]
| Name | Tc | Ref. | P | VT | ST | Ref. | [1.25] | [2.20] | [12] | [25] | [60] | [9] | [18] | [65] | [90] | [22] | ||||
|---|---|---|---|---|---|---|---|---|---|---|---|---|---|---|---|---|---|---|---|---|
| (days) | (mag) | (mag) | (mag) | (mag) | (mag) | (mag) | (mag) | (mag) | (mag) | (mag) | (mag) | (mag) | (mag) | (mag) | ||||||
| (1) | (2) | (3) | (4) | (5) | (6) | (7) | (8) | (9) | (10) | (11) | (12) | (13) | (14) | (15) | (16) | (17) | (18) | (19) | (20) | (21) |
| R And | 1 | 1,3 | 409.9 | Mira | S | 0.226 | 1.902 | 0.358 | ||||||||||||
| W And | 1 | 1,2 | 396.3 | Mira | M | 0.184 | 1.461 | 0.309 | ||||||||||||
| Y And | 0 | 1 | 220.9 | Mira | M | 0.036 | 1.101 | 0.040 | ||||||||||||
| Z Ant | 1 | 5 | 128.9 | SRV | S | 0.242 | 1.396 | 0.357 | ||||||||||||
| R Aql | 0 | 3,10 | 270.6 | Mira | M | 0.120 | 1.361 | 0.038 | ||||||||||||
| RR Aql | 0 | 7 | 399.8 | Mira | M | 0.065 | 1.576 | 0.030 | ||||||||||||
| RT Aql | 0 | 1 | 327.8 | Mira | M | 0.113 | 1.331 | 0.031 | ||||||||||||
| SY Aql | 0 | 1 | 356.3 | Mira | M | 0.200 | 1.436 | 0.074 | ||||||||||||
| UV Aql | 1 | 12 | 385.5 | SRV | C | 0.216 | 1.972 | 0.368 | ||||||||||||
| V335 Aql | 0 | 15 | 176.2 | Mira | M | 0.037 | 1.210 | 0.041 | ||||||||||||
| V899 Aql | 1 | 11 | 373.7 | Mira | S | 1.440 | ||||||||||||||
| V915 Aql | 1 | 4 | 81.8 | SRV | S | 0.294 | 1.405 | 0.427 | ||||||||||||
| V 1717Aql | 1 | 11 | 357.0 | Mira | S | 1.540 | ||||||||||||||
| W Aql | 1 | 11 | 487.8 | Mira | S | 0.358 | 2.090 | 0.439 | ||||||||||||
| R Aqr | 1 | 7 | 388.2 | Mira | M | 0.051 | 1.578 | 0.035 | ||||||||||||
| T Aqr | 0 | 1 | 201.8 | Mira | M | 0.070 | 1.174 | 0.031 | ||||||||||||
| RZ Ari | 0 | 15 | 54.8 | SRV | M | 0.083 | 1.117 | 0.083 | ||||||||||||
| AU Aur | 1 | 13 | 400.5 | Mira | C | 0.264 | 2.276 | 0.267 | ||||||||||||
| AZ Aur | 1 | 13 | 413.7 | Mira | C | 0.252 | 2.125 | 0.311 | ||||||||||||
| NO Aur | 1 | 14 | 102.1 | SRV | M | 0.196 | 1.151 | 0.377 | ||||||||||||
| RU Aur | 1 | 7 | 469.6 | Mira | M | 0.322 | 2.073 | 0.477 | ||||||||||||
| SZ Aur | 1 | 10 | 458.1 | Mira | MS | 0.222 | 1.393 | 0.340 | ||||||||||||
| UV Aur | 1 | 1 | 394.4 | Mira | C | 0.220 | 1.900 | 0.307 | ||||||||||||
| VX Aur | 0 | 1 | 322.6 | Mira | M | 0.202 | 1.211 | 0.271 | ||||||||||||
| R Boo | 0 | 1 | 223.6 | Mira | M | 0.228 | 1.203 | 0.350 | ||||||||||||
| V Boo | 1 | 4 | 258.2 | SRV | M | 0.210 | 1.133 | 0.376 | ||||||||||||
| T Cae | 1 | 15 | 156.0 | SRV | C | 0.250 | 1.519 | 0.362 | ||||||||||||
| T Cam | 1 | 1 | 373.9 | Mira | S | 0.194 | 1.741 | 0.310 | ||||||||||||
| T Cap | 0 | 7 | 270.7 | Mira | M | 0.048 | 1.295 | 0.027 | ||||||||||||
| AU Car | 1 | 11 | 347.0 | Mira | S | 1.620 | ||||||||||||||
| CM Car | 0 | 15 | 339.0 | Mira | M | 0.020 | 1.448 | 0.039 | ||||||||||||
| KN Car | 1 | 5 | 352.0 | Mira | S | 0.248 | 1.509 | 0.371 | ||||||||||||
| RX Car | 1 | 11 | 336.0 | Mira | S | 1.640 | ||||||||||||||
| S Car | 0 | 1 | 148.9 | Mira | M | 0.278 | 1.354 | 0.392 | ||||||||||||
| U Cas | 1 | 1 | 276.9 | Mira | S | 0.306 | 1.451 | 0.400 | ||||||||||||
| W Cas | 1 | 13 | 405.9 | Mira | C | 0.196 | 1.720 | 0.289 | ||||||||||||
| R Cen | 0 | 1 | 538.1 | Mira | M | 0.027 | 1.286 | 0.019 | ||||||||||||
| V744 Cen | 0 | 4,5 | 167.3 | SRV | M | 0.434 | 1.271 | 0.507 | ||||||||||||
| V763 Cen | 0 | 15 | 60.0 | SRV | M | 0.278 | 1.112 | 0.410 | ||||||||||||
| VX Cen | 1 | 5 | 109.1 | SRV | S | 0.252 | 1.413 | 0.404 | ||||||||||||
| T Cep | 1 | 1,3,10 | 386.6 | Mira | M | 0.182 | 1.328 | 0.308 | ||||||||||||
| $o$ Cet | 1 | 1,3 | 332.7 | Mira | M | 0.076 | 1.296 | 0.037 | ||||||||||||
| R Cet | 0 | 1 | 165.9 | Mira | M | 0.066 | 1.240 | 0.022 | ||||||||||||
| T Cet | 1 | 14 | 159.3 | SRV | MS | 0.276 | 1.304 | 0.337 | ||||||||||||
| U Cet | 0 | 7,9 | 233.7 | Mira | M | 0.176 | 1.220 | 0.060 | ||||||||||||
| W Cet | 1 | 1,9 | 352.1 | Mira | MS | 0.051 | 1.245 | 0.021 | ||||||||||||
| R Cha | 1 | 15 | 337.8 | Mira | M | 0.258 | 1.483 | 0.354 | ||||||||||||
| CR Cir | 0 | 6 | 108.2 | SRV | S | 0.242 | 1.253 | 0.341 | ||||||||||||
| BZ CMa | 1 | 11 | 332.8 | Mira | S | 1.630 | ||||||||||||||
| V355 CMa | 1 | 11 | 370.0 | Mira | S | 1.460 | ||||||||||||||
| R CMi | 1 | 1 | 337.7 | Mira | C | 0.079 | 1.369 | 0.034 | ||||||||||||
| U CMi | 0 | 1 | 410.3 | Mira | M | 0.035 | 1.265 | 0.032 | ||||||||||||
| V CMi | 1 | 1 | 366.3 | Mira | M | 0.061 | 1.249 | 0.021 | ||||||||||||
| XY CMi | 1 | 11 | 271.2 | Mira | S | 1.420 | ||||||||||||||
| R Cnc | 0 | 1 | 362.0 | Mira | M | 0.059 | 1.298 | 0.044 | ||||||||||||
| RS Cnc | 1 | 4,14 | 241.2 | SRV | MS | 0.158 | 1.163 | 0.228 | ||||||||||||
| R Col | 1 | 1 | 328.1 | Mira | M | 0.260 | 1.296 | 0.363 | ||||||||||||
| T Col | 0 | 1 | 226.1 | Mira | M | 0.063 | 1.151 | 0.016 | ||||||||||||
| RY CrA | 0 | 15 | 206.3 | Mira | M | 0.034 | 1.243 | 0.042 | ||||||||||||
| V CrB | 1 | 12,13 | 358.0 | Mira | C | 0.276 | 2.153 | 0.388 | ||||||||||||
| X CrB | 0 | 1 | 240.9 | Mira | M | 0.258 | 1.388 | 0.333 | ||||||||||||
| U Crt | 0 | 15 | 168.1 | Mira | M | 0.016 | 1.205 | 0.024 | ||||||||||||
| BH Cru | 1 | 10 | 524.4 | Mira | C | 0.028 | 1.632 | 0.029 | ||||||||||||
| AA Cyg | 1 | 14 | 212.7 | SRV | S | 0.224 | 1.441 | 0.365 | ||||||||||||
| AW Cyg | 1 | 12 | 213.0 | SRV | C | 0.302 | 1.947 | 0.423 | ||||||||||||
| $χ$ Cyg | 1 | 1,3 | 408.2 | Mira | S | 0.156 | 1.863 | 0.240 | ||||||||||||
| LX Cyg | 1 | 10 | 587.5 | Mira | C | 0.272 | 2.199 | 0.358 | ||||||||||||
| R Cyg | 1 | 1 | 426.6 | Mira | S | 0.246 | 1.390 | 0.399 | ||||||||||||
| RU Cyg | 1 | 4 | 233.2 | SRV | M | 0.208 | 1.445 | 0.324 | ||||||||||||
| U Cyg | 1 | 13 | 464.8 | Mira | C | 0.190 | 1.732 | 0.295 | ||||||||||||
| V441 Cyg | 1 | 9 | 286.6 | SRV | S | 0.068 | 1.516 | 0.079 | ||||||||||||
| V460 Cyg | 1 | 12 | 180.0 | SRV | C | 0.184 | 1.532 | 0.287 | ||||||||||||
| W Cyg | 1 | 3,4,7 | 132.8 | SRV | M | 0.040 | 1.193 | 0.016 | ||||||||||||
| WX Cyg | 1 | 13 | 409.5 | Mira | C | 0.322 | 2.121 | 0.414 | ||||||||||||
| R Del | 0 | 1 | 285.7 | Mira | M | 0.262 | 1.526 | 0.404 | ||||||||||||
| U Del | 1 | 4,7 | 119.8 | SRV | M | 0.141 | 1.223 | 0.016 | ||||||||||||
| Z Del | 1 | 1 | 304.5 | Mira | S | 0.036 | 1.154 | 0.042 | ||||||||||||
| R Dor | 0 | 4 | 327.1 | SRV | M | 0.206 | 1.575 | 0.230 | ||||||||||||
| T Dra | 1 | 13 | 422.7 | Mira | C | 0.212 | 2.698 | 0.319 | ||||||||||||
| UX Dra | 1 | 12,13 | 177.0 | SRV | C | 0.194 | 1.640 | 0.374 | ||||||||||||
| W Dra | 0 | 10 | 289.6 | Mira | M | 0.016 | 1.340 | 0.029 | ||||||||||||
| WZ Dra | 1 | 7 | 411.9 | Mira | M | 0.018 | 1.379 | 0.102 | ||||||||||||
| T Eri | 0 | 1 | 252.4 | Mira | M | 0.043 | 1.194 | 0.008 | ||||||||||||
| U Eri | 0 | 1 | 274.4 | Mira | M | 0.031 | 1.236 | 0.037 | ||||||||||||
| W Eri | 0 | 9 | 373.6 | Mira | M | 0.085 | 1.366 | 0.093 | ||||||||||||
| NZ Gem | 0 | 2 | 30.1 | SRV | S | 0.184 | 1.031 | 0.279 | ||||||||||||
| R Gem | 1 | 1 | 370.1 | Mira | S | 0.226 | 1.071 | 0.333 | ||||||||||||
| T Gem | 1 | 1 | 287.7 | Mira | S | 0.270 | 1.412 | 0.356 | ||||||||||||
| V Gem | 1 | 1 | 275.1 | Mira | M | 0.304 | 1.318 | 0.405 | ||||||||||||
| VX Gem | 1 | 12,13 | 380.0 | Mira | C | 0.077 | 1.801 | 0.071 | ||||||||||||
| ZZ Gem | 1 | 13 | 315.6 | Mira | C | 0.032 | 2.037 | 0.059 | ||||||||||||
| $π$1 Gru | 1 | 14 | 198.8 | SRV | S | 0.278 | 1.638 | 0.329 | ||||||||||||
| S Gru | 1 | 7,9 | 401.0 | Mira | MS | 0.107 | 1.239 | 0.019 | ||||||||||||
| FR Her | 0 | 15 | 130.8 | Mira | M | 0.020 | 1.024 | 0.028 | ||||||||||||
| OP Her | 1 | 4,14 | 120.5 | SRV | M | 0.164 | 1.261 | 0.309 | ||||||||||||
| RU Her | 1 | 7 | 485.6 | Mira | M | 0.142 | 1.618 | 0.061 | ||||||||||||
| S Her | 1 | 10 | 304.1 | Mira | MS | 0.080 | 1.166 | 0.025 | ||||||||||||
| ST Her | 1 | 4,14 | 147.0 | SRV | MS | 0.206 | 1.285 | 0.318 | ||||||||||||
| SV Her | 0 | 1 | 238.4 | Mira | M | 0.029 | 1.131 | 0.035 | ||||||||||||
| T Her | 0 | 10 | 163.9 | Mira | M | 0.268 | 1.222 | 0.340 | ||||||||||||
| XZ Her | 0 | 15 | 169.9 | Mira | M | 0.018 | 1.210 | 0.055 | ||||||||||||
| R Hor | 1 | 7,9 | 404.6 | Mira | MS | 0.069 | 1.256 | 0.019 | ||||||||||||
| T Hor | 0 | 7,9 | 218.7 | Mira | M | 0.054 | 1.141 | 0.016 | ||||||||||||
| TW Hor | 1 | 7,9 | 269.6 | SRV | C | 0.026 | 1.497 | 0.064 | ||||||||||||
| HV 12667 | 0 | 15 | 679.4 | Mira | M | 0.188 | 1.413 | 0.020 | ||||||||||||
| CZ Hya | 1 | 13 | 432.0 | Mira | C | 0.101 | 2.263 | 0.061 | ||||||||||||
| R Hya | 1 | 7,10 | 376.6 | Mira | M | 0.032 | 1.261 | 0.025 | ||||||||||||
| RR Hya | 1 | 1 | 342.1 | Mira | M | 0.019 | 1.253 | 0.026 | ||||||||||||
| RU Hya | 0 | 7,9 | 333.2 | Mira | M | 0.040 | 1.196 | 0.006 | ||||||||||||
| U Hya | 1 | 12,13 | 389.4 | SRV | C | 0.362 | 1.519 | 0.439 | ||||||||||||
| W Hya | 0 | 4,10 | 388.6 | Mira | M | 0.038 | 1.459 | 0.033 | ||||||||||||
| T Ind | 1 | 1 | 162.0 | SRV | C | 0.316 | 1.417 | 0.402 | ||||||||||||
| RX Lac | 1 | 7 | 331.4 | SRV | MS | 0.101 | 1.324 | 0.037 | ||||||||||||
| S Lac | 0 | 1 | 240.2 | Mira | M | 0.258 | 1.305 | 0.347 | ||||||||||||
| RR Lib | 0 | 1 | 277.8 | Mira | M | 0.061 | 1.303 | 0.020 | ||||||||||||
| VX Lib | 0 | 15 | 58.8 | SRV | M | 0.024 | 1.290 | 0.036 | ||||||||||||
| Y Lib | 0 | 7,9 | 276.6 | Mira | M | 0.082 | 1.228 | 0.022 | ||||||||||||
| S Lup | 1 | 1 | 342.2 | Mira | S | 0.070 | 1.430 | 0.035 | ||||||||||||
| RT Lyn | 1 | 7 | 394.1 | Mira | M | 0.282 | 1.613 | 0.400 | ||||||||||||
| U Lyn | 0 | 7 | 440.5 | Mira | M | 0.230 | 1.478 | 0.311 | ||||||||||||
| HK Lyr | 1 | 12,13 | 186.0 | SRV | C | 0.286 | 2.054 | 0.389 | ||||||||||||
| U Mic | 0 | 7,9 | 332.9 | Mira | M | 0.060 | 1.248 | 0.021 | ||||||||||||
| CL Mon | 1 | 13 | 483.0 | Mira | C | 0.072 | 2.718 | 0.047 | ||||||||||||
| SY Mon | 0 | 7 | 425.1 | Mira | M | 0.332 | 1.485 | 0.477 | ||||||||||||
| R Nor | 0 | 10 | 496.2 | Mira | M | 0.049 | 1.310 | 0.023 | ||||||||||||
| U Oct | 0 | 1 | 302.5 | Mira | M | 0.083 | 1.215 | 0.135 | ||||||||||||
| R Oph | 0 | 1 | 303.1 | Mira | M | 0.074 | 1.366 | 0.021 | ||||||||||||
| RY Oph | 0 | 1 | 150.5 | Mira | M | 0.061 | 1.240 | 0.038 | ||||||||||||
| V Oph | 1 | 12,13 | 297.3 | Mira | C | 0.051 | 1.975 | 0.075 | ||||||||||||
| $o$1 Ori | 1 | 1,4,14 | 30.0 | SRV | MS | 0.164 | 1.145 | 0.249 | ||||||||||||
| S Ori | 1 | 10 | 433.4 | Mira | M | 0.039 | 1.352 | 0.022 | ||||||||||||
| V1365 Ori | 0 | 1 | 62.8 | SRV | M | 0.330 | 1.151 | 0.423 | ||||||||||||
| W Ori | 0 | 12,13 | 204.9 | SRV | C | 0.402 | 1.752 | 0.492 | ||||||||||||
| NU Pav | 0 | 7 | 86.5 | SRV | M | 0.248 | 1.313 | 0.298 | ||||||||||||
| SY Pav | 0 | 15 | 190.6 | Mira | M | 0.156 | 1.146 | 0.021 | ||||||||||||
| HR Peg | 1 | 1,4,14 | 50.0 | SRV | S | 0.206 | 1.265 | 0.340 | ||||||||||||
| RZ Peg | 1 | 1 | 436.9 | Mira | C | 0.302 | 1.807 | 0.434 | ||||||||||||
| S Peg | 0 | 7 | 314.4 | Mira | M | 0.063 | 1.280 | 0.025 | ||||||||||||
| TW Peg | 0 | 7 | 94.1 | SRV | M | 0.095 | 1.304 | 0.077 | ||||||||||||
| TX Peg | 1 | 4 | 85.9 | SRV | M | 0.206 | 1.218 | 0.340 | ||||||||||||
| UW Peg | 1 | 4 | 101.7 | SRV | M | 0.270 | 1.322 | 0.414 | ||||||||||||
| W Peg | 0 | 7 | 343.9 | Mira | M | 0.077 | 1.417 | 0.049 | ||||||||||||
| X Peg | 0 | 1 | 200.9 | Mira | M | 0.080 | 1.136 | 0.022 | ||||||||||||
| Z Peg | 1 | 1 | 327.8 | Mira | M | 0.188 | 1.310 | 0.351 | ||||||||||||
| UZ Per | 0 | 7 | 926.7 | SRV | M | 0.234 | 1.461 | 0.377 | ||||||||||||
| RX Psc | 1 | 11 | 281.4 | Mira | S | 1.290 | ||||||||||||||
| U Psc | 0 | 15 | 172.6 | Mira | M | 0.016 | 0.904 | 0.026 | ||||||||||||
| Z Psc | 1 | 12,13 | 155.8 | SRV | C | 0.202 | 1.515 | 0.372 | ||||||||||||
| L2 Pup | 1 | 1,4 | 140.5 | SRV | M | 0.170 | 1.245 | 0.204 | ||||||||||||
| NQ Pup | 1 | 15 | 11.5 | SRV | S | 0.274 | 1.236 | 0.400 | ||||||||||||
| CO Pyx | 1 | 11 | 329.0 | Mira | S | 1.330 | ||||||||||||||
| Y Scl | 0 | 9 | 96.0 | SRV | M | 0.012 | 1.285 | 0.032 | ||||||||||||
| RR Sco | 0 | 1 | 278.9 | Mira | M | 0.071 | 1.207 | 0.028 | ||||||||||||
| RZ Sco | 0 | 1 | 159.3 | Mira | M | 0.061 | 1.106 | 0.008 | ||||||||||||
| V635 Sco | 1 | 6 | 58.0 | SRV | S | 0.244 | 1.382 | 0.330 | ||||||||||||
| S Sct | 1 | 13 | 149.7 | SRV | C | 0.008 | 1.750 | 0.013 | ||||||||||||
| DX Ser | 0 | 7 | 360.0 | SRV | M | 0.085 | 1.364 | 0.027 | ||||||||||||
| R Ser | 1 | 1,3 | 353.6 | Mira | M | 0.138 | 1.323 | 0.022 | ||||||||||||
| Y Ser | 0 | 7 | 432.7 | SRV | M | 0.038 | 1.392 | 0.015 | ||||||||||||
| R Sgr | 0 | 1 | 268.6 | Mira | M | 0.075 | 1.199 | 0.016 | ||||||||||||
| RV Sgr | 1 | 1 | 318.9 | Mira | M | 0.042 | 1.213 | 0.012 | ||||||||||||
| RX Sgr | 1 | 1 | 333.3 | Mira | M | 0.067 | 1.335 | 0.031 | ||||||||||||
| T Sgr | 1 | 1,3 | 392.8 | Mira | S | 0.047 | 1.542 | 0.044 | ||||||||||||
| V781 Sgr | 1 | 12,13 | 208.7 | SRV | C | 0.234 | 1.834 | 0.327 | ||||||||||||
| SHV 0520 | 1 | 15 | 264.0 | SRV | M | 0.019 | 0.854 | 0.021 | ||||||||||||
| V1139 Tau | 1 | 14 | 80.5 | SRV | M | 0.176 | 1.300 | 0.288 | ||||||||||||
| BH Tel | 0 | 15 | 216.5 | Mira | M | 0.038 | 1.415 | 0.183 | ||||||||||||
| X TrA | 1 | 1 | 364.2 | SRV | C | 0.258 | 1.785 | 0.363 | ||||||||||||
| R Tri | 0 | 1 | 266.5 | Mira | M | 0.208 | 1.181 | 0.341 | ||||||||||||
| T Tuc | 0 | 7,9 | 247.1 | Mira | M | 0.122 | 1.157 | 0.021 | ||||||||||||
| RR UMa | 0 | 1 | 231.4 | Mira | M | 0.015 | 1.259 | 0.027 | ||||||||||||
| S UMa | 1 | 1,2 | 227.3 | Mira | S | 0.246 | 1.441 | 0.326 | ||||||||||||
| T UMa | 0 | 1 | 255.5 | Mira | M | 0.344 | 1.350 | 0.460 | ||||||||||||
| VW UMa | 0 | 7 | 66.0 | SRV | M | 0.260 | 1.219 | 0.350 | ||||||||||||
| VY UMa | 1 | 12,13 | 120.4 | SRV | C | 0.184 | 1.466 | 0.320 | ||||||||||||
| T UMi | 0 | 10 | 229.1 | Mira | M | 0.318 | 1.553 | 0.411 | ||||||||||||
| T UMi | 0 | 10 | 113.6 | SRV | M | 0.318 | 1.553 | 0.411 | ||||||||||||
| CI Vel | 0 | 15 | 141.4 | Mira | M | 0.020 | 1.167 | 0.030 | ||||||||||||
| HP Vel | 1 | 5 | 104.1 | SRV | S | 0.278 | 1.363 | 0.374 | ||||||||||||
| ER Vir | 0 | 7,9 | 55.0 | SRV | M | 0.004 | 1.124 | 0.014 | ||||||||||||
| EV Vir | 0 | 7,9 | 69.2 | SRV | M | 0.011 | 1.190 | 0.003 | ||||||||||||
| R Vir | 0 | 1 | 146.0 | Mira | M | 0.076 | 1.117 | 0.025 | ||||||||||||
| RS Vir | 0 | 1,7,9 | 352.0 | Mira | M | 0.112 | 1.340 | 0.059 | ||||||||||||
| RU Vir | 1 | 13 | 437.3 | Mira | C | 0.057 | 2.865 | 0.037 | ||||||||||||
| S Vir | 1 | 7,9 | 370.4 | Mira | M | 0.060 | 1.277 | 0.019 | ||||||||||||
| X Vol | 1 | 5 | 288.0 | Mira | S | 0.278 | 1.497 | 0.369 | ||||||||||||
| R Vul | 0 | 1 | 136.8 | Mira | M | 0.248 | 1.462 | 0.336 | ||||||||||||
| RU Vul | 0 | 10 | 108.8 | SRV | M | 0.020 | 1.223 | 0.028 | ||||||||||||
| BD+044356 | 1 | 5 | 49.0 | SRV | S | 0.224 | 1.230 | 0.227 | ||||||||||||
| CSS 344 | 1 | 5 | 79.9 | SRV | S | 0.026 | 1.290 | 0.032 | ||||||||||||
| CSS 466 | 1 | 11 | 385.0 | Mira | S | 2.240 | ||||||||||||||
| CSS 739 | 1 | 11 | 336.0 | Mira | S | 1.310 | ||||||||||||||
| Hen 4-8 | 1 | 5 | 170.5 | SRV | S | 0.031 | 1.151 | 0.042 | ||||||||||||
| Hen 4-19 | 1 | 5 | 48.2 | SRV | S | 0.029 | 1.176 | 0.036 | ||||||||||||
| Hen 4-20 | 1 | 5 | 138.9 | SRV | S | 0.036 | 1.238 | 0.041 | ||||||||||||
| Hen 4-27 | 1 | 11 | 363.3 | Mira | S | 1.800 | ||||||||||||||
| Hen 4-33 | 1 | 11 | 405.0 | Mira | S | 1.520 | ||||||||||||||
| Hen 4-36 | 1 | 5 | 56.8 | SRV | S | 0.254 | 1.397 | 0.380 | ||||||||||||
| Hen 4-37 | 1 | 5 | 108.6 | SRV | S | 0.276 | 1.223 | 0.277 | ||||||||||||
| Hen 4-39 | 1 | 5 | 46.6 | SRV | S | 0.262 | 1.327 | 0.343 | ||||||||||||
| Hen 4-41 | 1 | 5 | 125.1 | SRV | S | 0.280 | 1.626 | 0.400 | ||||||||||||
| Hen 4-57 | 1 | 6 | 122.5 | SRV | S | 0.228 | 1.294 | 0.229 | ||||||||||||
| Hen 4-64 | 1 | 5 | 59.1 | SRV | S | 0.298 | 1.487 | 0.389 | ||||||||||||
| Hen 4-66 | 1 | 5 | 216.0 | SRV | S | 0.036 | 1.328 | 0.044 | ||||||||||||
| Hen 4-81 | 1 | 11 | 408.8 | Mira | S | 1.790 | ||||||||||||||
| Hen 4-84 | 1 | 11 | 408.9 | Mira | S | 1.860 | ||||||||||||||
| Hen 4-88 | 1 | 6 | 97.8 | SRV | S | 0.016 | 1.207 | 0.023 | ||||||||||||
| Hen 4-89 | 1 | 6 | 100.1 | SRV | S | 0.254 | 1.499 | 0.389 | ||||||||||||
| Hen 4-95 | 1 | 5 | 83.3 | SRV | S | 0.254 | 1.084 | 0.256 | ||||||||||||
| Hen 4-104 | 1 | 5 | 40.3 | SRV | S | 0.036 | 1.252 | 0.041 | ||||||||||||
| Hen 4-109 | 1 | 11 | 281.1 | Mira | S | 1.370 | ||||||||||||||
| Hen 4-122 | 1 | 11 | 307.0 | Mira | S | 1.620 | ||||||||||||||
| Hen 4-162 | 1 | 6 | 65.4 | SRV | M | 0.256 | 1.410 | 0.382 | ||||||||||||
| Hen 4-177 | 1 | 6 | 67.9 | SRV | M | 0.280 | 1.532 | 0.383 | ||||||||||||
| Plaut 3-45 | 0 | 8 | 271.0 | Mira | M | 0.332 | 1.450 | 0.081 | ||||||||||||
| Plaut 3-70 | 0 | 8 | 166.5 | SRV | M | 0.177 | 1.290 | 0.052 | ||||||||||||
| Plaut 3-100 | 0 | 8 | 298.7 | Mira | M | 0.171 | 1.290 | 0.019 | ||||||||||||
| Plaut 3-143 | 0 | 8 | 204.2 | Mira | M | 0.109 | 1.250 | 0.025 | ||||||||||||
| Plaut 3-195 | 0 | 8 | 216.6 | Mira | M | 0.063 | 1.210 | 0.065 | ||||||||||||
| Plaut 3-277 | 0 | 8 | 263.2 | Mira | M | 0.276 | 1.320 | 0.029 | ||||||||||||
| Plaut 3-315 | 0 | 8 | 326.8 | Mira | M | 0.049 | 1.370 | 0.029 | ||||||||||||
| Plaut 3-328 | 0 | 8 | 166.8 | SRV | M | 0.006 | 1.200 | 0.003 | ||||||||||||
| Plaut 3-331 | 0 | 8 | 311.1 | Mira | M | 0.135 | 1.460 | 0.074 | ||||||||||||
| Plaut 3-626 | 1 | 8 | 311.1 | Mira | MS | 0.127 | 1.260 | 0.050 | ||||||||||||
| Plaut 3-639 | 0 | 8 | 167.3 | SRV | M | 0.087 | 1.260 | 0.027 | ||||||||||||
| Plaut 3-719 | 0 | 8 | 277.8 | SRV | M | 0.198 | 1.300 | 0.026 | ||||||||||||
| Plaut 3-794 | 0 | 8 | 303.5 | Mira | M | 0.150 | 1.350 | 0.072 | ||||||||||||
| Plaut 3-942 | 1 | 8 | 338.0 | Mira | MS | 0.102 | 1.340 | 0.005 | ||||||||||||
| Plaut 3-1002 | 0 | 8 | 190.5 | SRV | M | 0.111 | 1.220 | 0.049 | ||||||||||||
| Plaut 3-1008 | 0 | 8 | 232.1 | SRV | M | 0.066 | 1.250 | 0.018 | ||||||||||||
| Plaut 3-1059 | 0 | 8 | 144.1 | SRV | M | 0.037 | 1.230 | 0.044 | ||||||||||||
| Plaut 3-1147 | 1 | 8 | 395.6 | Mira | M | 0.042 | 1.500 | 0.064 | ||||||||||||
| Plaut 3-1176 | 0 | 8 | 184.1 | SRV | M | 0.072 | 1.330 | 0.028 | ||||||||||||
| Plaut 3-1179 | 0 | 8 | 278.2 | Mira | M | 0.104 | 1.360 | 0.033 | ||||||||||||
| Plaut 3-1204 | 0 | 8 | 197.0 | SRV | M | 0.034 | 1.330 | 0.010 | ||||||||||||
| Plaut 3-1287 | 0 | 8 | 312.5 | Mira | M | 0.275 | 1.310 | 0.031 | ||||||||||||
| Plaut 3-1313 | 0 | 8 | 378.7 | Mira | M | 0.021 | 1.470 | 0.036 | ||||||||||||
| Plaut 3-1347 | 1 | 8 | 408.9 | Mira | MS | 0.111 | 1.480 | 0.078 | ||||||||||||
| Plaut 3-1470 | 0 | 8 | 183.2 | SRV | M | 0.022 | 1.210 | 0.011 | ||||||||||||
| Plaut 3-1517 | 0 | 8 | 188.8 | SRV | M | 0.087 | 1.260 | 0.028 | ||||||||||||
| Plaut 3-1991 | 0 | 8 | 124.7 | SRV | M | 0.220 | 1.150 | 0.048 |
2]
| Name | Tc | SpType | [22] | Ref. | |||
|---|---|---|---|---|---|---|---|
| days | mag | mag | |||||
| KU And | 712.0 | M | 9.4 | 17 | |||
| LP And | 599.3 | C | 1.5 | 15 | |||
| R And | 1 | 409.9 | S | 2.8 | 17 | ||
| W And | 1 | 396.3 | M | 2.8 | 17 | ||
| R Aql | 0 | 270.6 | M | 1.1 | 6 | ||
| RR Aql | 0 | 399.8 | M | 2.4 | 17 | ||
| RT Aql | 0 | 327.8 | M | 1.0 | 6 | ||
| V1300 Aql | 680.0 | M | 1.0 | 17 | |||
| V1420 Aql | 694.0 | C | 6.9 | 8 | |||
| VX Aql | 618.6 | S | 1.0 | 13 | |||
| W Aql | 1 | 487.8 | S | 2.2 | 15 | ||
| R Aqr | 1 | 388.2 | M | 2.0 | 18 | ||
| RV Aqr | 452.6 | C | 2.3 | 17 | |||
| T Ari | 339.0 | M | 6.0 | 6 | |||
| U Ari | 372.0 | M | 6.5 | 6 | |||
| NV Aur | 635.0 | M | 2.5 | 17 | |||
| R Aur | 457.4 | M | 1.6 | 6 | |||
| U Aur | 408.9 | M | 6.3 | 6 | |||
| V370 Aur | 683.0 | C | 1.7 | 3 | |||
| V373 Aur | 590.0 | M | 1.6 | 3 | |||
| V Aur | 353.1 | C | 4.7 | 8 | |||
| BX Cam | 454.0 | M | 4.4 | 17 | |||
| T Cam | 1 | 373.9 | S | 1.0 | 13 | ||
| TX Cam | 557.4 | M | 1.0 | 15 | |||
| R Cap | 345.7 | C | 2.8 | 8 | |||
| RU Cap | 349.6 | M | 3.8 | 8 | |||
| HV Cas | 467.9 | C | 9.0 | 9 | |||
| R Cas | 430.5 | M | 4.0 | 14 | |||
| S Cas | 613.5 | S | 2.8 | 17 | |||
| T Cas | 444.7 | M | 1.1 | 6 | |||
| V701 Cas | 567.0 | C | 4.5 | 17 | |||
| WY Cas | 480.6 | S | 1.1 | 15 | |||
| AQ Cen | 377.7 | M | 3.2 | 8 | |||
| TT Cen | 464.0 | S | 2.5 | 15 | |||
| AX Cep | 398.4 | C | 1.2 | 8 | |||
| S Cep | 486.0 | C | 1.5 | 10 | |||
| T Cep | 1 | 386.6 | M | 9.1 | 17 | ||
| Cet | 1 | 332.7 | M | 2.5 | 14 | ||
| R Cet | 0 | 165.9 | M | 1.9 | 8 | ||
| S CMi | 334.0 | M | 4.9 | 17 | |||
| R Cnc | 0 | 362.0 | M | 2.3 | 6 | ||
| W Cnc | 393.6 | M | 3.1 | 6 | |||
| S CrB | 360.6 | M | 2.3 | 17 | |||
| V CrB | 1 | 358.0 | C | 3.3 | 17 | ||
| BG Cyg | 288.4 | M | 7.4 | 8 | |||
| Cyg | 1 | 408.2 | S | 3.8 | 15 | ||
| R Cyg | 1 | 426.6 | S | 9.5 | 17 | ||
| U Cyg | 1 | 464.8 | C | 9.0 | 9 | ||
| V Cyg | 420.9 | C | 1.6 | 16 | |||
| V1426 Cyg | 470.0 | C | 1.0 | 9 | |||
| V1549 Cyg | 510.0 | C | 5.1 | 8 | |||
| V1906 Cyg | 600.0 | M | 8.2 | 1 | |||
| V1965 Cyg | 577.0 | C | 1.0 | 12 | |||
| V1968 Cyg | 783.0 | C | 7.5 | 17 | |||
| Z Cyg | 263.7 | M | 4.0 | 6 | |||
| U Dor | 394.4 | M | 5.9 | 8 | |||
| T Dra | 1 | 422.7 | C | 1.3 | 1 | ||
| RT Eri | 373.0 | M | 3.3 | 8 | |||
| W Eri | 0 | 373.6 | M | 1.8 | 8 | ||
| R For | 388.1 | C | 1.6 | 15 | |||
| UU For | 471.4 | M | 1.1 | 5 | |||
| R Gem | 1 | 370.1 | S | 4.3 | 17 | ||
| ZZ Gem | 1 | 315.6 | C | 9.1 | 8 | ||
| CK Gru | 580.0 | M | 1.6 | 5 | |||
| RU Her | 1 | 485.6 | M | 7.5 | 6 | ||
| U Her | 406.8 | M | 5.9 | 6 | |||
| V821 Her | 524.0 | C | 3.0 | 17 | |||
| V833 Her | 540.0 | C | 2.3 | 1 | |||
| V1076 Her | 609.0 | C | 1.7 | 1 | |||
| WY Her | 376.7 | M | 1.1 | 8 | |||
| R Hor | 1 | 404.6 | MS | 5.9 | 17 | ||
| CZ Hya | 1 | 432.0 | C | 9.0 | 9 | ||
| IY Hya | 409.0 | C | 4.1 | 1 | |||
| R Hya | 1 | 376.6 | M | 2.1 | 15 | ||
| RU Hya | 0 | 333.2 | M | 1.3 | 8 | ||
| W Hya | 0 | 388.6 | M | 1.1 | 15 | ||
| X Hya | 300.8 | M | 3.0 | 6 | |||
| R Leo | 305.0 | M | 1.1 | 17 | |||
| R Lep | 435.4 | C | 8.7 | 17 | |||
| RT Lep | 393.0 | M | 4.4 | 8 | |||
| T Lep | 369.1 | M | 7.3 | 8 | |||
| RS Lib | 218.1 | M | 3.7 | 6 | |||
| R LMi | 373.2 | M | 2.6 | 17 | |||
| GI Lup | 465.8 | S | 5.5 | 13 | |||
| II Lup | 576.0 | C | 1.7 | 17 | |||
| V358 Lup | 632.0 | C | 1.0 | 12 | |||
| Y Lup | 401.6 | M | 1.5 | 8 | |||
| AP Lyn | 730.0 | M | 6.5 | 15 | |||
| R Lyn | 378.8 | S | 3.3 | 15 | |||
| S Lyr | 438.3 | S | 2.0 | 15 | |||
| BQ Mic | 560.4 | M | 2.4 | 5 | |||
| CL Mon | 1 | 483.0 | C | 2.5 | 4 | ||
| GX Mon | 527.0 | M | 8.4 | 17 | |||
| V688 Mon | 653.0 | C | 6.1 | 17 | |||
| RZ Mus | 333.3 | M | 1.4 | 8 | |||
| V2548 Oph | 747.0 | C | 2.9 | 3 | |||
| V Oph | 1 | 297.3 | C | 5.0 | 8 | ||
| X Oph | 333.9 | M | 2.5 | 11 | |||
| R Ori | 379.8 | C | 3.1 | 8 | |||
| S Ori | 1 | 433.4 | M | 2.1 | 6 | ||
| U Ori | 371.1 | M | 2.8 | 6 | |||
| V1259 Ori | 696.0 | C | 8.8 | 17 | |||
| V351 Pav | 462.0 | M | 2.5 | 5 | |||
| IZ Peg | 486.0 | C | 2.1 | 2 | |||
| LL Peg | 696.0 | C | 1.1 | 15 | |||
| R Peg | 377.8 | M | 4.1 | 11 | |||
| RZ Peg | 1 | 436.9 | C | 4.6 | 15 | ||
| TU Peg | 323.2 | M | 8.4 | 8 | |||
| W Peg | 0 | 343.9 | M | 9.8 | 6 | ||
| V384 Per | 535.0 | C | 2.3 | 17 | |||
| Y Per | 250.8 | C | 1.0 | 8 | |||
| S Pic | 424.7 | M | 5.9 | 6 | |||
| W Pic | 326.0 | C | 2.3 | 15 | |||
| AW Psc | 730.0 | M | 4.6 | 5 | |||
| WX Psc | 650.0 | M | 4.0 | 15 | |||
| R Pyx | 367.4 | C | 2.1 | 8 | |||
| RR Sco | 0 | 278.9 | M | 1.1 | 8 | ||
| RS Sco | 319.6 | M | 2.2 | 6 | |||
| RT Sco | 449.2 | S | 4.5 | 15 | |||
| RW Sco | 389.6 | M | 2.1 | 8 | |||
| R Ser | 1 | 353.6 | M | 4.5 | 6 | ||
| RR Sgr | 334.3 | M | 5.4 | 8 | |||
| RZ Sgr | 207.0 | S | 3.0 | 15 | |||
| ST Sgr | 394.2 | S | 2.0 | 15 | |||
| T Sgr | 1 | 392.8 | S | 1.4 | 13 | ||
| V342 Sgr | 372.0 | M | 1.9 | 8 | |||
| V2234 Sgr | 450.4 | M | 1.8 | 5 | |||
| V5104 Sgr | 655.0 | C | 9.3 | 3 | |||
| IK Tau | 450.0 | M | 2.0 | 16 | |||
| R Tau | 323.1 | M | 3.1 | 8 | |||
| RU Vir | 1 | 437.3 | C | 9.5 | 1 | ||
| RS Vir | 0 | 352.0 | M | 1.9 | 8 | ||
| S Vir | 1 | 370.4 | M | 8.4 | 7 | ||
| AI Vol | 511.0 | C | 4.9 | 17 | |||
| R Vol | 452.0 | C | 1.7 | 15 |